Introduction
In previous years, novel strategies of management
for malignant cells in an integrated therapeutic manner, including
surgery and radiotherapy (1,2), immune therapy (3,4) and
chemotherapy (5,6), have been investigated. Concurrently,
increasing rates of chemoresistance in cancer cells against classic
chemotherapy agents, including cisplatin (7), cyclophosphamide (8) and hydroxyurea (9), have been observed. Consequently, the
cytotoxicity exhibited by ginkgolic acids (GAs) against malignant
cells suggests that they have the potential to become a novel
antitumor drug (10,11).
Gas are natural components of the leaves, nuts and
episperm of the Ginkgo biloba plant, and are identified in
small concentrations in G. biloba cells (12). Natural GAs extracted from G.
biloba are derivatives of 6-alkyl or 6-alkyl salicylic acid;
the number of side chain carbon atoms in the 6th position may range
from 13 to 19, and the number of side chain double bonds may be
between 0 and 3. Therefore, the group is a mixture of homologues.
Gas have been previously demonstrated to exhibit various
toxicities, including allergenic (13), cytotoxic (14) and immunotoxic (13) effects. In previous decades, it has
also been identified that the Gas exert antibacterial (15), insecticidal (16) and antitumor (17) effects, although the mechanism of their
antitumor activity remains unclear.
Autophagy is a conserved process in cells; it
supplies basic energy, and amino acids, lipids and glucose
molecules for cell survival under stressful conditions including
hypoxia and starvation, via the recycling of cellular components
(18). Previous studies have
demonstrated that autophagy can also induce apoptosis in cells
(19,20), yet whether autophagy is a cytotoxic
(19,20) or cytoprotective (21) process remains unclear (22). However, a previous study indicated
that autophagy is involved in the cell death process, concomitant
with other well-known cell death pathways, including apoptosis and
mitochondrial dysfunction (19,20). A
number of classical chemotherapy agents, including cisplatin
(23), cyclophosphamide (24) and hydroxyurea (25), induce mitochondrial dysfunction and
autophagy. The present study examined a potential autophagy-based
anticancer strategy. GAs as novel anti-cancer agents have been
indicated to induce cell apoptosis (26,27), yet
whether Gas induce autophagy in cells remains unclear. The present
study aimed to identify whether GA-induced autophagy and
mitochondrial dysfunction could also contribute to the death of
cancer cells, and whether there was a cross-talk with
apoptosis.
Materials and methods
Materials
The human hepatoblastoma HepG2 cell line (28) was purchased from the Cell Bank of Type
Culture Collection of Chinese Academy of Sciences (Shanghai,
China). MTT and dimethyl sulfoxide (DMSO) were purchased from
Amresco LLC (Solon, OH, USA). 3-methyladenine (3-MA) was obtained
from Sigma-Aldrich (Merck KGaA, Darmstadt, Germany). The small
interfering RNA (siRNA) targeting the human Beclin-1 gene was
purchased from Shanghai GenePharma Co., Ltd. (Shanghai, China).
Lipofectamine® 2000 was obtained from Invitrogen (Thermo
Fisher Scientific, Inc., Waltham, MA, USA). The rabbit polyclonal
anti-caspase-3 (cat. no. PB0183), anti-B-cell lymphoma 2 (Bcl-2;
cat. no. A00040-2), anti-Bcl-2-associated X protein (Bax; cat. no.
A00183) and anti-Beclin-1 antibodies (cat. no. PB0014) were
purchased from Wuhan Boster Biological Technology, Ltd. (Wuhan,
China). The rabbit monoclonal anti-microtubule-associated protein
1A/1B-light chain 3 (LC3; cat. no. 2057-1) antibody was obtained
from Epitomics, Abcam (Cambridge, MA, USA), horseradish peroxidase
(HRP)-conjugated goat anti-rabbit antibody (cat. no. CW0234S) was
purchased from CWBio (http://www.cwbiotech.com/; Shanghai, China). The
HRP-conjugated mouse β-actin antibody (cat. no. sc-4778) was
purchased from Santa Cruz Biotechnology, Inc. (Dallas, TX, USA).
The polyvinylidene difluoride (PVDF) membrane was purchased from
EMD Millipore (Billerica, MA, USA). Dulbecco's modified Eagle's
medium (DMEM), trypsin, and EDTA-disodium salt 2 and fetal bovine
serum (FBS) were purchased from Gibco; Thermo Fisher Scientific,
Inc. A Mitochondrial Transmembrane Potential (Δψm)
Analysis kit (cat. no. KGA602) was purchased from Nanjing KeyGen
Biotech Co., Ltd. (Nanjing, China). All other supplies for cell
culture were purchased from Corning Costar (Corning Incorporated,
Corning, NY, USA).
The Gas was provided by Dr Xiaoming Yang from the
School of Chemistry of Jiangsu University (Zhenjiang, China), with
the purity >98% as monitored by a high-performance liquid
chromatography. The parameters of HPLC were as following, the Gas
were detected by ProStar 240 (Varian Medical Systems, Inc., Palo
Alto, CA, USA.) with ODS-2 (4.6*250 mm, 5 µm; Dalian Elite
Analytical Instruments Co., Ltd., Dalian, China) at 40°C. The
sample quantity was 10 µl, and the composition of mobile phase was
methanol-3% HAc (92:8 v/v), the flow rate was 1.0 ml/min, and the
detection was by 325 type UV-detector (Varian Medical Systems,
Inc.) and UV-2450 ultraviolet-visible spectrophotometer (Shimadzu
Corporation, Kyoto, Japan.). Reference materials, Gas>99%, were
supplied by from Dr Jaggy H of Dr Willmar Schwabe GmbH & Co.
KG, Karlsruhe Germany.
Cell culture
HepG2 cells were cultured in DMEM with 10% (v/v)
FBS, 100 U/ml penicillin and 100 U/ml streptomycin at 37°C with 5%
CO2 and 100% humidity. When the cells reached 50–70%
confluence, Gas was administered to the cells.
GA administration and MTT
analysis
When the HepG2 cells were in the exponential growth
phase at 50–70% confluence, the cells were harvested and then
suspended in DMEM with 5% FBS at a certain concentration
(1×10⁴). The prepared cells were cultured in 96-well
plates for 24 h with 10% FBS at 37°C and 5% CO2. The
next day, cells were incubated with various concentrations of GAs:
0, 1.0625, 2.125, 4.25, 8.5, 17 and 34 µg/ml. Next, the cells were
cultured for an additional 48 h at 37°C. Following this, 20 µl MTT
(5 mg/µl) was administered to each well, and incubated for an
additional 4 h at 37°C. Subsequently, 150 µl DMSO was added into
each well and the cells were shaken for 10 min. Finally, the
absorbance was measured in triplicate using a standard
spectrophotometer at 490 nm. The dose-depended curve for cell
inhibition was calculated based on the data obtained.
Simultaneously, the cells in 10 random fields of view were observed
by a light microscope (magnification, ×100), and the half-maximal
inhibitory concentration (IC50) of the Gas in the HepG2
cells was calculated with the formula:
IC50=lg-1[Xm-i(ΣP-0.5)], where Xm represents the log of
the max concentration of the experiment, i represents the log of
each concentration measured in the experiment, ΣP denotes the sum
of the rate of inhibition of each group and 0.5 is the empirical
constant.
3-MA administration
When the HepG2 cells (~1×10⁴) were at
50–70% confluence in 6-well plates, the cells were treated with 2.5
mM 3-MA. The next day, the Gas were added to the 3-MA-treated or
negative control cells at a concentration of 20 µg/ml for an
additional 24 h. Next, the cells were harvested and analyzed by
western blot analysis.
siRNA administration
When HepG2 cells in 6-well plates were at 50–70%
confluence, the cells were treated with 50 nM Beclin-1-specific
siRNA (Shanghai GenePharma Co., Ltd.) using Lipofectamine 2000,
according to manufacturer's protocol. The sequences were as
follows: Pair 1: Forward, 5′-GGAGCCAUUUAUUGAAACUTT-3′ and reverse,
5′-AGUUUCAAUAAAUGGCUCCTT-3′; Pair 2: Forward,
5′-GUGGAAUGGAAUGAGAUUATT-3′ and reverse,
5′-UAAUCUCAUUCCAUUCCACTT-3′; Pair 3: Forward,
5′-GCUGCCGUUAUACUGUUCUTT-3′ and reverse,
5′-AGAACAGUAUAACGGCAGCTT-3′. After 24 h, Gas were administrated to
the siRNA-treated or negative control cells at a concentration of
20 µg/ml for an additional 24 h. Following this, the cells were
harvested and analyzed by western blot analysis as described
subsequently.
Western blot analysis
HepG2 cells (~1×10⁴) with or without Gas
treatment were lysed in radioimmunoprecipitation assay lysis buffer
(Beijing Solarbio Science and Technology Co., Ltd.), with a
protease inhibitor cocktail, [1% Trypsin inhibitor (Beijing
Solarbio Science and Technology Co., Ltd., Beijing, China; cat. no.
A8260), 1% phosphatase inhibitor (Beijing Solarbio Science and
Technology Co., Ltd.; cat. no. P1260), and 1% PMSF (Beijing
Solarbio Science and Technology Co., Ltd.; cat. no. P8340)],
according to the protocol of the manufacturer. The protein
concentration was detected by a BCA kit (Thermo Fisher Scientific,
Inc.). Equivalent amounts of protein (100 µg) from every sample
were separated by 10% SDS-PAGE, then separated by electrophoresis,
and then transferred to a PVDF membrane. Next, the membrane was
blocked with 5% bovine serum albumin in TBS (Gibco; Thermo Fisher
Scientific, Inc.) for 2 h at 37°C. The membrane was incubated at
37°C for 2 h with primary antibodies (dilutions, 1:200) against the
specific proteins, and then incubated with HRP-conjugated secondary
antibodies (dilutions, 1:5,000) at 37°C for 2 h. The membranes were
then washed 3 times for 10 min each. Then, the protein bands were
scanned using a Typhoon 9400 Variable Mode Imager (Amersham; GE
Healthcare, Chicago, IL, USA) and detected using Pierce
Electrochemiluminescence Plus Substrate (Thermo Fisher Scientific,
Inc.). The software used for densitometric analysis was Lane 1D
(version 4.0.00.001; Beijing Sage Creation Science Co., Ltd).
Δψm analysis
The Δψm of HepG2 cells was detected using
JC-1 dye. HepG2 cells (~1×10⁴) were incubated in 24-well
plates, and treated with Gas at a concentration of 20 µg/ml for 24
h. Next, following the JC-1 manufacturer's protocol (2.5 µg/ml at
37°C for 30 min; Nanjing KeyGen Biotech Co., Ltd.), the cells were
stained. The cells were monitored by fluorescence microscopy
(magnification, ×200).
Terminal
deoxynucleotidyl-transferase-mediated dUTP nick-end labeling
(TUNEL) assay
The HepG2 cells (~1×10⁴) were treated
with Gas at a concentration of 20 µg/ml in the logarithmic growth
phase for 24 h, and then fixed with 4% paraformaldehyde at 37°C for
24 h. Next, following to the protocol of the manufacturer of the
TUNEL kit (cat. no. KGA702; Nanjing KeyGen Biotech Co., Ltd.),
these cells were stained and monitored by a microscope. The
mounting medium used was glycerol, and the cells in 10 random
fields of view were observed with a light microscope
(magnification, ×200).
Statistical analysis
Data are presented as the mean ± standard deviation.
Data analyses were performed using one-way analysis of variance
with Student Newman-Keuls post-hoc test (>3 groups) or Student's
t-test (two groups) in SPSS v.23 software (IBM Corp., Armonk, NY,
USA). P<0.05 was considered to indicate a statistically
significant difference. All experiments were repeated at least 3
times.
Results
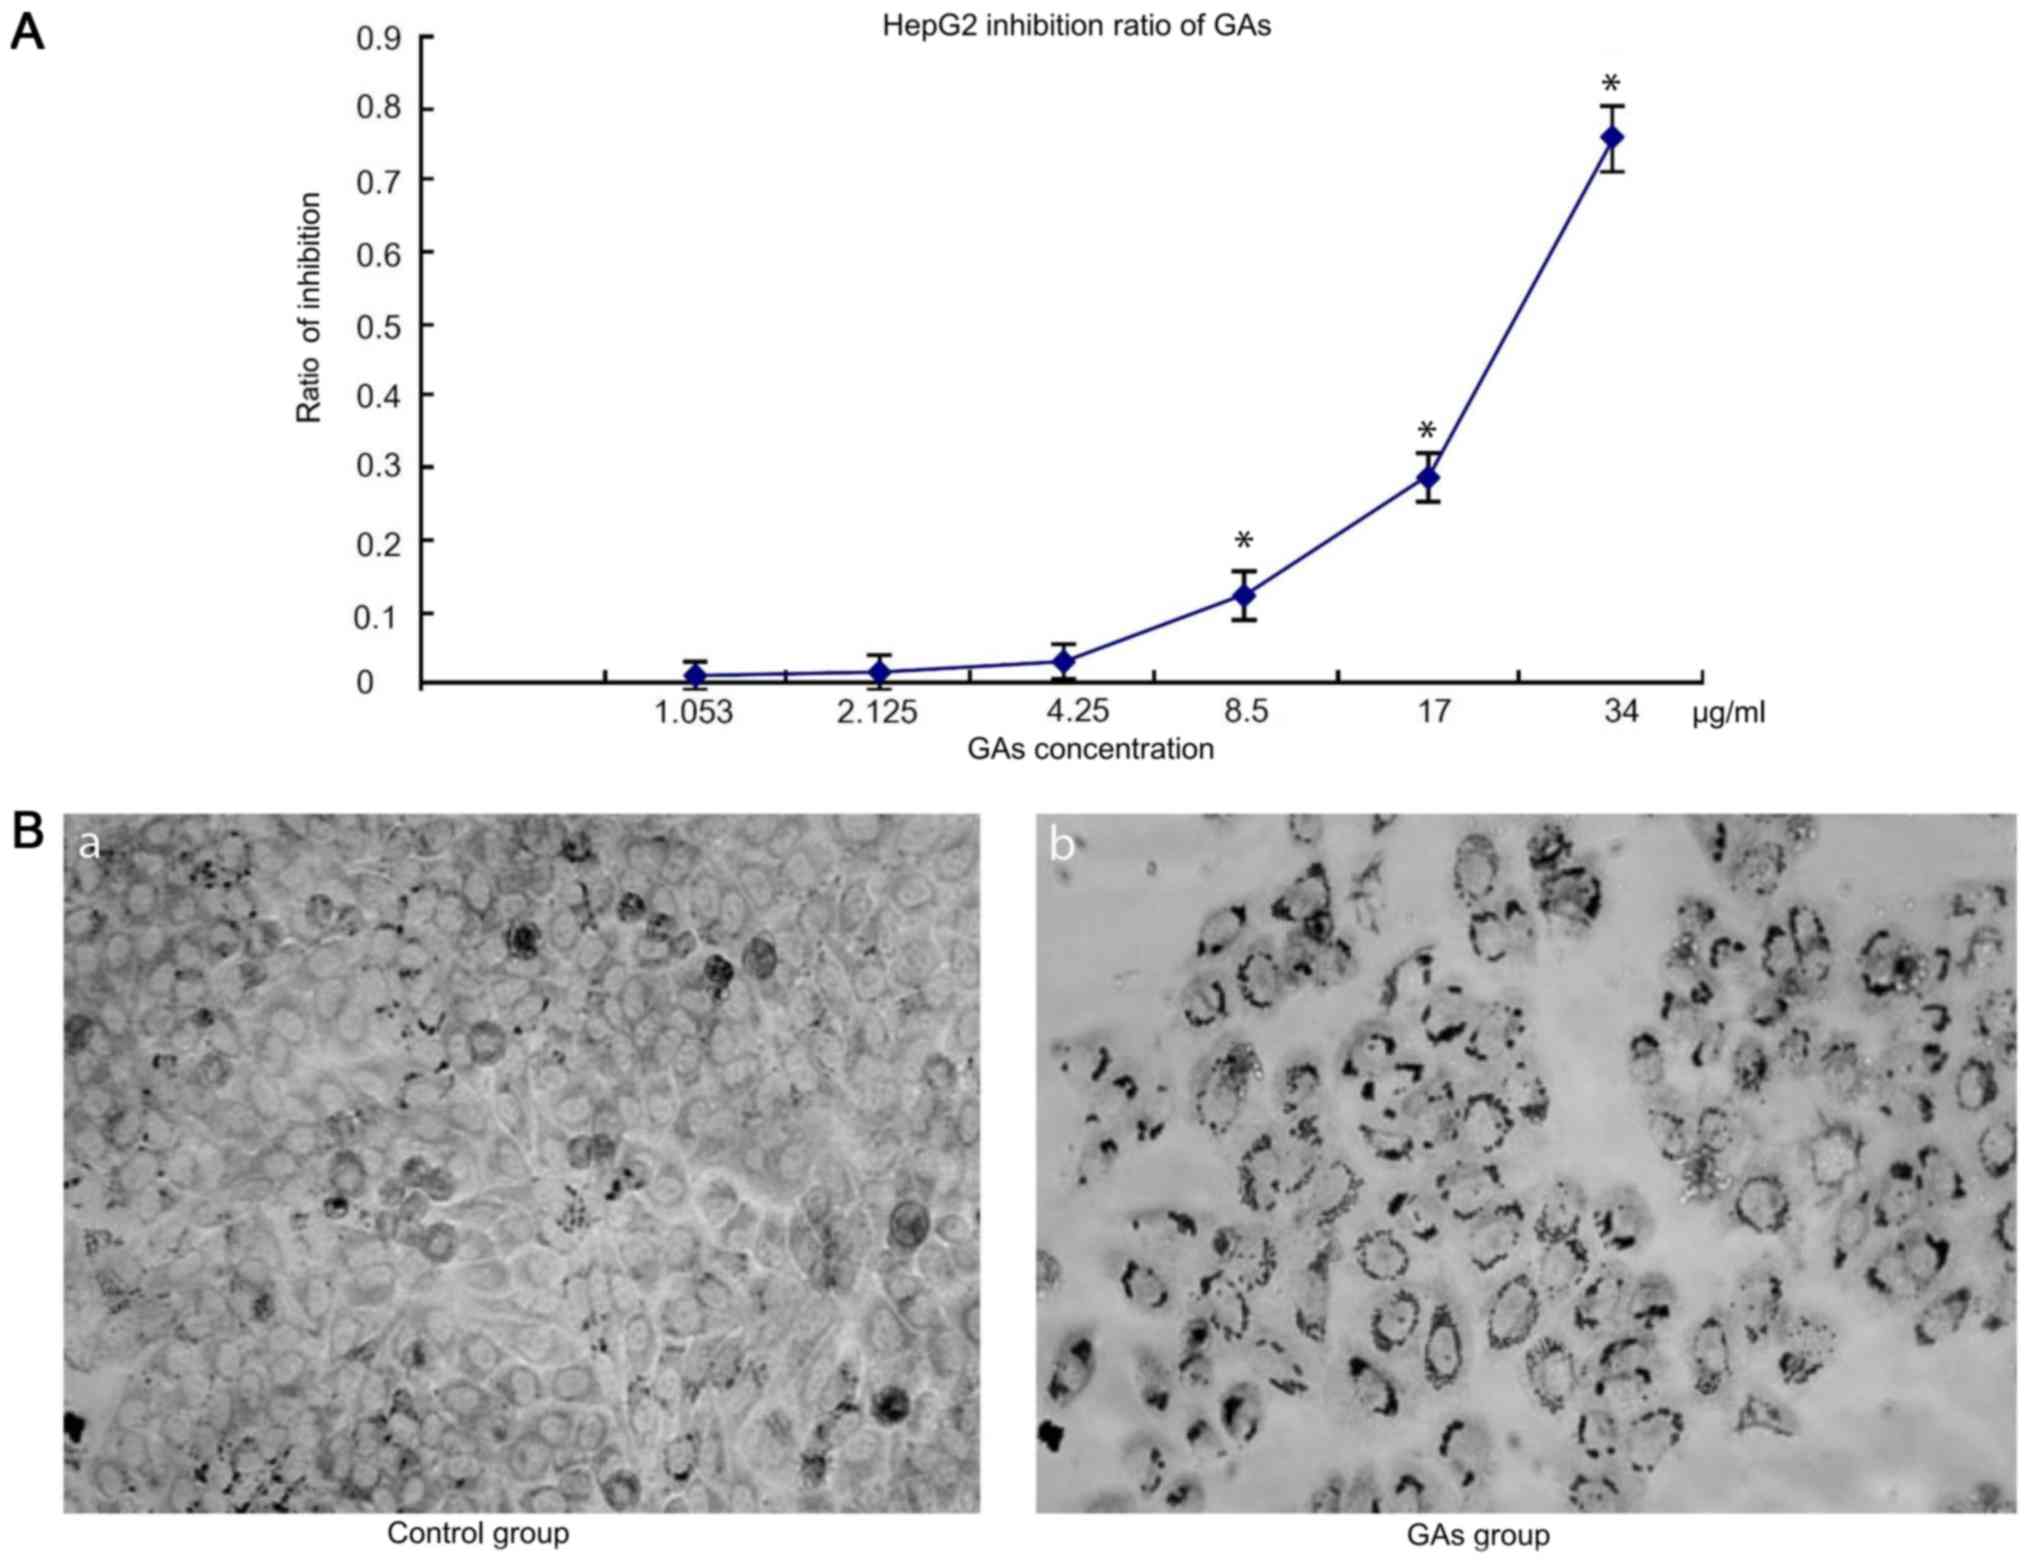
GAs inhibit cells proliferation
The dose-dependent curves for GAs in HepG2 cells
were measured by MTT assay following 24 h Gas treatment. HepG2 cell
viability decreased with the increases in GAs concentration and
incubation time. When the cells were treated with GAs, the optical
density (OD), increased in the GAs treatment groups as the GAs
concentration decreased, and at the 4.25 µg/ml, the dose-depended
curve reached the threshold (4.25 µg/ml) compared with the control
group. Next, the inhibition ratio of the GAs increased
significantly (P<0.05, Table I).
Simultaneously, the inhibition rate also increased over time
following Gas treatment. Therefore, the inhibition rate caused by
GAs was time- and dose-dependent. The OD values of the HepG2 cells
treated with GAsfor 24 hare depicted in Fig. 1A. Using the formula
IC50=lg-1[Xm-i(ΣP-0.5)], where Xm denotes the log of the
max concentration of the experiment, i represents the log of each
concentration measured in the experiment, ΣP represents the sum of
the rate of inhibition of each group and the 0.5 is an empirical
constant, the IC50 of Gas was calculated to be 25 µg/ml.
Additionally, the morphological changes in the treatment cells were
monitored by microscopy. As depicted in Fig. 1B, an increased number of cells in the
GAs treatment group exhibited an increased rate greater number of
characteristic vacuolation compared with the control group.
 | Table I.The P-value of every two groups for
Fig. 1A. |
Table I.
The P-value of every two groups for
Fig. 1A.
|
| 1.053 | 2.125 | 4.25 | 8.5 | 17 | 34 |
|---|
| 1.053 | – | – | – | P<0.05 | P<0.05 | P<0.05 |
| 2.125 | – | – | – | P<0.05 | P<0.05 | P<0.05 |
| 4.25 | – | – | – | P<0.05 | P<0.05 | P<0.05 |
| 8.5 | P<0.05 | P<0.05 | P<0.05 | – | P<0.05 | P<0.05 |
| 17 | P<0.05 | P<0.05 | P<0.05 | P<0.05 | – | P<0.05 |
| 34 | P<0.05 | P<0.05 | P<0.05 | P<0.05 | P<0.05 | – |
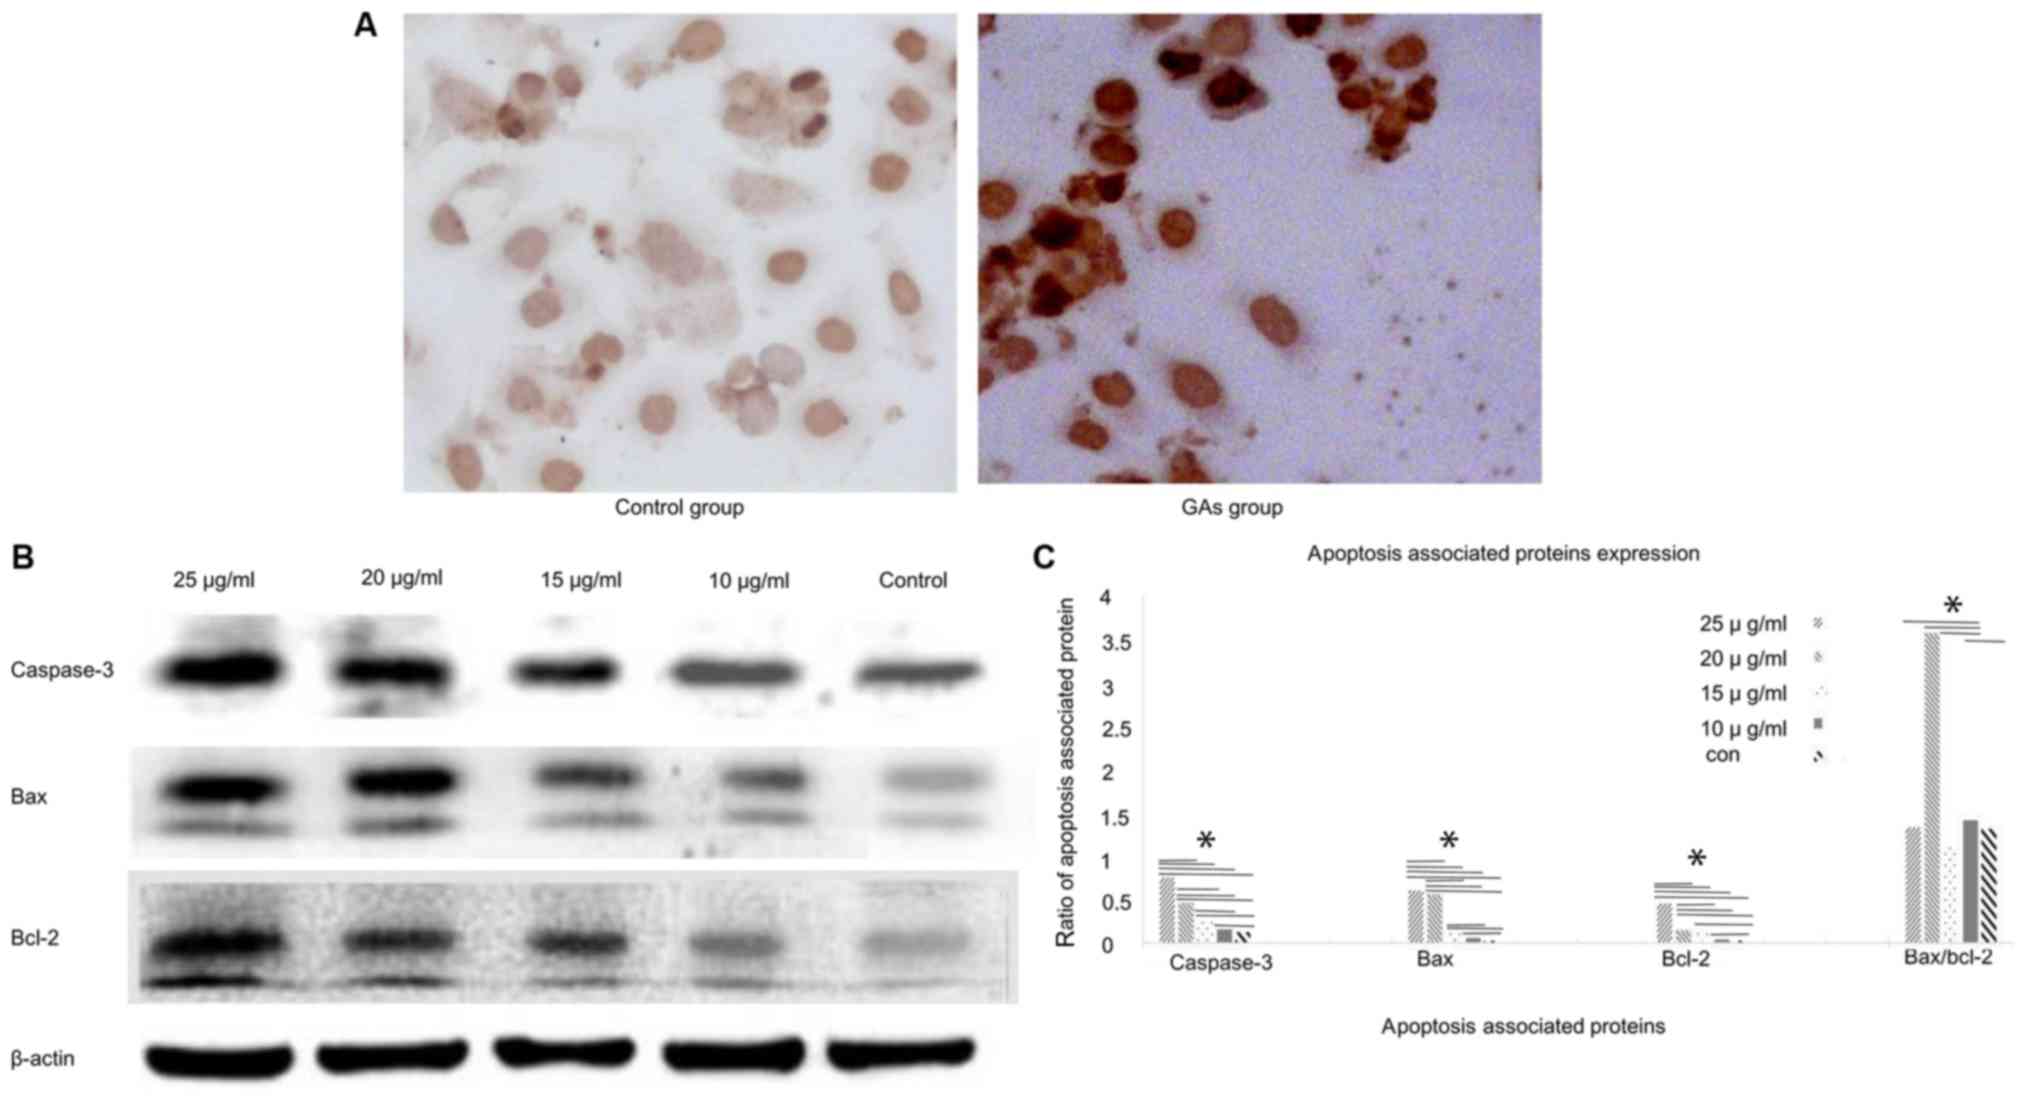
GAs induce apoptosis in HepG2
cells
The TUNEL assay was used to monitor the apoptosis in
HepG2 cells (Fig. 2A). The level of
apoptosis in the GA groups was markedly increased compared with the
control group (P<0.05). Apoptosis of the HepG2 cells was also
monitored by western blotting analysis. The expression levels of
the apoptosis-associated proteins caspase-3, Bcl-2 and Bax in the
HepG2 cells were detected at 24 h after GA treatment. The
expression levels of caspase-3, Bax and Bcl-2 were increased in the
GA-treated groups compared with the control group (P<0.05);
whereas the Bax/Bcl-2 ratio exhibited a peak when the concentration
of GAs was 20 µg/ml (Fig. 2B and C).
And the number of apoptotic cells in the GAs groups was increased,
compared with that in the control group (P<0.05), as
demonstrated in Fig. 2C
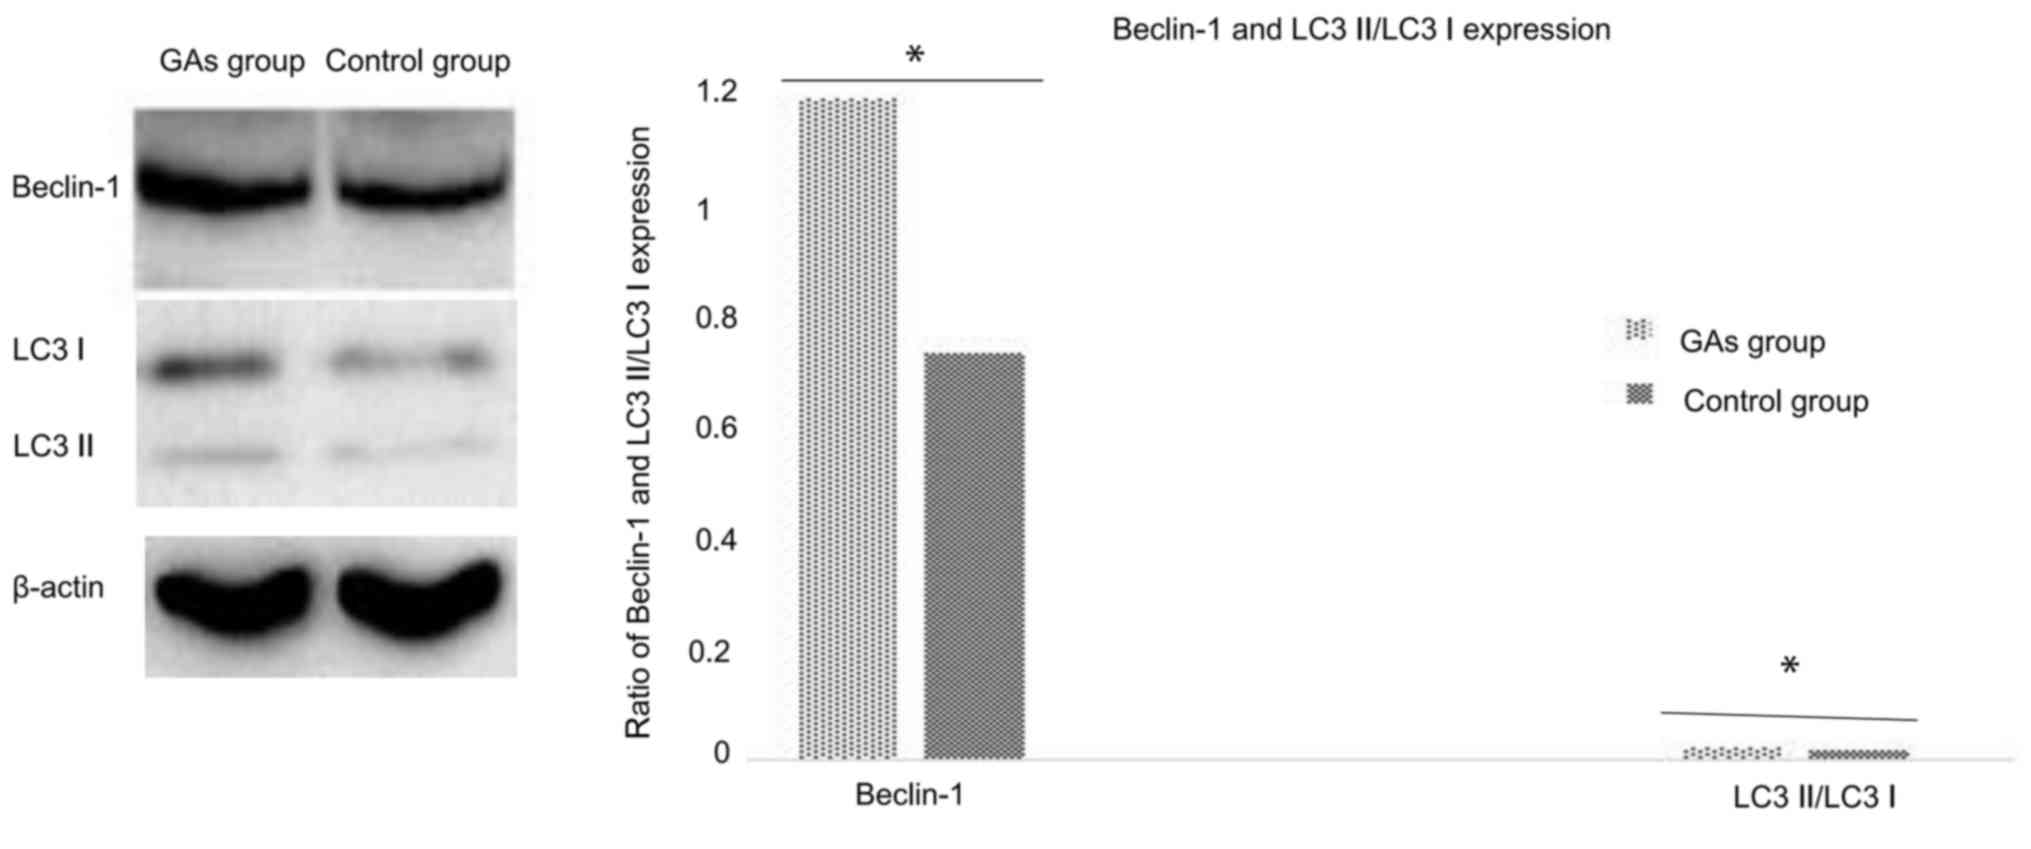
GAs induce HepG2 cell autophagy
As the GA-treated HepG2 cells exhibited
morphological changes such as vacuolization, it may be that
autophagy is involved in this process. The autophagy activity of
cells with or without administration of Gas was detected. The ratio
of LC3-II/LC3-I is a good indicator of autophagy activity (29), and in the preliminary experiments of
the present study, it was identified that it took ~24 h for
significant evidence of vacuolization following treatment of the
HepG2 cells with 20 µg/ml GAs (data not shown). Therefore, 12 h was
the time-point used for the routine measurement of autophagy. In
addition to monitoring the ratio of LC3-II to LC3-I in the cells at
12 h following GAs administration, the Beclin-1 protein level was
also analyzed as an additional autophagy marker. As depicted in
Fig. 3, the expression of the
autophagy-associated proteins Beclin-1 and LC3 in the HepG2 cells
of the GA-treated group was significantly higher than in the
control groups (P<0.05).
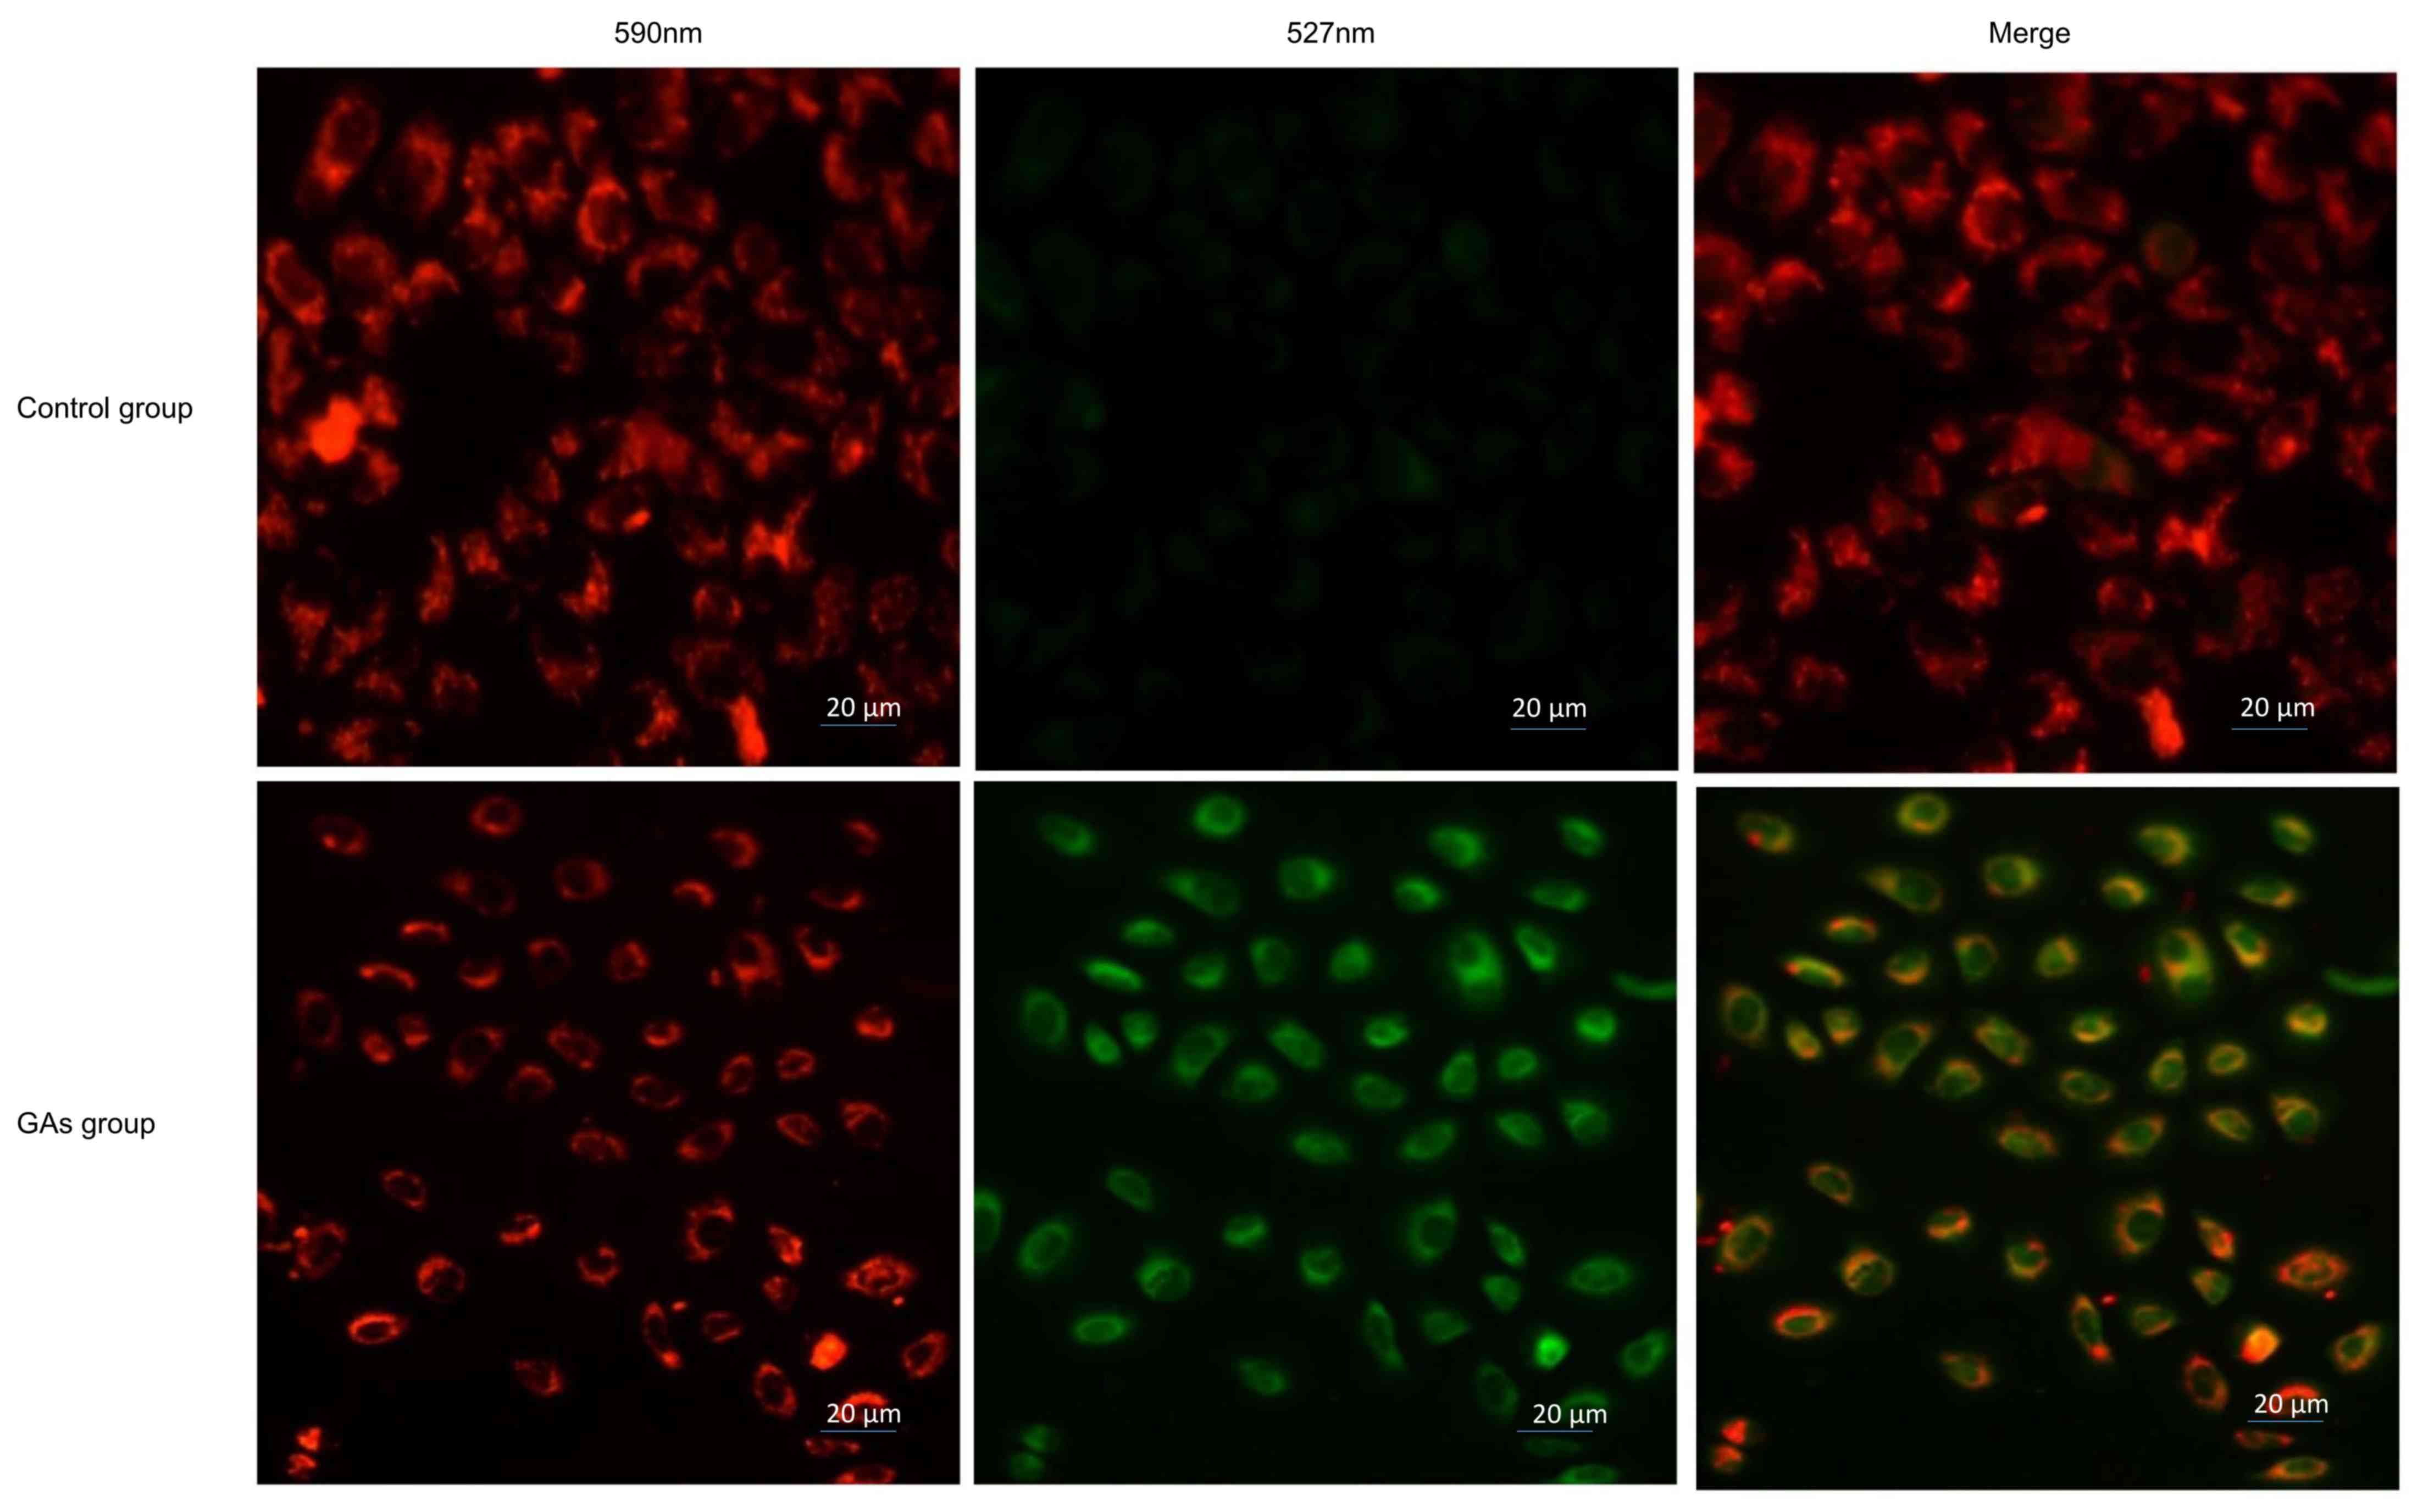
GAs induce mitochondrial dysfunction
in HepG2 cells
Mitochondria are involved in apoptosis (30); therefore, the Δψmof the 20
µg/ml GA-treated HepG2 cells and the control HepG2 cells was
monitored using JC-1 staining. If the cells exhibited an increase
in the intensity of green staining compared with red, this
indicated an increased number of dysfunctional mitochondria. It was
observed that the green fluorescence intensity increased and the
red fluorescence intensity decreased in the cells treated with GAs.
The ratio of red to green was significantly decreased in the
GAs-treated group compared with the control group (P<0.05), as
indicated in Fig. 4.
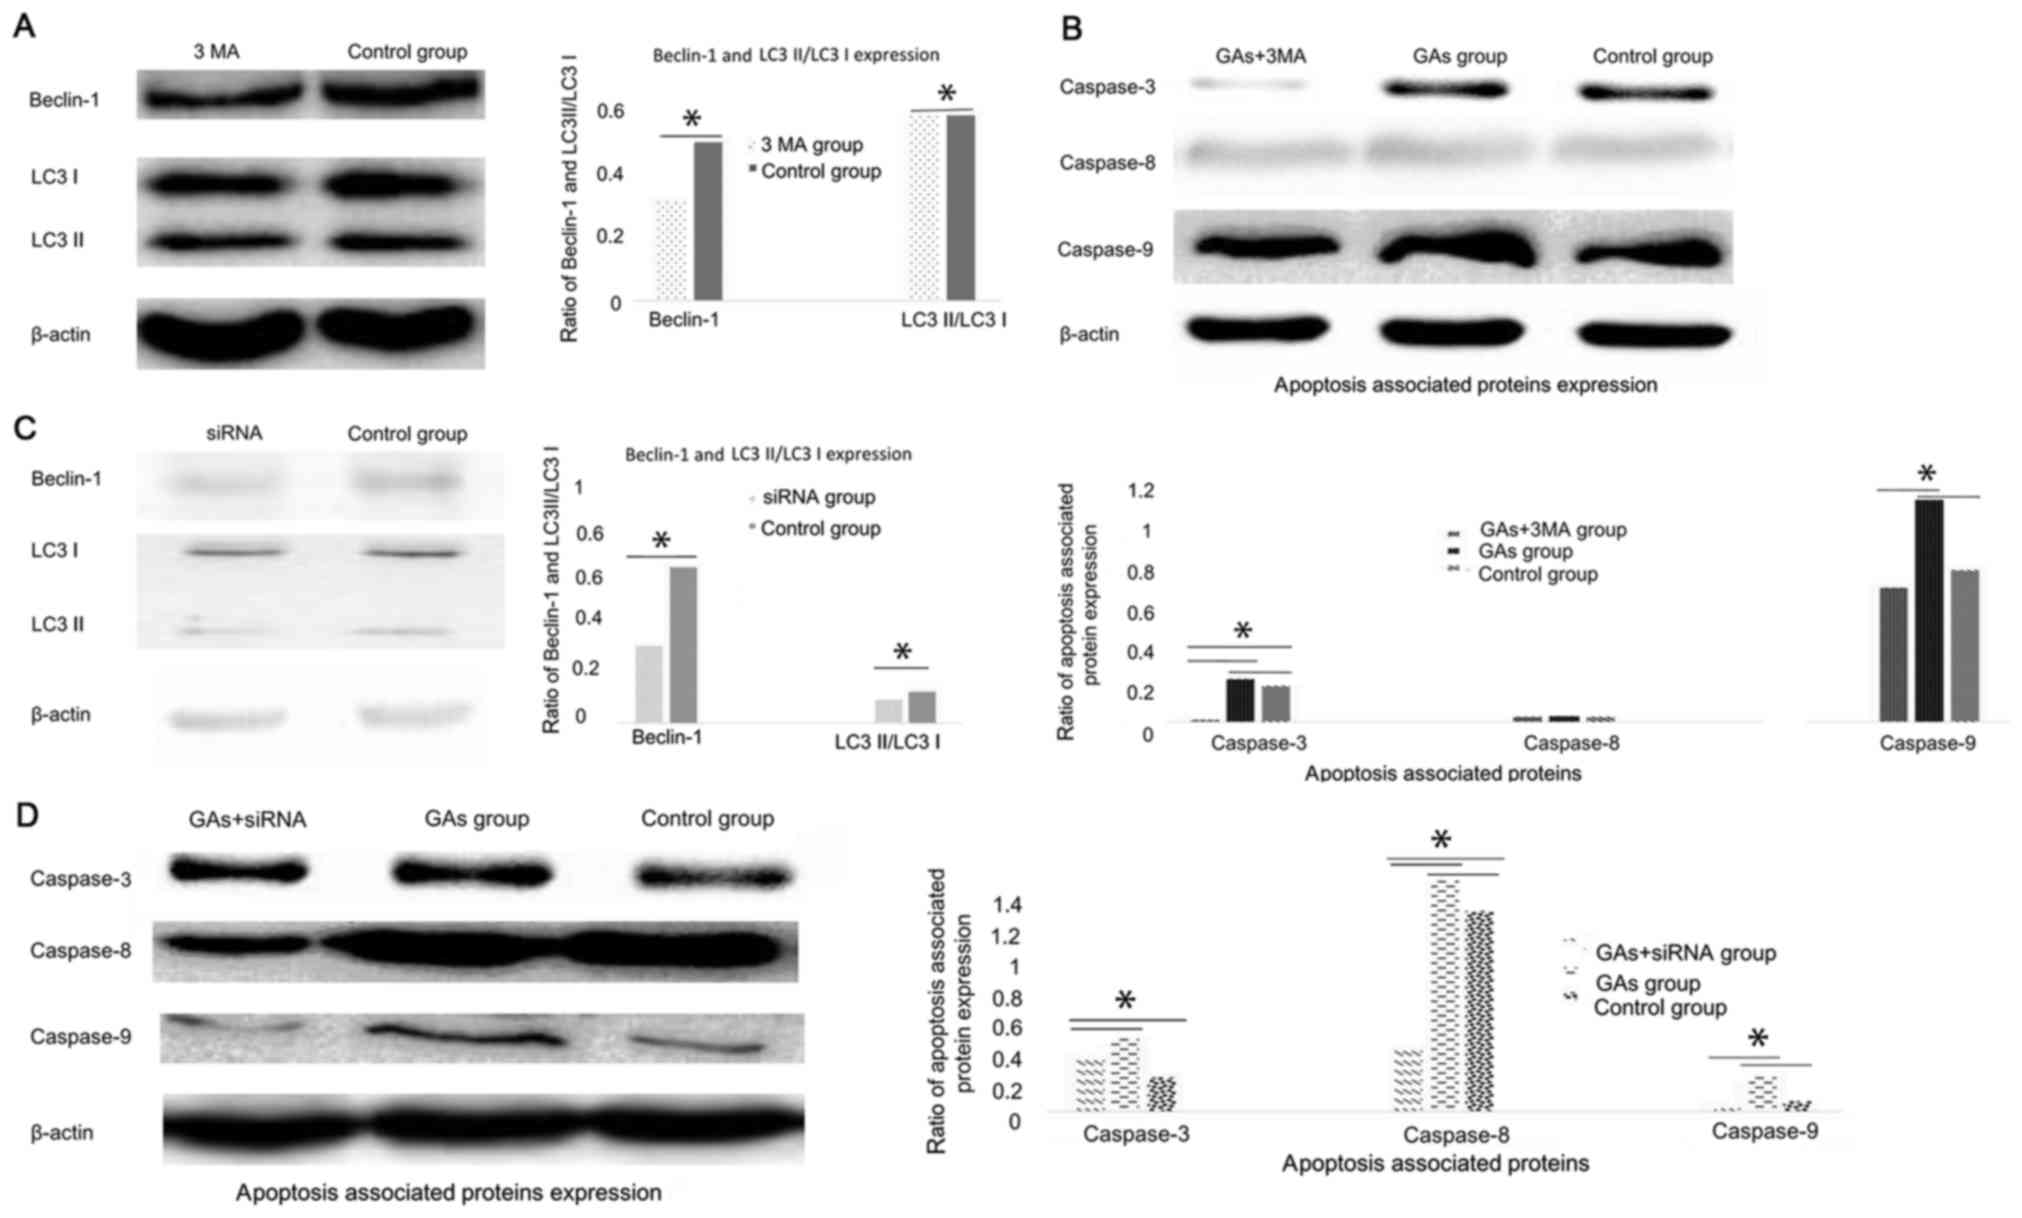
Autophagy contributes to HepG2 cells
apoptosis introduced by GAs
Numerous studies have demonstrated that autophagy
can be cytoprotective (18,21) and cytotoxic (19,20)
activities. To investigate whether autophagy was involved in the
apoptosis process induced by GAs in HepG2 cells, and whether its
activity was cytoprotective or cytotoxic, the autophagy inhibitor
3-MA was administered to the GA-treated HepG2 cells. Then, the
autophagy-associated protein Beclin-1 was detected, and it was
demonstrated that the level of autophagy in the GA-treated HepG2
cells was inhibited (P<0.05) (31,32), as
indicated in Fig. 5A. The expression
levels of the apoptosis-associated proteins caspases-3, −8 and 9
were monitored, and the results revealed that they were all
decreased in the 3-MA-treated GAs HepG2 group compared with the GAs
HepG2 group without 3-MA treatment (P<0.05, Table II), as indicated Fig. 5B. As 3-MA is a non-specific autophagy
suppressor (33), the Class III
phosphoinositide 3-kinase (PI3K-III), an autophagy inducer, and
PI3K-I, an autophagy suppressor, pathways were inhibited by 3-MA.
The autophagy regulator Beclin-1 was silenced to additionally
confirm the results of the 3-MA treatment assay. The efficacy of
the siRNA in the HepG2 cells was initially detected by western blot
analysis (Fig. 5C). The Beclin-1
protein expression level was decreased significantly in HepG2 cells
upon Beclin-1 siRNA treatment (P<0.05). Subsequently, the levels
of caspase-3, −8 and −9 in the Beclin-1-silenced HepG2 cells
treated with GAs was monitored, and the results confirmed those of
the 3-MA treatment experiment, which were that when the rate of
autophagy was decreased, the level of apoptosis was decreased
(P<0.05, Table III; Fig. 5D).
| Table II.The P-value of every two groups for
Fig. 5B. |
Table II.
The P-value of every two groups for
Fig. 5B.
|
| GAs+3-MA | GAs | Control group |
|---|
| Caspase3 |
|
|
|
|
GAs+3-MA | – | P<0.05 | P<0.05 |
|
GAs | P<0.05 | – | P<0.05 |
| Control
group | P<0.05 | P<0.05 | – |
| Caspase-8 | GAs+3-MA | GAs | Control group |
|
GAs+3-MA | – | – | – |
|
GAs | – | – | – |
| Control
group | – | – | – |
| Caspase-9 | GAs+3-MA | GAs | Control group |
|
GAs+3-MA | – | P<0.05 | – |
|
GAs | P<0.05 | – | P<0.05 |
| Control
group | – | P<0.05 | – |
| Table III.The P-value of every two groups for
Fig. 5D. |
Table III.
The P-value of every two groups for
Fig. 5D.
|
| GAs+siRNA | GAs | Control group |
|---|
| Caspase3 |
|
|
|
|
GAs+siRNA | – | P<0.05 | P<0.05 |
|
GAs | P<0.05 | – | – |
| Control
group | P<0.05 | – | – |
| Caspase-8 | GAs+siRNA | GAs | Control group |
|
GAs+siRNA | – | P<0.05 | P<0.05 |
|
GAs | P<0.05 | – | P<0.05 |
| Control
group | P<0.05 |
| – |
| Caspase-9 | GAs+siRNA | GAs | Control group |
|
GAs+siRNA | – | P<0.05 | – |
|
GAs | P<0.05 | – | P<0.05 |
| Control
group | – | P<0.05 | – |
Discussion
In previous decades, increasing levels of
chemotherapy resistance in cancer have been described (34,35).
Therefore, an integrated management system for malignant tumors,
which includes surgery and radiotherapy (1,2), gene
therapy (36) and immune therapy
(3), has become a reasonable
therapeutic strategy. One potential strategy to overcome resistance
is the use of novel antitumor drugs that interact with traditional
or novel targets; Gas represent one such class of these potential
therapeutics.
GAs have been used previously as antitumor agents in
preclinical studies (14,37). Its potential application as an
anti-cancer drug is due to its effects on tumor cell apoptosis
(38), and previous studies have
indicated that Gas exhibit marked antitumor potency. In the present
study, multiple mechanisms of GAs-induced cytotoxicity were
elucidated, including mitochondria land apoptotic pathways.
To the best of our knowledge, the present study
demonstrated for the first time that autophagy is activated in the
Gas-treated HepG2 cells, and that potential crosstalk exists
between apoptosis and autophagy, in gastric carcinoma cells exposed
to GAs. This result is supported by the following observations:
Firstly, morphological changes in the HepG2 cells treated with Gas
indicated vacuolization (39);
secondly, LC3-II/LC3-I are molecular chaperones in autophagy that
are involved with autophagy membrane elongation and closure
(40), and when HepG2 cells were
infected with GAs in the present study, the expression level of
LC3-II/LC3-I was significantly increased; thirdly, suppression of
autophagy by the chemical 3-MA reduced the levels of GAs-induced
autophagy and apoptosis; fourthly, knockdown of Beclin-1 with a
specific siRNA decreased the GA-induced LC3-II conversion and the
expression of caspase-3, −8 and-9, indicating that the induction of
autophagy may result in crosstalk with apoptosis in the GAs-treated
HepG2 cells. In addition, it was observed that the mitochondrial
pathway was involved in the GA-induced HepG2 cell death, as the
Δψm decreased in the Gas-treated cells in comparison
with the control group These experimental data indicate that the
induction of HepG2 cell death was a net effect of the autophagy,
mitochondrial and apoptosis pathways. Autophagy triggers apoptosis
through the Beclin-1-mediated down regulation of Bcl-2 (41). In previous decades, a number of
studies have demonstrated that Bcl-2 is involved in apoptosis and
autophagy (30,42–44).
Beclin-1 is considered to be a member of the Bcl-2 family as it
also contains an N-terminal BH3 domain, and contributes to the
activity of Bcl-2 and Bcl-extra large, and inhibits the formation
of the autophagosome (44,45). In the present study, western blot
analysis revealed that the expression of Beclin-1 increased in
GA-treated HepG2 cells in comparison with the control group, and
therefore the interaction between Beclin-1 and Bcl-2 decreased,
promoting autophagy and apoptosis. In the present study, knockdown
of Beclin-1 using the Beclin-1-specific siRNA suppressed the
conversion of LC3-I to LC-II, but also decreased caspase-3 protein
expression. Consequently, crosstalk between autophagy and apoptosis
may have occurred.
It has been demonstrated that the calmodulin
proteins, calpains, degrade autophagy protein 5 (ATG-5), which is
involved in the autophagy pathway (46). The cleavage of ATG-5 may anchor an
amino-terminal production of ATG-5 cleaved by calpain to the
mitochondria, causing the release of cytochrome c and followed by
mitochondrial dysfunction. In the present study, treatment with GAs
caused a reduction in HepG2 cell mitochondrial trans-membrane
potential, demonstrating that mitochondrial dysfunction contributed
to GA-induced HepG2 cell death by increasing mitochondrial
permeability transition and generating reactive oxygen species. It
is also known that mitochondria may introduce apoptosis via the
intrinsic pathway (47). Therefore,
we hypothesized that treatment with GAs induced HepG2 cell
apoptosis via the mitochondrial, apoptosis and autophagy and
pathways.
In conclusion, the results of the present study
indicated that treatment with Gas induced HepG2 cell death via
apoptosis, autophagy and/or mitochondrial pathways. Although the
association between autophagy, apoptosis and mitochondrial
dysfunction remains unclear, Gas may represent a powerful drug
candidate for antitumor therapy.
Acknowledgements
Not applicable.
Funding
No funding was received.
Availability of data and materials
The datasets used and/or analyzed during the current
study are available from the corresponding author on reasonable
request.
Authors' contributions
QMQ cultured the cells and interpreted the effects
of 3-MA and siRNA administration, and was a major contributor in
writing the manuscript. YCX, JL, DS and JXD performed the western
blotting, and monitored apoptosis and autophagy. SQC, YHL and TCG
performed the JC-1 experiments. MBW analyzed and interpreted all
the data, and designed the study. All authors read and approved the
final manuscript.
Ethics approval and consent to
participate
Not applicable.
Consent for publication
Not applicable.
Competing interests
The authors declare that they have no competing
interests.
References
|
1
|
Shimizuguchi T, Nihei K, Okano T,
Machitori Y, Ito K and Karasawa K: A comparison of clinical
outcomes between three-dimensional conformal radiotherapy and
intensity-modulated radiotherapy for prostate cancer. Int J Clin
Oncol. 22:373–379. 2017. View Article : Google Scholar : PubMed/NCBI
|
|
2
|
Verma V, Moreno AC and Lin SH: Advances in
radiotherapy management of esophageal cancer. J Clin Med. 5:pii:
E91. 2016. View Article : Google Scholar : PubMed/NCBI
|
|
3
|
Yang Y, Hu Y and Wang H: Targeting
antitumor immune response for enhancing the efficacy of
photodynamic therapy of cancer: Recent advances and future
perspectives. Oxid Med Cell Longev. 2016:52740842016. View Article : Google Scholar : PubMed/NCBI
|
|
4
|
Yeku O and Slovin SF: Immune therapy for
prostate cancer. Cancer J. 22:334–341. 2016. View Article : Google Scholar : PubMed/NCBI
|
|
5
|
Friese CR, Li Y, Bondarenko I, Hofer TP,
Ward KC, Hamilton AS, Deapen D, Kurian AW and Katz SJ: Chemotherapy
decisions and patient experience with the recurrence score assay
for early-stage breast cancer. Cancer. 123:43–51. 2017. View Article : Google Scholar : PubMed/NCBI
|
|
6
|
Lohiya V, Aragon-Ching JB and Sonpavde G:
Role of chemotherapy and mechanisms of resistance to chemotherapy
in metastatic castration-resistant prostate cancer. Clin Med
Insights Oncol. 10 Suppl 1:S57–S66. 2016.
|
|
7
|
Sun Y, Guan Z, Liang L, Cheng Y, Zhou J,
Li J and Xu Y: NF-κB signaling plays irreplaceable roles in
cisplatin-induced bladder cancer chemoresistance and tumor
progression. Int J Oncol. 48:225–234. 2016. View Article : Google Scholar : PubMed/NCBI
|
|
8
|
Hsu YL, Hung JY, Tsai EM, Wu CY, Ho YW,
Jian SF, Yen MC, Chang WA, Hou MF and Kuo PL: Benzyl butyl
phthalate increases the chemoresistance to
doxorubicin/cyclophosphamide by increasing breast cancer-associated
dendritic cell-derived CXCL1/GROalpha and S100A8/A9. Oncol Rep.
34:2889–2900. 2015. View Article : Google Scholar : PubMed/NCBI
|
|
9
|
Thoenes L, Hoehn M, Kashirin R, Ogris M,
Arnold GJ, Wagner E and Guenther M: In vivo chemoresistance of
prostate cancer in metronomic cyclophosphamide therapy. J
Proteomics. 73:1342–1354. 2010. View Article : Google Scholar : PubMed/NCBI
|
|
10
|
Oh J, Hwang IH, Hong CE, Lyu SY and Na M:
Inhibition of fatty acid synthase by ginkgolic acids from the
leaves of Ginkgo biloba and their cytotoxic activity. J Enzyme
Inhib Med Chem. 28:565–568. 2013. View Article : Google Scholar : PubMed/NCBI
|
|
11
|
Wang H, Zhou CC, Feng Y, Dai LN, Chen J,
Chen SX, Li XY, Liu YR and Zhang P: The effect of ginkgolic acids
on multidrug resistance in oral squamous cell carcinoma. Hua Xi Kou
Qiang Yi Xue Za Zhi. 28:668–671. 2010.(In Chinese). PubMed/NCBI
|
|
12
|
Fuzzati N, Pace R and Villa F: A simple
HPLC-UV method for the assay of ginkgolic acids in Ginkgo biloba
extracts. Fitoterapia. 74:247–256. 2003. View Article : Google Scholar : PubMed/NCBI
|
|
13
|
Long R, Yin R and Zhen Y: Partial
purification and analysis of allergenicity, immunogenicity of
Ginkgo biloba L. pollen. Hua Xi Yi Ke Da Xue Xue Bao. 23:429–432.
1992.(In Chines). PubMed/NCBI
|
|
14
|
Chao JC and Chu CC: Effects of Ginkgo
biloba extract on cell proliferation and cytotoxicity in human
hepatocellular carcinoma cells. World J Gastroenterol. 10:37–41.
2004. View Article : Google Scholar : PubMed/NCBI
|
|
15
|
Lee JH, Kim YG, Ryu SY, Cho MH and Lee J:
Ginkgolic acids and Ginkgo biloba extract inhibit Escherichia coli
O157:H7 and Staphylococcus aureus biofilm formation. Int J Food
Microbiol. 174:47–55. 2014. View Article : Google Scholar : PubMed/NCBI
|
|
16
|
Thompson AJ, McGonigle I, Duke R, Johnston
GA and Lummis SC: A single amino acid determines the toxicity of
Ginkgo biloba extracts. FASEB J. 26:1884–1891. 2012. View Article : Google Scholar : PubMed/NCBI
|
|
17
|
Ma J, Duan W, Han S, Lei J, Xu Q, Chen X,
Jiang Z, Nan L, Li J, Chen K, et al: Ginkgolic acid suppresses the
development of pancreatic cancer by inhibiting pathways driving
lipogenesis. Oncotarget. 6:20993–21003. 2015.PubMed/NCBI
|
|
18
|
Klionsky DJ and Emr SD: Autophagy as a
regulated pathway of cellular degradation. Science. 290:1717–1721.
2000. View Article : Google Scholar : PubMed/NCBI
|
|
19
|
Bu X, Zhao Y, Zhang Z, Wang M, Li M and
Yan Y: Recombinant Newcastle disease virus (rL-RVG) triggers
autophagy and apoptosis in gastric carcinoma cells by inducing ER
stress. Am J Cancer Res. 6:924–936. 2016.PubMed/NCBI
|
|
20
|
Bu XF, Wang MB, Zhang ZJ, Zhao YH, Li M
and Yan YL: Autophagy is involved in recombinant Newcastle disease
virus (rL-RVG)-induced cell death of stomach adenocarcinoma cells
in vitro. Int J Oncol. 47:679–689. 2015. View Article : Google Scholar : PubMed/NCBI
|
|
21
|
Kania E, Pajak B, O'Prey J, Gonzalez
Sierra P, Litwiniuk A, Urbańska K, Ryan KM and Orzechowski A:
Verapamil treatment induces cytoprotective autophagy by modulating
cellular metabolism. FEBS J. 284:1370–1387. 2017. View Article : Google Scholar : PubMed/NCBI
|
|
22
|
Anding AL and Baehrecke EH: Autophagy in
cell life and cell death. Curr Top Dev Biol. 114:67–91. 2015.
View Article : Google Scholar : PubMed/NCBI
|
|
23
|
Lee YJ, Lee GJ, Yi SS, Heo SH, Park CR,
Nam HS, Cho MK and Lee SH: Cisplatin and resveratrol induce
apoptosis and autophagy following oxidative stress in malignant
mesothelioma cells. Food Chem Toxicol. 97:96–107. 2016. View Article : Google Scholar : PubMed/NCBI
|
|
24
|
Kumari KK and Setty OH: Protective effect
of Phyllanthus fraternus against mitochondrial dysfunction induced
by co-administration of cisplatin and cyclophosphamide. J Bioenerg
Biomembr. 44:179–188. 2012. View Article : Google Scholar : PubMed/NCBI
|
|
25
|
Hackenberg T, Juul T, Auzina A, Gwizdz S,
Malolepszy A, Van Der Kelen K, Dam S, Bressendorff S, Lorentzen A,
Roepstorff P, et al: Catalase and NO CATALASE ACTIVITY1 promote
autophagy-dependent cell death in Arabidopsis. Plant Cell.
25:4616–4626. 2013. View Article : Google Scholar : PubMed/NCBI
|
|
26
|
Yang XM, Wang YF, Li YY and Ma HL: Thermal
stability of ginkgolic acids from Ginkgo biloba and the effects of
ginkgol C17:1 on the apoptosis and migration of SMMC7721 cells.
Fitoterapia. 98:66–76. 2014. View Article : Google Scholar : PubMed/NCBI
|
|
27
|
Zhou C, Li X, Du W, Feng Y, Kong X, Li Y,
Xiao L and Zhang P: Antitumor effects of ginkgolic acid in human
cancer cell occur via cell cycle arrest and decrease the Bcl-2/Bax
ratio to induce apoptosis. Chemotherapy. 56:393–402. 2010.
View Article : Google Scholar : PubMed/NCBI
|
|
28
|
López-Terrada D, Cheung SW, Finegold MJ
and Knowles BB: Hep G2 is a hepatoblastoma-derived cell line. Hum
Pathol. 40:1512–1515. 2009. View Article : Google Scholar
|
|
29
|
Schaaf MB, Keulers TG, Vooijs MA and
Rouschop KM: LC3/GABARAP family proteins: Autophagy-(un)related
functions. FASEB J. 30:3961–3978. 2016. View Article : Google Scholar : PubMed/NCBI
|
|
30
|
Qi Z, Dong W, Shi W, Wang R, Zhang C, Zhao
Y, Ji X, Liu KJ and Luo Y: Bcl-2 phosphorylation triggers autophagy
switch and reduces mitochondrial damage in limb remote ischemic
conditioned rats after ischemic stroke. Transl Stroke Res.
6:198–206. 2015. View Article : Google Scholar : PubMed/NCBI
|
|
31
|
Münz C: Autophagy proteins in phagocyte
endocytosis and exocytosis. Front Immunol. 8:11832017. View Article : Google Scholar : PubMed/NCBI
|
|
32
|
Nascimbeni AC, Codogno P and Morel E:
Phosphatidylinositol-3-phosphate in the regulation of autophagy
membrane dynamics. FEBS J. 284:1267–1278. 2017. View Article : Google Scholar : PubMed/NCBI
|
|
33
|
Lemasters JJ: Variants of mitochondrial
autophagy: Types 1 and 2 mitophagy and micromitophagy (Type 3).
Redox Biol. 2:749–754. 2014. View Article : Google Scholar : PubMed/NCBI
|
|
34
|
Kim J and Hurria A: Determining
chemotherapy tolerance in older patients with cancer. J Natl Compr
Canc Netw. 11:1494–1502. 2013. View Article : Google Scholar : PubMed/NCBI
|
|
35
|
Kalsi T, Babic-Illman G, Ross PJ, Maisey
NR, Hughes S, Fields P, Martin FC, Wang Y and Harari D: The impact
of comprehensive geriatric assessment interventions on tolerance to
chemotherapy in older people. Br J Cancer. 112:1435–1444. 2015.
View Article : Google Scholar : PubMed/NCBI
|
|
36
|
Lara-Guerra H and Roth JA: Gene therapy
for lung cancer. Crit Rev Oncog. 21:115–124. 2016. View Article : Google Scholar : PubMed/NCBI
|
|
37
|
Yang X, Qian Z, Chen J, Zhu W and Xie J:
Study on antitumor activities of ginkgolic acids from Ginkgo
sarcotestas in vitro. Zhong Yao Cai. 27:40–42. 2004.(In Chinese).
PubMed/NCBI
|
|
38
|
Zhou CC, Du W, Wen Z, Li JY and Zhang P:
Effects of natural plant ginkgolic acids on the apoptosis of human
Hep-2 cancer cells. Sichuan Da Xue Xue Bao Yi Xue Ban. 40:459–461.
2009.(In Chinese). PubMed/NCBI
|
|
39
|
Klionsky DJ, Abeliovich H, Agostinis P,
Agrawal DK, Aliev G, Askew DS, Baba M, Baehrecke EH, Bahr BA,
Ballabio A, et al: Guidelines for the use and interpretation of
assays for monitoring autophagy in higher eukaryotes. Autophagy.
4:151–175. 2008. View Article : Google Scholar : PubMed/NCBI
|
|
40
|
Wesselborg S and Stork B: Autophagy signal
transduction by ATG proteins: From hierarchies to networks. Cell
Mol Life Sci. 72:4721–4757. 2015. View Article : Google Scholar : PubMed/NCBI
|
|
41
|
Hetz C: The unfolded protein response:
Controlling cell fate decisions under ER stress and beyond. Nat Rev
Mol Cell Biol. 13:89–102. 2012. View Article : Google Scholar : PubMed/NCBI
|
|
42
|
Levine B, Sinha SC and Kroemer G: Bcl-2
family members: Dual regulators of apoptosis and autophagy.
Autophagy. 4:600–606. 2008. View Article : Google Scholar
|
|
43
|
Kale J, Osterlund EJ and Andrews DW: BCL-2
family proteins: Changing partners in the dance towards death. Cell
Death Differ. 25:65–80. 2018. View Article : Google Scholar : PubMed/NCBI
|
|
44
|
Pattingre S, Tassa A, Qu X, Garuti R,
Liang XH, Mizushima N, Packer M, Schneider MD and Levine B: Bcl-2
antiapoptotic proteins inhibit Beclin 1-dependent autophagy. Cell.
122:927–939. 2005. View Article : Google Scholar : PubMed/NCBI
|
|
45
|
Lomonosova E and Chinnadurai G: BH3-only
proteins in apoptosis and beyond: An overview. Oncogene. 27 Suppl
1:S2–S19. 2008. View Article : Google Scholar : PubMed/NCBI
|
|
46
|
Yousefi S, Perozzo R, Schmid I, Ziemiecki
A, Schaffner T, Scapozza L, Brunner T and Simon HU:
Calpain-mediated cleavage of Atg5 switches autophagy to apoptosis.
Nat Cell Biol. 8:1124–1132. 2006. View Article : Google Scholar : PubMed/NCBI
|
|
47
|
Gong A, Ye S, Xiong E, Guo W, Zhang Y,
Peng W, Shao G, Jin J, Zhang Z, Yang J and Gao J: Autophagy
contributes to ING4-induced glioma cell death. Exp Cell Res.
319:1714–1723. 2013. View Article : Google Scholar : PubMed/NCBI
|