Introduction
Thyroid cancer is type of malignant tumor with an
increasing incidence in China (1,2). However,
the current clinical treatment of thyroid cancer, which involves
surgery and/or radiotherapy or chemotherapy, results in low
recovery rates and high recurrence rates, indicating that the
treatment in not sufficiently effective (3). Therefore, the aim of the present study
was to identify a novel target for thyroid cancer and investigate
its underlying molecular mechanism.
Alkylglycerone phosphate synthase (AGPS)
inactivation is able to decrease the expression of various types of
lipid that are crucial for the growth and diffusion of tumor cells,
including ether lipids, prostaglandins and acyl phosphatides, thus
decreasing cancer pathogenicity (4,5). However,
AGPS overexpression is able to increase the survival and migratory
ability of tumor cells, including SKOV3 ovarian cancer cells,
231MFP breast cancer cells, C8161 melanoma cells, PC3 prostate
cancer cells and primary breast cancer cells, thus promoting tumor
growth and invasion (6). In our
previous study, a differential expression of AGPS in various
thyroid cancer cell lines was observed, which was positively
correlated with their malignancy. Therefore, it was hypothesized
that AGPS may be a potential target for the diagnosis and treatment
of thyroid cancer.
Circular RNAs (circRNAs) are important molecular
mediators of cellular genetic changes, which are directly or
indirectly associated with the occurrence and development of
numerous tumors, including thyroid cancer. circRNAs are abnormally
expressed in tumors, and are a newly identified type of non-coding
RNA that differ from traditional non-coding linear RNAs by their
unique mechanism, including i) as the small RNA [microRNA (miRNA)]
sponge regulating the expression of target genes; ii) regulating
the activity of RNA polymerase II transcripts; iii) regulating the
RNA-binding protein; and iv) combining with ribosomes to
participate in protein translation (7,8).
Therefore, it was hypothesized that circRNAs may also be potential
targets for the diagnosis and treatment of thyroid cancer.
The aim of the present study was to identify an
association between AGPS and circRNAs in thyroid cancer. For that
purpose, AGPS was silenced and knocked out in FRO cells to explore
the effects of AGPS on the regulation of circRNA expression in
thyroid cancer cells. In addition, Gene Ontology (GO) and Kyoto
Encyclopedia of Genes and Genomes (KEGG) pathway enrichment
analyses were used to investigate the underlying molecular
mechanism of AGPS-regulated biological behavior of thyroid
cancer.
Materials and methods
Cell lines and cell culture
The human thyroid cancer cell lines TPC-1, FTC-133
and FRO were obtained from the American Type Culture Collection
(Manassas, VA, USA) and maintained at 37°C in a humidified
atmosphere with 5% CO2 in RPMI-1640 medium (Corning
Incorporated, Corning, NY, USA) with 10% fetal bovine serum
(Corning Incorporated).
FRO cells were cultured in a 6-well plate for 24 h,
and then transfected with an AGPS short hairpin (sh)RNA plasmid
(sc-94310-SH; Santa Cruz Biotechnology, Inc., Dallas, TX, USA)
(AGPS sh group) or with an AGPS clustered regularly interspaced
short palindromic repeats-associated protein-9 nuclease knockout
(KO) plasmid (sc-404604; Santa Cruz Biotechnology, Inc.) (AGPS KO
group), according to the manufacturer's protocol. Next, fresh
culture medium was added, and cells were harvested 72 h later for
experiments.
RNA sample quality control
The total RNA of AGPS SH and AGPS KO FRO cells were
extracted using TRIzol® reagent (Invitrogen; Thermo
Fisher Scientific, Inc., Waltham, MA, USA). The concentration of
the RNA samples was determined by measuring the optical density at
260 nm using a NanoDrop ND-1000 instrument (NanoDrop; Thermo Fisher
Scientific, Inc.). The RNA integrity was assessed by
electrophoresis on a 1.5% denaturing agarose gel. Visualization was
performed using SYBR® Green I nucleic acid gel stain
(Sigma-Aldricj; Merck KGaA, Darmstadt, Germany) and a Safe Imager™
2.0 Blue Light Transilluminator (Thermo Fisher Scientific Inc.,
Waltham, MA, USA).
Labeling and hybridization
Sample labeling and array hybridization were
performed according to the manufacturer's protocol (Arraystar Super
RNA Labeling Kit; Arraystar, Inc., Rockville, MD, USA). Briefly,
total RNAs from AGPS SH and AGPS KO FRO cells were digested with
RNase R (Epicentre; Illumina, Inc., San Diego, CA, USA) to remove
linear RNAs and enrich the sample in circRNAs. Then, the enriched
circRNAs were amplified and transcribed into fluorescent
complementary RNA (cRNA) utilizing a random priming method
(Arraystar Super RNA Labeling kit; Arraystar, Inc.). The labeled
cRNAs were purified using an RNeasy Mini kit (Qiagen, Inc.,
Valencia, CA, USA). The concentration and specific activity of the
labeled cRNAs (pmol cyanin 3/µg cRNA) were determined using a
NanoDrop ND-1000 instrument. Next, 1 µg each labeled cRNA was
fragmented by adding 5 µl 10X Blocking Agent (Arraystar Super RNA
Labeling Kit) and 1 µl 25X Fragmentation Buffer (Arraystar Super
RNA Labeling Kit), and the mixture was heated at 60°C for 30 min
before adding 25 µl 2X Hybridization Buffer (Arraystar Super RNA
Labeling Kit) to dilute the labeled cRNAs. Subsequently, 50 µl
Hybridization Solution (Arraystar Super RNA Labeling Kit) was
dispensed into the gasket slide and assembled to create the circRNA
expression microarray slide. The slides were incubated at 65°C for
17 h in an Agilent Microarray Hybridization Oven (Agilent
Technologies, Inc., Santa Clara, CA, USA). The hybridized arrays
were washed, fixed and scanned using an Agilent Microarray Scanner
G2505C (Agilent Technologies, Inc.).
Reverse transcription-quantitative
polymerase chain reaction (RT-qPCR) assay
RNA was isolated using QIAzol (Qiagen, Inc.)
according to the manufacturer's protocol. SYBR Green I dye (Takara
Biotechnology Co., Ltd., Dalian, China) was used for RT in an
Applied Biosystems® 7500 Real-Time PCR system (Applied
Biosystems; Thermo Fisher Scientific, Inc.), and the concentration
of circRNAs in the aforementioned total RNA was quantified. The
sequences of the primers used for RT-qPCR are listed in Table I. The thermocycling conditions used
were as follows: Denaturation at 95°C for 10 min, followed by 40
cycles at 95°C for 15 sec and 60°C for 60 sec, and a final
elongation at 95°C for 15 sec, 60°C for 60 sec and 95°C for 15 sec.
β-actin was used as the internal reference, and the
2−ΔΔCq method (9) was used
for calculating circRNA expression ratios.
 | Table I.Primer sequences. |
Table I.
Primer sequences.
| Gene | Primer sequence
(5′-3′) |
|---|
| AGPS | Forward:
ACCAGATTCCCTGGAGTTCA |
|
| Reverse:
GAACCACCAGGTCCTCGATA |
|
hsa_circRNA_406841 | Forward:
ATGGAGCACCCTGGGAAAA |
|
| Reverse:
TTTGCGACTCACTCTTCTGG |
|
hsa_circRNA_000905 | Forward:
GCCAAGAAGCCACTGACTC |
|
| Reverse:
CCGTACCCACAAAGCAGTC |
|
hsa_circRNA_019252 | Forward:
CTACAAGCCCGCGC |
|
| Reverse:
CTATACATTTATTGAGTAAAAACAAAAC |
|
hsa_circRNA_089761 | Forward:
ATTTTGTTTTCAATTAGGGAGAT |
|
| Reverse:
GCACATGCAGCGCAAGTA |
|
hsa_circRNA_006050 | Forward:
GATCATTCAGGTTCTTCCAGG |
|
| Reverse:
TTCTCTTGGAAACGTTCAGAAG |
|
hsa_circRNA_074298 | Forward:
TTTGGCAATGAATAAACTGACC |
|
| Reverse:
CCGAGCAAAAGGAACTCCG |
|
hsa_circRNA_066556 | Forward:
AGTGGCATGATCGCGTCT |
|
| Reverse:
ATTTCGACTCACTGCTTCACCA |
|
hsa_circRNA_101321 | Forward:
TTTGGTGCATATTTGGGTCT |
|
| Reverse:
CTGTAACATGGCCTTGAGGA |
|
hsa_circRNA_023016 | Forward:
GGGTAGTGGGATGTGTGTCC |
|
| Reverse:
AAACCATTTATTTCACCGGAA |
|
hsa_circRNA_019744 | Forward:
ACACGTCAGCTCCCTCGCCGCCCTG |
|
| Reverse:
ATCGGAACGACTTTATTTCAGTA |
|
hsa_circRNA_404686 | Forward:
GACCAGGTGATTTTCAAAGC |
|
| Reverse:
ATAATCAAAGGAATGGACGC |
|
hsa_circRNA_000367 | Forward:
GTCCCAGTAAGCACTCTGTTC |
|
| Reverse:
AATCGTATGGAATGGACCTG |
|
hsa_circRNA_001729 | Forward:
AGGAGCCCAGACACAGCAG |
|
| Reverse:
CCATTACACTGTAGCCAGAATG |
|
hsa_circRNA_004183 | Forward:
ATAGCTCGCAGTCGGCC |
|
| Reverse:
CCTGAGAACCTCGTGGAAT |
|
hsa_circRNA_100790 | Forward:
AAAACGGTTCCTTTGGTATC |
|
| Reverse:
TGGAATGGAGCTGCATTTAC |
|
hsa_circRNA_104270 | Forward:
GTGAGAGGTTTGCAAGGATTT |
|
| Reverse:
GGGAAAGGATCTGGAATGG |
|
hsa_circRNA_102049 | Forward:
TACTTCAGATTTTCCTGTCCT |
|
| Reverse:
AATGGCTGTGTCAGCAGTTTT |
|
hsa_circRNA_406494 | Forward:
AGGAACTATAGATTTAGCTTATTGT |
|
| Reverse:
ATGAAACAATTTGCTTGGCT |
|
hsa_circRNA_100787 | Forward:
CATGCAAACGGTGGTAAATT |
|
| Reverse:
CTTTTACATTGATTCCACTGCT |
|
hsa_circRNA_082319 | Forward:
AAGCAACGATGTGCTGAGCT |
|
| Reverse:
GTTTCAGCTGGCTGGCTAGA |
| β-actin | Forward:
AGGCACCAGGGCGTGAT |
|
| Reverse:
GCCCACATAGGAATCCTTCTGAC |
Data analysis
Raw data collection
Scanned images were imported into Agilent Feature
Extraction Software 12.0 (Agilent Technologies, Inc.) for raw data
extraction.
Expression profiling data
Quantile normalization of raw data and subsequent
data processing were performed using the R software limma package
(10). Next, volcano plot
(statistics) was performed (11).
Differentially expressed data
When comparing two groups of profile differences
(such as disease vs. control), the fold change (FC), which was
defined as the mean of the ratio of the group, between the groups
for each circRNA was computed. The statistical significance of the
difference was estimated using Student's t-test. circRNAs
exhibiting FC=2 and P=0.05 were selected as significantly
differentially expressed. The analysis outputs were filtered, and
the differentially expressed circRNAs were ranked according to
their FC and P-value, using the Sort & Filter Data
functionality of Microsoft Excel 2007 (Microsoft Corporation,
Redmond, WA, USA). The significantly differentially expressed
circRNAs (FC ≥2.0) was considered to indicate a significantly
differentially expressed circRNAs
Statistical analysis
A heatmap was constructed using HemI 1.0 (12). Cluster analysis was performed by
complete linkage (13). GO and KEGG
analyses were performed using DAVID 6.8 (14). -log10 (P-value) >2 was considered
to indicate a significant threshold in GO analysis. Data analysis
was conducted using SPSS software (version 11.0; SPSS, Inc.,
Chicago, IL, USA). One-way analysis of variance and Tukey's test
were applied for intergroup analysis. P<0.05 was considered to
indicate a statistically significant difference.
Results
Expression of AGPS in thyroid cancer
cell lines
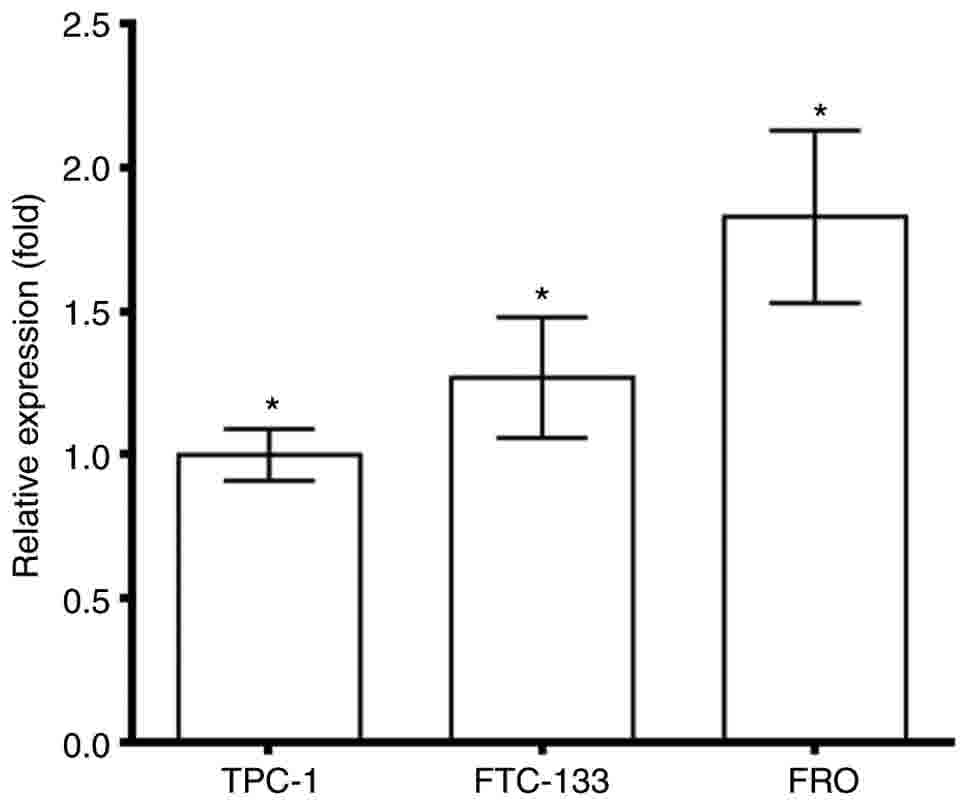
The expression of AGPS was analyzed in different
thyroid cancer cells, and low levels of AGPS were detected in TPC-1
and FTC-133 cells, whereas highest level of AGPS were observed in
tumors of the FRO cells (P<0.05), as depicted in Fig. 1. This result indicated that there was
an expression of AGPS in thyroid cancer. Therefore, the effect of
AGPS on the circRNAs in thyroid cancer was explored using FRO cells
AGPS was investigated in tumor cells to analyze the mechanism,
therefore TPC-1 cells were selected as control.
Cluster analysis of differentially
expressed circRNAs
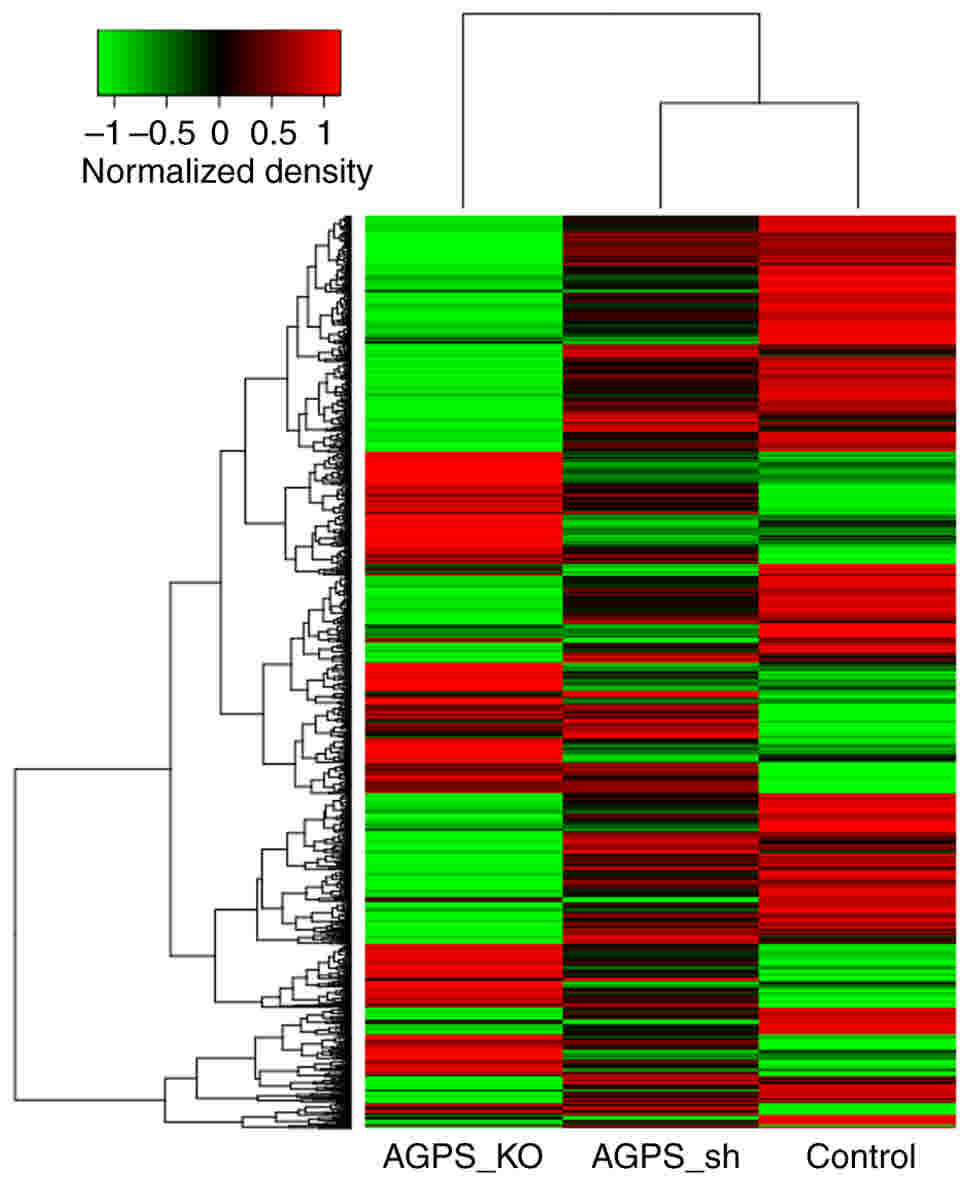
Cluster analysis can be used to analyze genetic
distance or similarity and gene expression patterns (15). In the present study, the control, AGPS
sh and AGPS KO groups were selected for cluster analysis of
circRNAs, and the three samples were compared to identify the
differences in circRNA expression. The green represents a decreased
expression of circRNAs and the red represents an increased
expression of circRNAs in Fig. 2.
Fig. 2 indicates that the expression
patterns of the control, AGPS sh and AGPS KO groups are different,
and therefore, the AGPS sh and AGPS KO may induce the alteration in
circRNAs in FRO cells.
Regulation of circRNA expression by
AGPS
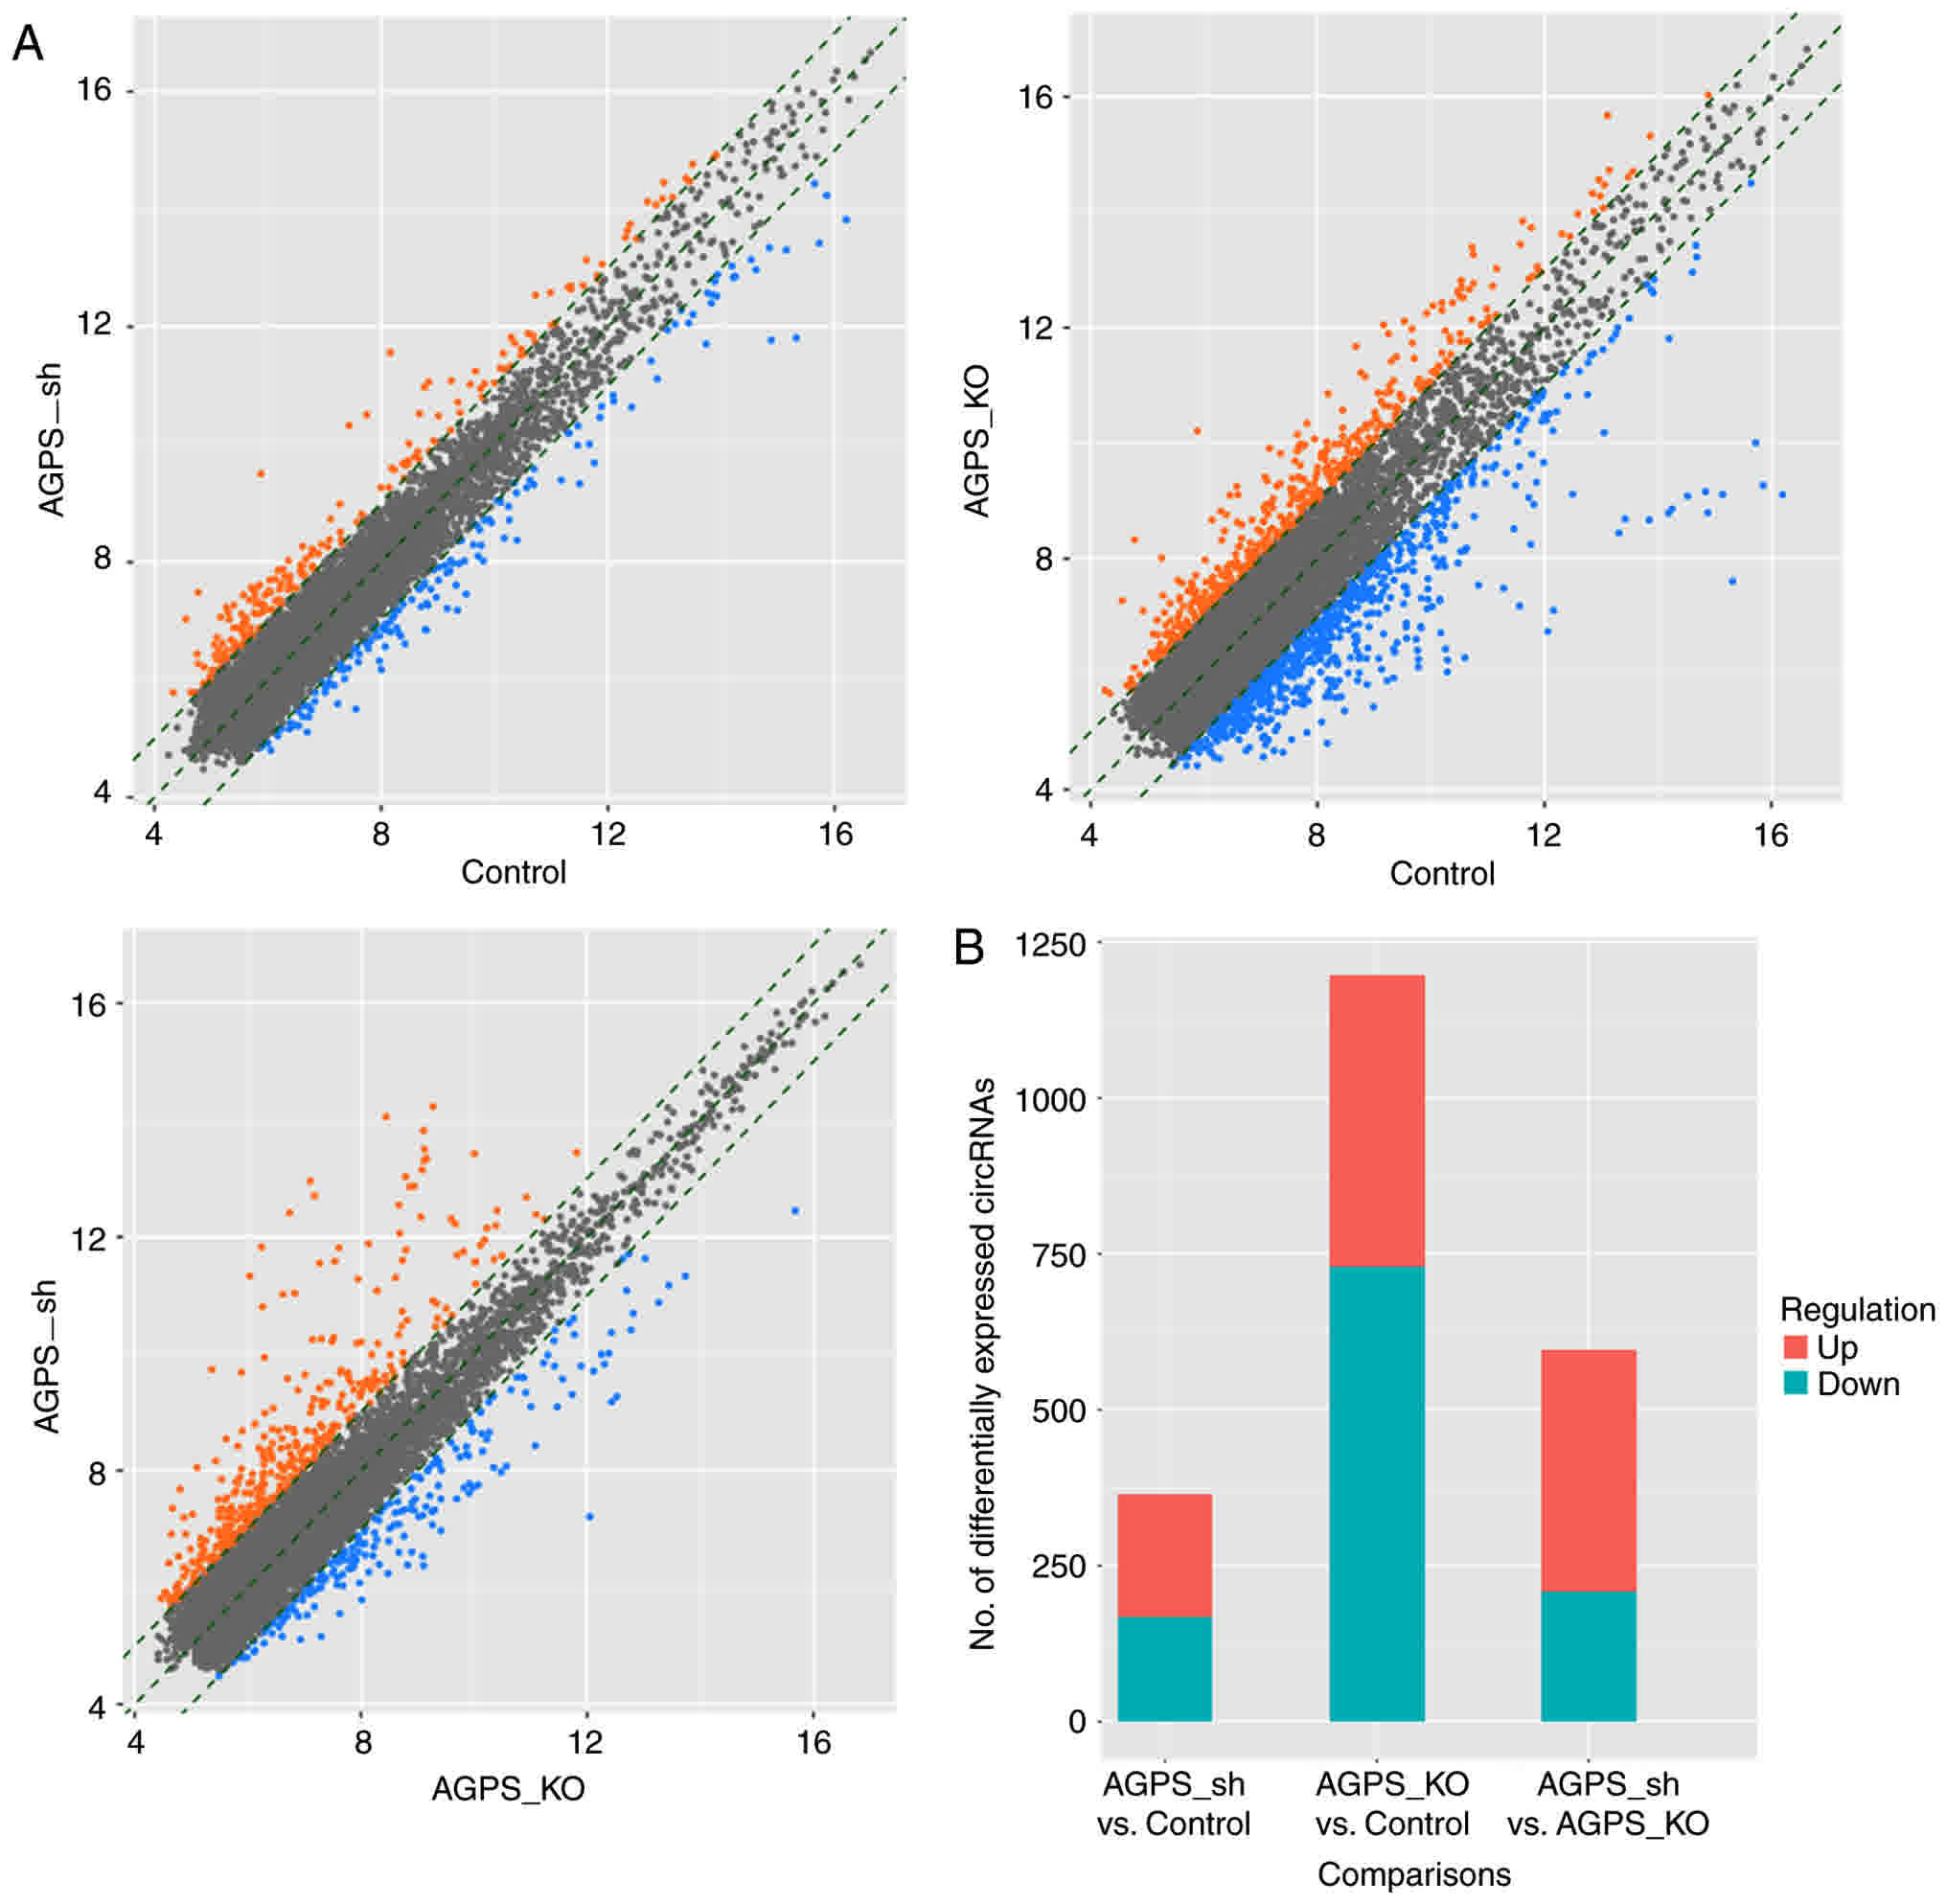
In the circRNA expression scatter diagrams presented
in Fig. 3A, all circRNA expression
patterns are compared in pairs between the control, AGPS sh and
AGPS KO groups. The difference in circRNA number in the histogram
of Fig. 3B indicates that the number
of circRNAs which changed expression in the AGPS KO group was
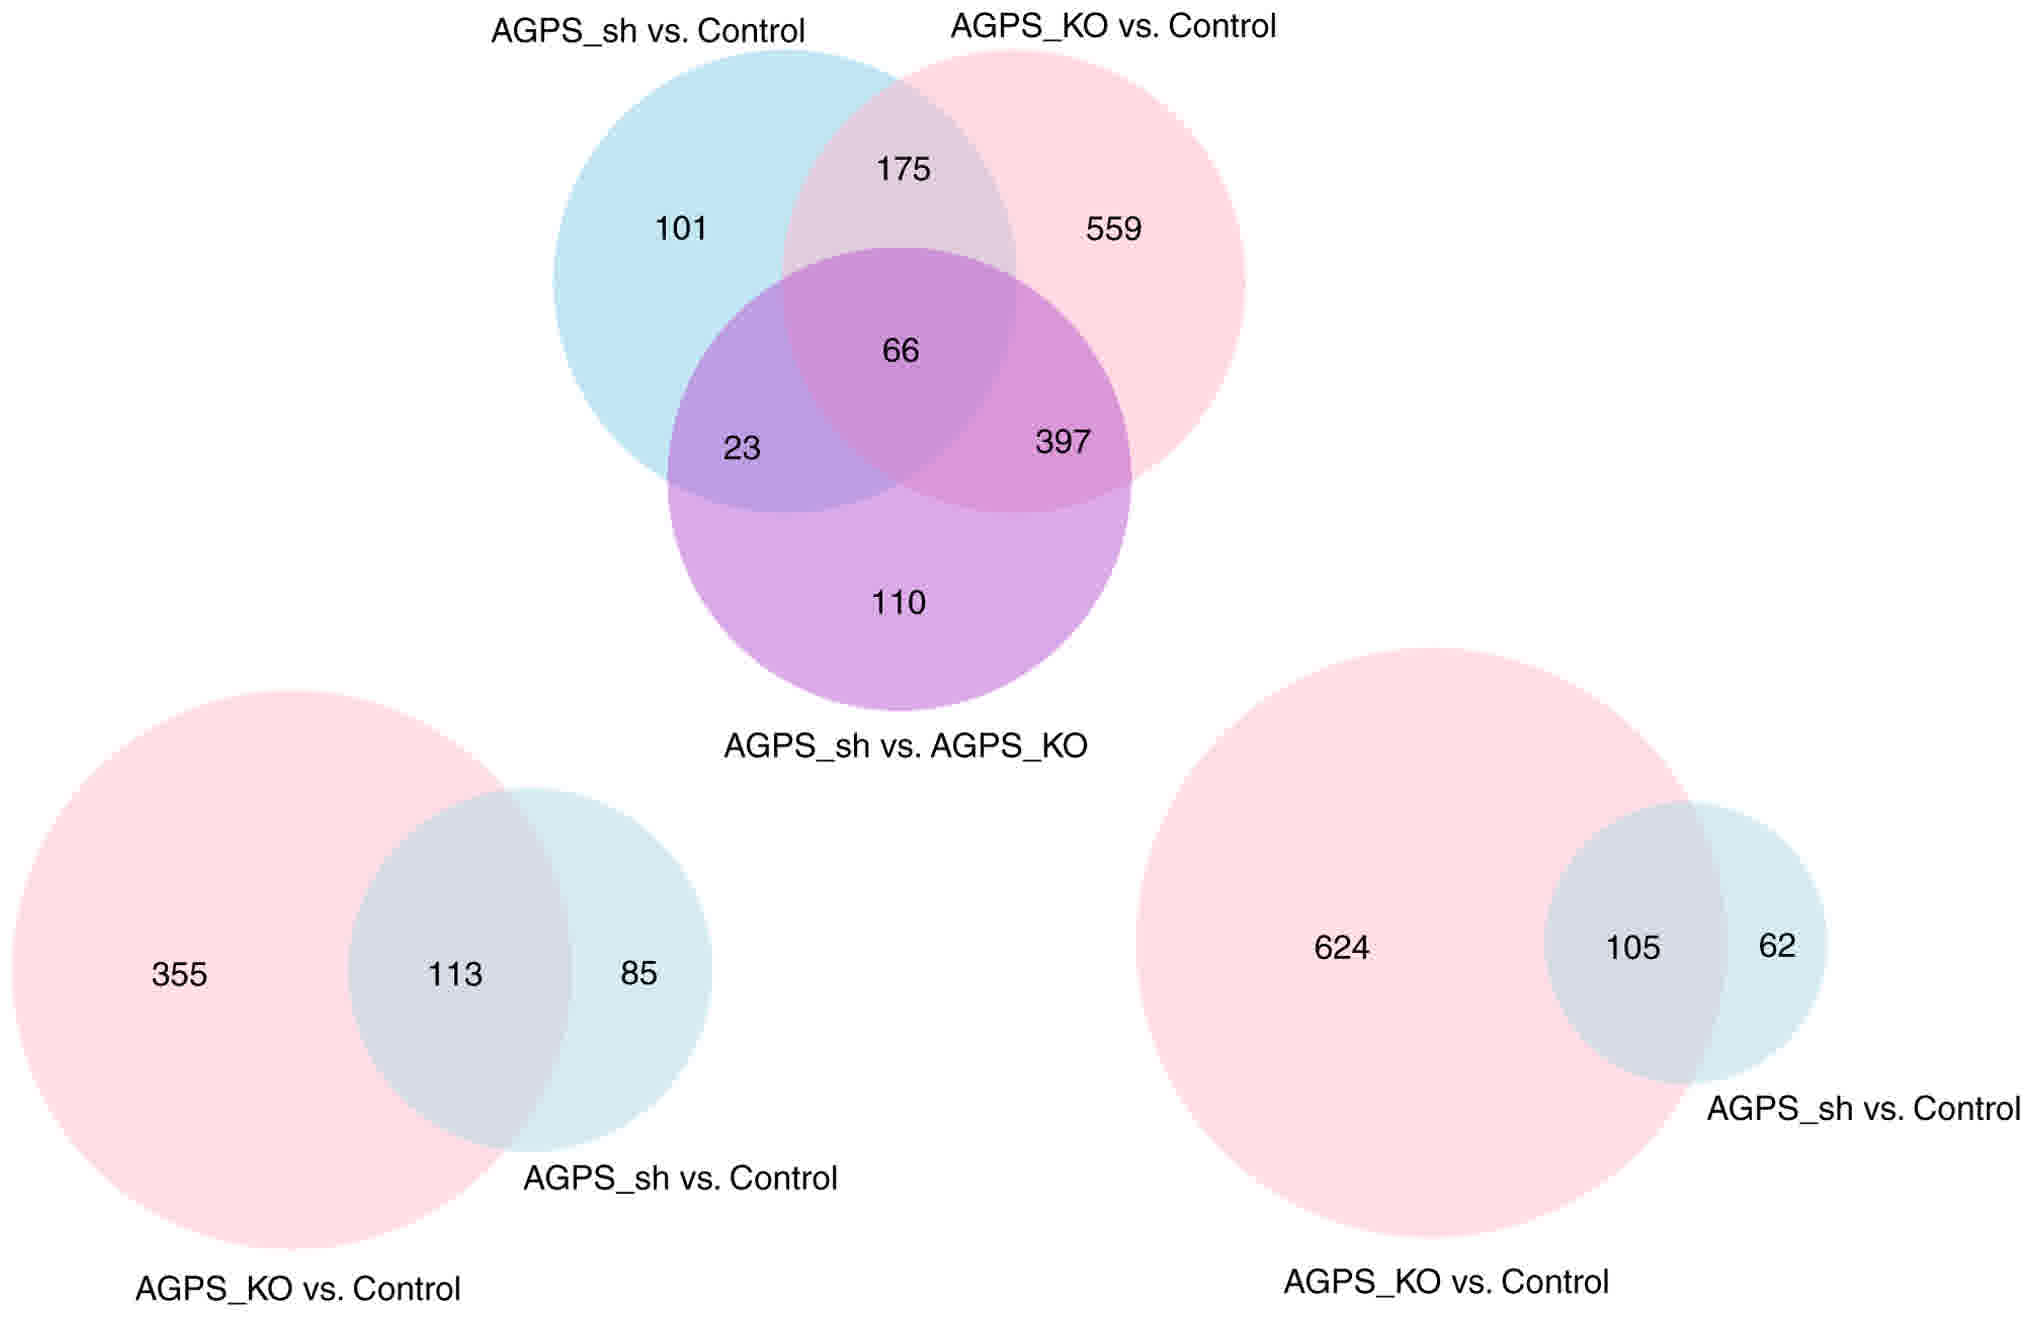
greater than the AGPS sh group. The Venn diagram depicted the
comparison of changed expression circRNAs in the control, AGPS sh
group and AGPS KO group (Fig. 4). The
50 genes with the highest fold-change differently expressed
circRNAs are presented in Table
II.
| Table II.Top 50 differentially expressed
circRNAs in AGPS sh and AGPS KO human thyroid cancer FRO cells. |
Table II.
Top 50 differentially expressed
circRNAs in AGPS sh and AGPS KO human thyroid cancer FRO cells.
| A, Top 50
differentially expressed circRNAs in AGPS sh vs. control group in
human thyroid cancer FRO cells. |
|---|
|
|---|
|
| AGPS sh vs.
control |
| AGPS sh vs.
control |
|---|
|
|
|
|
|
|---|
| no. | circRNA | Up,
fold-change | circRNA | Down, fold | No. | circRNA | Up,
fold-change | circRNA | Down, fold |
|---|
| 1 |
hsa_circRNA_089761 | −28.57 |
hsa_circRNA_404686 | −11.37 | 26 |
hsa_circRNA_006562 | −4.79 |
hsa_circRNA_100934 | −3.12 |
| 2 |
hsa_circRNA_089762 | −9.56 |
hsa_circRNA_004183 | −8.61 | 27 |
hsa_circRNA_009618 | −4.73 |
hsa_circRNA_002131 | −3.12 |
| 3 |
hsa_circRNA_089763 | −9.55 |
hsa_circRNA_000367 | −5.2 | 28 |
hsa_circRNA_074298 | −4.68 |
hsa_circRNA_001729 | −3.08 |
| 4 |
hsa_circRNA_008882 | −9.38 |
hsa_circRNA_104270 | −4.95 | 29 |
hsa_circRNA_088194 | −4.55 |
hsa_circRNA_038635 | −3.05 |
| 5 |
hsa_circRNA_000324 | −6.67 |
hsa_circRNA_403044 | −4.5 | 30 |
hsa_circRNA_405116 | −4.53 |
hsa_circRNA_405616 | −3.05 |
| 6 |
hsa_circRNA_000543 | −6.32 |
hsa_circRNA_406605 | −4.49 | 31 |
hsa_circRNA_105044 | −4.42 |
hsa_circRNA_407198 | −3.01 |
| 7 |
hsa_circRNA_000808 | −5.91 |
hsa_circRNA_407270 | −4.21 | 32 |
hsa_circRNA_035222 | −4.38 |
hsa_circRNA_406986 | −2.97 |
| 8 |
hsa_circRNA_002082 | −5.68 |
hsa_circRNA_048148 | −4.14 | 33 |
hsa_circRNA_103349 | −4.36 |
hsa_circRNA_403658 | −2.95 |
| 9 |
hsa_circRNA_100498 | −5.63 |
hsa_circRNA_007850 | −4.11 | 34 |
hsa_circRNA_100993 | −4.35 |
hsa_circRNA_103336 | −2.92 |
| 10 |
hsa_circRNA_100703 | −5.59 |
hsa_circRNA_044097 | −4.07 | 35 |
hsa_circRNA_102950 | −4.3 |
hsa_circRNA_407173 | −2.84 |
| 11 |
hsa_circRNA_401696 | −5.44 |
hsa_circRNA_004121 | −4.06 | 36 |
hsa_circRNA_000799 | −4.21 |
hsa_circRNA_029349 | −2.84 |
| 12 |
hsa_circRNA_092447 | −5.42 |
hsa_circRNA_104511 | −3.87 | 37 |
hsa_circRNA_406447 | −4.2 |
hsa_circRNA_103561 | −2.83 |
| 13 |
hsa_circRNA_001873 | −5.4 |
hsa_circRNA_089761 | −3.87 | 38 |
hsa_circRNA_003251 | −4.19 |
hsa_circRNA_102049 | −2.82 |
| 14 |
hsa_circRNA_102949 | −5.31 |
hsa_circRNA_104510 | −3.78 | 39 |
hsa_circRNA_406752 | −3.99 |
hsa_circRNA_405644 | −2.79 |
| 15 |
hsa_circRNA_101965 | −5.29 |
hsa_circRNA_100790 | −3.57 | 40 |
hsa_circRNA_058097 | −3.93 |
hsa_circRNA_005178 | −2.79 |
| 16 |
hsa_circRNA_105055 | −5.25 |
hsa_circRNA_400019 | −3.55 | 41 |
hsa_circRNA_101321 | −3.9 |
hsa_circRNA_404918 | −2.76 |
| 17 |
hsa_circRNA_000181 | −5.2 |
hsa_circRNA_004878 | −3.51 | 42 |
hsa_circRNA_100834 | −3.81 |
hsa_circRNA_405296 | −2.72 |
| 18 |
hsa_circRNA_406951 | −5.19 |
hsa_circRNA_091419 | −3.44 | 43 |
hsa_circRNA_034642 | −3.75 |
hsa_circRNA_403691 | −2.68 |
| 19 |
hsa_circRNA_402565 | −5.15 |
hsa_circRNA_406281 | −3.43 | 44 |
hsa_circRNA_092390 | −3.74 |
hsa_circRNA_405324 | −2.64 |
| 20 |
hsa_circRNA_030431 | −4.98 |
hsa_circRNA_000361 | −3.43 | 45 |
hsa_circRNA_407029 | −3.73 |
hsa_circRNA_002082 | −2.64 |
| 21 |
hsa_circRNA_006050 | −4.92 |
hsa_circRNA_407008 | −3.4 | 46 |
hsa_circRNA_104113 | −3.69 |
hsa_circRNA_050263 | −2.63 |
| 22 |
hsa_circRNA_405975 | −4.9 |
hsa_circRNA_000122 | −3.37 | 47 |
hsa_circRNA_102686 | −3.67 |
hsa_circRNA_405962 | −2.62 |
| 23 |
hsa_circRNA_103297 | −4.9 |
hsa_circRNA_051778 | −3.27 | 48 |
hsa_circRNA_400620 | −3.62 |
hsa_circRNA_100789 | −2.62 |
| 24 |
hsa_circRNA_003391 | −4.84 |
hsa_circRNA_101911 | −3.18 | 49 |
hsa_circRNA_100043 | −3.54 |
hsa_circRNA_102051 | −2.61 |
| 25 |
hsa_circRNA_100395 | −4.83 |
hsa_circRNA_406888 | −3.14 | 50 |
hsa_circRNA_406768 | −3.54 |
hsa_circRNA_403472 | −2.59 |
|
| B, Top 50
differentially expressed circRNAs in AGPS KO vs. control group in
human thyroid cancer FRO cells |
|
|
| AGPS KO vs.
control |
| AGPS KO vs.
control |
|
|
|
|
|
| no. | circRNA | Up,
fold-change | circRNA | Down,
fold | No. | circRNA | Up,
fold-change | circRNA | Down,
fold |
|
| 1 |
hsa_circRNA_406841 | 20.2 |
hsa_circRNA_404686 | −209.71 | 26 |
hsa_circRNA_006562 | 5.01 |
hsa_circRNA_407008 | −11.01 |
| 2 |
hsa_circRNA_000905 | 11.81 |
hsa_circRNA_000367 | −136.85 | 27 |
hsa_circRNA_405708 | 4.98 |
hsa_circRNA_406605 | −10.64 |
| 3 |
hsa_circRNA_019252 | 8.02 |
hsa_circRNA_001729 | −96.12 | 28 |
hsa_circRNA_001409 | 4.97 |
hsa_circRNA_103309 | −10.41 |
| 4 |
hsa_circRNA_089761 | 7.38 |
hsa_circRNA_004183 | −67.98 | 29 |
hsa_circRNA_100395 | 4.87 |
hsa_circRNA_102651 | −10.37 |
| 5 |
hsa_circRNA_006050 | 6.78 |
hsa_circRNA_100790 | −65.56 | 30 |
hsa_circRNA_103349 | 4.86 |
hsa_circRNA_405644 | −10.19 |
| 6 |
hsa_circRNA_074298 | 6.76 |
hsa_circRNA_104270 | −52.8 | 31 |
hsa_circRNA_105044 | 4.78 |
hsa_circRNA_405462 | −10.15 |
| 7 |
hsa_circRNA_066556 | 6.59 |
hsa_circRNA_102049 | −51.39 | 32 |
hsa_circRNA_101213 | 4.76 |
hsa_circRNA_405481 | −9.83 |
| 8 |
hsa_circRNA_101321 | 6.44 |
hsa_circRNA_102051 | −43.51 | 33 |
hsa_circRNA_003251 | 4.71 |
hsa_circRNA_406717 | −8.78 |
| 9 |
hsa_circRNA_023016 | 6.38 |
hsa_circRNA_405571 | −42.25 | 34 |
hsa_circRNA_406698 | 4.71 |
hsa_circRNA_104084 | −8.65 |
| 10 |
hsa_circRNA_019744 | 6.36 |
hsa_circRNA_100789 | −41.83 | 35 |
hsa_circRNA_101924 | 4.69 |
hsa_circRNA_103673 | −8.3 |
| 11 |
hsa_circRNA_000808 | 6.25 |
hsa_circRNA_406494 | −40.03 | 36 |
hsa_circRNA_006169 | 4.68 |
hsa_circRNA_092443 | −8.27 |
| 12 |
hsa_circRNA_102950 | 6.24 |
hsa_circRNA_100787 | −36.23 | 37 |
hsa_circRNA_001490 | 4.63 |
hsa_circRNA_059571 | −8.15 |
| 13 |
hsa_circRNA_102949 | 5.98 |
hsa_circRNA_082319 | −33.45 | 38 |
hsa_circRNA_104670 | 4.58 |
hsa_circRNA_055243 | −7.99 |
| 14 |
hsa_circRNA_008882 | 5.92 |
hsa_circRNA_402458 | −29.32 | 39 |
hsa_circRNA_100532 | 4.5 |
hsa_circRNA_043637 | −7.89 |
| 15 |
hsa_circRNA_405975 | 5.8 |
hsa_circRNA_400850 | −26.69 | 40 |
hsa_circRNA_050898 | 4.46 |
hsa_circRNA_007059 | −7.72 |
| 16 |
hsa_circRNA_092447 | 5.78 |
hsa_circRNA_087631 | −20.89 | 41 |
hsa_circRNA_101491 | 4.46 |
hsa_circRNA_005178 | −7.71 |
| 17 |
hsa_circRNA_401459 | 5.78 |
hsa_circRNA_056731 | −19.83 | 42 |
hsa_circRNA_100498 | 4.37 |
hsa_circRNA_407285 | −7.5 |
| 18 |
hsa_circRNA_105055 | 5.74 |
hsa_circRNA_102213 | −19.07 | 43 |
hsa_circRNA_009618 | 4.35 |
hsa_circRNA_407173 | −7.46 |
| 19 |
hsa_circRNA_000324 | 5.71 |
hsa_circRNA_052372 | −16.59 | 44 |
hsa_circRNA_030431 | 4.35 |
hsa_circRNA_010027 | −7.38 |
| 20 |
hsa_circRNA_100043 | 5.7 |
hsa_circRNA_103336 | −14.16 | 45 |
hsa_circRNA_082672 | 4.33 |
hsa_circRNA_101539 | −7.34 |
| 21 |
hsa_circRNA_100993 | 5.57 |
hsa_circRNA_103783 | −13.88 | 46 |
hsa_circRNA_100703 | 4.32 |
hsa_circRNA_005389 | −7.3 |
| 22 |
hsa_circRNA_405814 | 5.49 |
hsa_circRNA_028883 | −12.55 | 47 |
hsa_circRNA_048474 | 4.3 |
hsa_circRNA_403520 | −7.26 |
| 23 |
hsa_circRNA_104113 | 5.17 |
hsa_circRNA_002829 | −11.74 | 48 |
hsa_circRNA_405116 | 4.26 |
hsa_circRNA_404577 | −7.23 |
| 24 |
hsa_circRNA_406951 | 5.09 |
hsa_circRNA_405359 | −11.5 | 49 |
hsa_circRNA_405628 | 4.25 |
hsa_circRNA_102619 | −7.23 |
| 25 |
hsa_circRNA_401696 | 5.08 |
hsa_circRNA_407270 | −11.43 | 50 |
hsa_circRNA_000799 | 4.24 |
hsa_circRNA_001808 | −7.09 |
|
| C, Top 50
differentially expressed circRNAs in AGPS sh vs. AGPS KO group in
human thyroid cancer FRO cells |
|
|
| AGPS sh vs. AGPS
KO |
| AGPS sh vs. AGPS
KO |
|
|
|
|
|
| no. | circRNA | Up,
fold-change | circRNA | Down,
fold | No. | circRNA | Up,
fold-change | circRNA | Down,
fold |
|
| 1 |
hsa_circRNA_082319 | 57.98 |
hsa_circRNA_089761 | −28.57 | 26 |
hsa_circRNA_056731 | 12.58 |
hsa_circRNA_006562 | −4.79 |
| 2 |
hsa_circRNA_406494 | 51.07 |
hsa_circRNA_089762 | −9.56 | 27 |
hsa_circRNA_104270 | 10.66 |
hsa_circRNA_009618 | −4.73 |
| 3 |
hsa_circRNA_402458 | 48.99 |
hsa_circRNA_089763 | −9.55 | 28 |
hsa_circRNA_400850 | 10.38 |
hsa_circRNA_074298 | −4.68 |
| 4 |
hsa_circRNA_052372 | 47.87 |
hsa_circRNA_008882 | −9.38 | 29 |
hsa_circRNA_102334 | 10.05 |
hsa_circRNA_088194 | −4.55 |
| 5 |
hsa_circRNA_087631 | 46.06 |
hsa_circRNA_000324 | −6.67 | 30 |
hsa_circRNA_090364 | 9.74 |
hsa_circRNA_405116 | −4.53 |
| 6 |
hsa_circRNA_102213 | 39.35 |
hsa_circRNA_000543 | −6.32 | 31 |
hsa_circRNA_102389 | 8.56 |
hsa_circRNA_105044 | −4.42 |
| 7 |
hsa_circRNA_001729 | 31.2 |
hsa_circRNA_000808 | −5.91 | 32 |
hsa_circRNA_004183 | 7.9 |
hsa_circRNA_035222 | −4.38 |
| 8 |
hsa_circRNA_000367 | 26.3 |
hsa_circRNA_002082 | −5.68 | 33 |
hsa_circRNA_406495 | 7.77 |
hsa_circRNA_103349 | −4.36 |
| 9 |
hsa_circRNA_405359 | 23.41 |
hsa_circRNA_100498 | −5.63 | 34 |
hsa_circRNA_102619 | 7.75 |
hsa_circRNA_100993 | −4.35 |
| 10 |
hsa_circRNA_007059 | 21.14 |
hsa_circRNA_100703 | −5.59 | 35 |
hsa_circRNA_404607 | 7.63 |
hsa_circRNA_102950 | −4.3 |
| 11 |
hsa_circRNA_103309 | 20.83 |
hsa_circRNA_401696 | −5.44 | 36 |
hsa_circRNA_102651 | 7.37 |
hsa_circRNA_000799 | −4.21 |
| 12 |
hsa_circRNA_104084 | 20.6 |
hsa_circRNA_092447 | −5.42 | 37 |
hsa_circRNA_103145 | 7.31 |
hsa_circRNA_406447 | −4.2 |
| 13 |
hsa_circRNA_010027 | 19.43 |
hsa_circRNA_001873 | −5.4 | 38 |
hsa_circRNA_404705 | 7.3 |
hsa_circRNA_003251 | −4.19 |
| 14 |
hsa_circRNA_405571 | 18.95 |
hsa_circRNA_102949 | −5.31 | 39 |
hsa_circRNA_001676 | 6.95 |
hsa_circRNA_406752 | −3.99 |
| 15 |
hsa_circRNA_055243 | 18.53 |
hsa_circRNA_101965 | −5.29 | 40 |
hsa_circRNA_006440 | 6.85 |
hsa_circRNA_058097 | −3.93 |
| 16 |
hsa_circRNA_404686 | 18.44 |
hsa_circRNA_105055 | −5.25 | 41 |
hsa_circRNA_101710 | 6.79 |
hsa_circRNA_101321 | −3.9 |
| 17 |
hsa_circRNA_100790 | 18.34 |
hsa_circRNA_000181 | −5.2 | 42 |
hsa_circRNA_002829 | 6.65 |
hsa_circRNA_100834 | −3.81 |
| 18 |
hsa_circRNA_102049 | 18.21 |
hsa_circRNA_406951 | −5.19 | 43 |
hsa_circRNA_103783 | 6.6 |
hsa_circRNA_034642 | −3.75 |
| 19 |
hsa_circRNA_102051 | 16.69 |
hsa_circRNA_402565 | −5.15 | 44 |
hsa_circRNA_400380 | 6.56 |
hsa_circRNA_092390 | −3.74 |
| 20 |
hsa_circRNA_405481 | 16.45 |
hsa_circRNA_030431 | −4.98 | 45 |
hsa_circRNA_079201 | 6.44 |
hsa_circRNA_407029 | −3.73 |
| 21 |
hsa_circRNA_100789 | 15.95 |
hsa_circRNA_006050 | −4.92 | 46 |
hsa_circRNA_101366 | 6.41 |
hsa_circRNA_104113 | −3.69 |
| 22 |
hsa_circRNA_101539 | 15.28 |
hsa_circRNA_405975 | −4.9 | 47 |
hsa_circRNA_100988 | 6.41 |
hsa_circRNA_102686 | −3.67 |
| 23 |
hsa_circRNA_100787 | 14.68 |
hsa_circRNA_103297 | −4.9 | 48 |
hsa_circRNA_028883 | 6.37 |
hsa_circRNA_400620 | −3.62 |
| 24 |
hsa_circRNA_092368 | 13.87 |
hsa_circRNA_003391 | −4.84 | 49 |
hsa_circRNA_405069 | 6.19 |
hsa_circRNA_100043 | −3.54 |
| 25 |
hsa_circRNA_101541 | 13.44 |
hsa_circRNA_100395 | −4.83 | 50 |
hsa_circRNA_007881 | 6.13 |
hsa_circRNA_406768 | −3.54 |
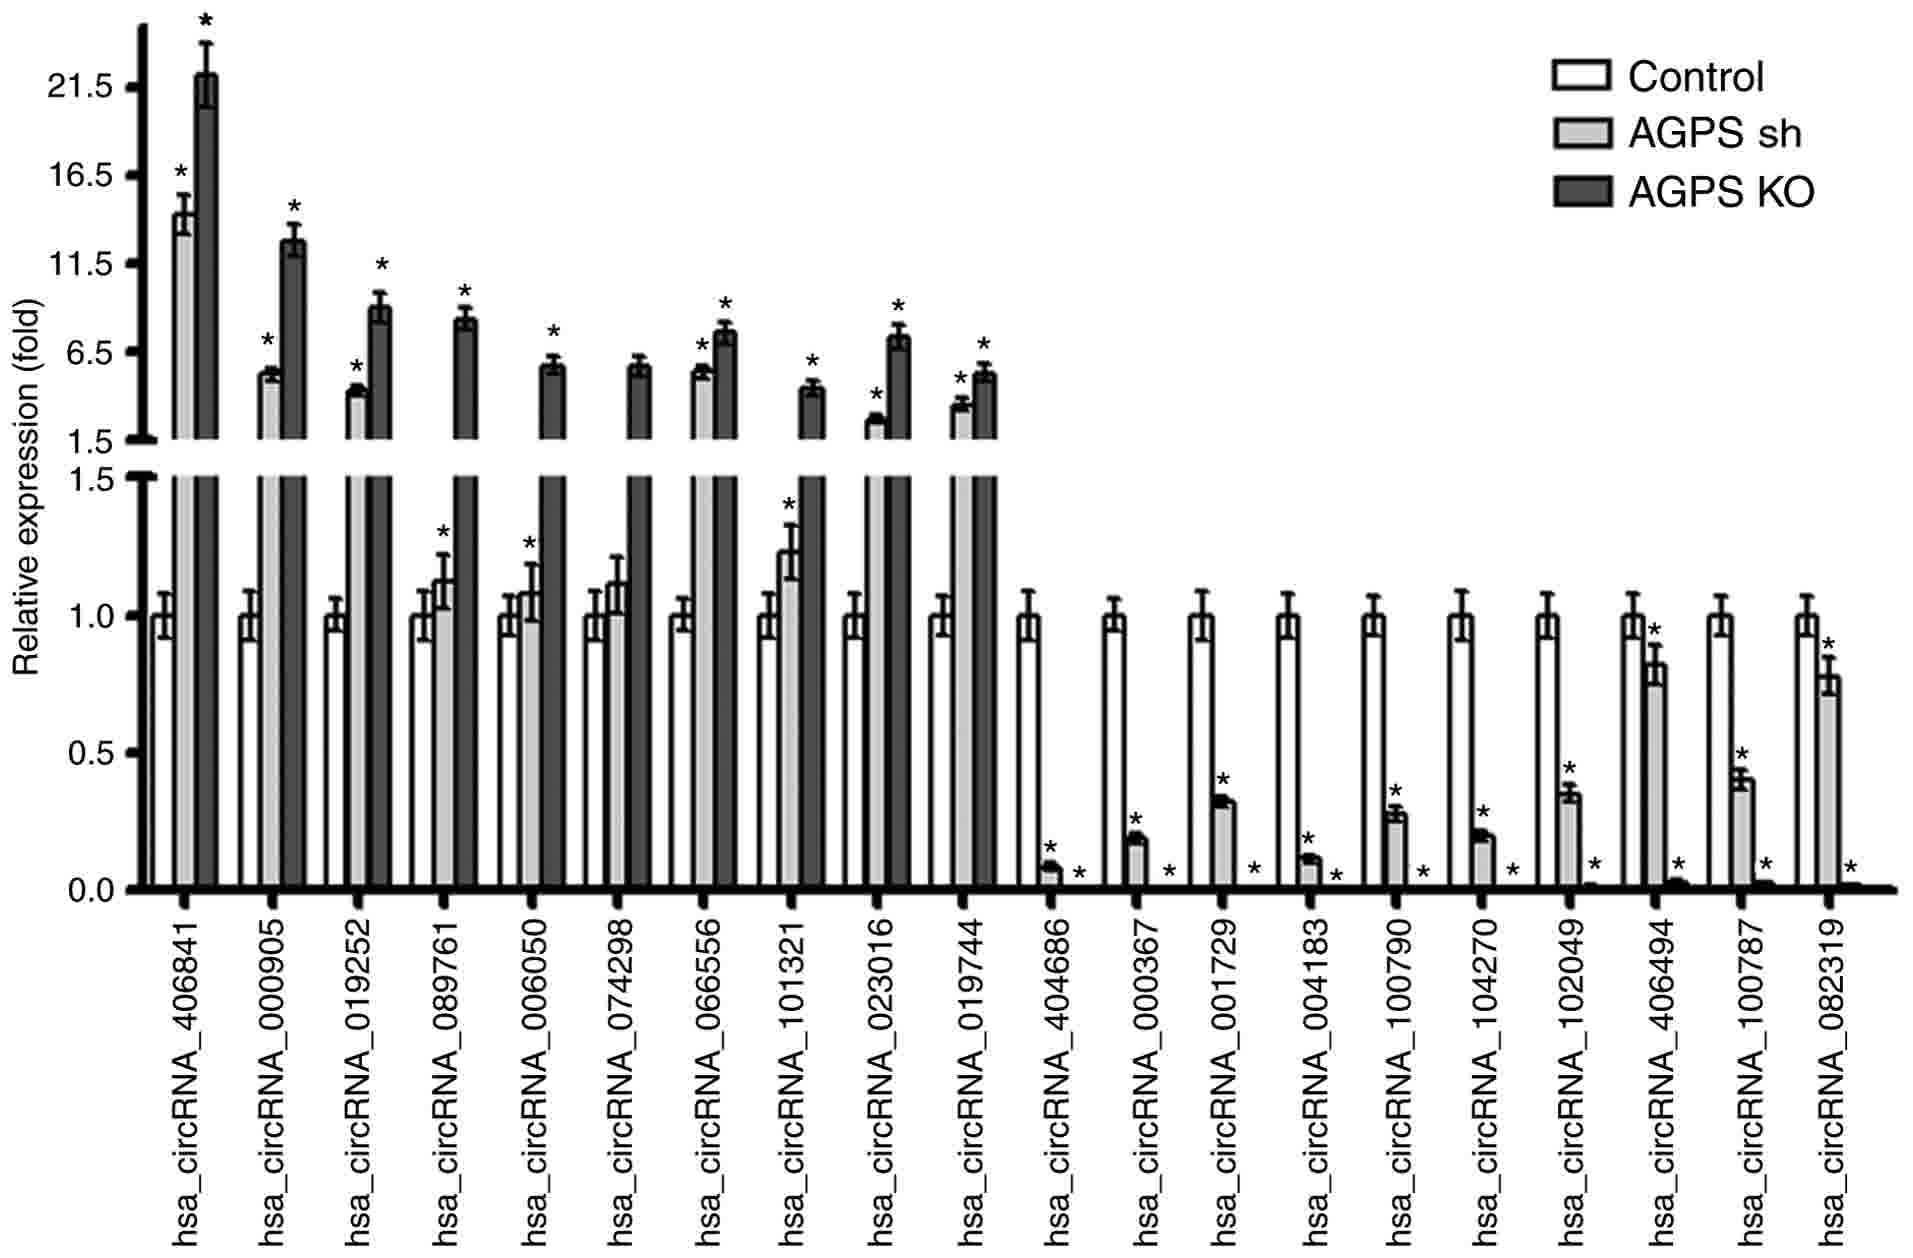
To further confirm the regulatory effect of AGPS on
circRNA expression in the human thyroid carcinoma cell line FRO,
the top 10 circRNAs with increased expression [including Homo
sapiens (hsa)_circRNA_406841, hsa_circRNA_000905 and
hsa_circRNA_019252] and the top 10 circRNAs with decreased
expression (including hsa_circRNA_404686, hsa_circRNA_000367 and
hsa_circRNA_001729) in the AGPS KO group compared with the control
group were verified using RT-qPCR. The results were consistent with
the gene chip results. As presented in Fig. 5, the expression of hsa_circRNA_406841,
hsa_circRNA_000905, hsa_circRNA_019252, hsa_circRNA_089761,
hsa_circRNA_006050, hsa_circRNA_074298, hsa_circRNA_066556,
hsa_circRNA_101321, hsa_circRNA_023016 and hsa_circRNA_019744 was
increased in the AGPS sh and KO groups compared with the control
group (P<0.05). By contrast, the expression of
hsa_circRNA_404686, hsa_circRNA_000367, hsa_circRNA_001729,
hsa_circRNA_004183, hsa_circRNA_100790, hsa_circRNA_104270,
hsa_circRNA_102049, hsa_circRNA_406494, hsa_circRNA_100787 and
hsa_circRNA_082319 was decreased in the AGPS sh and KO groups
compared with the control group (P<0.05).
GO enrichment analysis
GO enrichment analysis was used to classify the
differently expressed circRNAs in the control, AGPS sh and AGPS KO
groups in terms of the life processes regulated by these circRNAs.
The results of silencing AGPS were compared with the control and
AGPS KO groups in Fig. 6A-D, whereas
the AGPS KO group was compared with the control group in terms of
molecular function, biological process and cellular component in
Fig. 6E and F. The main biological
processes were cell adhesion, cell cycle and metabolism; the main
cellular components were nucleoplasm, membrane and cytoskeleton;
and the main molecular functions were protein binding, poly(A) RNA
binding and adenosine 5′-triphosphate binding.
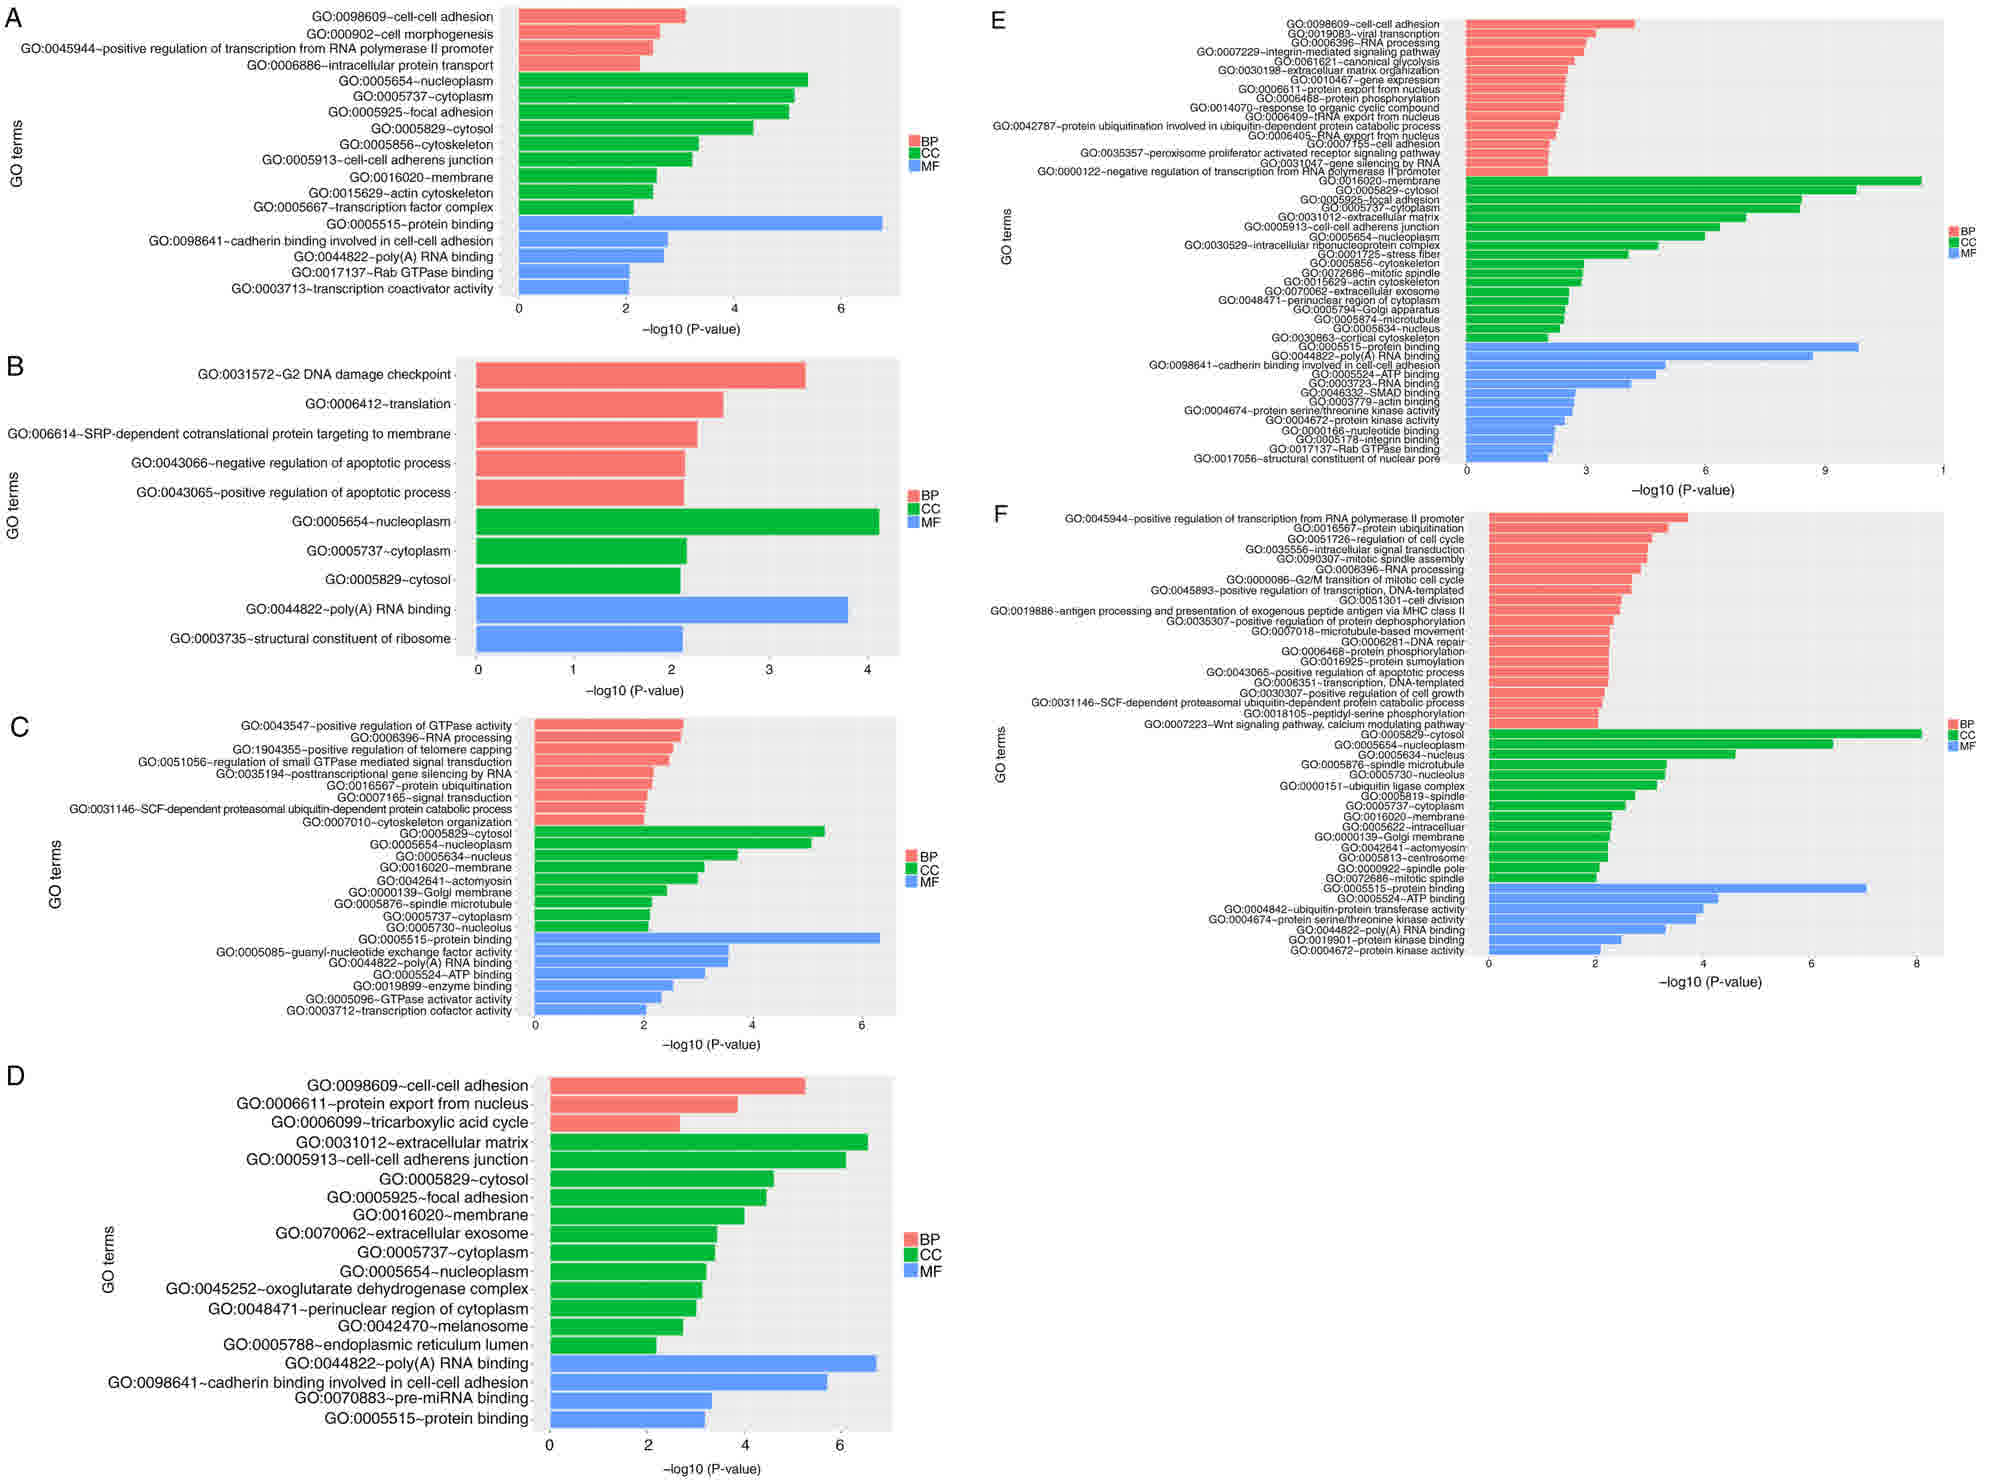 | Figure 6.GO analysis of AGPS silencing in
thyroid cancer FRO cells. GO analysis was performed on the up- and
downregulated genes identified in the AGPS sh, AGPS KO and control
thyroid cancer FRO cells. The y-axis represented gene ontology
entries, the x-axis represented -log10 (P-value). -log10 (P-value)
>2 was considered to indicate a significant threshold. (A)
Upregulation and (B) downregulation of MF, BP and CC by GO analysis
of AGPS silencing in FRO cells compared with control thyroid cancer
FRO cells. (C) Upregulation and (D) downregulation of MF, BP and CC
by GO analysis of AGPS silencing in FRO cells compared with AGPS KO
in thyroid cancer FRO cells. (E) Upregulation and (F)
downregulation of MF, BP and CC by GO analysis of AGPS KO compared
with control thyroid cancer FRO cells. GO, Gene Ontology; AGPS,
alkylglycerone phosphate synthase; sh, short hairpin; KO, knockout;
MF, molecular function; BP, biological process; CC, cellular
component. |
KEGG pathway enrichment analysis
The KEGG pathway enrichment analysis was similar to
that of GO enrichment, which was used to identify genes enriched in
a pathway to analyze the effect of AGPS silencing and KO on
regulatory functions and signaling pathways. The results of AGPS sh
compared with the control and AGPS KO groups are presented in
Fig. 7A and B, whereas AGPS KO was
compared with the control group in terms of regulatory functions
and signaling pathways in Fig. 7C. It
was observed that activity of the cyclic guanosine
3′,5′-monophosphate (cGMP)-protein kinase G (PKG) and
mitogen-activated protein kinase (MAPK) signaling pathways was
increased, whereas the regulation of biosynthesis and metabolism
was decreased.
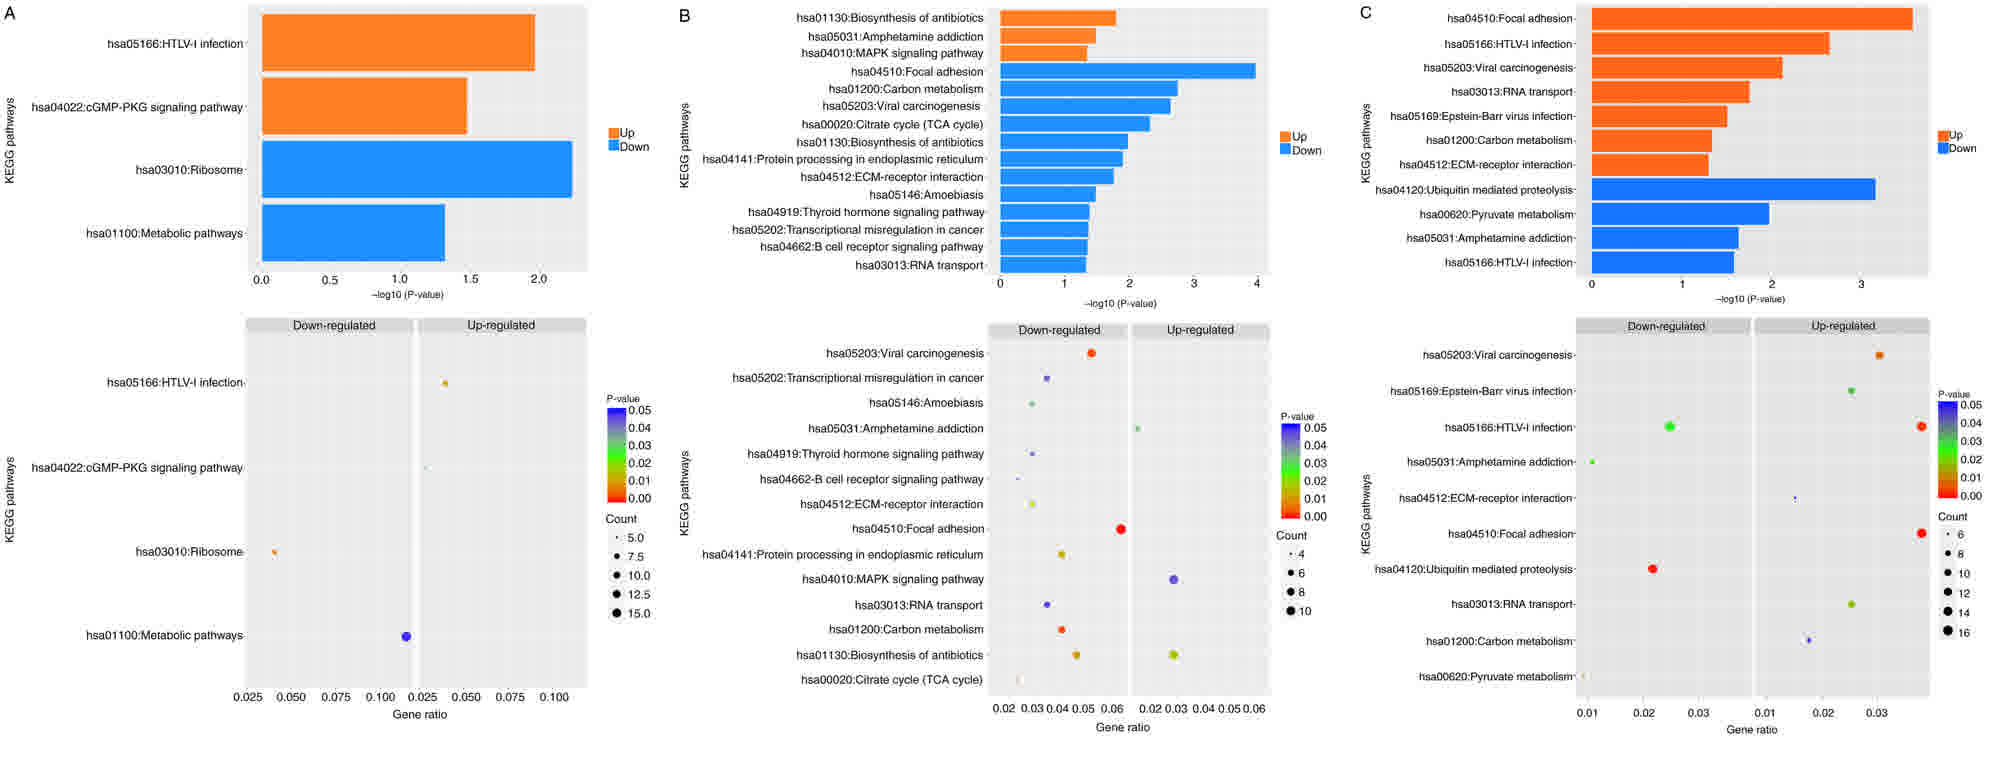 | Figure 7.KEGG pathway enrichment analysis of
AGPS silencing in thyroid cancer FRO cells. KEGG pathway enrichment
analysis is represented by histograms and scatter diagrams. Orange
represents the pathway of upregulation gene enrichment, whereas
blue represents the downregulated pathway of gene enrichment. The
left and right sides of the scatter diagrams correspond to the
downregulated and upregulated gene enrichment pathways,
respectively. The x-axes represent the proportion of enriched
genes, whereas the y-axes contain the name of the KEGG pathway. If
up- or downregulated genes were enriched in a certain pathway, this
pathway was represented as a point in the graph, the color of which
indicated a significant P-value, whereas its size represented the
number of differentially expressed genes in that particular
pathway. Effect of regulatory function and signaling pathway by
KEGG pathway enrichment analysis of AGPS silencing compared with
(A) control and (B) KO thyroid cancer FRO cells. (C) Effect of
regulatory function and signaling pathway by KEGG pathway
enrichment analysis of AGPS KO compared with control thyroid cancer
FRO cells. KEGG, Kyoto Encyclopedia of Genes and Genomes; AGPS,
alkylglycerone phosphate synthase; KO, knockout; hsa, Homo
sapiens. |
Discussion
The occurrence and development of thyroid cancer is
a complex biological process (16).
The abnormal gene expression involved in signal transduction in
tumor cells regulates a series of functional genes abnormal
expression, which leads to the acquisition by tumor cells of
various characteristics that are different from those of normal
cells, and induces cell carcinogenesis, malignant proliferation,
invasion and apoptosis resistance (17–20).
AGPS has an increased expression in tumor cells and
may regulate cancer progression via lipid metabolism. Our previous
study used shRNA technology to knock out AGPS expression in thyroid
cancer cells, which significantly decreased the proliferation and
invasion of tumor cells in vitro, leading to cell cycle
arrest and recovery of sensitivity towards cisplatin by the
cisplatin-resistant U87MG/DDP cells, inducing cell apoptosis and
inhibition of lipid expression (including lysophosphatidic acid and
arachidic acid) in cancer (4,5).
Our study revealed AGPS expression in different
malignant thyroid cancer cell lines. Therefore, AGPS was considered
as a potential novel target of thyroid cancer. In order to
understand the underlying molecular mechanism of thyroid cancer,
the malignant thyroid cancer cell line FRO was used in the present
study to explore the association between AGPS and circRNAs in
thyroid cancer.
The specificity of circRNAs is markedly
tissue-specific and developmental stage-dependent (21). These molecules have potential as novel
thyroid cancer diagnostic markers and therapeutic targets (16). The present study investigated the
effect of silencing or knocking out AGPS expression in thyroid
cancer cells, and identified that AGPS silencing or KO was able to
regulate the expression of circRNAs. This regulatory function was
further confirmed using RT-qPCR.
To the best of our knowledge, no studies on the
function and predicted expression of circRNAs in thyroid cancer
have been published to date. The present study revealed that
various circRNAs were able to regulate the functions of cell
adhesion, cell cycle and metabolism in thyroid cancer. It was
observed that the downregulation of AGPS and circRNAs expression
had a significant effect on the regulation of biological functions,
including cell adhesion, cell cycle and metabolism in various tumor
types; however, their effects on the thyroid cancer was not
explored in the present study. Therefore, the function of AGPS and
circRNAs in thyroid cancer will be investigated in future studies
as a result of the foundation from the present study.
Acknowledgements
Not applicable.
Funding
The present study was supported by the National
Natural Science Foundation of China (grant no. 31501159), Tianjin
Public Health Key Research Project (grant no. 15KG108), Tianjin
Science and Technology Key Project on Chronic Diseases Prevention
and Treatment (grant no. 16ZXMJSY00020) and the Special Program of
Talents Development for Excellent Youth Scholars in Tianjin, China
(grant no. TJTZJH-QNBJRC-2-9).
Availability of data and materials
All data generated or analyzed during this study are
included in this published article.
Authors' contributions
YZ was responsible for the conception and design of
the study. SH and BY were responsible for acquisition of data. LH
and JT were responsible for data interpretation.
Ethics approval and consent to
participate
Not applicable.
Consent for publication
Not applicable.
Competing interests
The authors declare that they have no competing
interests.
References
|
1
|
Liu JW, Chen C, Loh EW, Chu CC, Wang MY,
Ouyang HJ, Chang YT, Zhuang WZ, Chou CW, Huang DJ, et al: Tyrosine
kinase inhibitors for advanced or metastatic thyroid cancer: A
meta-analysis of randomized controlled trials. Curr Med Res Opin.
1–9. 2017.
|
|
2
|
Zheng R, Zeng H, Zhang S and Chen W:
Estimates of cancer incidence and mortality in China, 2013. Chin J
Cancer. 36:662017. View Article : Google Scholar : PubMed/NCBI
|
|
3
|
Zhu L, Li XJ, Kalimuthu S, Gangadaran P,
Lee HW, Oh JM, Baek SH, Jeong SY, Lee SW, Lee J and Ahn BC: Natural
killer cell (NK-92MI)-based therapy for pulmonary metastasis of
anaplastic thyroid cancer in a nude mouse model. Front Immunol.
8:8162017. View Article : Google Scholar : PubMed/NCBI
|
|
4
|
Zhu Y, Zhu L, Lu L, Zhang L, Zhang G, Wang
Q and Yang P: Role and mechanism of the alkylglycerone phosphate
synthase in suppressing the invasion potential of human glioma and
hepatic carcinoma cells in vitro. Oncol Rep. 32:431–436. 2014.
View Article : Google Scholar : PubMed/NCBI
|
|
5
|
Zhu Y, Liu XJ, Yang P, Zhao M, Lv LX,
Zhang GD, Wang Q and Zhang L: Alkylglyceronephosphate synthase
(AGPS) alters lipid signaling pathways and supports chemotherapy
resistance of glioma and hepatic carcinoma cell lines. Asian Pac J
Cancer Prev. 15:3219–3226. 2014. View Article : Google Scholar : PubMed/NCBI
|
|
6
|
Piano V, Benjamin DI, Valente S, Nenci S,
Marrocco B, Mai A, Aliverti A, Nomura DK and Mattevi A: Discovery
of inhibitors for the ether lipid-generating enzyme AGPS as
anti-cancer agents. ACS Chem Biol. 10:2589–2597. 2015. View Article : Google Scholar : PubMed/NCBI
|
|
7
|
Liang HF, Zhang XZ, Liu BG, Jia GT and Li
WL: Circular RNA circ-ABCB10 promotes breast cancer proliferation
and progression through sponging miR-1271. Am J Cancer Res.
7:1566–1576. 2017.PubMed/NCBI
|
|
8
|
Huang YS, Jie N, Zou KJ and Weng Y:
Expression profile of circular RNAs in human gastric cancer
tissues. Mol Med Rep. 16:2469–2476. 2017. View Article : Google Scholar : PubMed/NCBI
|
|
9
|
Livak KJ and Schmittgen TD: Analysis of
relative gene expression data using real-time quantitative PCR and
the 2(-Delta Delta C(T)) method. Methods. 25:402–408. 2001.
View Article : Google Scholar : PubMed/NCBI
|
|
10
|
Ritchie ME, Phipson B, Wu D, Hu Y, Law CW,
Shi W and Smyth GK: limma powers differential expression analyses
for RNA-sequencing and microarray studies. Nucleic Acids Res.
43:e472015. View Article : Google Scholar : PubMed/NCBI
|
|
11
|
Li W: Volcano plots in analyzing
differential expressions with mRNA microarrays. J Bioinform Comput
Biol. 10:12310032012. View Article : Google Scholar : PubMed/NCBI
|
|
12
|
Deng W, Wang Y, Liu Z, Cheng H and Xue Y:
HemI: A toolkit for illustrating heatmaps. PLoS One. 9:e1119882014.
View Article : Google Scholar : PubMed/NCBI
|
|
13
|
Bae HW, Rho S, Lee HS, Lee N, Hong S,
Seong GJ, Sung KR and Kim CY: Hierarchical cluster analysis of
progression patterns in open-angle glaucoma patients with medical
treatment. Invest Ophthalmol Vis Sci. 55:3231–3236. 2014.
View Article : Google Scholar : PubMed/NCBI
|
|
14
|
Huang da W, Sherman BT and Lempicki RA:
Systematic and integrative analysis of large gene lists using DAVID
bioinformatics resources. Nat Protoc. 4:44–57. 2009. View Article : Google Scholar : PubMed/NCBI
|
|
15
|
Gong P, Madak-Erdogan Z, Li J, Cheng J,
Greenlief CM, Helferich W, Katzenellenbogen JA and Katzenellenbogen
BS: Transcriptomic analysis identifies gene networks regulated by
estrogen receptor α (ERα) and ERβ that control distinct effects of
different botanical estrogens. Nucl Recept Signal.
12:e0012014.PubMed/NCBI
|
|
16
|
Peng N, Shi L, Zhang Q, Hu Y, Wang N and
Ye H: Microarray profiling of circular RNAs in human papillary
thyroid carcinoma. PLoS One. 12:e01702872017. View Article : Google Scholar : PubMed/NCBI
|
|
17
|
Zhao L, Sun H, Kong H, Chen Z, Chen B and
Zhou M: The Lncrna-TUG1/EZH2 axis promotes pancreatic cancer cell
proliferation, migration and EMT phenotype formation through
sponging Mir-382. Cell Physiol Biochem. 42:2145–2158. 2017.
View Article : Google Scholar : PubMed/NCBI
|
|
18
|
Li Z, Zhao K and Tian H: Integrated
analysis of differential expression and alternative splicing of
non-small cell lung cancer based on RNA sequencing. Oncol Lett.
14:1519–1525. 2017. View Article : Google Scholar : PubMed/NCBI
|
|
19
|
Honjo H, Toh Y, Sohda M, Suzuki S, Kaira
K, Kanai Y, Nagamori S, Oyama T, Yokobori T, Miyazaki T and Kuwano
H: Clinical significance and phenotype of MTA1 expression in
esophageal squamous cell carcinoma. Anticancer Res. 37:4147–4155.
2017.PubMed/NCBI
|
|
20
|
Liu H and Ye H: Screening of the
prognostic targets for breast cancer based co-expression modules
analysis. Mol Med Rep. 16:4038–4044. 2017. View Article : Google Scholar : PubMed/NCBI
|
|
21
|
Bonizzato A, Gaffo E, Kronnie Te G and
Bortoluzzi S: CircRNAs in hematopoiesis and hematological
malignancies. Blood Cancer J. 6:e4832016. View Article : Google Scholar : PubMed/NCBI
|