Introduction
Pancreatic ductal adenocarcinoma (PDAC) is a lethal
neoplasm due to its potential for distant metastasis in early
stages of the disease, and it has a five-year survival rate of
approximately 6% (1). PDAC has poor
prognosis because it is difficult to detect in the early stages and
exhibits rapid progression (2).
Although surgery is the only treatment option that improves
survival, it is curative in only 10–20% of cases (3). Therefore, to improve the prognosis of
patients with pancreatic cancer, novel therapeutic agents need to
be developed.
Recently, iron metabolism has been targeted for the
development of new cancer therapeutic agents. Iron is associated
with many vital reactions such as respiration and is essential for
life support; it helps oxygen molecules bind to hemoglobin and acts
as an important catalytic center for many enzymes, e.g.,
cytochromes (4). Iron is incorporated
into the enzymes and proteins required for important cellular
processes, such as oxygen transport, proliferation and energy
production (5). Iron absorption in
the duodenum and upper jejunum is highly regulated to maintain iron
levels in the body (6). However, iron
works as a double-edged sword; iron overload is a risk factor for
cancer, presumably through the generation of reactive oxygen
species (ROS). ROS include superoxide (O2•-), peroxides
(H2O2 and ROOH), and free radicals (HO• and
RO•), which are generated through the Fenton reaction. This
persistent oxidative stress has been shown to induce carcinogenesis
(7–9).
Cancer cells also depend on iron for proliferation;
JARID1B, a well-known example, is an epigenetic factor that works
as an H3K4 demethylase and activates cell growth in melanoma,
esophageal cancer, colon cancer, breast cancer, and prostate cancer
(10–14). Iron is required as a cofactor to
upregulate JARID1B activity (13).
Conversely, several studies have shown that iron deprivation
inhibits in vitro tumor growth (15).
Hepcidin is a key peptide hormone that regulates
iron homeostasis in chordates and is produced by the liver in
response to inflammatory stimuli and iron overload (16,17).
Hepcidin is a small antimicrobial peptide that inhibits iron
absorption by enterocytes, iron release from macrophages, and iron
transport across the placenta. The role of hepcidin is shown to be
related to its regulation of the iron transporter ferroportin
(18). Ferroportin is an important
regulator of iron metabolism in the body and is a membrane
transport protein that transfers intracellular iron to the
extracellular environment. Reduced ferroportin expression on the
cell surface leads to an increase in intracellular free iron,
making the tumor cells more aggressive (19). Hepcidin binds to ferroportin on the
cell surface and induces ferroportin internalization and
degradation, which elevates the intracellular iron levels (20). In breast tumors, it has been suggested
that tumor hepcidin expression is marginally increased relative to
adjacent tissues. By contrast, tumor ferroportin concentration is
greatly reduced in breast tumors, particularly in malignant tumors,
compared with concentration in adjacent tissues (21).
Therefore, we hypothesized that high hepcidin
expression levels contribute to a decrease in the expression of its
downstream receptor ferroportin and an increase in intracellular
iron retention, which accelerates tumor malignancy (tumor cell
growth and disease progression) in patients with pancreatic cancer
and finally leads to poor outcomes of the disease. In the present
study, we examined whether hepcidin and ferroportin expressions are
associated with prognosis of patients with pancreatic cancer.
Materials and methods
Patients and paraffin-embedded tissue
samples
Ninety-two pancreatic tissue samples in total were
obtained from patients with pancreatic cancer who received curative
surgery between March 2007 and September 2013 at the Department of
Gastroenterological Surgery, Osaka University Hospital. These
samples were fixed in 10% formaldehyde and embedded in paraffin. We
diagnosed the clinicopathological stage according to the Union for
International Cancer Control TNM Classification of Malignant
Tumors, 7th edition. The use of paraffin blocks in this study was
approved by the Institutional Review Board. We obtained written
consent from all patients at the beginning of the study. The
present study was performed as a retrospective study on
samples.
Immunohistochemical staining
Immunohistochemical staining was performed using the
previously described method (22).
Briefly, paraffin blocks were cut into 4-µm sections. Next, the
sections were deparaffinized in xylene and treated with a boiled
antigen retrieval solution; endogenous peroxidase activity was
blocked using 0.3% hydrogen peroxide for 20 min at room
temperature, and the sections were incubated overnight at 4°C with
a specific antibody [anti-hepcidin antibody: Mouse monoclonal,
1:100 dilution (Abcam, Cambridge, MA, USA); anti-SLC40A1: Rabbit
polyclonal, 1:200 dilution (Abcam)]. As a positive control for
hepcidin antibodies, a liver sample was used, and as a positive
control for ferroportin antibodies, a colon sample was used.
Thereafter, the sections were incubated with a secondary antibody
for 1 h at room temperature and assessed using avidin-biotin
complex reagents (Vector Laboratories, Inc., Burlingame, CA, USA).
The sections stained for hepcidin and ferroportin were incubated in
3,3′-diaminobenzidine for 1.5 and 2.5 min, respectively.
Subsequently, all sections were counterstained with
hematoxylin.
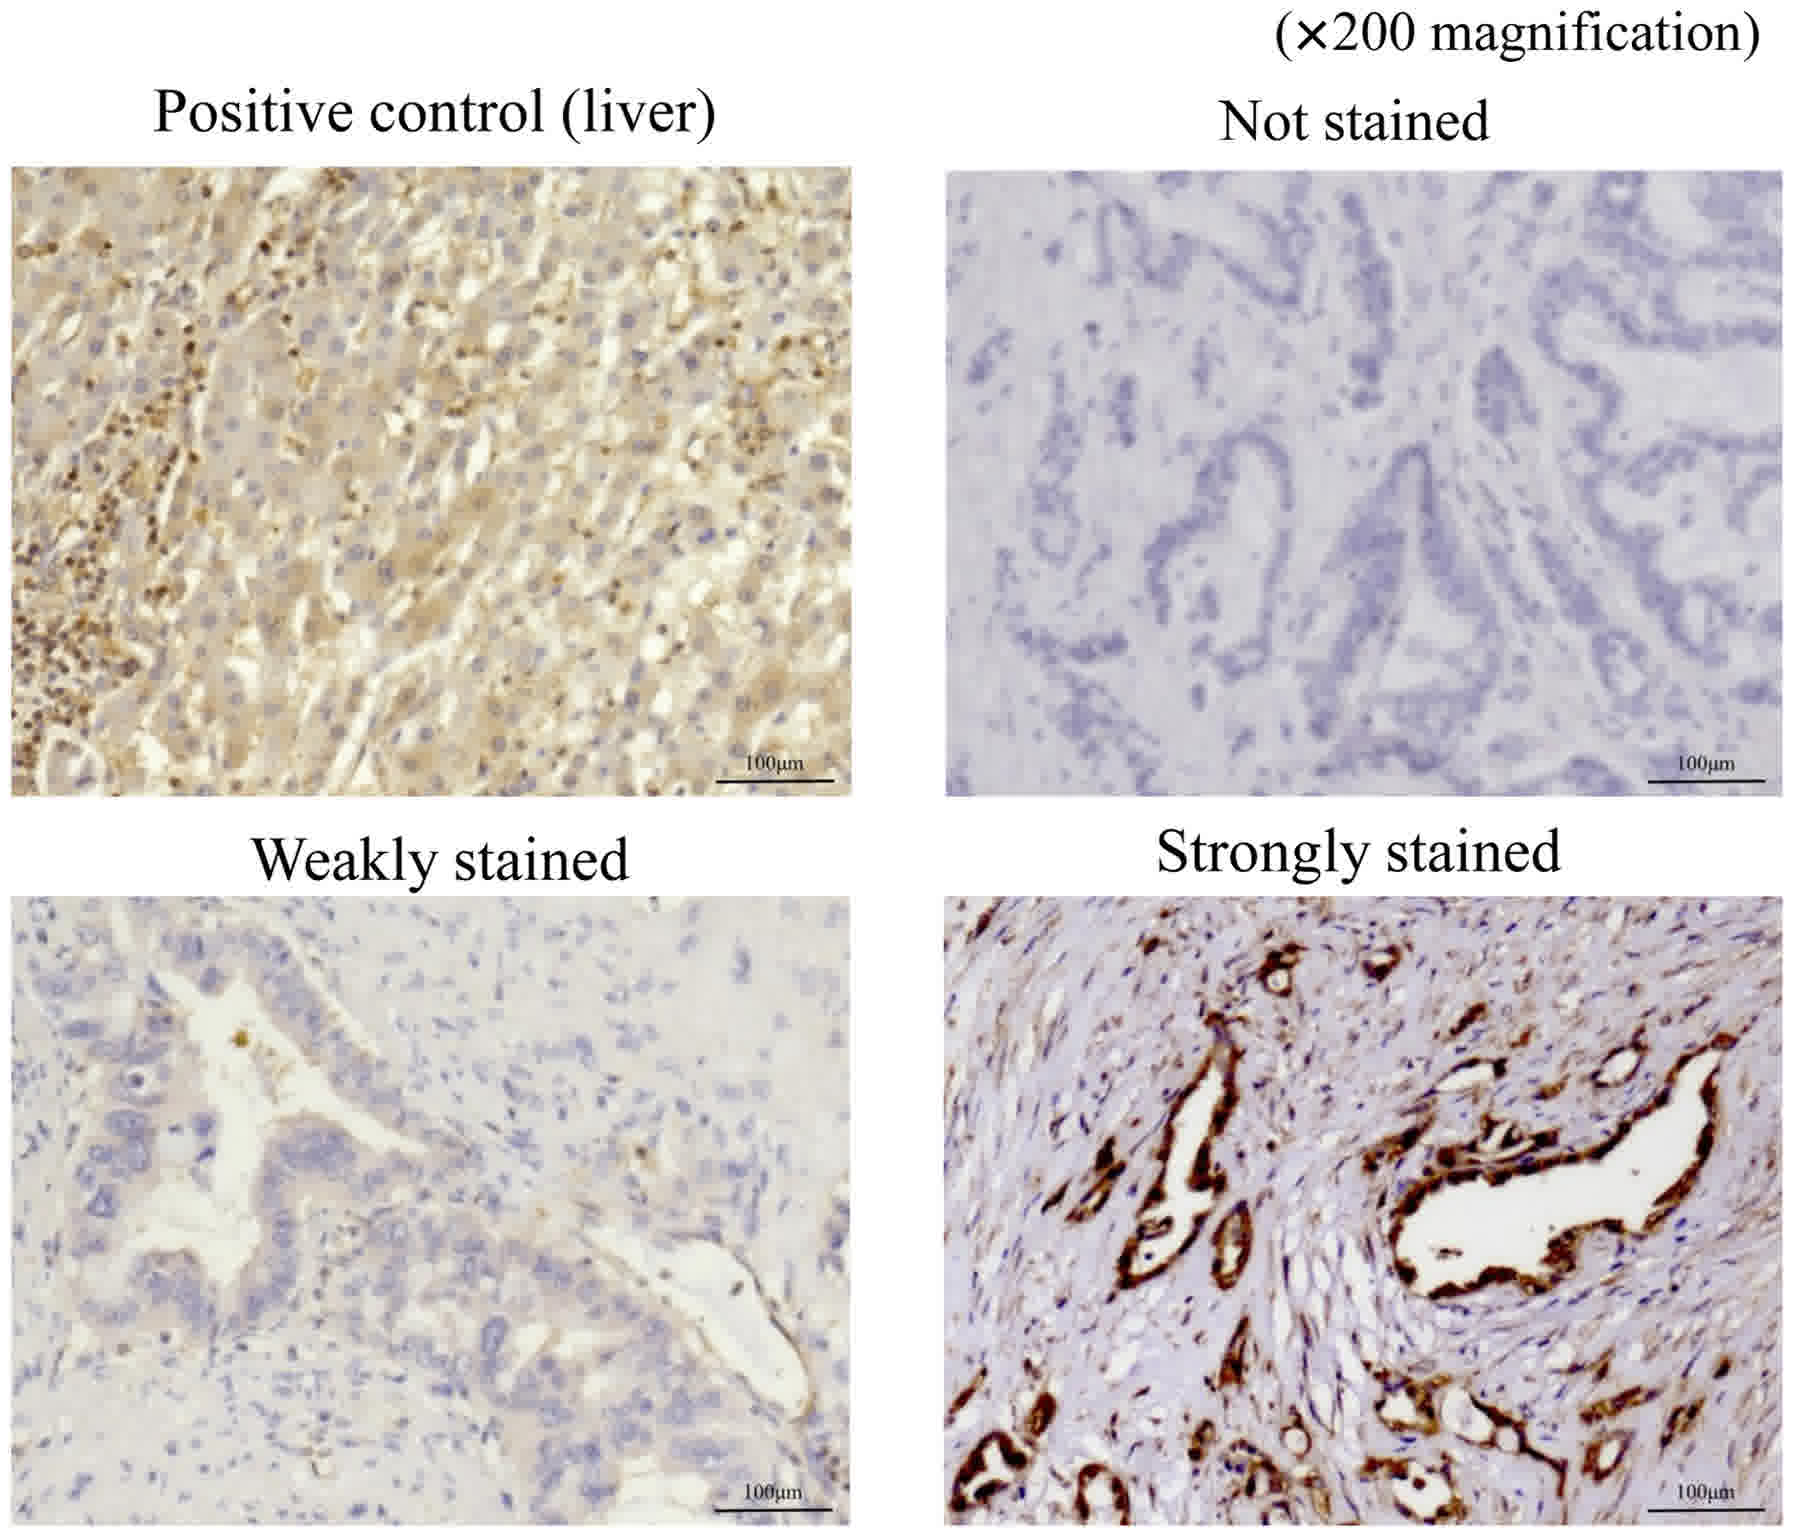
Evaluation of hepcidin and ferroportin
expression in pancreatic cancer tissues
Expressions of hepcidin and ferroportin were
evaluated according to the staining intensity of pancreatic duct
epithelial cells in cancer tissues. Pancreatic duct epithelial
cells exhibiting the same or higher staining intensity as that of
the positive control were classified as the strongly-stained group,
whereas those exhibiting weaker staining intensity than that of the
control and the cells that were not stained at all were classified
as the weakly-stained group. The evaluation of immunostaining
intensity was performed by two observers (R.T and M.M.).
Statistical analysis
Continuous variables were expressed as mean ±
standard deviation. The associations between categorical variables
and hepcidin or ferroportin expression were assessed using the
Pearson chi-squared test. Overall survival (OS) was defined as the
time elapsed from the date of surgery until the date of
tumor-induced death or the last follow-up, and was assessed using
the Kaplan-Meier method; the log-rank test was used for
comparisons. Recurrence-free survival (RFS) was defined as the time
elapsed from the date of surgery until the date of tumor-recurrence
or the last follow-up.
Univariate and multivariable Cox proportional hazard
models were used to explore the association between age, sex, tumor
size, location, histopathological type, pathological T factor (pT),
pN, pathological stage (pStage), vascular invasion, neural invasion
and adjuvant chemotherapy, and hepcidin expression. These models
were used in evaluating the OS and RFS. Ferroportin expression was
also evaluated in the same manner. P<0.05 was considered to
indicate a statistically significant difference. All statistical
analyses were performed using JMP Pro® 12 software (SAS
Institute Inc., Cary, NC, USA).
Results
Immunohistochemistry for hepcidin in
pancreatic cancer tissues
Table I shows the
clinicopathological features of 92 patients with pancreatic cancer
who underwent curative resection. Stained sections were classified
into three categories based on staining intensity: Not stained;
weakly stained (stained weaker than positive control); and strongly
stained (stained equal to or stronger than positive control;
Fig. 1). The sections that were
weakly stained or not stained were included in the weakly-stained
group, which comprised 26 patients, and those that were strongly
stained were included in the strongly-stained group, which
comprised 66 patients.
 | Table I.Clinicopathological features in 92
patients with pancreatic cancer. |
Table I.
Clinicopathological features in 92
patients with pancreatic cancer.
| Variables | Value |
|---|
| Age (years) | 67.3±9.99 |
| Sex (M/F) | 57/35 |
| Tumor size
(mm) | 24.8±12.0 |
| Location
(Ph/Pb/Pt) | 60/23/9 |
| Histopathological
type (tub/por/muc) | 87/4/1 |
| pT (1/2/3/4) | 17/9/65/1 |
| pN (0/1) | 61/31 |
| pStage
(IA/IB/IIA/IIB/III/IV) | 15/7/38/30/1/1 |
| Vascular invasion
(0/1 or 2 or 3) | 22/70 |
| Neural invasion
(0/1 or 2 or 3) | 16/76 |
| Adjuvant
chemotherapy (complete/failure) | 58/34 |
The clinicopathological features based on hepcidin
expression are summarized in Table
II. Among the examined pathological features, we detected a
significant difference in pStage and vascular invasion.
| Table II.Clinicopathological features based on
hepcidin expression. |
Table II.
Clinicopathological features based on
hepcidin expression.
| Variables | Weakly or not
stained (n=26) | Strongly stained
(n=66) | P-value |
|---|
| Age (≥65/<65
years) | 15:11 | 43:23 | 0.5045 |
| Sex (M/F) | 15:11 | 42:24 | 0.5970 |
| Tumor size
(≥20/<20 mm) | 12:14 | 45:21 | 0.0500 |
| Location (Ph/Pb or
Pt) |
19:7 | 41:25 | 0.3205 |
| Histopathological
type (por or muc/tub) | 2:24 |
3:63 | 0.5488 |
| pT (1 or 2/3 or
4) | 10:16 | 15:51 | 0.1266 |
| pN (0/1) | 21:5 | 39:27 | 0.0654 |
| pStage (IIB or III
or IV/IA or IB or IIA) | 5:21 | 39:27 | 0.0493a |
| Vascular invasion
(0/1 or 2 or 3) | 10:16 | 12:54 | 0.0400a |
| Neural invasion
(0/1 or 2 or 3) | 7:19 | 10:56 | 0.1902 |
| Adjuvant
chemotherapy (failure/complete) | 9:17 | 25:41 | 0.7703 |
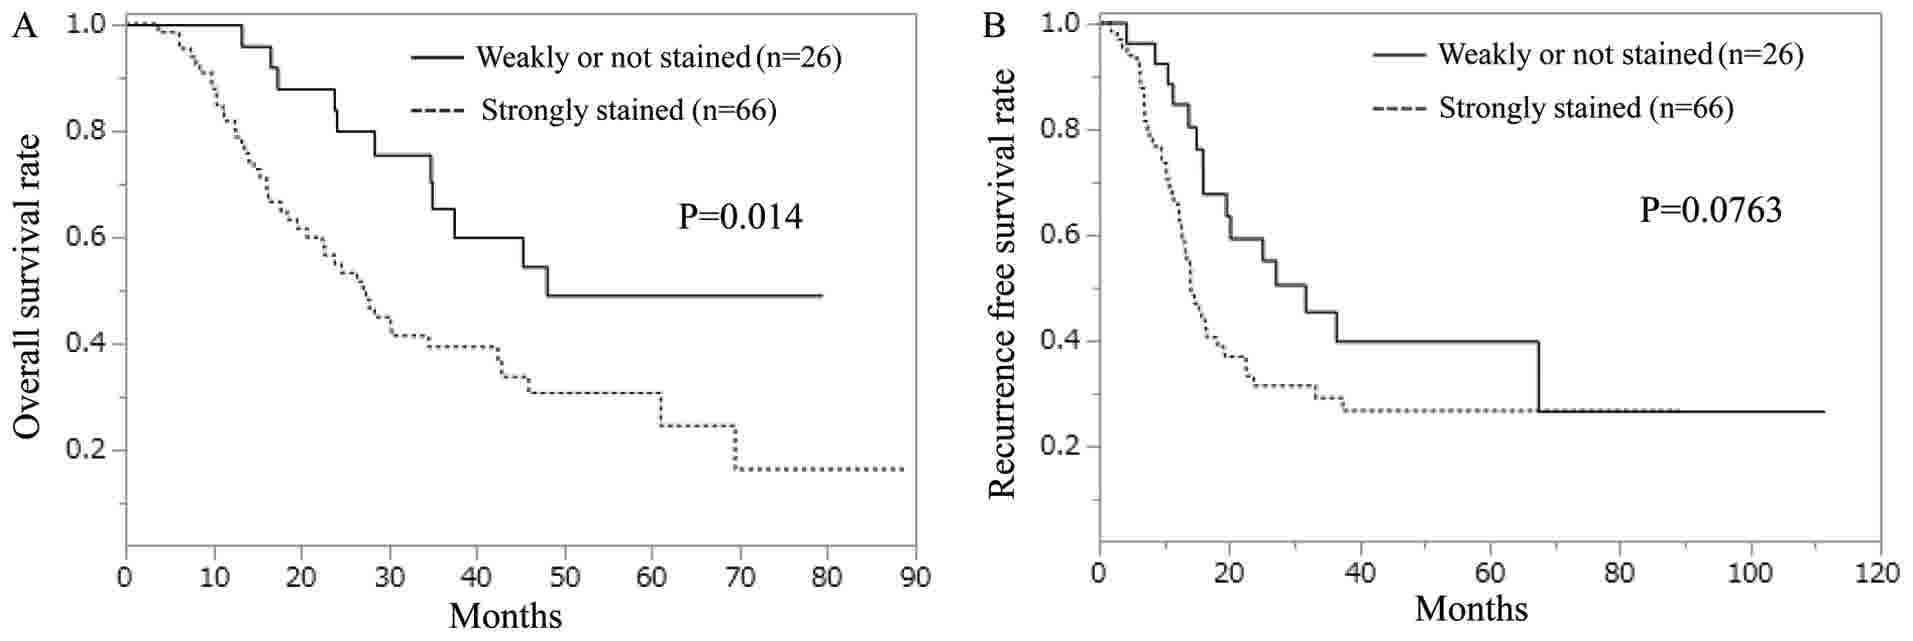
The strongly-stained hepcidin group exhibited a
significantly shorter OS than did the weakly-stained hepcidin group
(Fig. 2A). In terms of RFS, no
significant difference was observed between the strongly- and
weakly-stained hepcidin groups; however, the strongly-stained group
displayed a tendency toward worse RFS compared with the
weakly-stained group (Fig. 2B).
Univariate analysis revealed significant differences
in pN, pStage, vascular invasion, adjuvant chemotherapy, and
hepcidin expression (Table III).
pStage and vascular invasion were excluded from multivariate
analysis because they were associated with hepcidin expression, as
described in Table II. Multivariate
analysis indicated significant differences in pN, adjuvant
chemotherapy, and hepcidin expression; therefore, these items were
found to be independent prognostic factors.
| Table III.Univariate and multivariate analysis
for overall survival in relation to hepcidin staining. |
Table III.
Univariate and multivariate analysis
for overall survival in relation to hepcidin staining.
| Univariate
analysis | Multivariate
analysis |
|---|
|
|
|---|
| Variables | P-value | HR (95% CI) | P-value |
|---|
| Age (≥65/<65
years) | 0.1945 |
|
|
| Sex (M/F) | 0.9873 |
|
|
| Tumor size
(≥20/<20 mm) | 0.0513 |
|
|
| Location (Ph/Pb or
Pt) | 0.9346 |
|
|
| Histopathological
type (por or muc/tub) | 0.4726 |
|
|
| pT (3 or 4/1 or
2) | 0.2014 |
|
|
| pN (1/0) | 0.0203a | 1.83
(1.07–3.10) | 0.0450a |
| pStage (IIB or III
or IV/IA or IB or IIA) | 0.0106a |
|
|
| Vascular invasion
(+/−) | 0.0060a |
|
|
| Neural invasion (1
or 2 or 3/0) | 0.0880 |
|
|
| Adjuvant
chemotherapy (failure/complete) | 0.0006a | 2.64
(1.55–4.47) | 0.0002a |
| Hepcidin (Strongly
stained/Weakly or no stained) | 0.0104a | 2.20
(1.19–4.38) | 0.0049a |
Univariate analysis of RFS was performed in a
similar manner to that of OS (Table
IV). pStage and vascular invasion significantly differed in the
univariate analysis; however, there were no significant differences
in the multivariate analysis.
| Table IV.Univariate and multivariate analysis
for recurrence-free survival in relation to hepcidin staining. |
Table IV.
Univariate and multivariate analysis
for recurrence-free survival in relation to hepcidin staining.
| Univariate
analysis | Multivariate
analysis |
|---|
|
|
|---|
| Variables | P-value | HR (95% CI) | P-value |
|---|
| Age (≥65/<65
years) | 0.7707 |
|
|
| Sex (M/F) | 0.9452 |
|
|
| Tumor size
(≥20/<20 mm) | 0.2565 |
|
|
| Location (Ph/Pb or
Pt) | 0.9453 |
|
|
| Histopathological
type (por or muc/tub) | 0.3270 |
|
|
| pT (3 or 4/1 or
2) | 0.3038 |
|
|
| pN (1/0) | 0.0679 |
|
|
| pStage (IIB or III
or IV/IA or IB or IIA) | 0.0408a | 1.63
(0.91–2.91) | 0.0983 |
| Vascular invasion
(+/−) | 0.0358a | 2.19
(0.99–5.52) | 0.0521 |
| Neural invasion (1
or 2 or 3/0) | 0.4832 |
|
|
| Adjuvant
chemotherapy (failure/complete) | 0.0581 |
|
|
| Hepcidin (Strongly
stained/Weakly or no stained) | 0.0684 |
|
|
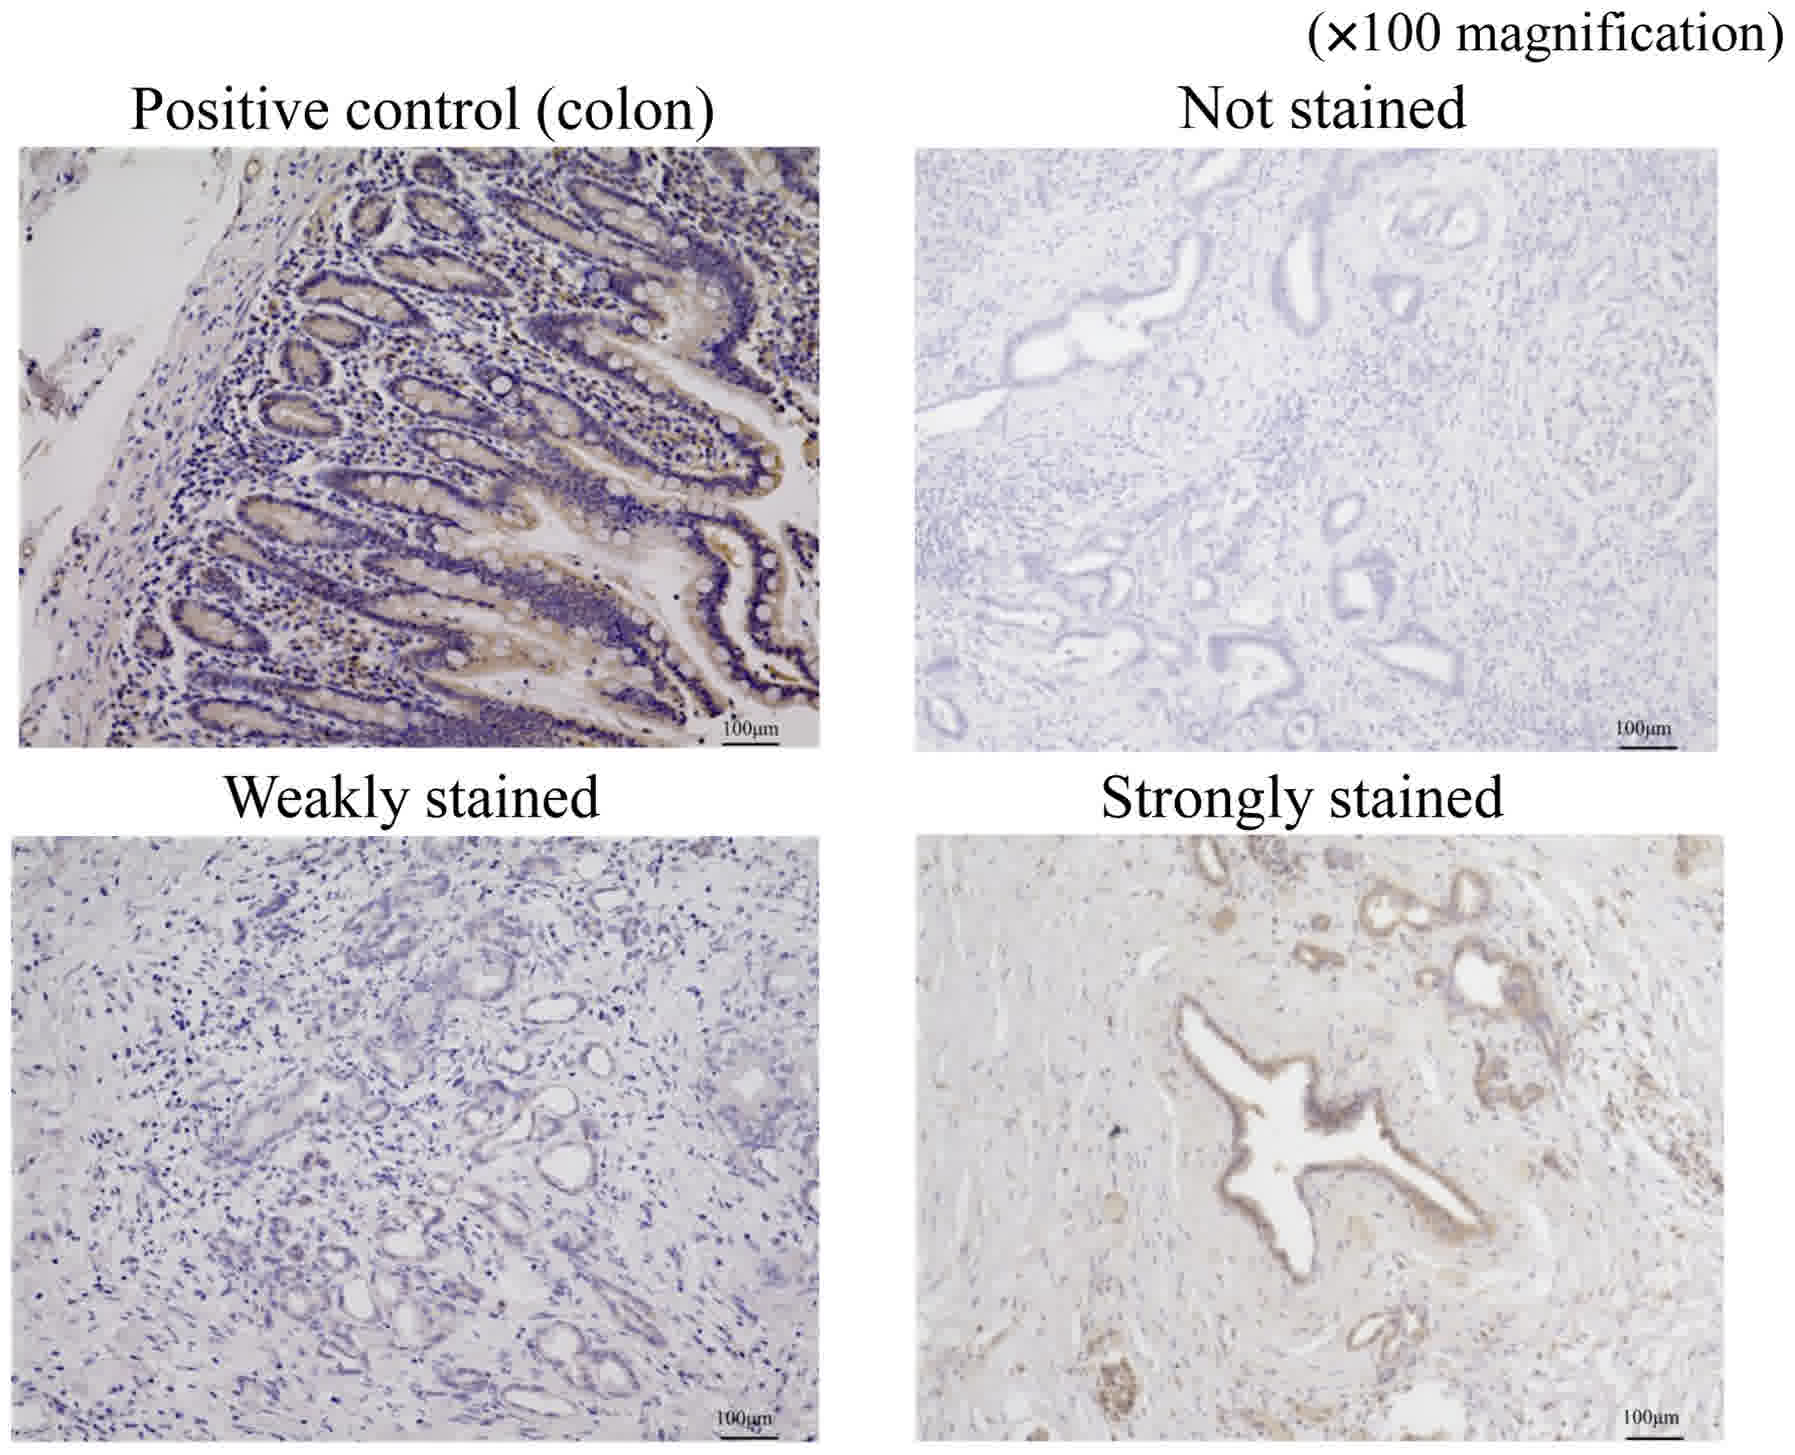
Immunohistochemistry for ferroportin
in pancreatic cancer tissues
We evaluated immunostaining for ferroportin using a
method similar to that used for hepcidin. Stained sections were
classified into three categories based on staining intensity: Not
stained; weakly stained (stained weaker than positive control); and
strongly stained (stained equal to or stronger than positive
control; Fig. 3). The sections that
were weakly stained or not stained were included in the
weakly-stained group and those that were strongly stained were
included in the strongly-stained group.
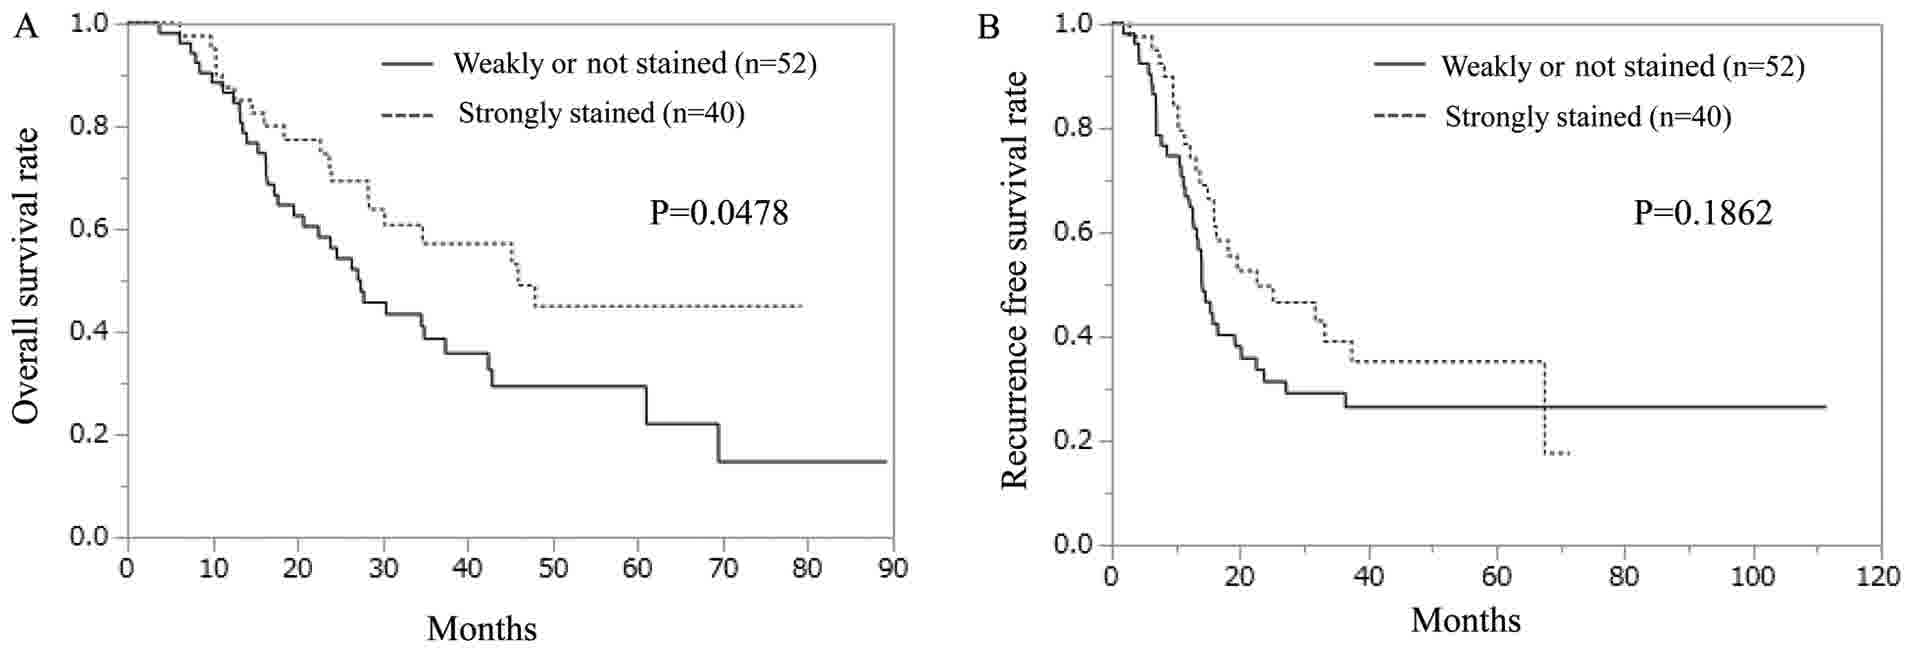
The clinicopathological features based on
ferroportin expression are summarized in Table V. Among the examined pathological
features, we detected a significant difference only in age. Unlike
the hepcidin samples, the weakly-stained ferroportin group
exhibited significantly shorter OS than did the strongly-stained
ferroportin group (Fig. 4A). In terms
of RFS, no significant difference was observed between the
strongly- and weakly-stained ferroportin groups (Fig. 4B).
| Table V.Clinicopathological features based on
ferroportin expression. |
Table V.
Clinicopathological features based on
ferroportin expression.
| Variables | Weakly or not
stained (n=52) | Strongly stained
(n=40) | P-value |
|---|
| Age (≥65/<65
years) | 28:24 | 30:10 | 0.0372a |
| Sex (M/F) | 32:20 | 25:15 | 0.9250 |
| Tumor size
(≥20/<20 mm) | 33:19 | 24:16 | 0.7346 |
| Location (Ph/Pb or
Pt) | 37:15 | 23:17 | 0.1728 |
| Histopathological
type (por or muc/tub) | 4:48 | 1:39 | 0.2761 |
| pT (1 or 2/3 or
4) | 12:40 | 13:27 | 0.4099 |
| pN (0/1) | 33:19 | 28:12 | 0.5107 |
| pStage (IIB or III
or IV/IA or IB or IIA) | 19:33 | 13:27 | 0.6868 |
| Vascular invasion
(0/1 or 2 or 3) | 11:41 | 11:29 | 0.4793 |
| Neural invasion
(0/1 or 2 or 3) | 7:45 | 10:30 | 0.1575 |
| Adjuvant
chemotherapy (failure/complete) | 17:35 | 17:23 | 0.3340 |
Univariate and multivariate analyses for OS with
respect to ferroportin staining are shown in Table VI. As described in Table III, in addition to pN, pStage,
vascular invasion, and adjuvant chemotherapy, there was a
significant difference in ferroportin expression. pStage was
excluded from the multivariate analysis because it seemed to be
associated with pN. Multivariate analysis revealed significant
differences in vascular invasion, adjuvant chemotherapy, and
ferroportin expression; therefore, these were considered to be
independent prognostic factors.
| Table VI.Univariate and multivariate analysis
for overall survival in relation to ferroportin staining. |
Table VI.
Univariate and multivariate analysis
for overall survival in relation to ferroportin staining.
| Univariate
analysis | Multivariate
analysis |
|---|
|
|
|---|
| Variables | P-value | HR (95% CI) | P-value |
|---|
| Age (≥65/<65
years) | 0.1945 |
|
|
| Sex (M/F) | 0.9873 |
|
|
| Tumor size
(≥20/<20 mm) | 0.0513 |
|
|
| Location (Ph/Pb or
Pt) | 0.9346 |
|
|
| Histopathological
type (por or muc/tub) | 0.4726 |
|
|
| pT (3 or 4/1 or
2) | 0.2014 |
|
|
| pN (1/0) | 0.0203a | 1.17
(0.64–2.11) | 0.6060 |
| pStage (IIB or III
or IV/IA or IB or IIA) | 0.0106a |
|
|
| Vascular invasion
(+/−) | 0.0060a | 3.43
(1.50–8.90) | 0.0028a |
| Neural invasion (1
or 2 or 3/0) | 0.0880 |
|
|
| Adjuvant
chemotherapy (failure/complete) | 0.0006a | 4.37
(2.35–8.20) |
<.0001a |
| Ferroportin (Weakly
or no stained/strongly stained) | 0.0459a | 2.25
(1.26–4.14) | 0.0056a |
Univariate analysis of RFS was performed in a manner
similar to that of OS. Significant differences were noted in pStage
and vascular invasion in the univariate analysis but not in the
multivariate analysis (Table
VII).
| Table VII.Univariate and multivariate analysis
for recurrence-free survival in relation to ferroportin
staining. |
Table VII.
Univariate and multivariate analysis
for recurrence-free survival in relation to ferroportin
staining.
| Univariate
analysis | Multivariate
analysis |
|---|
|
|
|---|
| Variables | P-value | HR (95% CI) | P-value |
|---|
| Age (≥65/<65
years) | 0.7707 |
|
|
| Sex (M/F) | 0.9452 |
|
|
| Tumor size
(≥20/<20 mm) | 0.2565 |
|
|
| Location (Ph/Pb or
Pt) | 0.9453 |
|
|
| Histopathological
type (por or muc/tub) | 0.3270 |
|
|
| pT (3 or 4/1 or
2) | 0.3038 |
|
|
| pN (1/0) | 0.0679 |
|
|
| pStage (IIB or III
or IV/IA or IB or IIA) | 0.0408a | 1.48
(0.83–2.61) | 0.1582 |
| Vascular invasion
(+/−) | 0.0358a | 1.62
(0.83–3.33) | 0.1835 |
| Neural invasion (1
or 2 or 3/0) | 0.4832 |
|
|
| Adjuvant
chemotherapy (failure/complete) | 0.0581 |
|
|
| Ferroportin (Weakly
or not stained/Strongly | 0.1846 |
|
|
Discussion
In recent years, iron metabolism has attracted
attention as a mechanism in the carcinogenetic process. Above all,
hepcidin and ferroportin are thought to play important roles.
Hepcidin is a peptide hormone that regulates iron homeostasis by
regulating the iron transporter ferroportin and is produced mainly
by the liver. Hepcidin expression is increased by the inflammatory
cytokine interleukin 6 (IL-6) and iron overload (23). IL-6 is a multifunctional cytokine that
is produced by many different cell types and plays an important
role in the regulation of inflammation and immune response
(20,21). Hepcidin overexpression decreases iron
absorption by inhibiting the iron transporter ferroportin in
enterocytes and causes hypoferric anemia (24). Conversely, the dysfunction or genetic
defect of hepcidin leads to hyperferremia, as observed in
hemochromatosis (25). Similarly,
mutations in FPN1, the gene that encodes ferroportin, result
in iron overload disease that shows dominant inheritance and
variations in phenotype (26).
Some reports have indicated that hepcidin and
ferroportin expressions are involved in carcinogenesis and tumor
malignancy, e.g., according to a report on breast cancer, high
hepcidin expression was observed in cells with a high degree of
malignancy (27). In colorectal
cancer, hepcidin expression in urine is associated with Tstage, and
it is detected to measure hepcidin levels in urine using mass
spectrometry (28). The serum
hepcidin level was significantly higher in patients with non-small
cell lung cancer compared with noncancerous individuals (29). In a report on ferroportin, ferroportin
overexpression was shown to inhibit lung and liver metastases by
altering metastasis-relevant properties, including
epithelial-mesenchymal transition (30).
Based on these findings, hepcidin and ferroportin
were found to affect the malignancy of various cancers. Hepcidin
expression occurs in the pancreas, although the expression level is
much lower than that in the liver. Hence, we attempted to examine
hepcidin expression in pancreatic cancer tissue. Similar to
hepcidin expression, ferroportin expression also occurs in the
pancreas (23). Therefore, we
expected that hepcidin and ferroportin were possibly involved in
patients' prognosis of pancreatic cancer and we decided to examine
this involvement.
As clarified in our study, hepcidin expression was
correlated with pStage and vascular invasion in patients with
pancreatic cancer, and high expression in the hepcidin group
indicated shorter OS. pN, adjuvant chemotherapy, and hepcidin
expression were found to be independent prognostic factors for OS.
Ferroportin expression was correlated with age, and low expression
in the ferroportin group indicated shorter OS. Vascular invasion,
adjuvant chemotherapy, and ferroportin expression were found to be
independent prognostic factors for OS. There was no significant
difference in disease-free survival in both the hepcidin- and
ferroportin-staining groups.
As previously mentioned, it can be inferred that
increases intracellular iron levels through hepcidin-ferroportin
signaling might contribute to the malignancy of cancer. However,
the detail of the mechanism is not known. One of the mechanisms
that may be involved is associated with histone lysine demethylases
(KDMs), including Jarid1B, as described in Background. Jarid1B was
reported to be well expressed in breast cancers and breast cancer
cell lines, but Jarid1B expression was not observed in almost all
normal organs except for the testis and ovary (14). Moreover, the TCGA dataset indicated
that Jarid1B RNA is expressed in various cancer tissues, including
pancreatic cancer. In a prostate cancer cell line, the enzymatic
activity of Jarid1B was significantly diminished in the absence of
ascorbic acid, α-ketoglutarate, or Fe (II), or in the presence of
an iron chelator (13). The data of
our previous experiment also shows similar results (data not
shown), supporting the notion that JARID1B is an iron-dependent
dioxygenase.
To summarize what has been discussed in this paper,
although the correlation between Jarid1B and hepcidin-ferroportin
signaling has not yet been elucidated, hepcidin-ferroportin
signaling promotes iron retention in cells; furthermore, the
increase in iron retention activates Jarid1B enzyme activity as a
silencer of the tumor suppressor gene. It could be inferred that
this is a mechanism of malignant transformation.
Our findings provide new insight into the mechanisms
underlying the important role of deregulated hepcidin-ferroportin
signaling in cancer, and these findings might contribute to the
development of an anticancer therapeutic target.
Acknowledgements
The authors would like to thank Dr Sakai at Osaka
University (Osaka, Japan) for providing support in our data
analysis and the members of our laboratories for their helpful
discussions.
Funding
The present work was supported in part by a
Grant-in-Aid for Scientific Research from the Ministry of
Education, Culture, Sports, Science and Technology (grant nos.
17H04282, 17K19698; 16K15615 and 15H05791), a grant from P-DIRECT
(grant no. 15cm0106105h0002; AMED-Japan Cancer Research
Project).
Availability of data and materials
The datasets used and/or analyzed during the current
study are available from the corresponding author on reasonable
request.
Authors' contributions
RT, MK and HI collaborated in the conception and
design. RT, MK and HI were involved in the development of
methodology. RT, MK, AA, JK, KA, TO, KM and HI were involved in the
acquisition of data (provided the animals, acquired and managed
patients, and provided the facilities). RT, MK, HE, TN, YI, DY, TA,
HW, KK, KG, TK, TS, YD, MM and HI contributed to the analysis and
interpretation of data (statistical analysis, biostatistics and
computational analysis). RT, MK, HE, TN, HI wrote and revised the
manuscript. MM and HI supervised the study.
Ethics approval and consent to
participate
This study has been approved by the research Ethics
Committee of Osaka University (ID of the approval: 15149-2) and
written informed consent was obtained from all patients.
Consent for publication
Written informed consents were obtained from the
patients for publication.
Competing interests
Institutional endowments were received partially
from Taiho Pharmaceutical Co., Ltd., Evidence Based Medical
Research Center, IDEA Consultants, Inc. (Tokyo, Japan), Unitech Co.
Ltd. (Chiba, Japan), and Kinshu-kai Medical Corporation (Osaka,
Japan) (Y.D., M.M., and H.I.); Chugai Co., Ltd., Yakult Honsha Co.,
Ltd., and Merck Co., Ltd (D.S., T.K., T.S., Y.D., and M.M.). These
funders had no role in providing the primary experimental
equipment, supply expenses, study design, data collection and
analysis, decision to publish, or manuscript preparation for this
work.
References
|
1
|
Tomihara H, Eguchi H, Yamada D, Gotoh K,
Kawamoto K, Wada H, Asaoka T, Noda T, Takeda Y, Tanemura M, et al:
Preoperative chemoradiotherapy does not compromise the feasibility
of adjuvant chemotherapy for patients with pancreatic ductal
adenocarcinoma. Surg Today. 47:218–226. 2017. View Article : Google Scholar : PubMed/NCBI
|
|
2
|
Hirayama K, Kono H, Nakata Y, Akazawa Y,
Wakana H, Fukushima H and Fujii H: Expression of podoplanin in
stromal fibroblasts plays a pivotal role in the prognosis of
patients with pancreatic cancer. Surg Today. 48:110–118. 2018.
View Article : Google Scholar : PubMed/NCBI
|
|
3
|
Yamada D, Eguchi H, Asaoka T, Tomihara H,
Noda T, Wada H, Kawamoto K, Gotoh K, Takeda Y, Tanemura M, et al:
The basal nutritional state of PDAC patients is the dominant factor
for completing adjuvant chemotherapy. Surg Today. Apr 18–2017.(Epub
ahead of print). View Article : Google Scholar
|
|
4
|
Sharp P and Srai SK: Molecular mechanisms
involved in intestinal iron absorption. World J Gastroenterol.
13:4716–4724. 2007. View Article : Google Scholar : PubMed/NCBI
|
|
5
|
Oates PS: The role of hepcidin and
ferroportin in iron absorption. Histol Histopathol. 22:791–804.
2007.PubMed/NCBI
|
|
6
|
Franchini M, Montagnana M and Lippi G:
Hepcidin and iron metabolism: From laboratory to clinical
implications. Clin Chim Acta. 411:1565–1569. 2010. View Article : Google Scholar : PubMed/NCBI
|
|
7
|
Dixon SJ and Stockwell BR: The role of
iron and reactive oxygen species in cell death. Nat Chem Biol.
10:9–17. 2014. View Article : Google Scholar : PubMed/NCBI
|
|
8
|
Yamada Y, Miyamoto T, Kashima H, Kobara H,
Asaka R, Ando H, Higuchi S, Ida K and Shiozawa T: Lipocalin 2
attenuates iron-related oxidative stress and prolongs the survival
of ovarian clear cell carcinoma cells by up-regulating the CD44
variant. Free Radic Res. 50:414–425. 2016. View Article : Google Scholar : PubMed/NCBI
|
|
9
|
Toyokuni S: Role of iron in
carcinogenesis: Cancer as a ferrotoxic disease. Cancer Sci.
100:9–16. 2009. View Article : Google Scholar : PubMed/NCBI
|
|
10
|
Kano Y, Konno M, Ohta K, Haraguchi N,
Nishikawa S, Kagawa Y, Hamabe A, Hasegawa S, Ogawa H, Fukusumi T,
et al: Jumonji/Arid1b (Jarid1b) protein modulates human esophageal
cancer cell growth. Mol Clin Oncol. 1:753–757. 2013. View Article : Google Scholar : PubMed/NCBI
|
|
11
|
Ohta K, Haraguchi N, Kano Y, Kagawa Y,
Konno M, Nishikawa S, Hamabe A, Hasegawa S, Ogawa H, Fukusumi T, et
al: Depletion of JARID1B induces cellular senescence in human
colorectal cancer. Int J Oncol. 42:1212–1218. 2013. View Article : Google Scholar : PubMed/NCBI
|
|
12
|
Roesch A, Fukunaga-Kalabis M, Schmidt EC,
Zabierowski SE, Brafford PA, Vultur A, Basu D, Gimotty P, Vogt T
and Herlyn M: A temporarily distinct subpopulation of slow-cycling
melanoma cells is required for continuous tumor growth. Cell.
141:583–594. 2010. View Article : Google Scholar : PubMed/NCBI
|
|
13
|
Xiang Y, Zhu Z, Han G, Ye X, Xu B, Peng Z,
Ma Y, Yu Y, Lin H, Chen AP and Chen CD: JARID1B is a histone H3
lysine 4 demethylase up-regulated in prostate cancer. Proc Natl
Acad Sci USA. 104:19226–19231. 2007. View Article : Google Scholar : PubMed/NCBI
|
|
14
|
Barrett A, Madsen B, Copier J, Lu PJ,
Cooper L, Scibetta AG, Burchell J and Taylor-Papadimitriou J: PLU-1
nuclear protein, which is upregulated in breast cancer, shows
restricted expression in normal human adult tissues: A new
cancer/testis antigen? Int J Cancer. 101:581–588. 2002. View Article : Google Scholar : PubMed/NCBI
|
|
15
|
Weizer-Stern O, Adamsky K, Margalit O,
Ashur-Fabian O, Givol D, Amariglio N and Rechavi G: Hepcidin, a key
regulator of iron metabolism, is transcriptionally activated by
p53. Br J Haematol. 138:253–262. 2007. View Article : Google Scholar : PubMed/NCBI
|
|
16
|
Singh B, Arora S, Agrawal P and Gupta SK:
Hepcidin: A novel peptide hormone regulating iron metabolism. Clin
Chim Acta. 412:823–830. 2011. View Article : Google Scholar : PubMed/NCBI
|
|
17
|
Zhao N, Zhang AS and Enns CA: Iron
regulation by hepcidin. J Clin Invest. 123:2337–2343. 2013.
View Article : Google Scholar : PubMed/NCBI
|
|
18
|
Bekri S, Gual P, Anty R, Luciani N, Dahman
M, Ramesh B, Iannelli A, Staccini-Myx A, Casanova D, Ben Amor I, et
al: Increased adipose tissue expression of hepcidin in severe
obesity is independent from diabetes and NASH. Gastroenterology.
131:788–796. 2006. View Article : Google Scholar : PubMed/NCBI
|
|
19
|
Xue D, Zhou CX, Shi YB, Lu H and He XZ:
Decreased expression of ferroportin in prostate cancer. Oncol Lett.
10:913–916. 2015. View Article : Google Scholar : PubMed/NCBI
|
|
20
|
Li JJ, Meng X, Si HP, Zhang C, Lv HX, Zhao
YX, Yang JM, Dong M, Zhang K, Liu SX, et al: Hepcidin destabilizes
atherosclerotic plaque via overactivating macrophages after
erythrophagocytosis. Arterioscler Thromb Vasc Biol. 32:1158–1166.
2012. View Article : Google Scholar : PubMed/NCBI
|
|
21
|
Zhang S, Chen Y, Guo W, Yuan L, Zhang D,
Xu Y, Nemeth E, Ganz T and Liu S: Disordered hepcidin-ferroportin
signaling promotes breast cancer growth. Cell Signal. 26:2539–2550.
2014. View Article : Google Scholar : PubMed/NCBI
|
|
22
|
Asukai K, Kawamoto K, Eguchi H, Konno M,
Nishida N, Koseki J, Noguchi K, Hasegawa S, Ogawa H, Yamada D, et
al: Prognostic impact of peritumoral IL-17-positive cells and IL-17
axis in patients with intrahepatic cholangiocarcinoma. Ann Surg
Oncol. 22 Suppl 3:S1524–S1531. 2015. View Article : Google Scholar : PubMed/NCBI
|
|
23
|
Kulaksiz H, Fein E, Redecker P, Stremmel
W, Adler G and Cetin Y: Pancreatic beta-cells express hepcidin, an
iron-uptake regulatory peptide. J Endocrinol. 197:241–249. 2008.
View Article : Google Scholar : PubMed/NCBI
|
|
24
|
D'Angelo G: Role of hepcidin in the
pathophysiology and diagnosis of anemia. Blood Res. 48:10–15. 2013.
View Article : Google Scholar : PubMed/NCBI
|
|
25
|
Pietrangelo A: Hereditary hemochromatosis:
Pathogenesis, diagnosis, and treatment. Gastroenterology.
139:393–408. 2010. View Article : Google Scholar : PubMed/NCBI
|
|
26
|
De Domenico I, Ward DM and Kaplan J:
Hepcidin and ferroportin: The new players in iron metabolism. Semin
Liver Dis. 31:272–279. 2011. View Article : Google Scholar : PubMed/NCBI
|
|
27
|
Ciniselli CM, De Bortoli M, Taverna E,
Varinelli L, Pizzamiglio S, Veneroni S, Bonini C, Orlandi R,
Verderio P and Bongarzone I: Plasma hepcidin in early-stage breast
cancer patients: No relationship with interleukin-6, erythropoietin
and erythroferrone. Expert Rev Proteomics. 12:695–701. 2015.
View Article : Google Scholar : PubMed/NCBI
|
|
28
|
Ward DG, Roberts K, Brookes MJ, Joy H,
Martin A, Ismail T, Spychal R, Iqbal T and Tselepis C: Increased
hepcidin expression in colorectal carcinogenesis. World J
Gastroenterol. 14:1339–1345. 2008. View Article : Google Scholar : PubMed/NCBI
|
|
29
|
Chen Q, Wang L, Ma Y, Wu X, Jin L and Yu
F: Increased hepcidin expression in non-small cell lung cancer
tissue and serum is associated with clinical stage. Thorac Cancer.
5:14–24. 2014. View Article : Google Scholar : PubMed/NCBI
|
|
30
|
Guo W, Zhang S, Chen Y, Zhang D, Yuan L,
Cong H and Liu S: An important role of the hepcidin-ferroportin
signaling in affecting tumor growth and metastasis. Acta Biochim
Biophys Sin (Shanghai). 47:703–715. 2015. View Article : Google Scholar : PubMed/NCBI
|