Introduction
Lung cancer is the primary cause of mortality for
patients with cancer globally, and the incidence of lung cancer
ranks first among all malignancies in China and worldwide (1–4). Lung
cancer includes small cell lung cancer and non-small cell lung
cancer (NSCLC). Lung adenocarcinoma (LUAD) is a type of NSCLC and
is one of the most common types of lung cancer. It accounts for
20–30% of all types of primary lung cancer, and its incidence has
surpassed that of squamous cell carcinoma in a number of countries
(5–9).
At present, comprehensive treatment of LUAD in clinical practice
utilizes multiple methods, including surgical treatment,
radiotherapy, chemotherapy and molecular targeted therapy.
Recently, relatively rapid improvement has been made in the
treatment of LUAD, but the prognosis and treatment efficacy of LUAD
remains insufficient. The overall 5-year survival rate for all
types of lung cancer, including LUAD, remains very low (<15%)
(10–14). Therefore, it is essential to expand
and improve understanding of the principal molecular mechanisms
associated with LUAD.
Hox genes, also known as homeotic genes or
homologous genes, are genes that specifically regulate the
biological morphology of living organisms. The mammalian Hox genes
are categorized into four clusters, Hox A, B, C and D; these
clusters are arranged on different chromosomes and are located at
7p15.3 (HoxA), 17q21.3 (HoxB), 12q13.3 (HoxC) and 2q31 (HoxD) in
humans. HOXA13 is a member of the HOX family (15,16). In
recent years, the role of HOXA13 in cancer has been extensively
investigated. It has been revealed that HOXA13 expression levels
are associated with the occurrence of tumors of the digestive
tract, gliomas, prostate cancer, cervical cancer, bladder cancer
and ovarian cancer (17–24). There are currently only two studies on
the role of HOXA13 in lung cancer. Sang et al (25) studied the association between the long
non-coding RNAs (lncRNAs) HOTTIP and HOXA13 in NSCLC. Another study
examined the critical genetic landmarks in early LUAD by utilizing
high-density genomic arrays to detect increases in the copy numbers
of genes located on the short arm of chromosome 7; that study led
to the discovery of certain important genes that had not previously
been identified, including HOXA13 (26). However, the role of HOXA13 expression
in the occurrence and progression of LUAD has not been
investigated. The prevalence of big data [comprising data from TCGA
(which collected and characterized high-quality tumor and matched
normal samples from over 11,000 patients) and Oncomine (which
including 729 datasets and 91,866 samples)] has also provided us
with a novel opportunity to study the clinical significance of
HOXA13.
The present study conducted HOXA13-related data
mining of The Cancer Genome Atlas (TCGA; http://cancergenome.nih.gov/) and used the polymerase
chain reaction (PCR) data from our cases and the case information
in Oncomine (www.oncomine.org) for validation. In
order to obtain a full illustration of the expression of HOXA13 in
tissue samples representing different detection methods, the data
of TCGA, in-house PCR and Oncomine were integrated to perform a
comprehensive meta-analysis. In addition to the HOXA13 expression
in tissues, the expression data of HOXA13 in lung cancer cell lines
were also collected from the Cancer Cell Line Encyclopedia (CCLE)
database (http://www.broadinstitute.org/ccle) for further
verification. Genes that were co-expressed with HOXA13 were
subsequently identified through cBioPortal and Multi Experiment
Matrix (MEM; http://biit.cs.ut.ee/mem/), and the potential role and
mechanism of HOXA13 in LUAD was investigated.
Materials and methods
Extraction and analysis of data from
the TCGA database
The raw data of rnaseqv2 in LUAD were downloaded
from the TCGA database, including 237 cases of LUAD and 9
non-cancerous controls. Cases with expression values <1 were
excluded. To further normalize the data, the HOXA13 expression
values of the remaining cases were log2 transformed. The
corresponding clinical parameters of the patients were subsequently
extracted.
Validation of expression via
oncomine
The Oncomine screening conditions were as follows:
Gene name, HOXA13; analysis type, cancer vs. normal analysis; and
data type, mRNA. Following screening, four datasets: ‘Hou lung’
(GSE19188, http://www.ncbi.nlm.nih.gov/geo/query/acc.cgi?acc=GSE19188)
(27), ‘Selamat Lung’ (GSE32863,
http://www.ncbi.nlm.nih.gov/geo/query/acc.cgi?acc=GSE32863)
(28), ‘Garber Lung’ (GSE3398,
http://www.ncbi.nlm.nih.gov/geo/query/acc.cgi?acc=GSE3398)
(29) and ‘Okayama Lung’ (GSE31210,
http://www.ncbi.nlm.nih.gov/geo/query/acc.cgi?acc=GSE31210)
(30) were included.
Validation using reverse
transcription-quantitative PCR data of the clinical samples in our
hospital
Paraffin-embedded LUAD specimens from patients that
had undergone pneumonectomy at the First Affiliated Hospital of
Guangxi Medical between January 2012 and February 2014 were
collected and pathologically confirmed. A total of 29 cases with
complete data were selected, including 20 males and 9 females; the
ages of the patients were 23–90 years, mean age, 57 years. Lung
cancer tissues and corresponding non-cancerous tissues were
obtained from each patient. All specimens were removed, fixed for
48 h in 10% formaldehyde at room temperature, and the thickness of
the specimens were 3 mm; they were subjected to routine embedding
in paraffin. The present study was approved by the Ethical
Committee of the First Affiliated Hospital of Guangxi Medical
University, and all patients provided written informed consent for
participation in the study. Total RNA was extracted from FFPE
tissues using the RNeasy reagent (Qiagen China Co., Ltd., Shanghai,
China) and was reverse transcribed in a final volume of 20 µl with
random primers using the PrimeScript RT reagent kit (Takara
Biotechnology Co., Ltd., Dalian, China), according to the
manufacturer's protocols. SYBR Premix Ex Taq (Takara Biotechnology
Co., Ltd.) was used to detect HOXA13 expression levels. The results
were normalized to the expression of the internal reference gene,
GAPDH, and calculated using the 2−Δct method (31) according to the manufacturer's
protocols of the Applied Biosystems Fast Real-Time PCR System
(Applied Biosystems; Thermo Fisher Scientific, Inc., Waltham, MA,
USA). The PCR procedure was: Initial denaturation at 95°C for 10
min, denaturation at 95°C for 10 sec; refolding for 5 sec at
annealing temperature 60°C; extension at 72°C for 5 sec (total 40
cycles). The primer sequences were as follows: HOXA13, forward
5′-GAACGGCCAAATGTACTGCC-3′, reverse 5′-CGCCTCCGTTTGTCCTTAGT-3.
GAPDH, forward 5′-TGCACCACCAACTGCTTA-3′ reverse
5′-GGATGCAGGGATGATGTTC-3′ (25).
Validation using cell line data from
CCLE
‘HOXA13’ was searched in the CCLE database and the
expression data of HOXA13 from all the cancer cell lines was
downloaded. A total of 192 lung cancer cell lines were selected.
The PC-14 cell line has been reported to be contaminated or
misidentified in International Cell Line Authentication Committee,
Database of Cross-Contaminated or Misidentified Cell Lines
(http://iclac.org/databases/cross-contaminations/),
and was therefore excluded from the present study. A total of 191
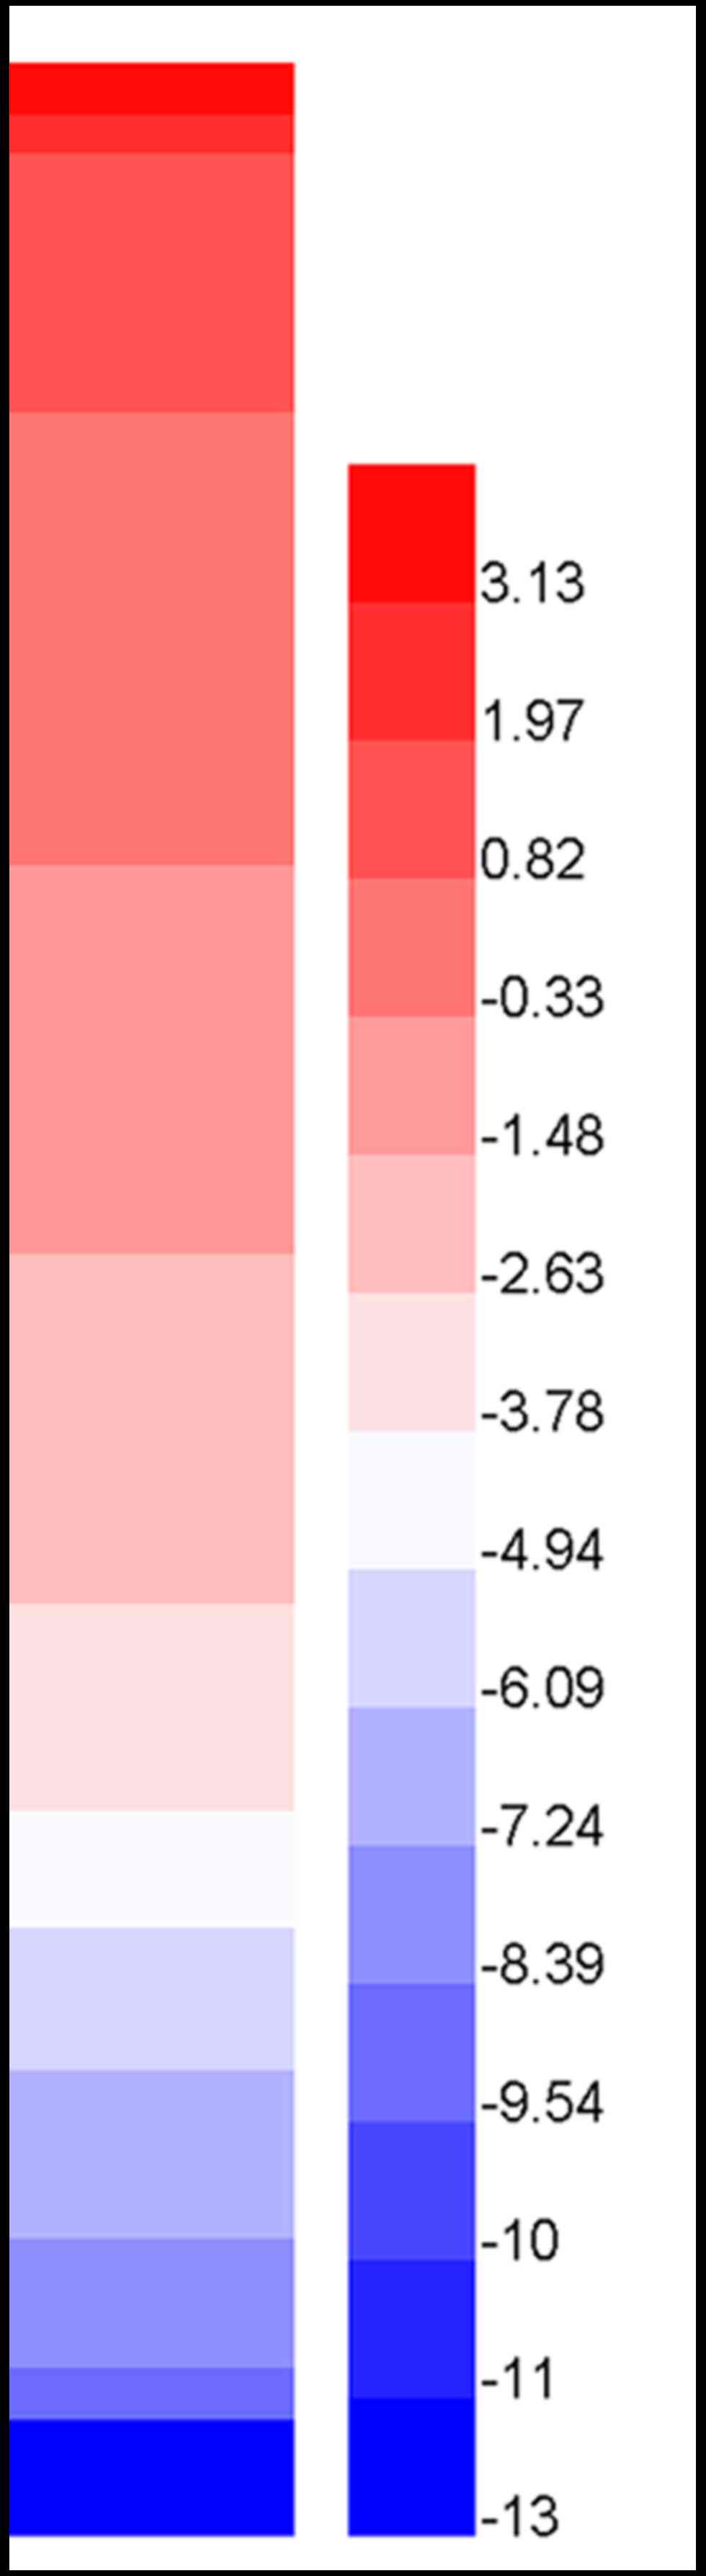
cell lines were collected for further research. A heat-map based on
the expression of HOXA13 in different lung cancer cell lines was
created by HemI (Heatmap Illustrator, version 1.0; http://hemi.biocuckoo.org/). These 191 cell lines
exhibited varying degrees of high (red) or low (blue) expression of
HOXA13.
Statistical analysis
Data analysis was conducted with SPSS 24.0 software
(IBM Corp., Chicago, IL, USA), and plots were created with GraphPad
Prism 7 software (GraphPad Software, San Diego, CA, USA). The
relative expression of HOXA13 is presented as the mean ± standard
deviation. An independent Student's t-test was applied for the
comparison of cancerous and non-cancerous samples, and paired
t-text was used to comparison of cancerous and non-cancerous
samples of PCR, one-way analysis of variance was used for the
comparison of three groups and LDS-t test was used as a post hoc
test. Correlations were analyzed by Spearman's correlation
analysis. The associations between HOXA13 expression and the main
clinicopathological characteristics of patients with LUAD were
analyzed using the independent sample t-test, and alterations in
expression between two groups were demonstrated by scatter plots.
The diagnostic value of HOXA13 for LUAD was analyzed using the
receiver operating characteristic (ROC) curve. The area under the
curve (AUC) was calculated, and the Youden index [Youden
index=sensitivity-(1-specificity)] was used to assess the optimal
diagnostic threshold. The standard mean difference (SMD) with 95%
CI was calculated using STATA 12.0 (StataCorp, College Station, TX,
USA). If SMD>0 and its 95% CI does not cross the 0 value, it
indicates that expression of HOXA13 in tumors is higher than in the
non-cancerous tissues. Summary receiver operating characteristic
(SROC) curve, sensitivity (SEN), specificity (SPE), positive
likelihood ratio (PLR), negative likelihood ratio (NLR), diagnostic
score (DS) and diagnostic odds ratio (DOR) were calculated using
STATA 12.0. I2 test was used to test heterogeneity between each of
the studies. It was considered that there would exist heterogeneity
between studies when P-values were less than 0.05 or I2 values were
more than 50%. The random-effects model or the fixed-effects model
were used to synthesize the data. The correlations between HOXA13
and clinicopathological features and the expression of related
genes were calculated using Pearson's correlation analysis.
P<0.05 was considered to indicate a statistically significant
difference.
Prediction of related genes
In MEM, the output option for each probe was set to
1,500 and the resulting similarity genes were then exported. Genes
that were present in at least two probe groups were selected.
cBioPortal (http://www.cbioportal.org/index.do) incorporates data
from 126 tumor genome research projects, including TCGA,
International Cancer Genome Consortium and other large tumor
research projects, and includes data from 28,000 cases. The
co-expression analysis module of cBioPortal is able to extract
genes that are co-expressed with HOXA13; co-expressed genes are
defined as genes associated with HOXA13 expression. The associated
genes that were identified by MEM and cBioPortal were subjected to
follow-up pathway analysis.
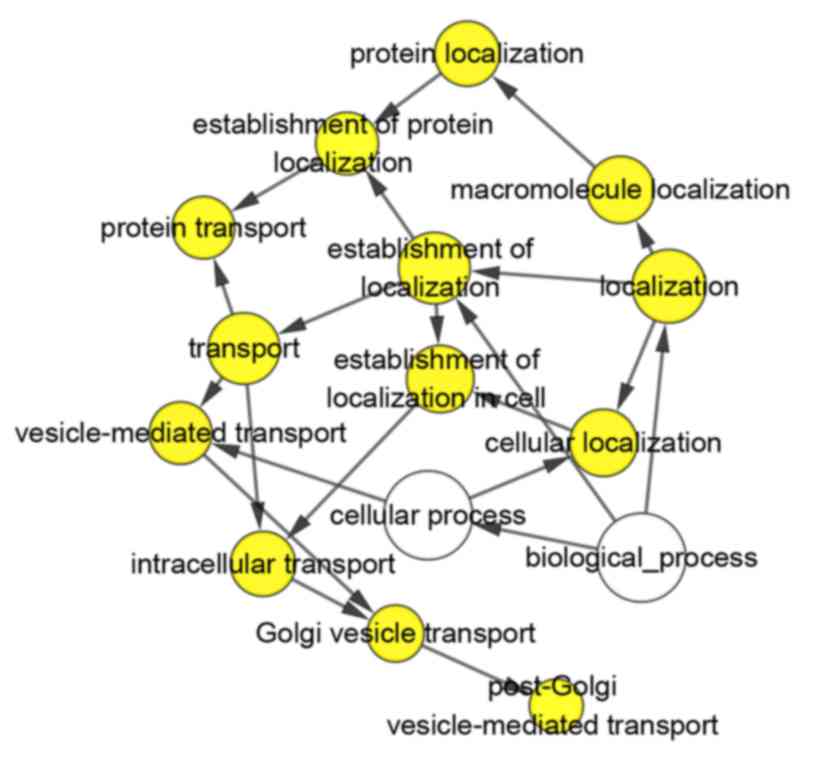
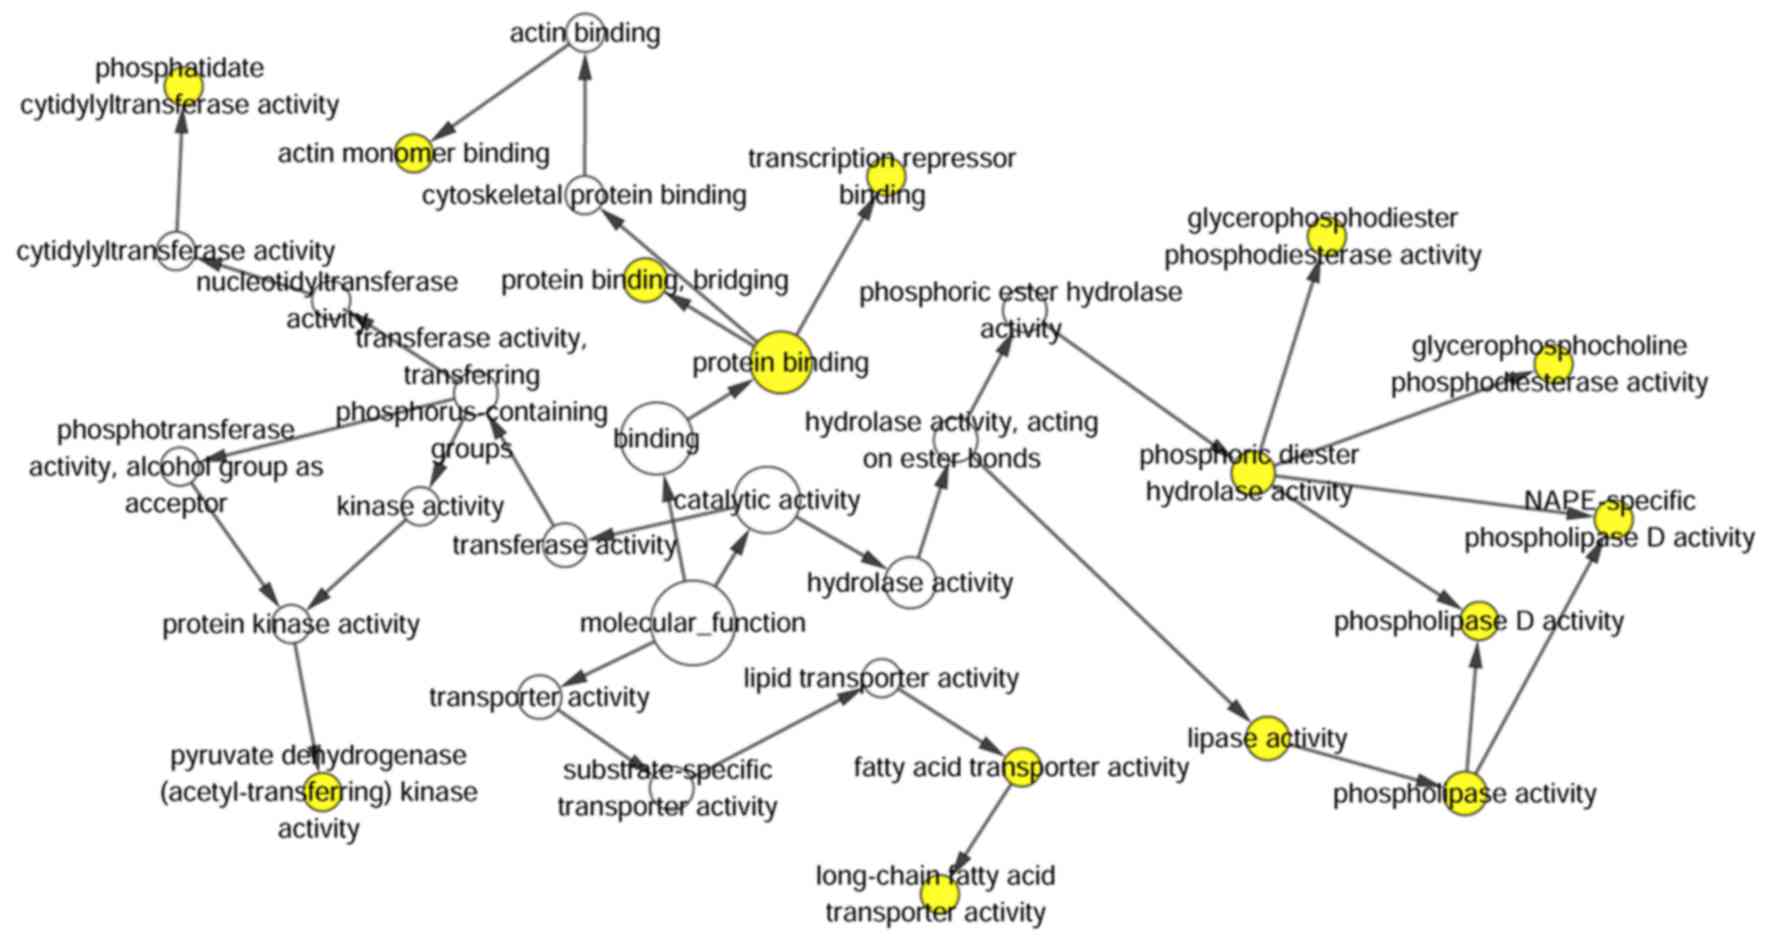
Gene enrichment and functional
annotation evaluation
The Database for Annotation, Visualization, and
Integrated Discovery (DAVID; http://david.abcc.ncifcrf.gov/) was used to conduct
relevant pathway analysis, and Gene Ontology (GO) analysis was
performed for the functional annotation of the co-expressed genes.
Three GO terms [biological process (BP), cellular component (CC)
and molecular function (MF)] were utilized to identify the
enrichment of target genes. GO terms and KEGG pathways with
P-values <0.05 were considered statistically significant. The
enrichment map of annotation analysis was drawn using Cytoscape
version 3.3.0 (http://www.cytoscape.org/cy3.html).
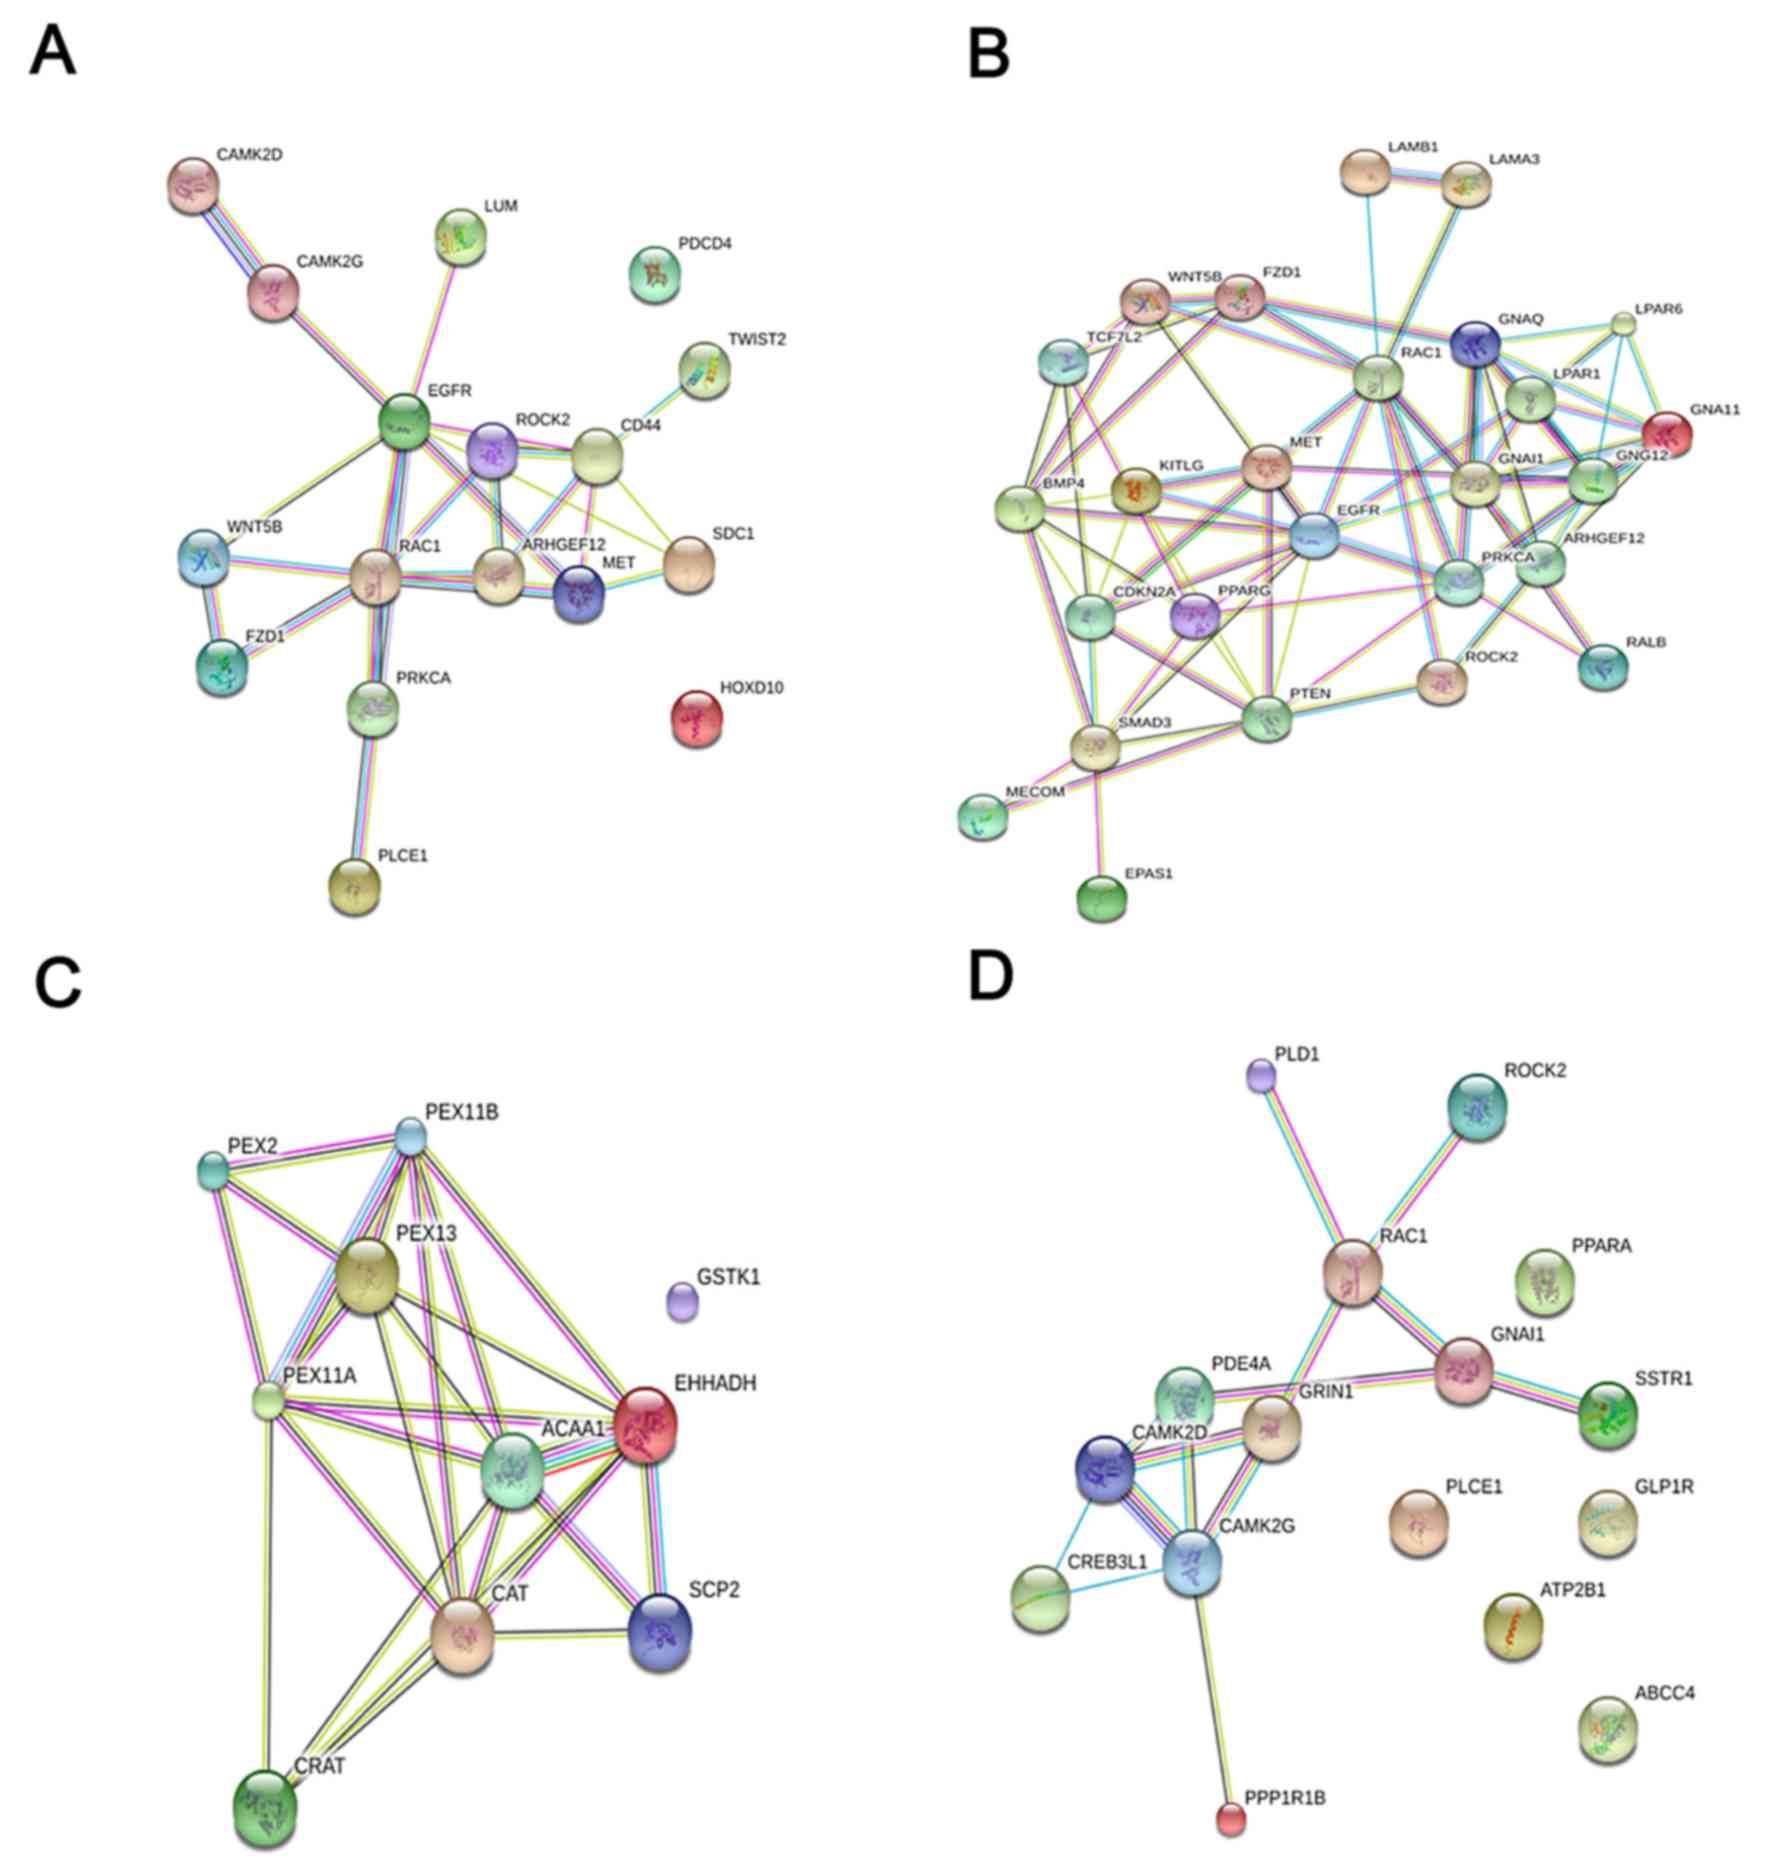
The protein-protein interaction (PPI)
network
The genes involved in the first four pathways of the
KEGG pathway analysis were selected for PPI analysis. Four PPI
networks were established through a bioinformatics platform called
STRING (http://www.string-db.org). The PPI data
were downloaded from the STRING database, and a map of the complete
PPI network was created. Hub genes, which may be recognized as
highly connected genes in the network, were identified according to
the value of degrees of each node. Genes with the first and second
values of degrees in each PPI network were considered to be hub
genes.
Correlation between HOXA13 and hub
genes
The log2 values of the expression values of HOXA13
and hub genes in the TCGA data were used for correlation analysis.
GraphPad Prism version 5.0 (GraphPad Software, Inc.) was utilized
to create the association diagram between hub genes and HOXA13
expression in the TCGA database, and scatter plots of hub gene
expression in non-cancerous tissues and LUAD tissues based on the
data from the TCGA database. The differences in the expression of
hub genes in LUAD tissues and non-cancerous tissues were analyzed
using the ROC curve. The AUC value was between 0.5 and 1.0.
Results
Expression of HOXA13 in the TCGA
database
The expression value of HOXA13 in the LUAD group,
which comprised 237 cases, was 3.74±2.694, significantly higher
than its expression value in the non-cancerous group (0.92±0.608;
P<0.001; Fig. 1Aa and Table I). The expression value of HOXA13 in
the LUAD group was 4 times its value in the non-cancerous group.
The diagnostic value of HOXA13 was calculated based on the ROC
curve; the AUC value was 0.839 (95% confidence interval (CI),
0.765–0.913; P=0.001; Fig. 1Ab). The
cut-off value of HOXA13 expression was 1.27. The sensitivity was
76.4% and the specificity was 88.9%.
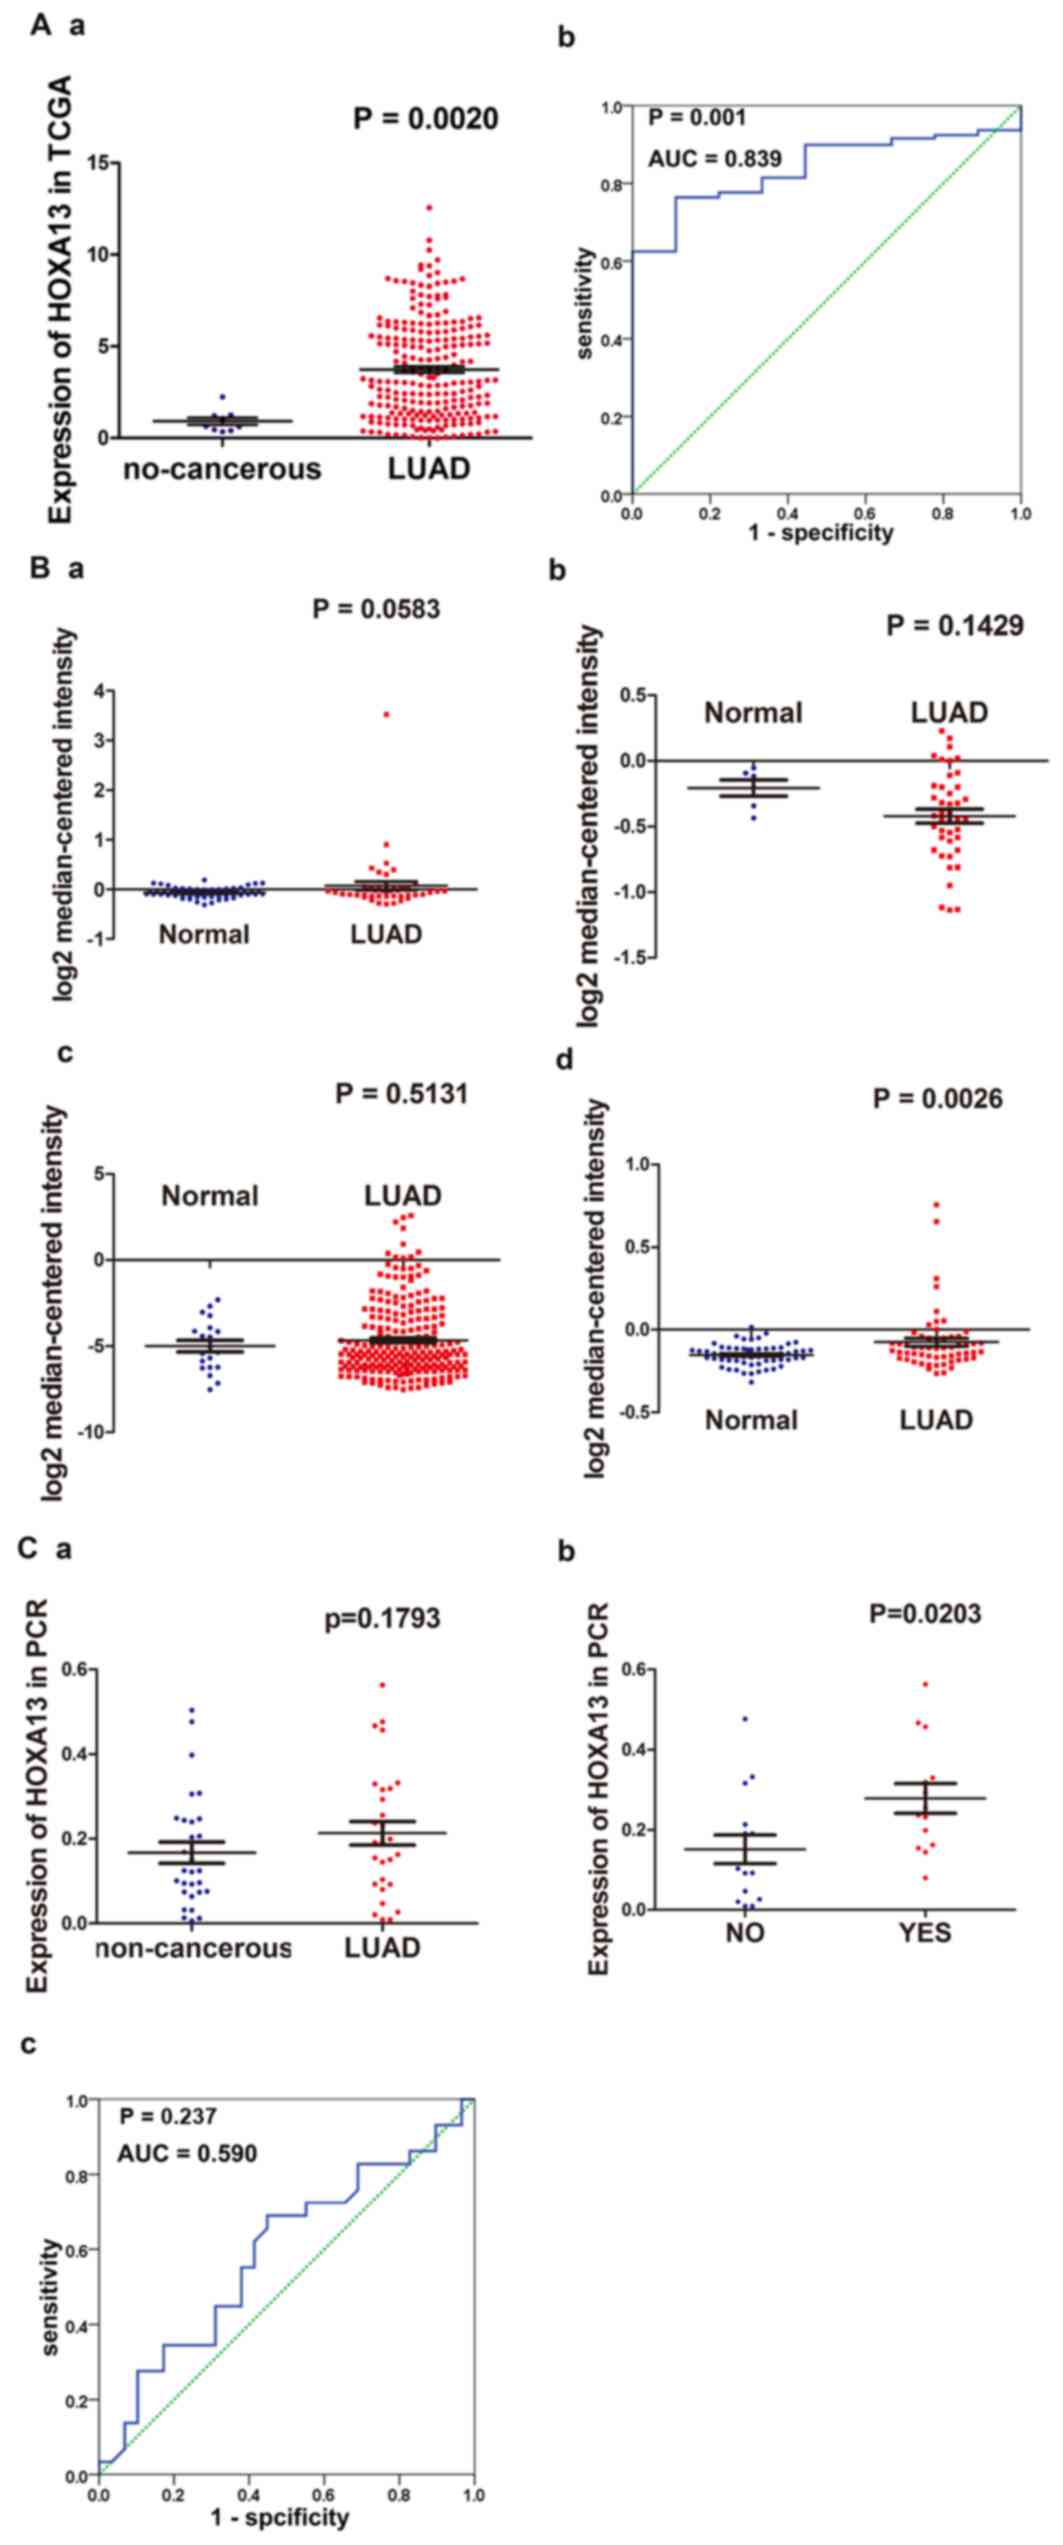 | Figure 1.(A) Expression of HOXA13 in the TCGA
database. (Aa) The expression value of HOXA13 in the LUAD group and
the non-cancerous group in the TCGA database; (Ab) ROC curve for
discrimination of LUAD tissues from non-cancerous tissues
(non-cancerous, 9 cases; LUAD, 237 cases). (B) Validation of HOXA13
expression based on Oncomine. The difference in HOXA13 expression
between patients with LUAD and healthy individuals. (Ba) ‘Hou Lung’
(normal, 65 cases; LUAD, 45 cases); (Bb) ‘Garber Lung’ (normal, 6
cases; LUAD, 42 cases); (Bc) ‘Okayama Lung’ (normal, 20 cases;
LUAD, 226 cases); (Bd) ‘Selamat Lung’ (normal, 58 cases; LUAD, 58
cases). (C) Validation based on reverse transcription-quantitative
PCR results of the clinical samples obtained at our hospital. (Ca)
Distinguish LUAD from non-cancerous tissues (normal, 29 cases; lung
adenocarcinoma, 29 cases); (Cb) lymph node metastasis (No, 15
cases; Yes, 14 cases); (Cc) ROC curve for discrimination of LUAD
from non-cancerous tissues. TCGA, The Cancer Genome Atlas; LUAD,
lung adenocarcinoma; ROC, receiver operating characteristic; AUC,
area under the curve; PCR, polymerase chain reaction. |
 | Table I.Expression of HOXA13 in the TCGA
database. |
Table I.
Expression of HOXA13 in the TCGA
database.
|
|
| HOXA13 expression
in TCGA |
|---|
|
|
|
|
|---|
| Clinicopathological
feature | N | Mean ± SD | T or F | P-value |
|---|
| Tissue |
|
|
|
|
| Lung
adenocarcinoma | 237 | 3.74±2.694 | 10.527 | <0.001 |
|
Non-cancerous | 9 | 0.92±0.608 |
|
|
| Age, years |
|
|
|
|
|
<60 | 72 | 3.48±2.488 | −0.96 | 0.337 |
|
≥60 | 165 | 3.85±2.779 |
|
|
| Sex |
|
|
|
|
|
Male | 105 | 3.77±2.746 | 0.196 | 0.845 |
|
Female | 132 | 3.70±2.662 |
|
|
| Ethnicity |
|
|
|
|
|
White | 184 | 3.79±2.707 | F=1.318 | 0.270 |
|
Black | 21 | 2.96±2.223 |
|
|
|
Asian | 2 | 5.39±0.069 |
|
|
| T stage |
|
|
|
|
|
T1+T2 | 202 | 3.74±2.672 | −0.093 | 0.926 |
|
T3+T4 | 33 | 3.78±2.874 |
|
|
| N |
|
|
|
|
| NX | 7 | 1.97±1.771 | 2.647 | 0.073 |
|
N0-N1 | 188 | 3.67±2.677 |
|
|
|
N2-N3 | 42 | 4.34±2.775 |
|
|
| M |
|
|
|
|
| MX | 67 | 4.05±2.569 | 0.689 | 0.503 |
| M0 | 155 | 3.63±2.680 |
|
|
| M1 | 12 | 4.11±3.477 |
|
|
| Stage |
|
|
|
|
|
I+II | 142 | 3.58±2.621 | −1.160 | 0.247 |
|
III+IV | 94 | 3.99±2.808 |
|
|
| Status |
|
|
|
|
|
Deceased | 101 | 3.86±2.876 | 0.600 | 0.549 |
|
Living | 136 | 3.64±2.557 |
|
|
| Recurrence |
|
|
|
|
| Distant
metastasis | 42 | 3.86±2.561 | 2.780 | 0.069 |
|
Loco-regional recurrence | 24 | 2.92±2.207 |
|
|
| New
primary tumor | 2 | 0.39±0.486 |
|
|
| Person neoplasm
cancer status |
|
|
|
|
| With
tumor | 87 | 3.68±2.706 | −0.212 | 0.833 |
|
Tumor-free | 123 | 3.76±2.623 |
|
|
Validation of HOXA13 expression based
on oncomine
A total of four sets of data were obtained from
Oncomine, including ‘Hou Lung’ (GSE19188, normal, 65 cases; LUAD,
45 cases), ‘Selamat Lung’ (GSE32863, normal, 58 cases; LUAD, 58
cases), ‘Garber Lung’ (GSE3398, normal, 6 cases; LUAD, 42 cases)
and ‘Okayama Lung’ (GSE31210, normal, 20 cases; LUAD, 226 cases).
In the study undertaken by Hou et al (GSE19188) (27), a particular trend was observed and the
relative expression of HOXA13 was higher in the LUAD tissue group
than in the normal lung tissue group (Fig. 1Ba), but this difference was not
significant (P=0.0583). The expression value of HOXA13 was
significantly higher in the LUAD tissue group compared with the
normal lung tissue group in the study undertaken by Selamat et
al (GSE32863; Fig. 1Bd; P=0.0026)
(28), The expression of HOXA13 was
lower in the LUAD cases compared with normal cases in the study
undertaken by Garber et al (GSE3398; Fig. 1Bb; P=0.1429) (29). The opposite situation was demonstrated
in the study undertaken by Okayama et al (GSE31210; Fig. 1Bc; P=0.5131) (30), consistent with the TCGA data obtained
in the present study.
Validation based on RT-qPCR results of
the clinical samples obtained at our hospital
The expression of HOXA13 in the LUAD group (29
cases) was 0.21±0.150, slightly higher than that in the
non-cancerous group (0.17±0.134; Fig.
1Ca), but this difference was not statistically significant.
The expression value of HOXA13 in the cancerous tissues was 1.3
times that in the non-cancerous tissues. HOXA13 was predominantly
overexpressed in patients with lymph node metastasis, compared with
expression in the non-metastatic group (0.28±0.138 vs. 0.15±0.138;
P=0.020; Fig. 1Cb and Table II). HOXA13 expression was not
significantly correlated with other clinical parameters (Table II). The present study also calculated
the diagnostic value of HOXA13 for LUAD; the results demonstrated
that the AUC was 0.590 (95% CI, 0.442–0.739; P=0.237; Fig. 1Cc). The cut-off value for HOXA13 was
0.13. The sensitivity was 69% and the specificity was 55.2%.
| Table II.Differential expression of HOXA13 in
LUAD tissues based on in-house reverse transcription-quantitative
polymerase chain reaction. |
Table II.
Differential expression of HOXA13 in
LUAD tissues based on in-house reverse transcription-quantitative
polymerase chain reaction.
|
|
| HOXA13 expression
(2−Δct) |
|---|
|
|
|
|
|---|
| Clinicopathological
feature | N | Mean ± SD | T or F | P-value |
|---|
| Tissues |
|
|
|
|
|
Non-cancerous | 29 | 0.17±0.134 | 1.229 | 0.224 |
|
LUAD | 29 | 0.21±0.150 |
|
|
| Size, cm |
|
|
|
|
| ≤3 | 8 | 0.22±0.166 | 0.167 | 0.868 |
|
>3 | 21 | 0.21±0.148 |
|
|
| TNM stage |
|
|
|
|
|
I–II | 16 | 0.19±0.158 | −1.011 | 0.321 |
|
III–IV | 13 | 0.24±0.139 |
|
|
| Sex |
|
|
|
|
|
Male | 20 | 0.21±0.165 | −0.301 | 0.766 |
|
Female | 9 | 0.23±0.119 |
|
|
| Age, years |
|
|
|
|
|
<60 | 19 | 0.23±0.156 | 0.938 | 0.357 |
|
≥60 | 10 | 0.18±0.139 |
|
|
| Smoking |
|
|
|
|
| No | 18 | 0.24±0.144 | 1.455 | 0.157 |
|
Yes | 11 | 0.16±0.153 |
|
|
| EGFR mutation |
|
|
|
|
|
Wild-type | 16 | 0.20±0.171 | −0.520 | 0.607 |
|
Mutation | 12 | 0.23±0.130 |
|
|
| EGFR |
|
|
|
|
| No | 18 | 0.20±0.157 | −0.444 | 0.661 |
|
Yes | 10 | 0.23±0.151 |
|
|
| Vascular
invasion |
|
|
|
|
| No | 28 | 0.21±0.152 | 0.413 | 0.683 |
|
Yes | 1 | 0.15±0 |
|
|
| LNM |
|
|
|
|
| No | 15 | 0.15±0.138 | −2.467 | 0.020 |
|
Yes | 14 | 0.28±0.138 |
|
|
| EGFR protein |
|
|
|
|
|
Low | 19 | 0.20±0.141 | −0.680 | 0.502 |
|
High | 9 | 0.24±0.181 |
|
|
| MET |
|
|
|
|
|
Low | 16 | 0.20±0.150 | −0.550 | 0.587 |
|
High | 12 | 0.23±0.161 |
|
|
| Grading |
|
|
|
|
| I | 5 | 0.19±0.082 | F=0.151 | 0.860 |
| II | 21 | 0.22±0.172 |
|
|
|
III | 3 | 0.18±0.062 |
|
|
Validation using cell line data from
CCLE
A total of 191 lung cancer cell lines were selected.
Each cell line had a corresponding value of HOXA13 expression. The
heat-map for expression of HOXA13 in the lung cancer cell lines
revealed that more than half of the bands were red, indicating
overexpression of HOXA13 (Fig. 2;
Table III).
| Table III.Expression of HOXA13 in 191 cells
lines from Cancer Cell Line Encyclopedia. |
Table III.
Expression of HOXA13 in 191 cells
lines from Cancer Cell Line Encyclopedia.
| Cell line | HOXA13 | Cell line | HOXA13 | Cell line | HOXA13 | Cell line | HOXA13 | Cell line | HOXA13 |
|---|
| DV90 | 4.2788 | NCIH841 | 0.7102 | NCIH3255 | −0.5043 | HARA | −1.7142 | NCIH2286 | −2.9416 |
| DMS79 | 3.5889 | RERFLCSQ1 | 0.6849 | IALM | −0.5156 | HCC827 | −1.8388 | LC1F | −2.4488 |
| NCIH2887 | 3.5289 | NCIH889 | 0.5643 | NCIH727 | −0.6598 | NCIH1944 | −1.8399 | EBC1 | −3.3316 |
| NCIH596 | 3.1766 | NCIH1876 | 0.5404 | NCIH1693 | −0.6740 | NCIH661 | −1.8609 | NCIH322 | −3.4082 |
| NCIH1623 | 2.8782 | HCC95 | 0.5247 | SCLC21H | −0.6794 | NCIH2081 | −2.0335 | NCIH2030 | −3.4197 |
| SW1573 | 2.3578 | NCIH1563 | 0.3759 | NCIH2342 | −0.7339 | NCIH1573 | −2.0509 | CORL88 | −3.4777 |
| NCIH1651 | 2.0894 | NCIH2196 | 0.3758 | CORL47 | −0.7433 | CAL12T | −2.1320 | RERFLCAD2 | −3.6440 |
| COLO668 | 1.8870 | NCIH2171 | 0.3050 | EPLC272H | −0.7532 | NCIH1299 | −2.1557 | NCIH1373 | −3.8323 |
| HCC1588 | 1.8287 | SBC5 | 0.2387 | NCIH1703 | −0.7879 | NCIH3122 | −2.1605 | NCIH1734 | −3.9098 |
| NCIH526 | 1.6789 | NCIH2882 | 0.2228 | CORL95 | −0.8017 | NCIH69 | −2.2024 | NCIH2009 | −3.9414 |
| NCIH2077 | 1.6358 | NCIH2444 | 0.2217 | NCIH446 | −0.8065 | NCIH1975 | −2.2074 | NCIH1339 | −4.0712 |
| NCIH1341 | 1.6292 | NCIH1581 | 0.2110 | SKMES1 | −0.8347 | NCIH209 | −2.2441 | NCIH522 | −4.3385 |
| CORL279 | 1.5814 | LU99 | 0.1984 | RERFLCMS | −0.8564 | NCIH1648 | −2.2627 | CORL23 | −4.3434 |
| HCC33 | 1.4283 | HCC4006 | 0.1795 | NCIH460 | −0.9768 | NCIH226 | −2.2702 | NCIH1781 | −4.4861 |
| HCC1438 | 1.4113 | HCC366 | 0.1595 | HOP62 | −1.0094 | CALU1 | −2.2783 | NCIH510 | −4.7854 |
| KNS62 | 1.3009 | NCIH2228 | 0.1497 | SW1271 | −1.0369 | NCIH1436 | −2.2898 | NCIH2106 | −4.9054 |
| NCIH1435 | 1.2782 | HCC2814 | 0.0881 | SW900 | −1.1013 | NCIH292 | −2.3158 | NCIH1963 | −4.9607 |
| CALU6 | 1.2773 | RERFLCAI | 0.0679 | NCIH23 | −1.1273 | HCC2935 | −2.3359 | DMS53 | −5.0860 |
| NCIH1694 | 1.2156 | NCIH1184 | 0.0594 | NCIH2066 | −1.1527 | NCIH520 | −2.3892 | NCIH2110 | −5.1326 |
| LUDLU1 | 1.2119 | NCIH2085 | 0.0214 | A427 | −1.1568 | LOUNH91 | −2.3994 | NCIH2291 | −5.2189 |
| NCIH82 | 1.1945 | DMS153 | −0.0090 | NCIH2126 | −1.1814 | LK2 | −2.4211 | NCIH211 | −5.2788 |
| NCIH1650 | 1.1769 | CHAGOK1 | −0.0158 | NCIH2087 | −1.2020 | HCC1359 | −2.4218 | BEN | −5.4123 |
| NCIH1819 | 1.1239 | EKVX | −0.0168 | ABC1 | −1.2440 | NCIH2170 | −2.6252 | NCIH1437 | −5.4137 |
| NCIH1155 | 1.0312 | NCIH1048 | −0.0252 | NCIH1355 | −1.2445 | NCIH2073 | −2.6905 | NCIH1915 | −5.5001 |
| NCIH2023 | 1.0235 | LXF289 | −0.0963 | CALU3 | −1.2737 | NCIH1869 | −2.6926 | T3M10 | −5.5230 |
| NCIH1930 | 0.8981 | CORL24 | −0.1000 | DMS114 | −1.2950 | NCIH1618 | −2.7014 | NCIH2122 | −5.8422 |
| NCIH196 | 0.8557 | NCIH1092 | −0.1403 | HCC1171 | −1.3019 | RERFLCKJ | −2.7452 | HCC78 | −6.0506 |
| DMS273 | 0.7985 | HCC2279 | −0.2188 | CORL311 | −1.4516 | HCC827GR5 | −2.8388 | RERFLCAD1 | −6.1791 |
| NCIH1793 | 0.7809 | NCIH1105 | −0.2479 | NCIH524 | −1.6264 | HCC515 | −2.8437 | SKLU1 | −6.3869 |
| A549 | 0.7753 | NCIH1568 | −0.2807 | NCIH838 | −1.6329 | NCIH1666 | −2.8924 | NCIH1385 | −6.5059 |
| NCIH1792 | 0.7682 | HCC1195 | −0.3623 | NCIH647 | −1.6949 | NCIH1395 | −2.9056 | HCC44 | −6.5331 |
| NCIH2172 | 0.7273 | NCIH810 | −0.3718 | NCIH2405 | −1.7055 | PC9 | −2.9099 | HCC2108 | −6.5814 |
| HCC1833 | −6.6062 | DMS454 | −7.1460 | NCIH2029 | −8.0433 | NCIH441 | −9.4254 | TIG3TD | −13 |
| NCIH1755 | −6.6439 | NCIH2347 | −7.2593 | HS618T | −8.1545 | HCC15 | −13 | HCC364 | −13 |
| NCIH146 | −6.6492 | MORCPR | −7.2787 | HLFA | −8.2115 | NCIH650 | −13 | HCC2450 | −13 |
| LCLC103H | −6.6823 | CORL105 | −7.2875 | HCC461 | −8.2172 | HS229T | −13 | HOP92 | −7.1239 |
| NCIH2227 | −6.8438 | SHP77 | −7.3918 | LCLC97TM1 | −8.8350 | NCIH1836 | −13 | LU65 | −7.7276 |
| NCIH854 | −7.0889 | HCC2429 | −7.6487 | NCIH358 | −9.2515 | SQ1 | −13 | NCIH1838 | −9.3866 |
| SALE | −13 |
|
|
|
|
|
|
|
|
Meta-analyses
To obtain a comprehensive result of HOXA13
expression in LUAD, data from TCGA, Oncomine and in-house PCR were
integrated, and a meta-analysis was performed. Using the
random-effects model, the pooled SMD for HOXA13 was 0.346 (95% CI,
0.052–0.640; P=0.068; I2=51.3%; P=0.021; Fig. 3A). The meta-analyses of diagnostic
tests revealed that the AUC for the SROC of HOXA13 in LUAD was 0.78
(95% CI, 0.75–0.82; Fig. 3B). The
pooled SEN, SPE, PLR, NLR, DS and DOR of HOXA13 in these studies
were 0.64 (95%CI, 0.31–0.88), 0.77 (95% CI, 0.55–0.90), 2.81 (95%
CI, 1.72–4.58), 0.46 (95% CI, 0.22–0.97), 1.80 (95% CI, 0.92–2.68)
and 6.05 (95% CI, 2.52–14.54), respectively (Fig. 3C-H). The aforementioned results
demonstrated that HOXA13 was highly expressed in LUAD, based on 6
independent studies and 826 cases.
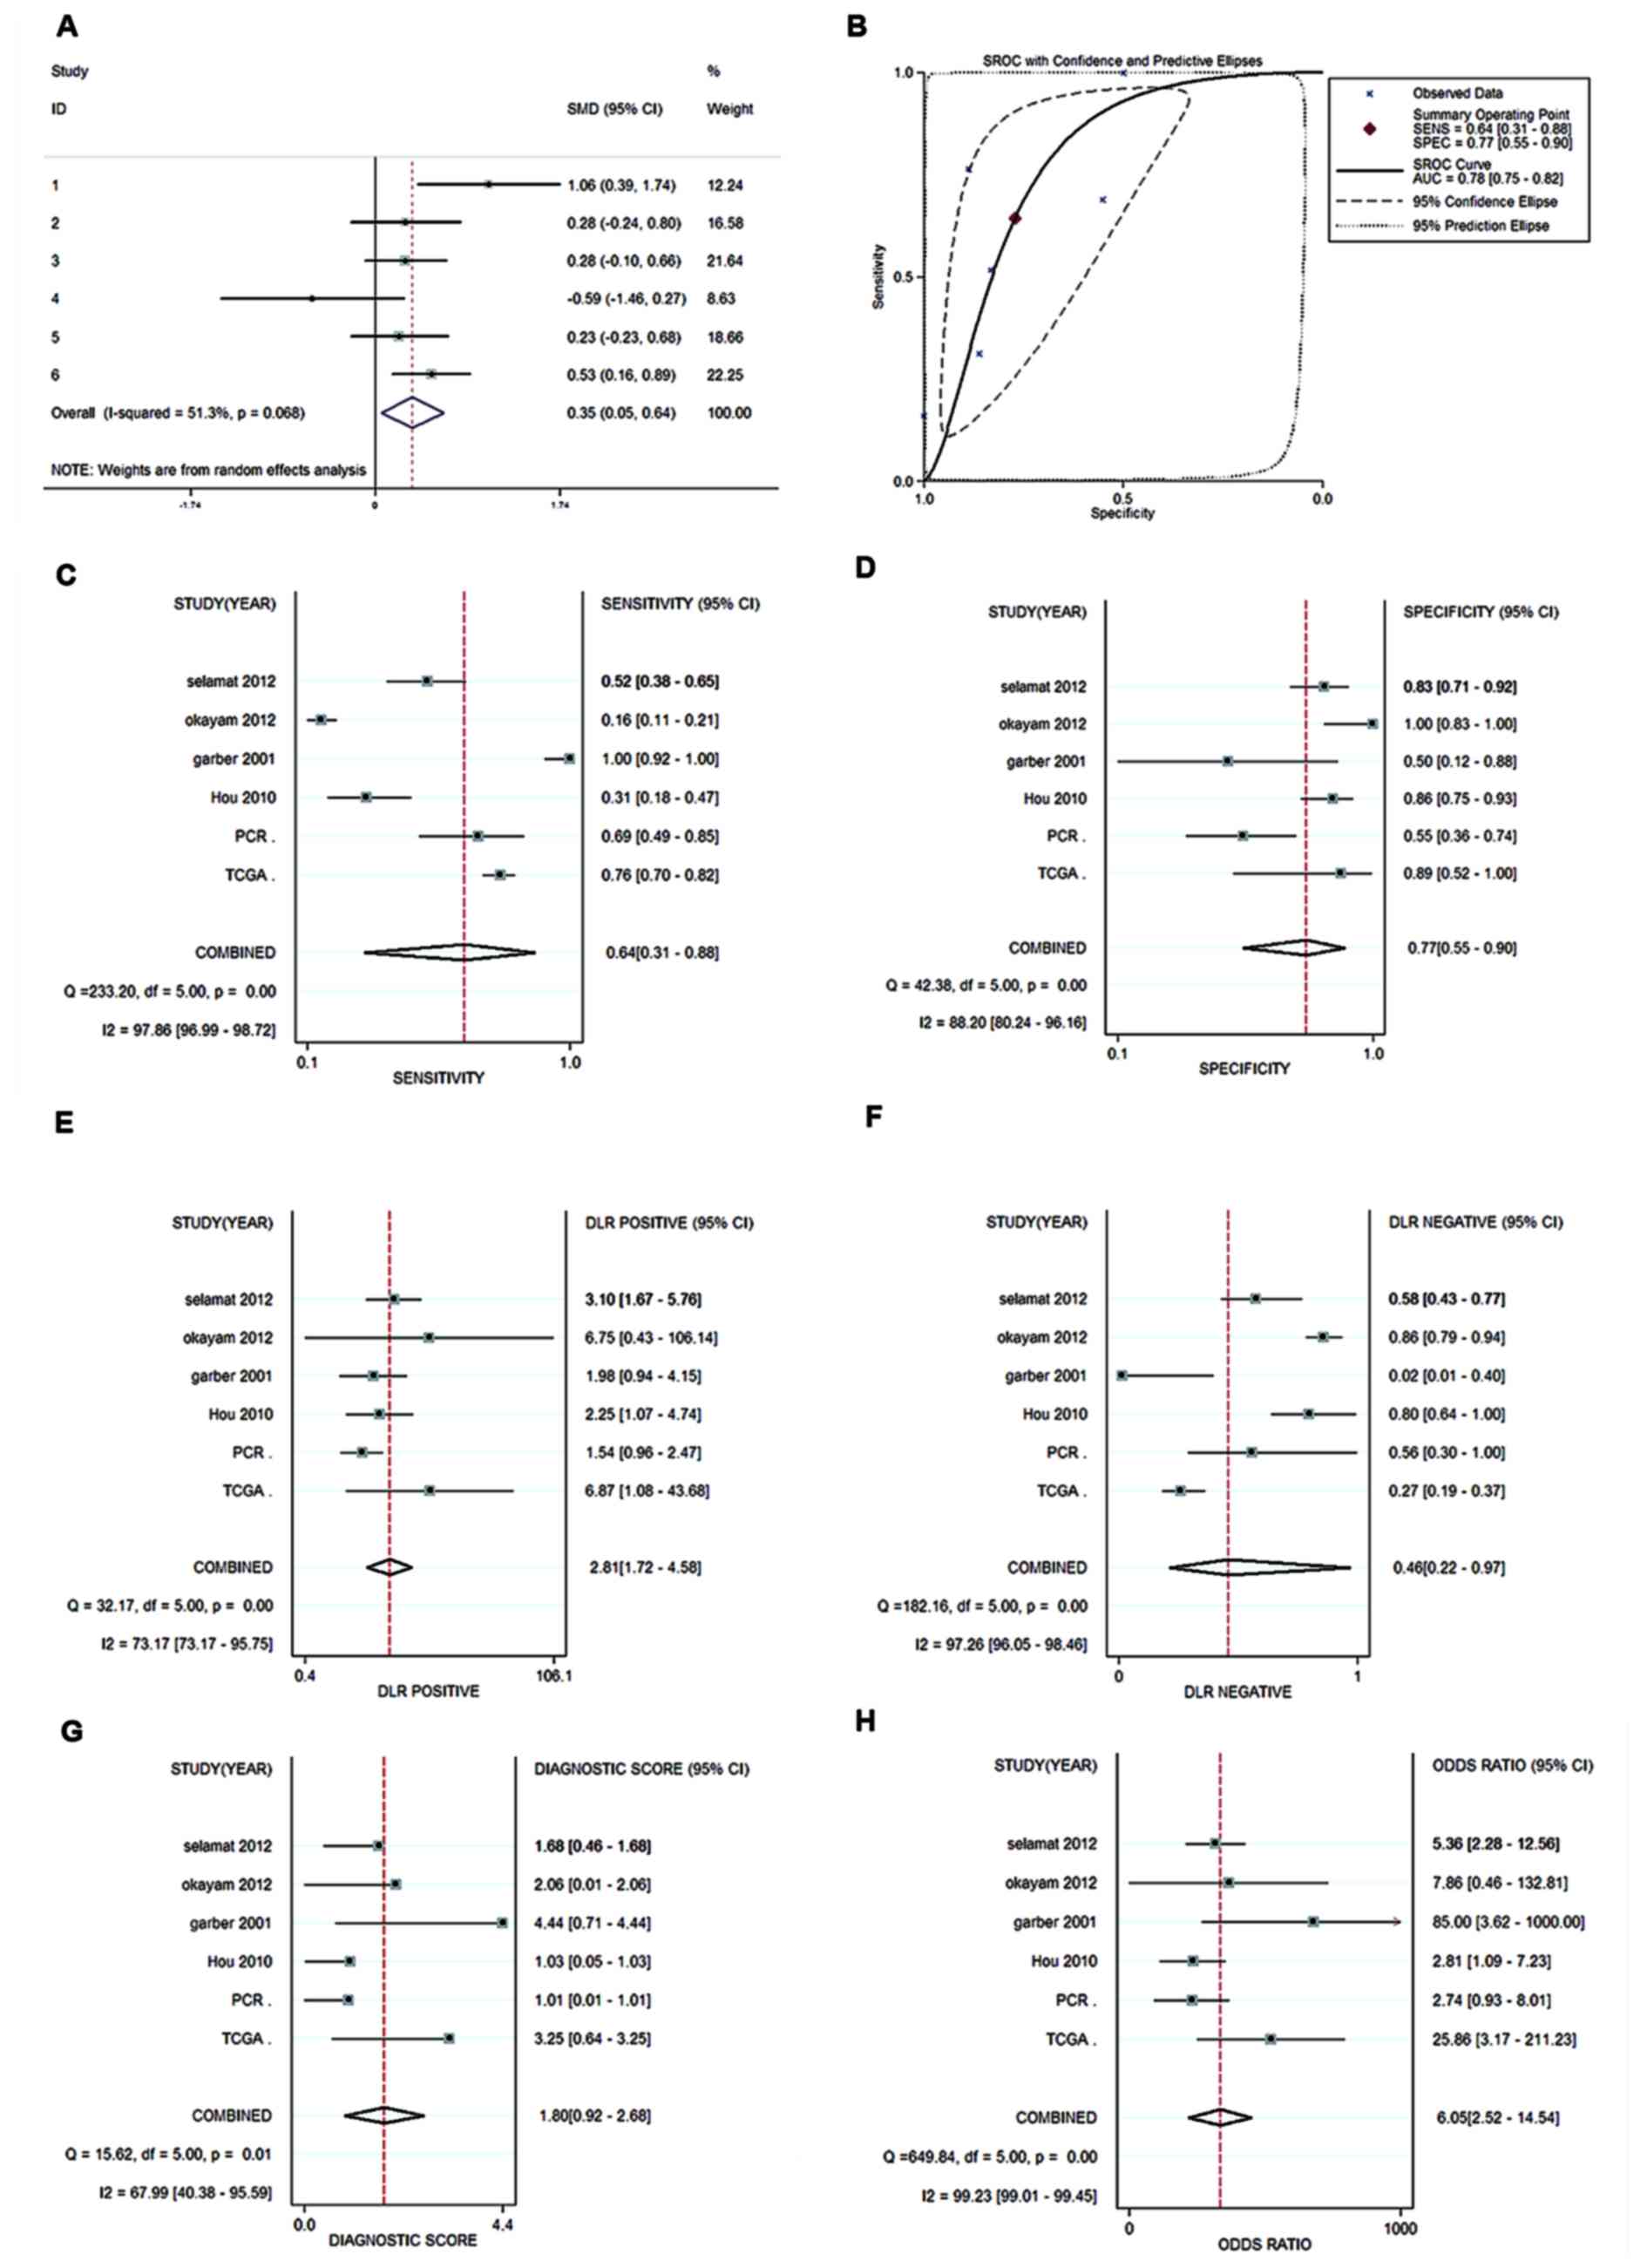 | Figure 3.Meta-analysis. (A) Forest plot of
meta-analyses of the diagnostic value of HOXA13 expression for
patients with LUAD with six datasets involved. Random effects model
was applied when combining SMD. (B) SROC curve for HOXA13
expression for patients with LUAD with six datasets involved. Each
solid circle represents a study. The size of the solid circle
represents the sample size of each eligible study. The overall
diagnostic efficiency was summarized by the regression curve. (C)
Forest plot of sensitivity for HOXA13 in LUAD. (D) Forest plot of
specificity for HOXA13 in LUAD. (E) Forest plot of PLR for HOXA13
in LUAD. (F) Forest plot of NLR for HOXA13 in LUAD. (G) DS for
HOXA13 in LUAD. (H) Diagnostic OR for HOXA13 in LUAD. Each solid
circle represents a study. The size of the solid circle reflects
the sample size of each study; the error bars represent the 95% CI.
LUAD, lung adenocarcinoma; SMD, standardized mean difference; SROC,
summary receiver operating characteristic; AUC, area under the
curve; SE, standard error; PLR, positive likelihood ratio; NLR,
negative likelihood ratio; DS, diagnostic score; OR, odds ratio;
CI, confidence intervals, SENS, sensitivity; SPEC, specificity;
PCR, polymerase chain reaction. |
Prediction of related genes and
gene-enrichment and functional annotation analyses
There were 20,437 genes co-expressed with HOXA13 in
cBioPortal and 717 genes co-expressed with HOXA13 in MEM. A total
of 679 genes were obtained in the intersection of the
aforementioned two groups of co-expressed genes. The significantly
enriched biological terms were identified by their P-values of less
than 0.05 (Table III). The results
demonstrated that the target genes were most highly enriched in the
following biological pathways: Steroid hormone-mediated signaling
pathway, positive regulation of transcription from RNA polymerase
II promoter, and negative regulation of transcription,
DNA-templated (P<0.001; Table IV;
Figs. 4 and 5). KEGG pathway analysis results
demonstrated that the HOXA13-related genes were enriched in the
following pathways: Proteoglycans in cancer, pathways in cancer,
peroxisome and cAMP signaling pathway (Table IV). To better understand the
functions of these co-expressed genes, a functional network was
built based on the results of functional analyses.
| Table IV.HOXA13-related signaling pathways in
lung adenocarcinoma. The top ten significant pathways in KEGG and
GO. |
Table IV.
HOXA13-related signaling pathways in
lung adenocarcinoma. The top ten significant pathways in KEGG and
GO.
| Category | ID | GO terms | Count | % | P-value |
|---|
| KEGG_PATHWAY | hsa05205 | Proteoglycans in
cancer | 17 | 0.01558 | 0.00140 |
| KEGG_PATHWAY | hsa05200 | Pathways in
cancer | 26 | 0.02383 | 0.00205 |
| KEGG_PATHWAY | hsa04146 | Peroxisome | 10 | 0.00917 | 0.00209 |
| KEGG_PATHWAY | hsa04024 | cAMP signaling
pathway | 16 | 0.01467 | 0.00334 |
| KEGG_PATHWAY | hsa00920 | Sulfur
metabolism | 4 | 0.00367 | 0.00405 |
| KEGG_PATHWAY | hsa04728 | Dopaminergic
synapse | 12 | 0.01100 | 0.00448 |
| KEGG_PATHWAY | hsa04070 |
Phosphatidylinositol signaling system | 10 | 0.00917 | 0.00641 |
| KEGG_PATHWAY | hsa04916 | Melanogenesis | 10 | 0.00917 | 0.00730 |
| KEGG_PATHWAY | hsa04921 | Oxytocin signaling
pathway | 13 | 0.01192 | 0.00816 |
| KEGG_PATHWAY | hsa04020 | Calcium signaling
pathway | 14 | 0.01283 | 0.00865 |
|
GOTERM_CC_DIRECT | GO:0070062 | Extracellular
exosome | 154 | 0.14116 | 2.47E-09 |
|
GOTERM_CC_DIRECT | GO:0005794 | Golgi
apparatus | 60 | 0.05500 | 4.53E-07 |
|
GOTERM_CC_DIRECT | GO:0000139 | Golgi membrane | 45 | 0.04125 | 1.54E-06 |
|
GOTERM_CC_DIRECT | GO:0016020 | Membrane | 117 | 0.10724 | 1.81E-06 |
|
GOTERM_CC_DIRECT | GO:0005783 | Endoplasmic
reticulum | 52 | 0.04766 | 4.65E-05 |
|
GOTERM_CC_DIRECT | GO:0005789 | Endoplasmic
reticulum membrane | 52 | 0.04766 | 1.34E-04 |
|
GOTERM_CC_DIRECT | GO:0016324 | Apical plasma
membrane | 24 | 0.02200 | 2.08E-04 |
|
GOTERM_CC_DIRECT | GO:0005777 | Peroxisome | 13 | 0.01191 | 2.49E-04 |
|
GOTERM_CC_DIRECT | GO:0048471 | Perinuclear region
of cytoplasm | 40 | 0.03667 | 2.49E-04 |
|
GOTERM_CC_DIRECT | GO:0005829 | Cytosol | 149 | 0.13657 | 3.92E-04 |
|
GOTERM_MF_DIRECT | GO:0043565 | Sequence-specific
DNA binding | 44 | 0.04033 | 1.22E-07 |
|
GOTERM_MF_DIRECT | GO:0003707 | Steroid hormone
receptor activity | 9 | 0.00825 | 6.64E-04 |
|
GOTERM_MF_DIRECT | GO:0005096 | GTPase activator
activity | 22 | 0.02017 | 7.84E-04 |
|
GOTERM_MF_DIRECT | GO:0005515 | Protein
binding | 343 | 0.31440 | 0.00120 |
|
GOTERM_MF_DIRECT | GO:0000978 | RNA polymerase II
core promoter proximal region sequence-specific DNA binding | 25 | 0.02292 | 0.00154 |
|
GOTERM_MF_DIRECT | GO:0005509 | Calcium ion
binding | 41 | 0.03758 | 0.00227 |
|
GOTERM_MF_DIRECT | GO:0017137 | Rab GTPase
binding | 13 | 0.01192 | 0.00249 |
|
GOTERM_MF_DIRECT | GO:0019902 | Phosphatase
binding | 7 | 0.00642 | 0.00443 |
|
GOTERM_MF_DIRECT | GO:0008134 | Transcription
factor binding | 20 | 0.01833 | 0.00509 |
|
GOTERM_MF_DIRECT | GO:0000287 | Magnesium ion
binding | 16 | 0.01467 | 0.00522 |
|
GOTERM_BP_DIRECT | GO:0009952 | Anterior/posterior
pattern specification | 14 | 0.01283 | 3.74E-06 |
|
GOTERM_BP_DIRECT | GO:0043401 | Steroid
hormone-mediated signaling pathway | 11 | 0.01010 | 2.48E-05 |
|
GOTERM_BP_DIRECT | GO:0001657 | Ureteric bud
development | 9 | 0.00825 | 4.11E-05 |
|
GOTERM_BP_DIRECT | GO:0035115 | Embryonic forelimb
morphogenesis | 8 | 0.00733 | 9.67E-05 |
|
GOTERM_BP_DIRECT | GO:0043547 | Positive regulation
of GTPase activity | 38 | 0.03483 | 1.97E-04 |
|
GOTERM_BP_DIRECT | GO:0045944 | Positive regulation
of transcription from RNA polymerase II promoter | 57 | 0.05225 | 2.02E-04 |
|
GOTERM_BP_DIRECT | GO:0007031 | Peroxisome
organization | 6 | 0.00550 | 3.01E-04 |
|
GOTERM_BP_DIRECT | GO:0042733 | Embryonic digit
morphogenesis | 9 | 0.00825 | 6.87E-04 |
|
GOTERM_BP_DIRECT | GO:0045892 | Negative regulation
of transcription, DNA-templated | 33 | 0.03025 | 7.35E-04 |
|
GOTERM_BP_DIRECT | GO:0051216 | Cartilage
development | 9 | 0.00825 | 9.79E-04 |
The PPI network
STRING 10.5 was used to conduct an online analysis
of genes enriched in the first four KEGG pathways (proteoglycans in
cancer, pathways in cancer, peroxisomes and the cAMP signaling
pathway) and to construct a protein functional interaction network
for related genes (Fig. 6). The nine
genes were combined and eight different genes were obtained. We
hypothesized that these eight genes, epidermal growth factor
receptor (EGFR), Rac family small GTPase 1 (RAC1), acetyl-CoA
acyltransferase 1 (ACAA1), catalase (CAT), enoyl-CoA hydratase and
3-hydroxyacyl CoA dehydrogenase (EHHADH), peroxisomal biogenesis
factor 11α (PEX11A), calcium/calmodulin-dependent protein kinase
IIγ (CAMK2G) and calcium/calmodulin-dependent protein kinase II∆
(CAMK2D), are the hub genes associated with HOXA13.
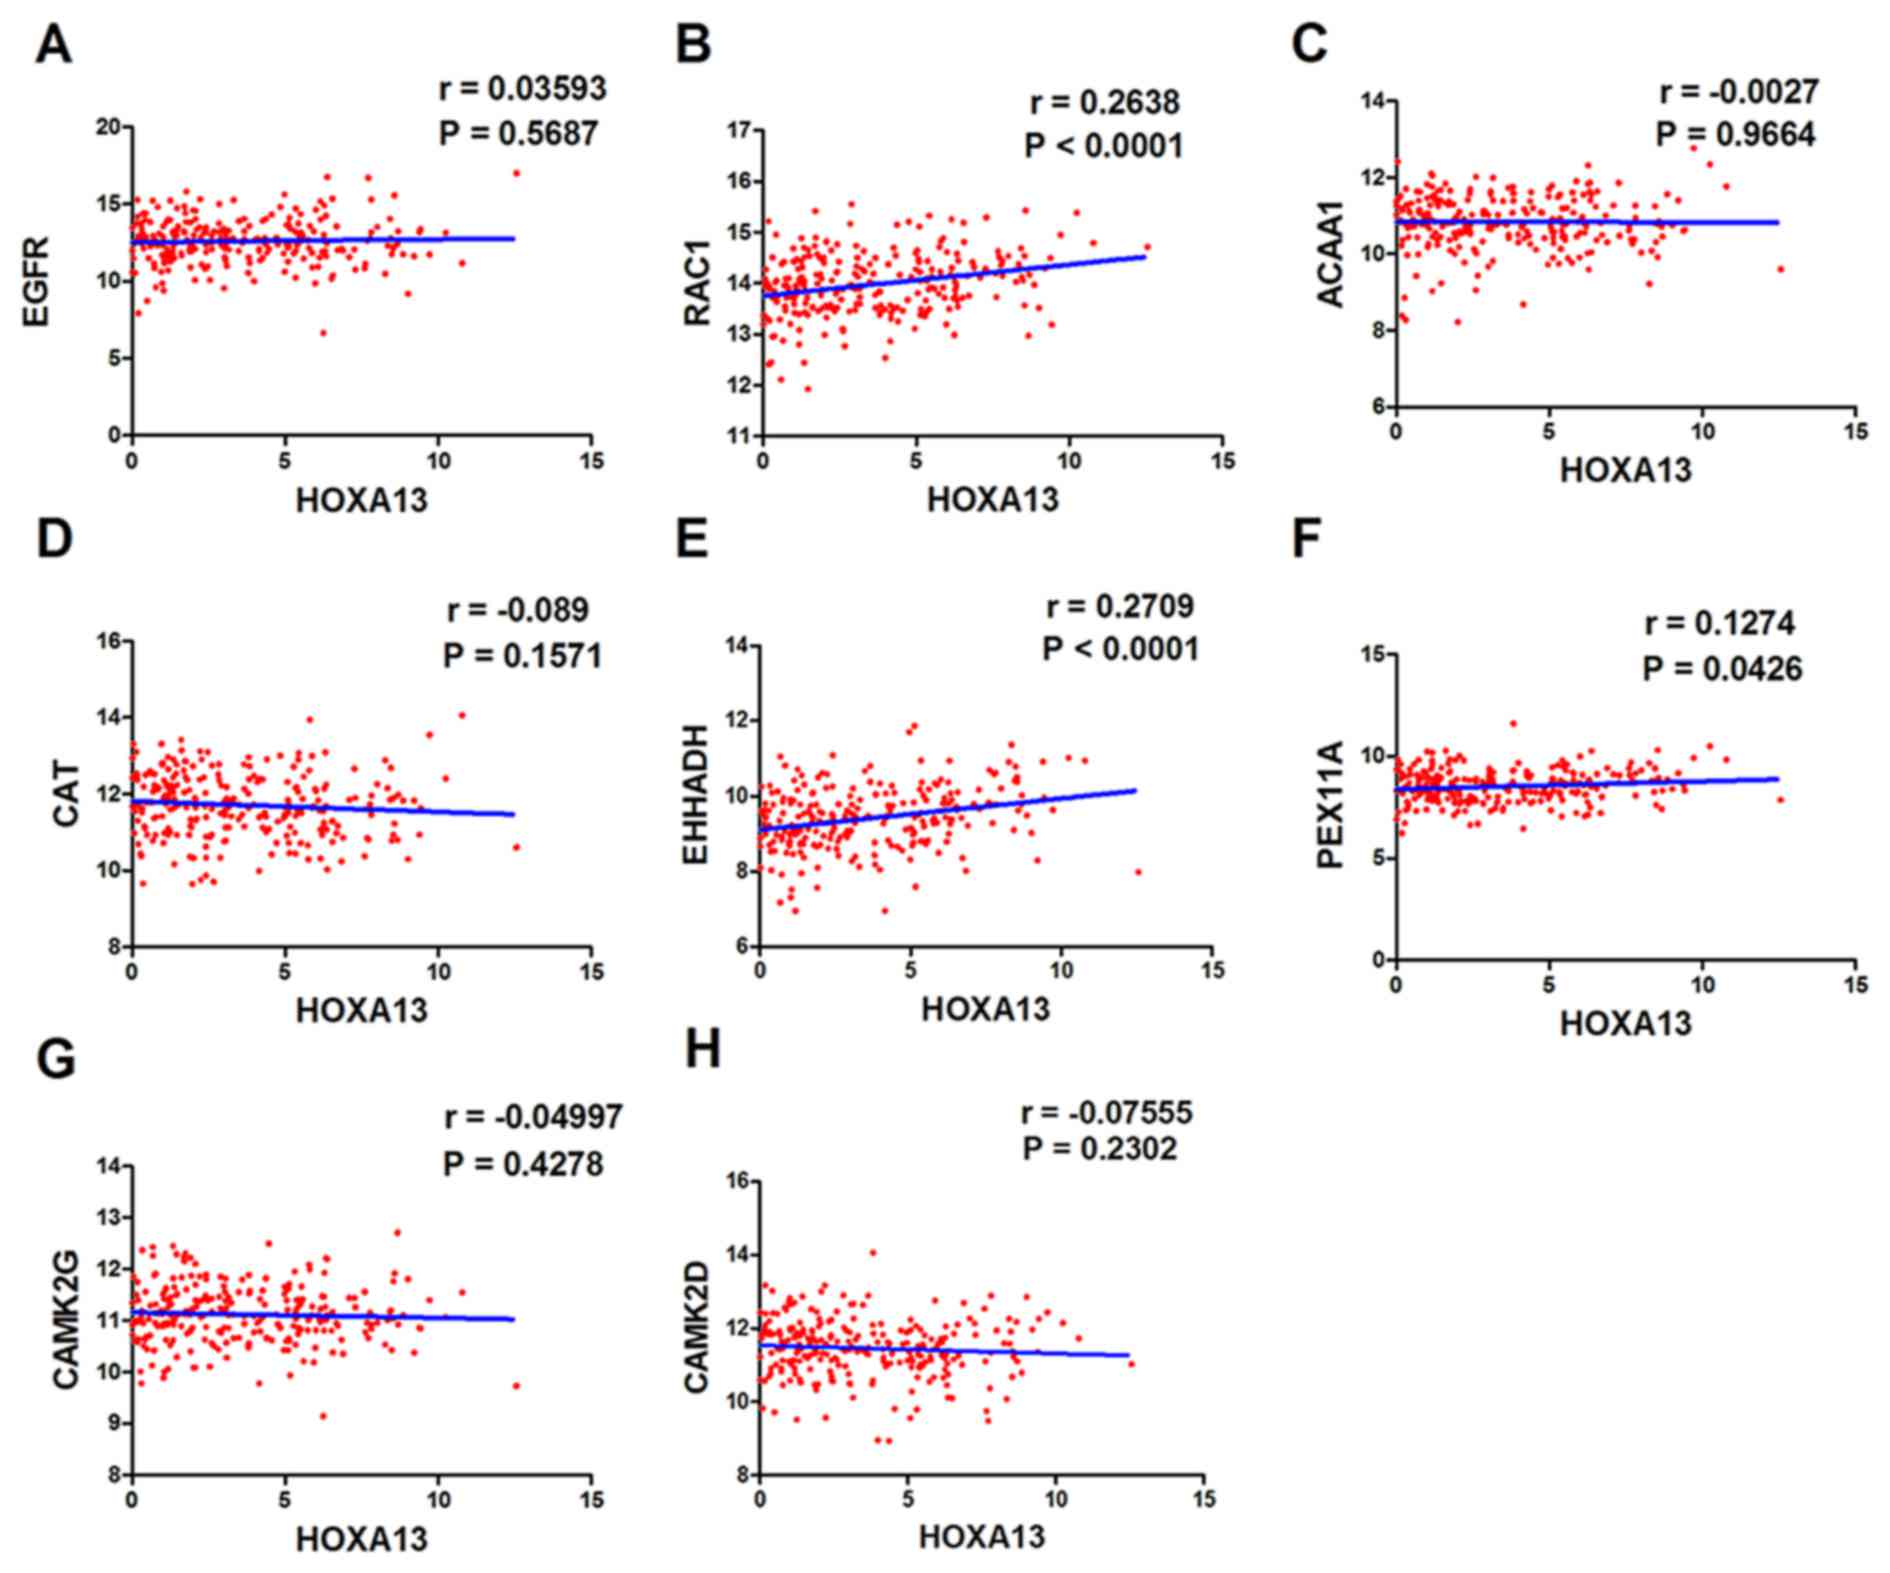
Correlation of the expression of
HOXA13 with that of individual hub genes
Based on the gene expression values in the TCGA
database, the associations between the expression of HOXA13 and
that of each of the eight hub genes in the tissues of patients with
LUAD were verified. HOXA13 expression was significantly positively
correlated with the expression of three of the eight hub genes:
RAC1 (r=0.2638; P<0.0001), EHHADH (r=0.2709; P<0.0001) and
PEX11A (r=0.1274; P=0.0426). The correlation between HOXA13
expression and that of the other hub genes was not statistically
significant (Fig. 7).
The expression of hub genes in the
TCGA database
Expression of hub genes in normal and LUAD cases
were as follows (normal, 59 cases; LUAD, 535 cases): Expression of
EGFR in LUAD cases was lower compared with normal cases (P=0.5082;
Fig. 8A), the opposite was observed
in RAC1 (P=0.0058; Fig. 8B).
Expression of ACAA1 in LUAD cases was lower compared with normal
cases (P<0.0001; Fig. 8C) and the
same trend was observed in CAT (P<0.0001; Fig. 8D). Expression of EHHADH in LUAD cases
was higher compared with normal cases (P=0.5131; Fig. 8E) and the opposite result was
identified in PEX11A (P=0.0003; Fig.
8F). CAMK2G demonstrated a higher expression level in LUAD
cases compared with normal cases (P=0.1305; Fig. 8G) and the opposite result was observed
in CAMK2D (P=0.7277; Fig. 8H) The ROC
curve of each of the hub genes was also calculated; the results
demonstrated that the AUC of EGFR was 0.532 (95% CI, 0.482–0.583;
P=0.415), the cut-off value for EGFR was 12.33, and the sensitivity
and specificity were 83.1 and 42.6%, respectively. The AUC of RAC1
was 0.633 (95% CI, 0.581–0.685; P=0.001), the cut-off value for
RAC1 was 13.84, and the sensitivity and specificity were 55 and
78%, respectively. The AUC of ACAA1 was 0.700 (95% CI, 0.65–0.75;
P=0.0001), the cut-off value for ACAA1 was 10.96, and the
sensitivity and specificity were 91.5 and 48.2%, respectively. The
AUC of CAT was 0.989 (95% CI, 0.982–0.996; P=0.0001), the cut-off
value for CAT was 13.2, and the sensitivity and specificity were
98.3 and 95.5%, respectively. The AUC of EHHADH was 0.532 (95% CI,
0.481–0.583; P=0.421), the cut-off value for EHHADH was 9.78, and
the sensitivity and specificity were 26 and 100%, respectively. The
AUC of PEX11A was 0.677 (95% CI, 0.626–0.728; P=0.0001), the
cut-off value for PEX11A was 8.57, and the sensitivity and
specificity were 88.1 and 53.1%, respectively. The AUC of CAMK2G
was 0.563 (95% CI, 0.513–0.614; P=0.110), the cut-off value for
CAMK2G was 11.29, and the sensitivity and specificity were 41.9 and
89.8%, respectively. The AUC of CAMK2D was 0.516 (95% CI,
0.688–0.468; P=0.563), the cut-off value for CAMK2D was 11.16, and
the sensitivity and specificity were 96.6 and 30.5%, respectively
(Fig. 9A-H; Table V).
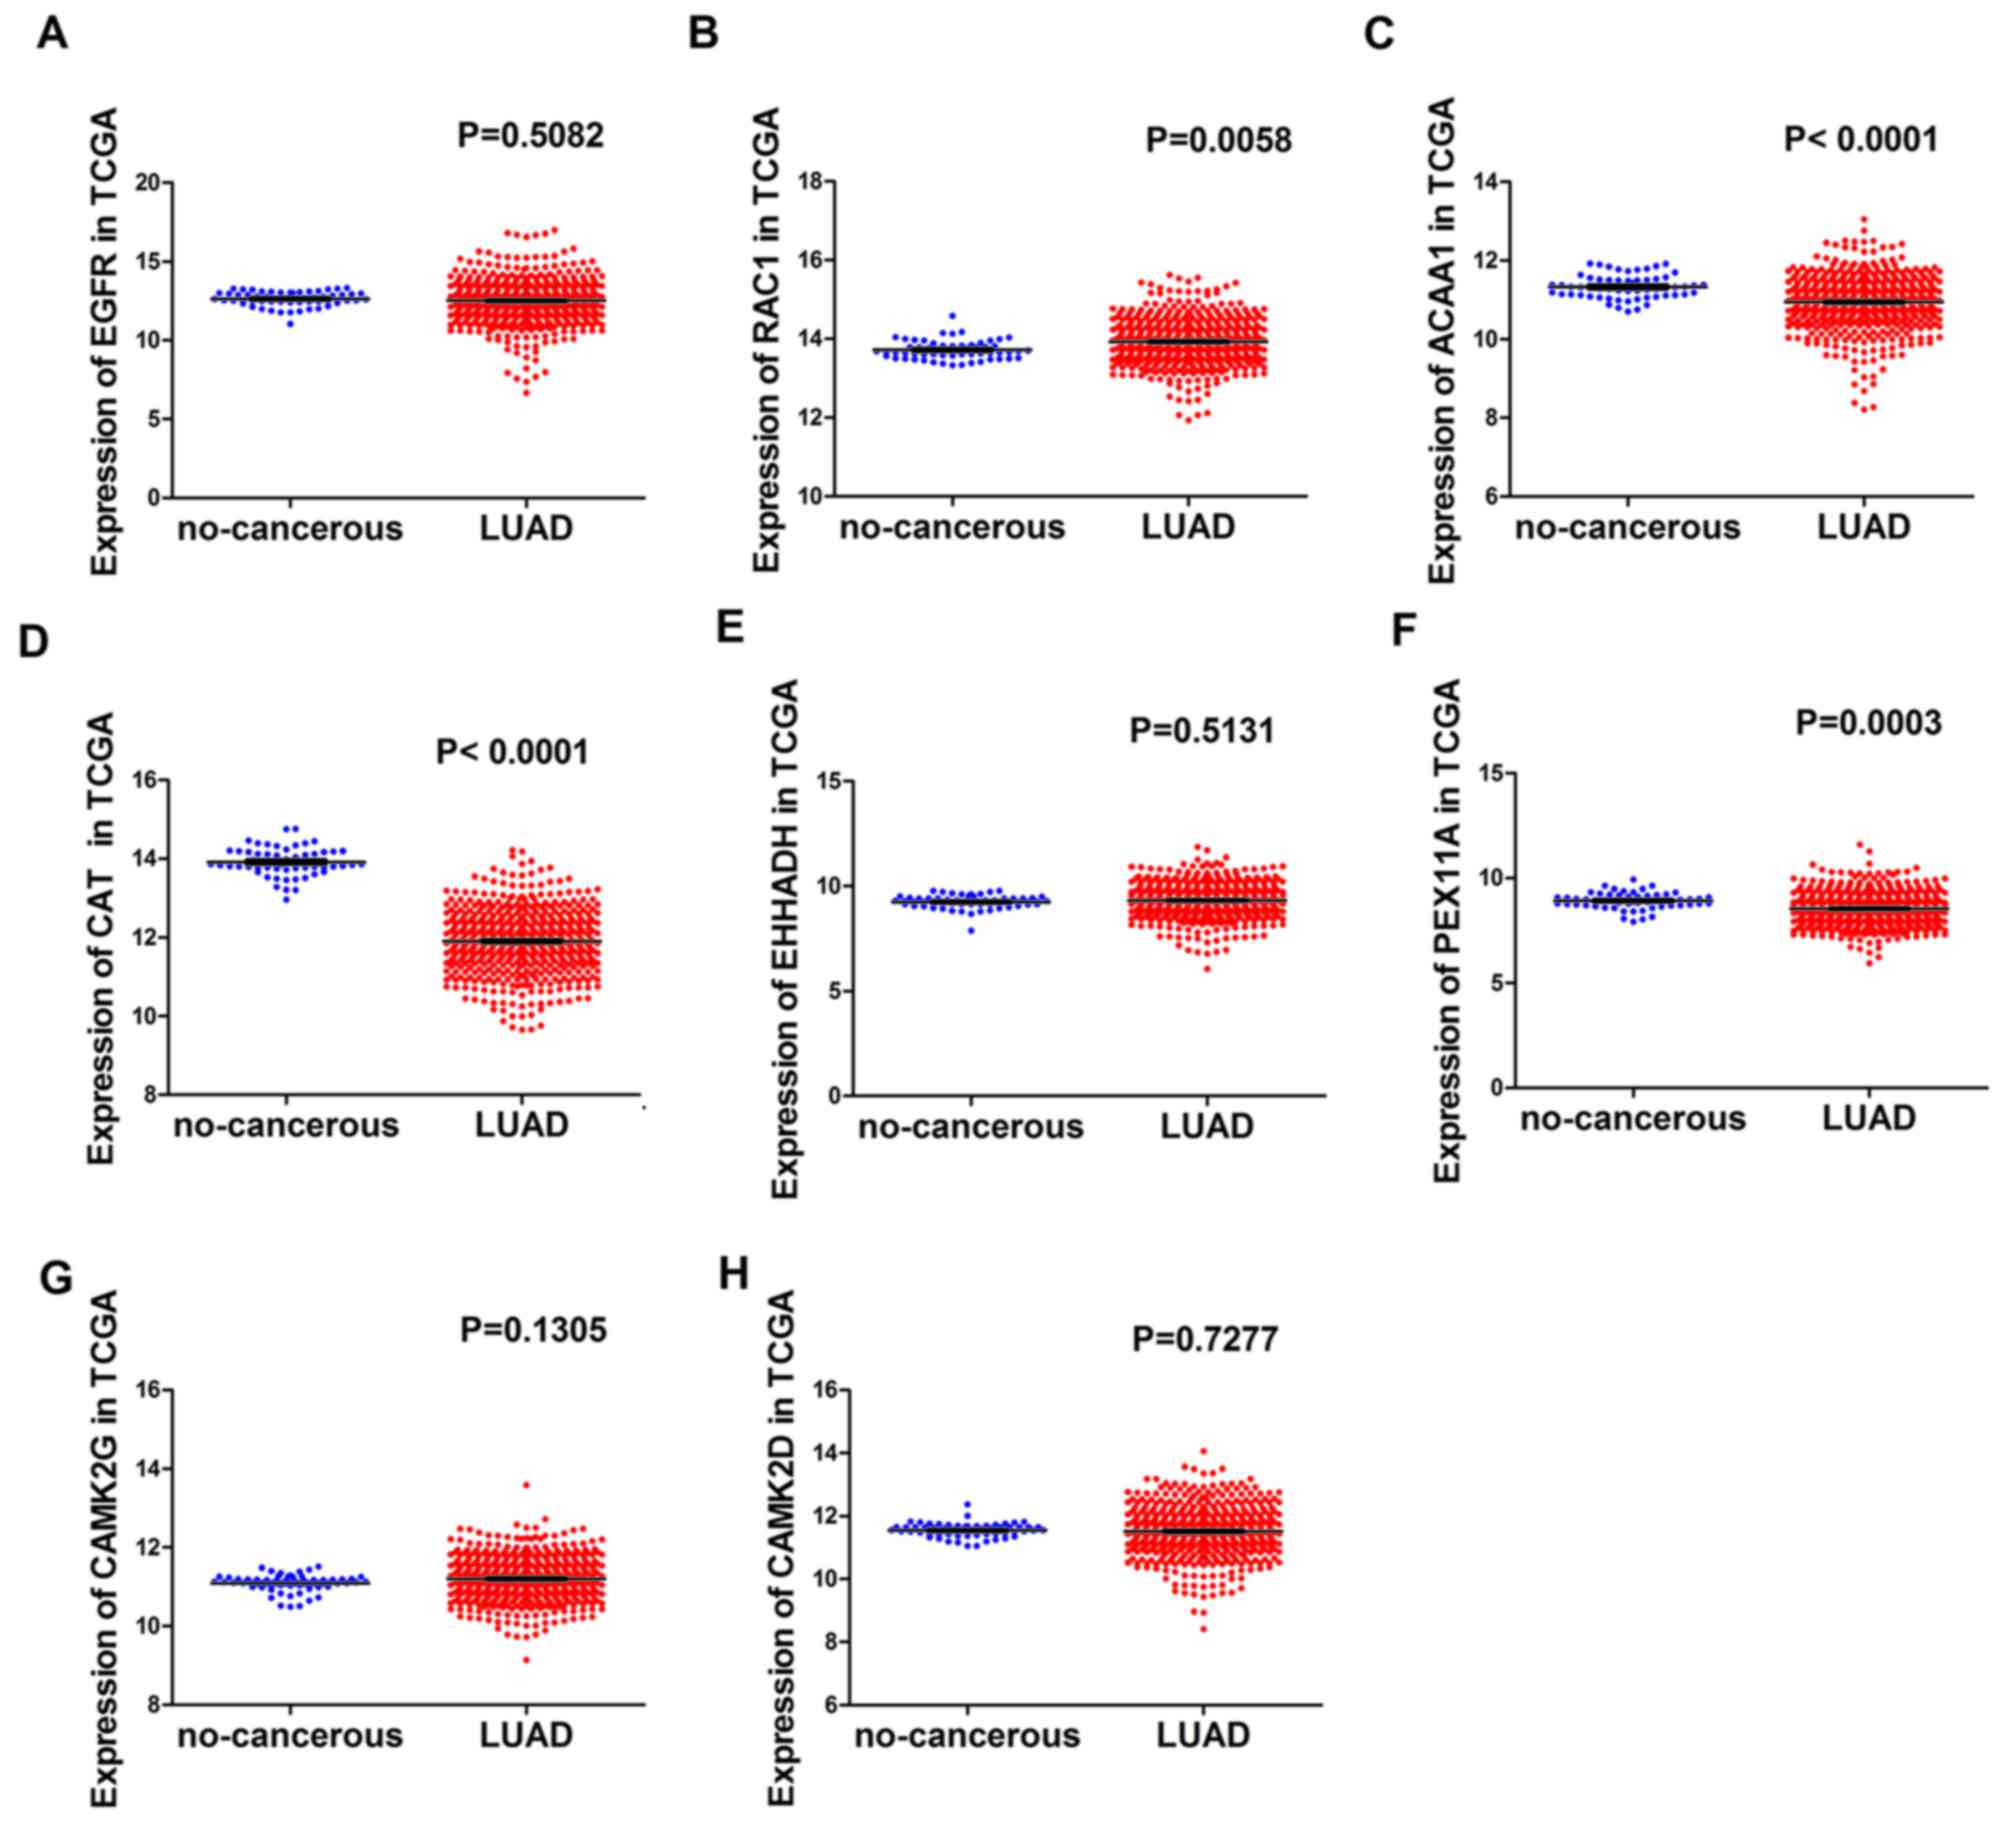 | Figure 8.The expression value of hub genes in
the LUAD group and the non-cancerous group in TCGA. (A) EGFR, (B)
RAC1, (C) ACAA1, (D) CAT, (E) EHHADH, (F) PEX11A, (G) CAMK2G and
(H) CAMK2D (normal, 59 cases; lung adenocarcinoma, 535 cases).
LUAD, lung adenocarcinoma; TCGA, The Cancer Genome Atlas; EGFR,
epidermal growth factor receptor; RAC1, Rac family small GTPase 1;
ACAA1, acetyl-CoA acyltransferase 1; CAT, catalase; EHHADH,
enoyl-CoA hydratase and 3-hydroxyacyl CoA dehydrogenase; PEX11A,
peroxisomal biogenesis factor 11α; CAMK2,
calcium/calmodulin-dependent protein kinase II. |
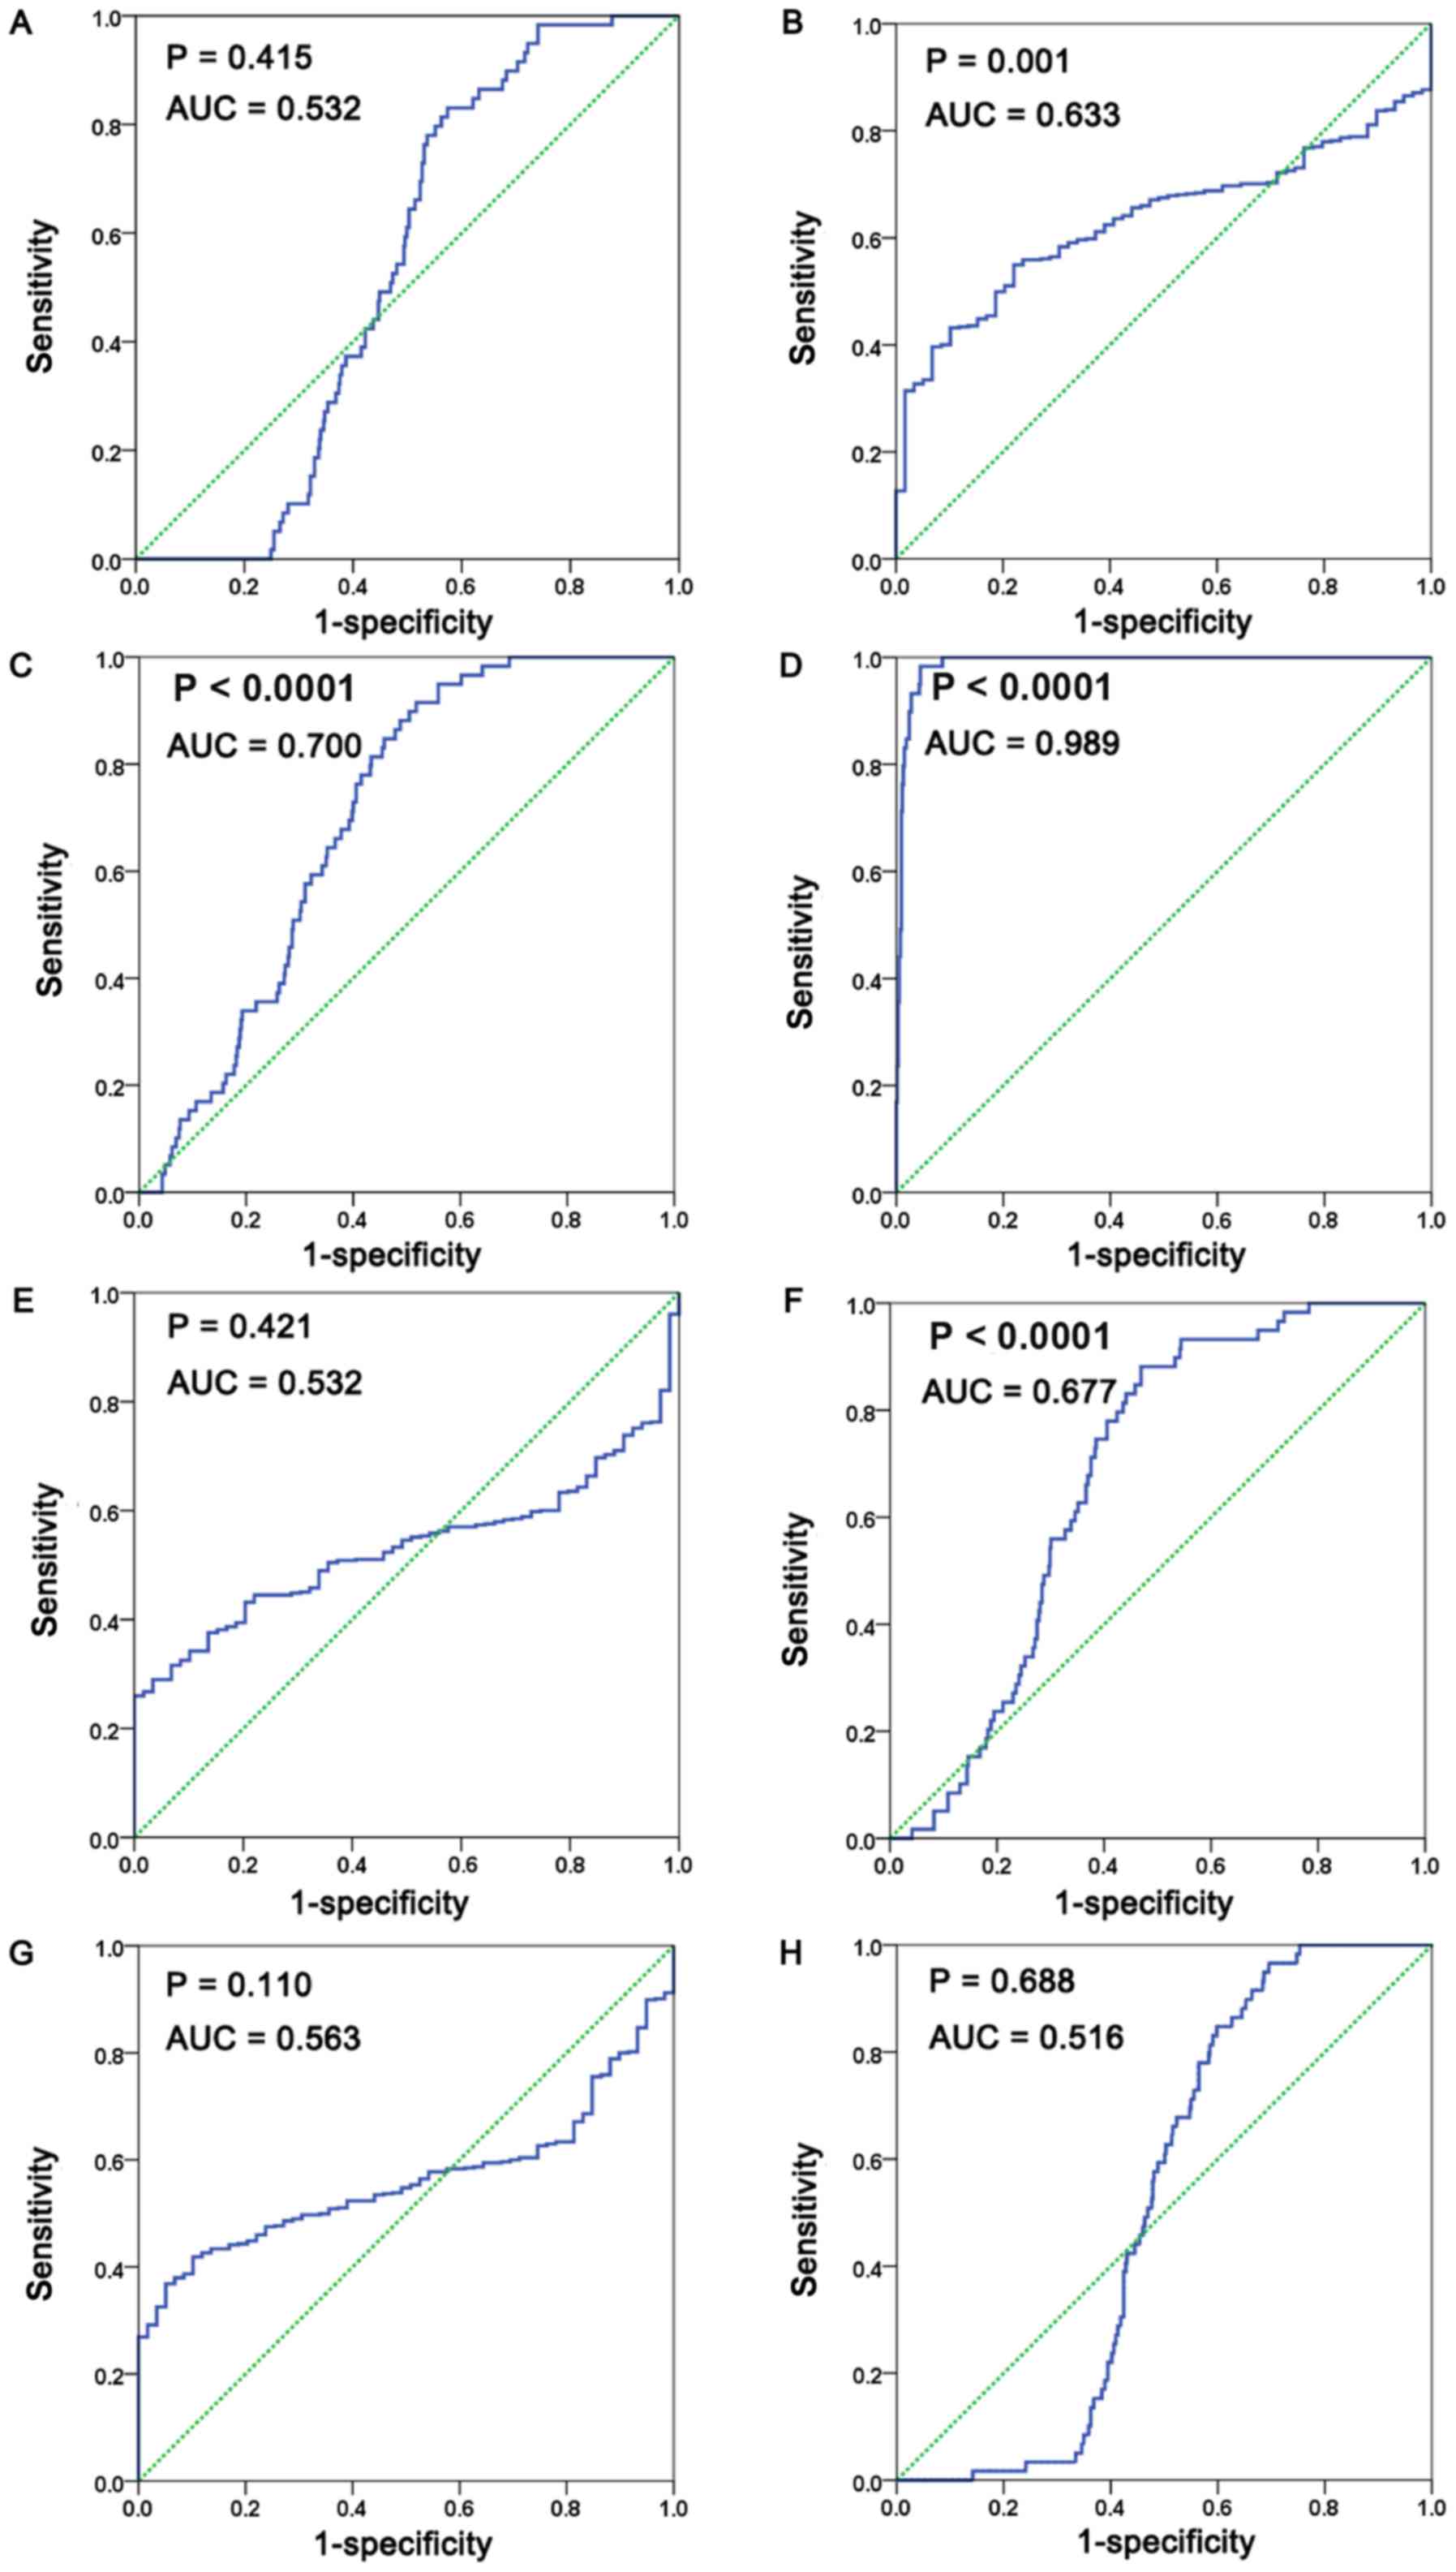 | Figure 9.ROC curve for discrimination of LUAD
from non-cancerous cases. ROC curve of (A) EGFR, (B) RAC1, (C)
ACAA1, (D) CAT, (E) EHHADH, (F) PEX11A, (G) CAMK2G and (H) CAMK2D.
(normal, 59 cases; lung adenocarcinoma, 535 cases). ROC, receiver
operating characteristic; LUAD, lung adenocarcinoma; EGFR,
epidermal growth factor receptor; RAC1, Rac family small GTPase 1;
ACAA1, acetyl-CoA acyltransferase 1; CAT, catalase; EHHADH,
enoyl-CoA hydratase and 3-hydroxyacyl CoA dehydrogenase; PEX11A,
peroxisomal biogenesis factor 11α; CAMK2,
calcium/calmodulin-dependent protein kinase II. |
| Table V.Expression of hub genes in The Cancer
Genome Atlas database. |
Table V.
Expression of hub genes in The Cancer
Genome Atlas database.
|
|
|
|
|
|
|
| Gene
expression |
|---|
|
|
|
|
|
|
|
|
|
|---|
|
| Results of receiver
operating characteristic |
| Mean ± standard
deviation |
|---|
|
|
|
|
|
|---|
| Gene | Specificity, % | Sensitivity, % | P-value | 95% CI | Cut-off value | AUC | P-value | LUAD | Non-cancerous |
|---|
| EGFR | 42.6 | 83.1 | 0.415 | 0.482–0.583 | 12.33 | 0.532 | 0.5082 | 12.50±0.060 | 12.63±0.060 |
| RACE1 | 78 | 55 | 0.001 | 0.581–0.685 | 13.84 | 0.633 | 0.0058 | 13.93±0.025 | 13.72±0.031 |
| ACAA1 | 48.2 | 91.5 | <0.0001 | 0.65–0.75 | 10.96 | 0.700 | <0.0001 | 10.94±0.029 | 11.33± 0.040 |
| CAT | 95.5 | 98.3 | <0.0001 | 0.982–0.996 | 13.20 | 0.989 | <0.0001 | 11.91±0.035 | 13.92±0.047 |
| EHHADH | 100 | 26 | 0.421 | 0.481–0.583 | 9.78 | 0.532 | 0.5131 | 9.317±0.035 | 9.248±0.041 |
| PEX11A | 53.1 | 88.1 | <0.0001 | 0.626–0.728 | 8.57 | 0.677 | 0.0003 | 8.542±0.034 | 8.916±0.051 |
| CAMK2G | 89.8 | 41.9 | 0.11 | 0.513–0.614 | 11.29 | 0.563 | 0.1305 | 11.20±0.024 | 11.09±0.029 |
| CAMK2D | 30.5 | 96.6 | 0.563 | 0.688–0.468 | 11.16 | 0.516 | 0.7277 | 11.52±0.034 | 11.55±0.029 |
Discussion
Hox genes, which are also known as homeotic genes or
homologous genes, are genes that specifically regulate the
morphology of living organisms. HOXA13 is a member of the HOX
family. In recent years, the role of HOXA13 in cancer has been
widely studied (18,19,21,32,33).
There are only two reports on the expression of HOXA13 in LUAD. One
of these studies focused on the expression of HOTTIP in NSCLC and
identified HOTTIP as a transcriptional regulator of HOXA13 in lung
cancer cells (26). Ectopic
expression of HOTTIP was revealed to decrease the endogenous level
of HOXA13, while HOTTIP knockdown increased the expression of
HOXA13. This previous study did not focus on HOXA13 and did not
consider the expression or clinical significance of HOXA13 in LUAD
(25). Another study examined changes
in the copy number of genes in early LUAD and obtained evidence
indicating that HOXA13 may be an important target gene in the
progression of LUAC (26). However,
that study focused on gene amplification patterns and on target
genes on the short arm of chromosome 7, and did not use combined
case data to investigate changes in HOXA13 expression in LUAD. The
present study utilized the LUAD patient sequencing data in the
public TCGA database and for the first time revealed that the
expression level of HOXA13 in LUAD tissues is significantly higher
than that in non-cancerous lung tissues. The results were validated
using the Oncomine online database and RT-qPCR data obtained from
clinical samples. In order to obtain a comprehensive result, a
meta-analysis was performed. The results of this fully demonstrated
that HOXA13 has a markedly increased trend in LUAD. The expression
data of HOXA13 in 191 different lung cancer cell lines were also
collected from the CCLE online database for further verification of
these conclusions. In addition, bioinformatics were used to study
the mechanism by which HOXA13 promotes malignant biological
behavior in LUAD occurrence and development, and revealed that
HOXA13 promotes the progression of LUAD by controlling the
expression of a series of genes that induce changes in certain
important pathways. These results suggested that HOXA13 serves a
vital role in the development and progression of LUAD and that
HOXA13 may have clinical potential.
The present study integrated data from a variety of
sources, and the different detection methods used all suggested
that HOXA13 is overexpressed in LUAD. Analysis of the TCGA data
revealed that HOXA13 was expressed at a significantly higher level
in cancerous tissues than in adjacent non-cancerous tissues. ROC
curve analysis was used to demonstrate that a HOXA13 expression
level of >1.27 suggested that the diagnosis was LUAD (AUC=0.839;
P=0.001). This result indicated that HOXA13 serves a role in the
development of LUAD and that it may be a prospective molecular
biomarker for the diagnosis of LUAD. Oncomine was also used to
validate these results. Among the four sets of data obtained from
Oncomine, the expression values of HOXA13 in LUAD tissues were
higher than those in normal tissues for the Hou (P=0.058) and
Selamat (P=0.002) datasets, and the difference in the Selamat
dataset was statistically significant. RT-qPCR was used to examine
29 LUAD tissues and 29 corresponding non-cancerous tissues.
Although the expression of HOXA13 in the LUAD tissues tended to be
increased, compared with that in the non-cancerous control tissues,
the difference was not statistically significant. The reason for
this may be that the number of cases analyzed was small. In order
to acquire a comprehensive understanding of the clinical role of
HOXA13 in LUAD, a meta-analysis was performed based on all cases
from the TCGA database, the in-house RT-qPCR data and data from
Oncomine, which included 189 non-cancerous lung tissues and 637
LUAD cases. The total SMD reached 0.346 (95% CI, 0.052–0.640). SMD
>0 and its 95% CI did not cross the 0 value, which indicated
that the expression of HOXA13 in tumor tissues was markedly higher
than that in the non-cancerous lung tissues. The pooled sensitivity
was 0.64 and the pooled specificity was 0.77. Furthermore, the
results of the meta-analyses revealed that the DOR for HOXA13 in
LUAD diagnosis was 6.05 and that the AUC was 0.78, indicating the
variation in HOXA13 expression between non-cancerous and cancerous
lung tissues (34,35). Additionally, in 192 lung cancer cell
lines, distinct expression levels of HOXA13 were observed. These
results demonstrated that HOXA13 expression is markedly increased
in LUAD. Therefore, HOXA13 may be involved in the development of
LUAD, but the results of the present study require validation by
other independent cohorts and other detection methods.
The aforementioned results suggested that HOXA13
expression is associated with the development of LUAD, but the
molecular mechanism of HOXA13 action remains unknown. Therefore,
the present study attempted to predict the potential mechanism of
HOXA13 action in LUAD using bioinformatics methods. To begin with,
679 genes associated with HOXA13 were identified through the
cBioPortal and MEM databases. GO, KEGG and PPI analyses of these
genes were conducted. Significant results were adopted according to
the P-value provided by DAVID. It was revealed that these genes
were most enriched in the cytoplasm, integral component of
membrane, plasma membrane and extracellular exosome, which
indicated a potential membrane-associated metabolism regulated by
these genes. Furthermore, for biological process, these genes were
significantly involved in positive regulation of transcription from
RNA polymerase II promoter, signal transduction and positive
regulation of GTPase activity, which contribute to RNA translation
and transcription, and may be associated with cell proliferation.
As for molecular function, the selected genes were significantly
involved in protein binding, transcription factor activity and
sequence-specific DNA binding, which exhibited a high tendency
toward cellular invasion. Furthermore, in KEGG pathway analysis,
the targeted genes were most associated with Pathways in cancer,
Proteoglycans in cancer and the cAMP signaling pathway, which
indicated that the potential HOXA13 co-expression genes may
participate in the development of tumorigenesis in LUAD.
To further determine the role of HOXA13 in the
occurrence and development of LUAD, the genes that were most highly
enriched in the four KEGG pathways were selected for PPI network
analysis. The hub genes obtained from the four PPI networks
included eight genes: EGFR, RAC1, ACAA1, CAT, EHHADH, PEX11A,
CAMK2G and CAMK2D. EGFR and RAC1 were revealed to be hub genes in
PPI analysis of two pathways and are therefore particularly notable
as co-expression genes for HOXA13. Among the eight genes, RAC1,
EHHADH and PEX11A were significantly correlated with HOXA13, and
ACAA1, CAT, CAMK2G, CAMK2D and EGFR were not significantly
correlated with HOXA13. The present study further investigated the
association between expression of hub genes in normal tissues and
LUAD tissues based on the data from the TCGA database, and the
results revealed that 4 of the 8 hub genes, RAC1, CAT, EHHADH and
PEX11A, exhibited a significant difference in expression of HOXA13
between non-cancerous tissues and LUAD tissues. Additionally, ROC
curves of these four hub genes exhibited larger AUCs, with
statistically significant differences between non-cancerous tissues
and LUAD tissues (P<0.05). Notably, two of these four genes,
RAC1 (P<0.0001) and PEX11A (P=0.0426), have a relatively clearer
correlation with HOXA13, compared with the others. This
demonstrates that RAC1, a G protein, is a signal molecular switch
that regulates a variety of cell activities and gene expression.
RAC1 is involved in the modulation of phagocytosis, adhesion, cell
movement, cell proliferation and axon formation (36–39). RAC1
serves a pivotal role in cancer angiogenesis, invasion and
metastasis (40,41). There are ongoing in-depth studies on
lung cancer clinical treatment using RAC1 as the target (39,42). The
role of PEX11A and its association with cancer has not yet been
reported. The results of the bioinformatics analysis in the present
study demonstrated that HOXA13 may influence the expression of
these hub genes in such a way as to promote the occurrence and
development of LUAD. However, this hypothesis requires validation
in future in vitro and in vivo experiments.
There are certain limitations to the present study.
To begin with, the number of cases used for the investigation of
HOXA13 was small and the results require validation in future
studies with larger sample sizes. Additionally, the mechanism of
HOXA13 was predicted and identification of the specific mechanism
will require further in vitro and in vivo
validation.
In conclusion, the expression of HOXA13 in patients
with LUAD and its potential clinical value were analyzed
comprehensively in the present study using data from a variety of
sources. Bioinformatics analysis was used to obtain evidence that
HOXA13 may promote the occurrence and development of LUAD.
Acknowledgements
Not applicable.
Funding
The present study was supported by the funds of the
National Natural Science Foundation of China (grant nos. 81560469
and 81360327), the Natural Science Foundation of Guangxi, China
(grant no. 2015GXNSFCA139009 and 2017GXNSFAA198016) and the Guangxi
University Student Innovative Plan (grant nos. 201710598001 and
201710598080).
Availability of data and materials
The datasets used and/or analyzed during the current
study are available from the corresponding author on reasonable
request.
Authors' contributions
YD and RQH conceived and designed the study. YD,
RQH, RZ and BLG performed the experiments. YD and RQH wrote the
paper. GC, XHH and YZ made substantial contributions to the design
of the current study, acquisition of data, interpretation of data
and revising the manuscript. All authors read and approved the
final manuscript.
Ethics statement and consent to
participate
Not applicable.
Consent for publication
Not applicable.
Competing interests
The authors declare that they have no competing
interests.
References
|
1
|
Chen N, Yang X, Guo W, You J, Wu Q, Zhang
G, Li H, Geng D, Jin T, Fu J and Zhang Y: Association of
polymorphisms in the telomere-related gene ACYP2 with lung cancer
risk in the Chinese Han population. Oncotarget. 7:87473–87478.
2016. View Article : Google Scholar : PubMed/NCBI
|
|
2
|
Huang C, Liu S, Wang H, Zhang Z, Yang Q
and Gao F: LncRNA PVT1 overexpression is a poor prognostic
biomarker and regulates migration and invasion in small cell lung
cancer. Am J Transl Res. 8:5025–5034. 2016.PubMed/NCBI
|
|
3
|
Shen Y, Tian Z, Lu D, Huang J, Zhang Z, Li
X and Li J: Impact of pneumonia and lung cancer on mortality of
women with hypertension. Sci Rep. 6:202016. View Article : Google Scholar : PubMed/NCBI
|
|
4
|
Shahid M, Choi TG, Nguyen MN, Matondo A,
Jo YH, Yoo JY, Nguyen NN, Yun HR, Kim J, Akter S, et al: An 8-gene
signature for prediction of prognosis and chemoresponse in
non-small cell lung cancer. Oncotarget. 7:86561–86572. 2016.
View Article : Google Scholar : PubMed/NCBI
|
|
5
|
Xing P, Wang S, Hao X, Zhang T and Li J:
Clinical data from the real world: Efficacy of Crizotinib in
Chinese patients with advanced ALK-rearranged non-small cell lung
cancer and brain metastases. Oncotarget. 7:84666–84674. 2016.
View Article : Google Scholar : PubMed/NCBI
|
|
6
|
Liu K, Chen HL, Gu MM and You QS: A three
gene-based risk score predicts prognosis of resected non-small-cell
lung cancer. Int J Clin Exp Pathol. 8:16081–16088. 2015.PubMed/NCBI
|
|
7
|
Yazawa T, Kaira K, Shimizu K, Shimizu A,
Mori K, Nagashima T, Ohtaki Y, Oyama T, Mogi A and Kuwano H:
Prognostic significance of β2-adrenergic receptor expression in
non-small cell lung cancer. Am J Transl Res. 8:5059–5070.
2016.PubMed/NCBI
|
|
8
|
Chiba M, Togashi Y, Tomida S, Mizuuchi H,
Nakamura Y, Banno E, Hayashi H, Terashima M, De Velasco MA, Sakai
K, et al: MEK inhibitors against MET-amplified non-small cell lung
cancer. Int J Oncol. 49:2236–2244. 2016. View Article : Google Scholar : PubMed/NCBI
|
|
9
|
Kotsakis A, Koinis F, Katsarou A,
Gioulbasani M, Aggouraki D, Kentepozidis N, Georgoulias V and
Vetsika EK: Prognostic value of circulating regulatory T cell
subsets in untreated non-small cell lung cancer patients. Sci Rep.
6:392472016. View Article : Google Scholar : PubMed/NCBI
|
|
10
|
Lingzi X, Zhihua Y, Xuelian L, Yangwu R,
Haibo Z, Yuxia Z and Baosen Z: Genetic variants in microRNAs
predict non-small cell lung cancer prognosis in Chinese female
population in a prospective cohort study. Oncotarget.
7:83101–83114. 2016. View Article : Google Scholar : PubMed/NCBI
|
|
11
|
Song J, Liu Z, Zhong W, Huang Y, Ma Z,
Dong D, Liang C and Tian J: Non-small cell lung cancer:
Quantitative phenotypic analysis of CT images as a potential marker
of prognosis. Sci Rep. 6:382822016. View Article : Google Scholar : PubMed/NCBI
|
|
12
|
Tang W, Han M, Ruan B, Jin W, Lou J, Yuan
X, Chen D, Chen Y, Shin VY, Jin H and Wang X: Overexpression of
GOLPH3 is associated with poor survival in Non-small-cell lung
cancer. Am J Transl Res. 8:1756–1762. 2016.PubMed/NCBI
|
|
13
|
Li D and He S: Pemetrexed and
cyclophosphamide combination therapy for the treatment of non-small
cell lung cancer. Int J Clin Exp Pathol. 8:14693–14700.
2015.PubMed/NCBI
|
|
14
|
Xia X, Lu JJ, Zhang SS, Su CH and Luo HH:
Midkine is a serum and urinary biomarker for the detection and
prognosis of non-small cell lung cancer. Oncotarget. 7:87462–87472.
2016. View Article : Google Scholar : PubMed/NCBI
|
|
15
|
Kondo M, Yamamoto T, Takahashi S and Taira
M: Comprehensive analyses of hox gene expression in Xenopus laevis
embryos and adult tissues. Dev Growth Differ. 59:526–539. 2017.
View Article : Google Scholar : PubMed/NCBI
|
|
16
|
Bhatlekar S, Fields JZ and Boman BM: HOX
genes and their role in the development of human cancers. J Mol Med
(Berl). 92:811–823. 2014. View Article : Google Scholar : PubMed/NCBI
|
|
17
|
Wu DC, Wang SSW, Liu CJ, Wuputra K, Kato
K, Lee YL, Lin YC, Tsai MH, Ku CC, Lin WH, et al: Reprogramming
Antagonizes the Oncogenicity of HOXA13-Long Noncoding RNA HOTTIP
Axis in gastric cancer cells. Stem Cells. 35:2115–2128. 2017.
View Article : Google Scholar : PubMed/NCBI
|
|
18
|
Chang S, Liu J, Guo S, He S, Qiu G, Lu J,
Wang J, Fan L, Zhao W and Che X: HOTTIP and HOXA13 are oncogenes
associated with gastric cancer progression. Oncol Rep.
35:3577–3585. 2016. View Article : Google Scholar : PubMed/NCBI
|
|
19
|
Duan R, Han L, Wang Q, Wei J, Chen L,
Zhang J, Kang C and Wang L: HOXA13 is a potential GBM diagnostic
marker and promotes glioma invasion by activating the Wnt and TGF-β
pathways. Oncotarget. 6:27778–27793. 2015. View Article : Google Scholar : PubMed/NCBI
|
|
20
|
Dong Y, Cai Y, Liu B, Jiao X, Li ZT, Guo
DY, Li XW, Wang YJ and Yang DK: HOXA13 is associated with
unfavorable survival and acts as a novel oncogene in prostate
carcinoma. Future Oncol. 13:1505–1516. 2017. View Article : Google Scholar : PubMed/NCBI
|
|
21
|
Wang SS, Wuputra K, Liu CJ, Lin YC, Chen
YT, Chai CY, Lin CS, Kuo KK, Tsai MH, Wang SW, et al: Oncogenic
function of the homeobox A13-long noncoding RNA HOTTIP-insulin
growth factor-binding protein 3 axis in human gastric cancer.
Oncotarget. 7:36049–36064. 2016.PubMed/NCBI
|
|
22
|
Chandrasekaran G, Hwang EC, Kang TW, Kwon
DD, Park K, Lee JJ and Lakshmanan VK: Computational Modeling of
complete HOXB13 protein for predicting the functional effect of
SNPs and the associated role in hereditary prostate cancer. Sci
Rep. 7:438302017. View Article : Google Scholar : PubMed/NCBI
|
|
23
|
Saha SS, Chowdhury RR, Mondal NR, Roy S
and Sengupta S: Expression signatures of HOX cluster genes in
cervical cancer pathogenesis: Impact of human papillomavirus type
16 oncoprotein E7. Oncotarget. 8:36591–36602. 2017. View Article : Google Scholar : PubMed/NCBI
|
|
24
|
Kelly Z, Moller-Levet C, McGrath S,
Butler-Manuel S, Madhuri Kavitha T, Kierzek AM, Pandha H, Morgan R
and Michael A: The prognostic significance of specific HOX gene
expression patterns in ovarian cancer. Int J Cancer. 139:1608–1617.
2016. View Article : Google Scholar : PubMed/NCBI
|
|
25
|
Sang Y, Zhou F, Wang D, Bi X, Liu X, Hao
Z, Li Q and Zhang W: Up-regulation of long non-coding HOTTIP
functions as an oncogene by regulating HOXA13 in non-small cell
lung cancer. Am J Transl Res. 8:2022–2032. 2016.PubMed/NCBI
|
|
26
|
Kang JU: Characterization of amplification
patterns and target genes on the short arm of chromosome 7 in
early-stage lung adenocarcinoma. Mol Med Rep. 8:1373–1378. 2013.
View Article : Google Scholar : PubMed/NCBI
|
|
27
|
Hou J, Aerts J, den Hamer B, van Ijcken W,
den Bakker M, Riegman P, van der Leest C, van der Spek P, Foekens
JA, Hoogsteden HC, et al: Gene expression-based classification of
non-small cell lung carcinomas and survival prediction. PLoS One.
5:1932–6203. 2010. View Article : Google Scholar
|
|
28
|
Selamat SA, Chung BS, Girard L, Zhang W,
Zhang Y, Campan M, Siegmund KD, Koss MN, Hagen JA, Lam WL, et al:
Genome-scale analysis of DNA methylation in lung adenocarcinoma and
integration with mRNA expression. Genome Res. 22:1197–1211. 2012.
View Article : Google Scholar : PubMed/NCBI
|
|
29
|
Garber ME, Troyanskaya OG, Schluens K,
Petersen S, Thaesler Z, Pacyna-Gengelbach M, van de Rijn M, Rosen
GD, Perou CM, Whyte RI, et al: Diversity of gene expression in
adenocarcinoma of the lung. Proc Natl Acad Sci USA. 98:13784–13789.
2001. View Article : Google Scholar : PubMed/NCBI
|
|
30
|
Okayama H, Kohno T, Ishii Y, Shimada Y,
Shiraishi K, Iwakawa R, Furuta K, Tsuta K, Shibata T, Yamamoto S,
et al: Identification of genes upregulated in ALK-positive and
EGFR/KRAS/ALK-negative lung adenocarcinomas. Cancer Res.
72:100–111. 2012. View Article : Google Scholar : PubMed/NCBI
|
|
31
|
Chen G, Kronenberger P, Umelo IA, Teugels
E and De Grève J: Quantification of epidermal growth factor
receptor T790M mutant transcripts in lung cancer cells by real-time
reverse transcriptase-quantitative polymerase chain reaction. Anal
Biochem. 398:266–268. 2010. View Article : Google Scholar : PubMed/NCBI
|
|
32
|
Guo B, Che T, Shi B, Guo L, Zhang Z, Li L,
Cai C and Chen Y: Interaction network analysis of differentially
expressed genes and screening of cancer marker in the urine of
patients with invasive bladder cancer. Int J Clin Exp Med.
8:3619–3628. 2015.PubMed/NCBI
|
|
33
|
Cheng Y, Jutooru I, Chadalapaka G, Corton
JC and Safe S: The long non-coding RNA HOTTIP enhances pancreatic
cancer cell proliferation, survival and migration. Oncotarget.
6:10840–10852. 2015. View Article : Google Scholar : PubMed/NCBI
|
|
34
|
Glas AS, Lijmer JG, Prins MH, Bonsel GJ
and Bossuyt PM: The diagnostic odds ratio: A single indicator of
test performance. J Clin Epidemiol. 56:1129–1135. 2003. View Article : Google Scholar : PubMed/NCBI
|
|
35
|
Walter SD: Properties of the summary
receiver operating characteristic (SROC) curve for diagnostic test
data. Stat Med. 21:1237–1256. 2002. View Article : Google Scholar : PubMed/NCBI
|
|
36
|
Zeng N, Salker MS, Zhang S, Singh Y, Shi
B, Stournaras C and Lang F: 1α,25(OH)2D3 induces actin
depolymerization in endometrial carcinoma cells by targeting RAC1
and PAK1. Cell Physiol Biochem. 40:1455–1464. 2016. View Article : Google Scholar : PubMed/NCBI
|
|
37
|
Raja R, Sahasrabuddhe NA, Radhakrishnan A,
Syed N, Solanki HS, Puttamallesh VN, Balaji SA, Nanjappa V, Datta
KK, Babu N, et al: Chronic exposure to cigarette smoke leads to
activation of p21 (RAC1)-activated kinase 6 (PAK6) in non-small
cell lung cancer cells. Oncotarget. 7:61229–61245. 2016. View Article : Google Scholar : PubMed/NCBI
|
|
38
|
Wang M, Dong Q and Wang Y: Rab23 is
overexpressed in human astrocytoma and promotes cell migration and
invasion through regulation of Rac1. Tumour Biol. 37:11049–11055.
2016. View Article : Google Scholar : PubMed/NCBI
|
|
39
|
Li Z, Guo C, Liu X, Zhou C, Zhu F, Wang X,
Wang Q, Shi Y, Wang J, Zhao W and Zhang L: TIPE2 suppresses
angiogenesis and non-small cell lung cancer (NSCLC) invasiveness
via inhibiting Rac1 activation and VEGF expression. Oncotarget.
7:62224–62239. 2016.PubMed/NCBI
|
|
40
|
Chen L, DeWispelaere A, Dastvan F, Osborne
WR, Blechner C, Windhorst S and Daum G: Smooth Muscle-Alpha actin
inhibits vascular smooth muscle cell proliferation and migration by
inhibiting Rac1 activity. PLoS One. 11:e01557262016. View Article : Google Scholar : PubMed/NCBI
|
|
41
|
Cho CY, Lee KT, Chen WC, Wang CY, Chang
YS, Huang HL, Hsu HP, Yen MC, Lai MZ and Lai MD: MST3 promotes
proliferation and tumorigenicity through the VAV2/Rac1 signal axis
in breast cancer. Oncotarget. 7:14586–14604. 2016. View Article : Google Scholar : PubMed/NCBI
|
|
42
|
Zou T, Mao X, Yin J, Li X, Chen J, Zhu T,
Li Q, Zhou H and Liu Z: Emerging roles of RAC1 in treating lung
cancer patients. Clin Genet. 91:520–528. 2017. View Article : Google Scholar : PubMed/NCBI
|