Introduction
Renal cell carcinoma (RCC) is the most common type
of kidney cancer responsible for 90–95% of all cases, and
accounting for ~3% of adult malignancies (1). Clear cell RCC (ccRCC) is the most
aggressive RCC subtype and constitutes 70–80% of all RCC cases with
the highest rates of local invasion, metastasis and mortality
(2). RCC is usually asymptomatic in
the early stages and, as the disease progresses, signs include
hematuria, flank pain, abdominal masses and loin pain (3). An unhealthy lifestyle is a major cause
of RCC, and it has been reported that smoking, obesity and
hypertension have been estimated to cause ~50% of all cases
(4). Additionally, hereditary factors
have an impact on individual susceptibility to RCC (5). Other genetically-linked conditions also
increase the risk of developing RCC, including hereditary papillary
renal carcinoma, hereditary leiomyomatosis, hyperparathyroidism-jaw
tumor syndrome, familial papillary thyroid carcinoma and sickle
cell disease. The pathogenesis of RCC is extremely complex and is
yet to be elucidated. Notably, an increasing number of biomarkers
have been found to be involved in the pathogenesis of RCC. Matsuura
et al (6) proved that the
downregulation of SAV1 and the consequent YAP1
activation were involved in the pathogenesis of high-grade ccRCC.
Furthermore, bioinformatics analyses demonstrated that microRNAs
(miRNAs) were dysregulated in ccRCC and may contribute to kidney
cancer pathogenesis by targeting more than 1 key molecule (7). A larger number of miRNAs are associated
with key pathogenesis mechanisms of hypoxia and
epithelial-to-mesenchymal transition, including miR-200,
miR-210, miR-155, miR-8a, miR-424, miR-381, miR-34a, miR-17-5p
and miR-224 (8). In addition,
promoter region methylation and transcriptional silencing are major
mechanisms of tumor suppressor genes in RCC (9). Ricketts et al (10) reported that certain tumor suppressor
genes were methylated in RCC tumor tissue (e.g., SLC34A2 was
specifically methylated in 63% of RCC cases, OVOL1 in 40%,
DLEC1 in 20%, TMPRSS2 in 26%, SST in 31% and
BMP4 in 35%). Therefore, the methylation analysis is an
attractive strategy for investigating novel genes in the
pathogenesis of RCC. In the present study article, an mRNA
expression profile, a miRNA expression profile and a methylation
profile of ccRCC were synthetically analyzed in order to screen
potential pathogenic biomarkers via microarray analysis.
Materials and methods
Microarray data
The microarray datasets of GSE96574, GSE71302
(11) and GSE61441 (12) were downloaded from the Gene Expression
Omnibus (GEO) database (www.ncbi.nlm.nih.gov/geo/). GSE96574, which was an
mRNA expression profile with 5 ccRCC tissues and 5 normal kidney
tissues, was detected with the platform of Agilent-067406 CBC
lncRNA + mRNA microarray V4.0; GSE71302, an miRNA expression
profile with 5 ccRCC tissues and 5 normal kidney tissues, was
detected with the platform of Agilent-021827 Human miRNA Microarray
V3; GSE61441, a methylation profile with 46 ccRCC tissues and 46
normal kidney tissues, was detected with the platform of Illumina
HumanMethylation450 BeadChip.
Data processing and differential
analysis
For the profiles of GSE96574, GSE71302 and GSE61441,
the raw data were obtained and normalized using the preprocess core
function package V3.5 (http://www.bioconductor.org/packages/release/bioc/html/preprocessCore.html)
(13). Subsequently, the
differentially expressed genes (DEGs) and differentially expressed
miRNAs (DEMs) were identified in ccRCC samples compared with normal
kidney samples with the limma V3.18.13 software package (http://www.bioconductor.org/packages/2.13/bioc/html/limma.html).
P<0.05 and |log2(fold-change)|>1 were used as
threshold criteria. The two sample t-test and the β distribution
test were used to identify the differentially methylated sites
(DMSs), and DMSs were identified with P<0.05 and |Δβ|>0.2.
Furthermore, the genes in which the DMSs were located were labeled
using the annotation files of the methylation chip platform.
Functional and pathway enrichment
analysis of DEGs
Gene Ontology (GO) terms and Kyoto Encyclopedia of
Genes and Genomes (KEGG) pathway enrichment analyses of DEGs were
performed via the Database for Annotation, Visualization and
Integrated Discovery (DAVID) V6.8 (http://david.abcc.ncifcrf.gov/) (14). GO terms and KEGG pathways were
selected with P<0.05.
Target prediction of DEMs
To investigate the related regulation mechanisms of
DEMs, the targets and their locations were predicted by the miRWalk
V2.0 database (http://www.umm.uni-heidelberg.de/apps/zmf/mirwalk/),
which was a powerful and accurate database that displayed miRNAs,
their corresponding target genes and binding sites in mice, rats
and humans (15). Putative targets
were predicted by >5 bioinformatics algorithms among the 10
algorithms in the miRWalk database: DIANAmT V4.0 (www.ma.uni-heidelberg.de/apps/zmf/mirwalk/diana-microt),
miRanda -rel2010 (www.ma.uni-heidelberg.de/apps/zmf/mirwalk/miranada),
miRDB V4.0 (www.ma.uni-heidelberg.de/apps/zmf/mirwalk/mirdb),
miRWalk V2.0 (www.ma.uni-heidelberg.de/apps/zmf/mirwalk/mirwalk),
RNAhybrid V2.1 (www.ma.uni-heidelberg.de/apps/zmf/mirwalk/rnahybrid),
PICTAR4 (www.ma.uni-heidelberg.de/apps/zmf/mirwalk/pictar4),
PICTAR5 (www.ma.uni-heidelberg.de/apps/zmf/mirwalk/pictar5),
PITA (www.ma.uni-heidelberg.de/apps/zmf/mirwalk/pipa),
RNA22 V2 (www.ma.uni-heidelberg.de/apps/zmf/mirwalk/rna22) and
Targetscan V6.2 (www.ma.uni-heidelberg.de/apps/zmf/mirwalk/targetscan).
Therefore, the miRNA-gene regulation pairs were screened out and
the locations of the targets were drawn out.
Combination analysis of DEGs, DEMs and
DMSs
The corresponding genes of DMSs were identified
based on the β-value. If multiple DMSs corresponded to a single
gene, the average β-value of the DMSs was used as the β-value of
the gene. The overlapped genes between the DEGs and the
corresponding genes of DMSs were screened out with the threshold of
|Δβ|>0.2. The genes involved in the aforementioned miRNA-gene
pairs and the DEGs were selected out and further analyzed with
their corresponding DEMs and DMSs.
Verification of associated genes and
miRNAs in patients with ccRCC
A total of 10 patients with ccRCC, 32–57 years old
(mean age, 63.2), were collected between February 2017 and March
2017, including 5 male patients and 5 female patients. The tumor
tissues and adjacent non-cancerous tissues were collected with
surgical resection. Written informed consent was obtained when the
patients were accepted by the Second Hospital of Tianjin Medical
University. All procedures were performed in accordance with the
ethical standards of the institutional and/or national research
committee. The total RNA was extracted using TRIzol (Invitrogen;
Thermo Fisher Scientific, Inc., Waltham, MA, USA). Reverse
transcription PCR (RT-PCR) and methylation-specific PCR (MS-PCR)
were performed to detect the methylation status of HAPLN1.
The mRNA levels of HAPLN1, hsa-miR-204 and
hsa-miR-218 were tested by RT-PCR. RNA was reverse
transcribed using the PrimeScript® 1st Strand cDNA
Synthesis kit (Takara Biotechnology Co., Ltd., Dalian, China) with
the following temperature protocol: 30°C for 10 min, 42°C for 60
min and 95°C for 5 min. The SYBR® Premix Ex Taq™ kit
(Takara Biotechnology Co., Ltd.) and the Applied Biosystems™
QuantStudio™ 5 Real-Time PCR System (Applied Biosystems; Thermo
Fisher Scientific, Inc.) were used to conduct PCR, according to the
manufacturer's protocols. DNA methylation modification was
performed using an EZ-DNA Methylation-Gold kit™ (Zymo Research
Corp., Irvine, CA, USA), according to the manufacturer's protocols.
All the primers were designed and synthesized by Takara
Biotechnology Co., Ltd. The MSP primers of HAPLN1 were as
follows: Forward, 3′-AGGAGAATTTTTTTGGTGACGT-5′ and reverse,
3′-CTAAAAATCAAATAAAACTAACGCT-5′ (210 bp); and the RT-PCR primers
were as follows: HAPLN1 forward, 3′-TGGTGAGAAAGTGCCTCCTT-5′
and reverse, 3′-TAGCGCTCTTTCTCCTCACC-5′ (151 bp);
hsa-miR-204 forward, 3′-CAGTGCAGGGTCCGAGGTAT-5′ and reverse,
3′-GCTGGAAGGCAAAGGGACGT-5′ (180 bp); hsa-miR-218 forward,
3′-CAGTGCAGGGTCCGAGGTAT-5′ and reverse,
3′-ATGGTTCCGTCAAGCACCATGG-5′ (205 bp); and β-actin forward,
5′-CTACAATGAGCTGCGTGTGG −3′ and reverse, 5′-AGGCATACAGGGACAACACA-3′
(308 bp). The thermocycling conditions were as follows: 95°C for 5
min; followed by 40 cycles of 95°C for 15 sec, 60°C for 30 sec, and
72°C for 35 sec; and a final 5 min at 72°C extension. The
2−ΔΔCq method was used to calculate the relative
expression value of the target gene (16).
Statistical analysis
SPSS version 17.0 (SPSS Inc., Chicago, IL, USA) was
used for all statistical analyses, and data are presented as the
mean ± standard deviation. T test was used to compare the two
groups and P<0.05 was considered to indicate a statistically
significant difference.
Results
DEGs, DEMs and DMSs
A total of 2,172 (1,089 upregulated and 1,083
downregulated) DEGs, 202 (91 upregulated and 111 downregulated)
DEMs and 2,172 (1,305 upregulated and 867 downregulated) DMSs were
identified in ccRCC samples compared with normal kidney samples.
The top 20 most significantly upregulated/downregulated DEGs, DEMs
and DMSs are presented in Tables I,
II and III, respectively. The location
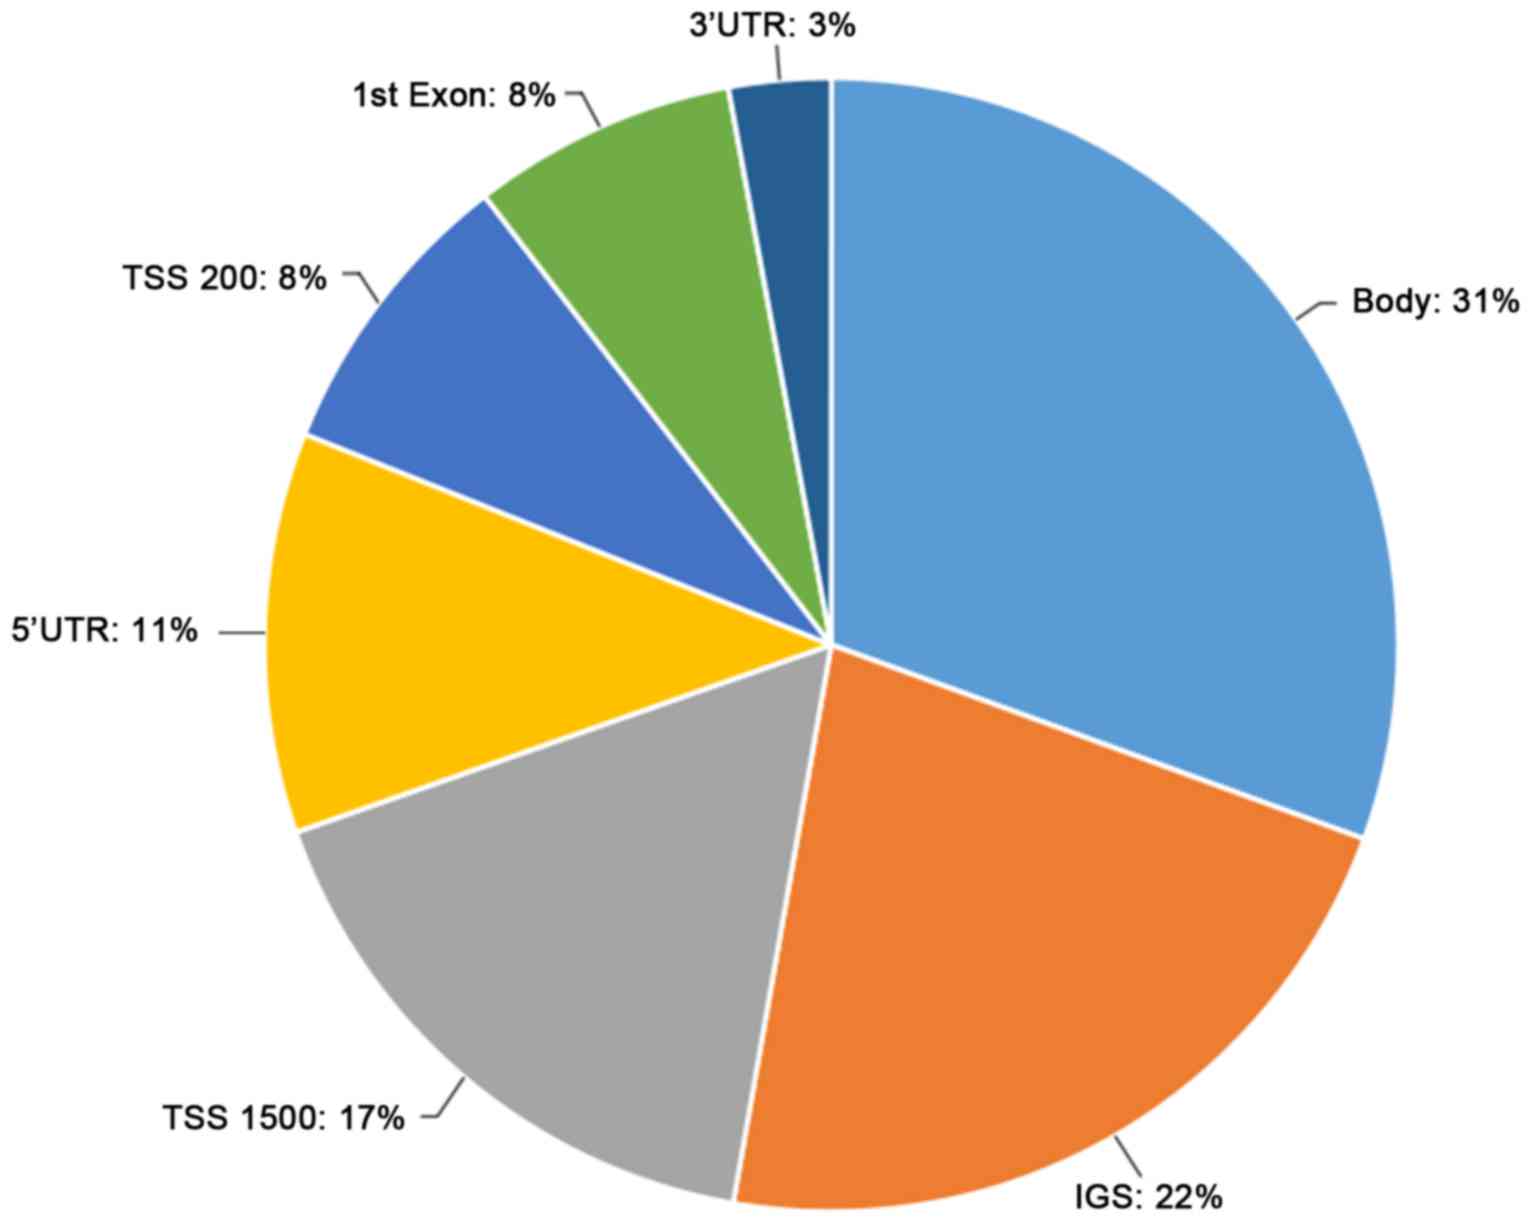
distribution of DMSs is presented in Fig.
1, and they were primarily located in the gene coding region
(31%) and the intergenic gene region (22%).
 | Table I.The top 20 most significant
differentially expressed genes in clear cell renal cell carcinoma
samples compared with normal kidney samples. |
Table I.
The top 20 most significant
differentially expressed genes in clear cell renal cell carcinoma
samples compared with normal kidney samples.
| Gene | Log FC | Mean
expression | t | P-value | |∆β| |
|---|
| NDUFA4L2 | −4.013 | 7.400 | −20.749 |
1.81×10⁻⁶ | 13.385 |
| HK2 | −3.156 | 4.706 | −20.558 |
1.81×10⁻⁶ | 13.307 |
| PCSK6 | −3.022 | 6.983 | −21.826 |
1.81×10⁻⁶ | 13.800 |
| TMEM213 | 5.025 | 4.467 | 19.505 |
2.57×10⁻⁶ | 12.862 |
| NPHS2 | 4.386 | 5.637 | 18.708 |
3.36×10⁻⁶ | 12.500 |
| DMRT2 | 3.306 | 3.416 | 18.248 |
3.77×10⁻⁶ | 12.282 |
| BHLHE41 | −3.750 | 5.475 | −16.519 |
8.56×10⁻⁶ | 11.385 |
| SLC47A2 | 4.148 | 5.832 | 16.690 |
8.56×10⁻⁶ | 11.479 |
| SFRP1 | 2.895 | 5.473 | 16.042 |
1.05×10⁻⁵ | 11.115 |
| AQP6 | 2.851 | 4.375 | 15.661 |
1.24×10⁻⁵ | 10.892 |
| ENO2 | −3.218 | 5.839 | −15.328 |
1.24×10⁻⁵ | 10.690 |
| CNTN1 | 2.911 | 4.580 | 15.444 |
1.24×10⁻⁵ | 10.762 |
| ATP6V0A4 | 3.492 | 4.469 | 15.137 |
1.24×10⁻⁵ | 10.573 |
| TMEM52B | 4.297 | 7.647 | 15.116 |
1.24×10⁻⁵ | 10.560 |
| CLCNKB | 4.451 | 5.645 | 15.133 |
1.24×10⁻⁵ | 10.570 |
| PAH | 6.079 | 5.914 | 14.721 |
1.55×10⁻⁵ | 10.310 |
| NPHS1 | 2.549 | 4.357 | 14.582 |
1.57×10⁻⁵ | 10.220 |
| ATP6V0D2 | 4.435 | 5.594 | 14.548 |
1.57×10⁻⁵ | 10.198 |
| ERBB4 | 3.221 | 3.994 | 14.425 |
1.64×10⁻⁵ | 10.117 |
| MT1G | 5.561 | 7.111 | 14.195 |
1.85×10⁻⁵ | 9.964 |
| Table II.The top 20 most significant
differentially expressed microRNA in clear cell renal cell
carcinoma samples compared with normal kidney samples. |
Table II.
The top 20 most significant
differentially expressed microRNA in clear cell renal cell
carcinoma samples compared with normal kidney samples.
| Gene | Log FC | Mean
expression | t | P-value | |∆β| |
|---|
| hsa-miR-200c | 353.683 | 221.596 | 17.981 |
1.27×10⁻⁵ | 6.195 |
| hsa-miR-141 | 352.019 | 220.817 | 12.544 | 1.27×10⁻⁵ | 4.868 |
| hur_6 | 23789.981 | 42317.538 | 10.142 | 0.001 | 3.852 |
| hsa-miR-342-5p | −19.321 | 60.751 | −9.957 | 0.001 | 3.757 |
| hsa-miR-21 | −36961.351 | 38145.395 | −9.888 | 0.001 | 3.720 |
| hsa-miR-25 | −278.196 | 487.476 | −7.556 | 0.008 | 2.223 |
| hsa-miR-34a | −2270.488 | 1752.008 | −7.214 | 0.009 | 1.951 |
| hsa-miR-15a | −1651.827 | 2258.899 | −7.019 | 0.010 | 1.789 |
| hsa-miR-138 | 34.895 | 59.818 | 6.732 | 0.012 | 1.541 |
| hsa-miR-200b | 1449.075 | 1441.078 | 6.511 | 0.014 | 1.341 |
| hsa-miR-136 | 11.585 | 55.781 | 6.207 | 0.016 | 1.055 |
| hsa-miR-124 | 18.996 | 54.063 | 6.162 | 0.016 | 1.011 |
| hsa-miR-34a | −36.297 | 64.852 | −6.140 | 0.016 | 0.990 |
| hsa-miR-532-5p | 153.632 | 191.707 | 6.050 | 0.016 | 0.901 |
| hsa-miR-342-3p | −357.194 | 500.970 | −5.958 | 0.016 | 0.809 |
| hsa-miR-28-3p | −5.341 | 48.193 | −5.938 | 0.016 | 0.789 |
| hsa-miR-30a | 8011.852 | 8679.002 | 5.902 | 0.016 | 0.752 |
|
hsa-miR-193a-5p | −24.702 | 73.083 | −5.799 | 0.016 | 0.647 |
| hsa-miR-362-3p | 120.012 | 182.590 | 5.745 | 0.016 | 0.591 |
| hsa-miR-629 | −4.148 | 46.205 | −5.698 | 0.016 | 0.542 |
| Table III.The top 20 most significant
differentially methylated sites in clear cell renal cell carcinoma
samples compared with normal kidney samples. |
Table III.
The top 20 most significant
differentially methylated sites in clear cell renal cell carcinoma
samples compared with normal kidney samples.
| ID_REF | ∆β | P-value | Gene | Location |
|---|
| cg13008315 | −0.293 |
5.53×10−44 |
| IGS |
| cg22164891 | −0.473 |
1.30×10−41 | ZNF217 | TSS200 |
| cg00246451 | −0.400 |
2.34×10−41 | ARHGEF2 | TSS1500 |
| cg07166409 | −0.315 |
1.75×10−40 | SEMA4C | 5′UTR |
| cg00026222 | −0.308 |
8.4×10−40 |
| IGS |
| cg19756430 | −0.273 |
8.85×10−39 |
| IGS |
| cg09228833 | −0.489 |
1.44×10−38 | ZNF217 | TSS200 |
| cg19643921 | −0.257 |
5.50×10−37 | NUMBL | TSS1500 |
| cg01287592 | −0.214 |
6.71×10−37 | DENND3 | 5′UTR |
| cg04312358 | −0.259 |
1.08×10−36 | NUMBL | TSS1500 |
| cg09029902 | −0.480 |
1.09×10−36 | ZNF217 | 5′-UTR;
1stExon |
| cg20979153 | −0.372 |
1.21×10−36 | ZNF217 | TSS200 |
| cg08909806 | −0.245 |
1.22×10−36 | TSPO | 5′UTR |
| cg27107144 | −0.211 |
2.19×10−36 | AES | Body |
| cg07797853 | −0.203 |
1.54×10⁻³⁵ |
| IGS |
| cg13266096 | −0.328 |
2.05×10⁻³⁵ | MTA2 | Body |
| cg11588197 | −0.384 |
3.17×10⁻³⁵ | ETS1 | Body |
| cg27638217 | −0.312 |
4.23×10⁻³⁵ |
| IGS |
| cg08995609 | −0.374 |
1.19×10⁻³⁴ | RIN1 | TSS200 |
| cg06349174 | −0.211 |
1.58×10⁻³⁴ | STIM1 | 1stExon; 5′UTR |
Enriched GO terms and KEGG
pathways
The DEGs were enriched in 1,015 GO terms and 69 KEGG
pathways. The top 10 significantly enriched GO terms and KEGG
pathways are presented in Tables IV
and V, respectively.
| Table IV.The top 10 significantly enriched GO
terms of differentially expressed genes. |
Table IV.
The top 10 significantly enriched GO
terms of differentially expressed genes.
| Category | Term | Count | P-value |
|---|
| GOTERM_CC_5 | GO:0044459~plasma
membrane part | 504 |
6.33×10−41 |
| GOTERM_CC_5 |
GO:0070062~extracellular exosome | 510 |
6.68×10⁻³⁵ |
| GOTERM_CC_5 |
GO:0031226~intrinsic component of plasma
membrane | 335 |
3.50×10⁻²⁸ |
| GOTERM_CC_5 | GO:0005887~integral
component of plasma membrane | 325 |
5.01×10⁻²⁸ |
| GOTERM_BP_5 | GO:0006811~ion
transport | 280 |
3.33×10⁻²³ |
| GOTERM_BP_5 | GO:0043436~oxoacid
metabolic process | 185 |
2.49×10⁻²² |
| GOTERM_BP_5 |
GO:0019752~carboxylic acid metabolic
process | 184 |
3.05×10⁻²² |
| GOTERM_CC_5 | GO:0009897~external
side of plasma membrane | 81 |
9.78×10⁻²⁰ |
| GOTERM_CC_5 | GO:0016324~apical
plasma membrane | 89 |
4.76×10⁻¹⁹ |
| GOTERM_CC_5 | GO:0098590~plasma
membrane region | 194 |
1.48×10⁻¹⁸ |
| Table V.The top 10 significantly enriched
KEGG pathways of differentially expressed genes. |
Table V.
The top 10 significantly enriched
KEGG pathways of differentially expressed genes.
| Category | Term | Count | P-value |
|---|
| KEGG_PATHWAY |
hsa05332:Graft-versus-host disease | 21 |
2.23×10⁻¹⁰ |
| KEGG_PATHWAY |
hsa05150:Staphylococcus aureus
infection | 27 |
4.61×10⁻¹⁰ |
| KEGG_PATHWAY | hsa04940:Type I
diabetes mellitus | 22 |
9.44×10⁻⁹ |
| KEGG_PATHWAY | hsa05323:Rheumatoid
arthritis | 33 |
2.66×10⁻⁸ |
| KEGG_PATHWAY |
hsa04145:Phagosome | 47 |
2.72×10⁻⁸ |
| KEGG_PATHWAY | hsa05330:Allograft
rejection | 20 |
2.76×10⁻⁸ |
| KEGG_PATHWAY | hsa05322:Systemic
lupus erythematosus | 41 |
2.74×10⁻⁷ |
| KEGG_PATHWAY | hsa04978:Mineral
absorption | 21 |
3.97×10⁻⁷ |
| KEGG_PATHWAY | hsa03320:PPAR
signaling pathway | 26 |
5.06×10⁻⁷ |
| KEGG_PATHWAY | hsa04514:Cell
adhesion molecules (CAMs) | 42 |
5.25×10⁻⁷ |
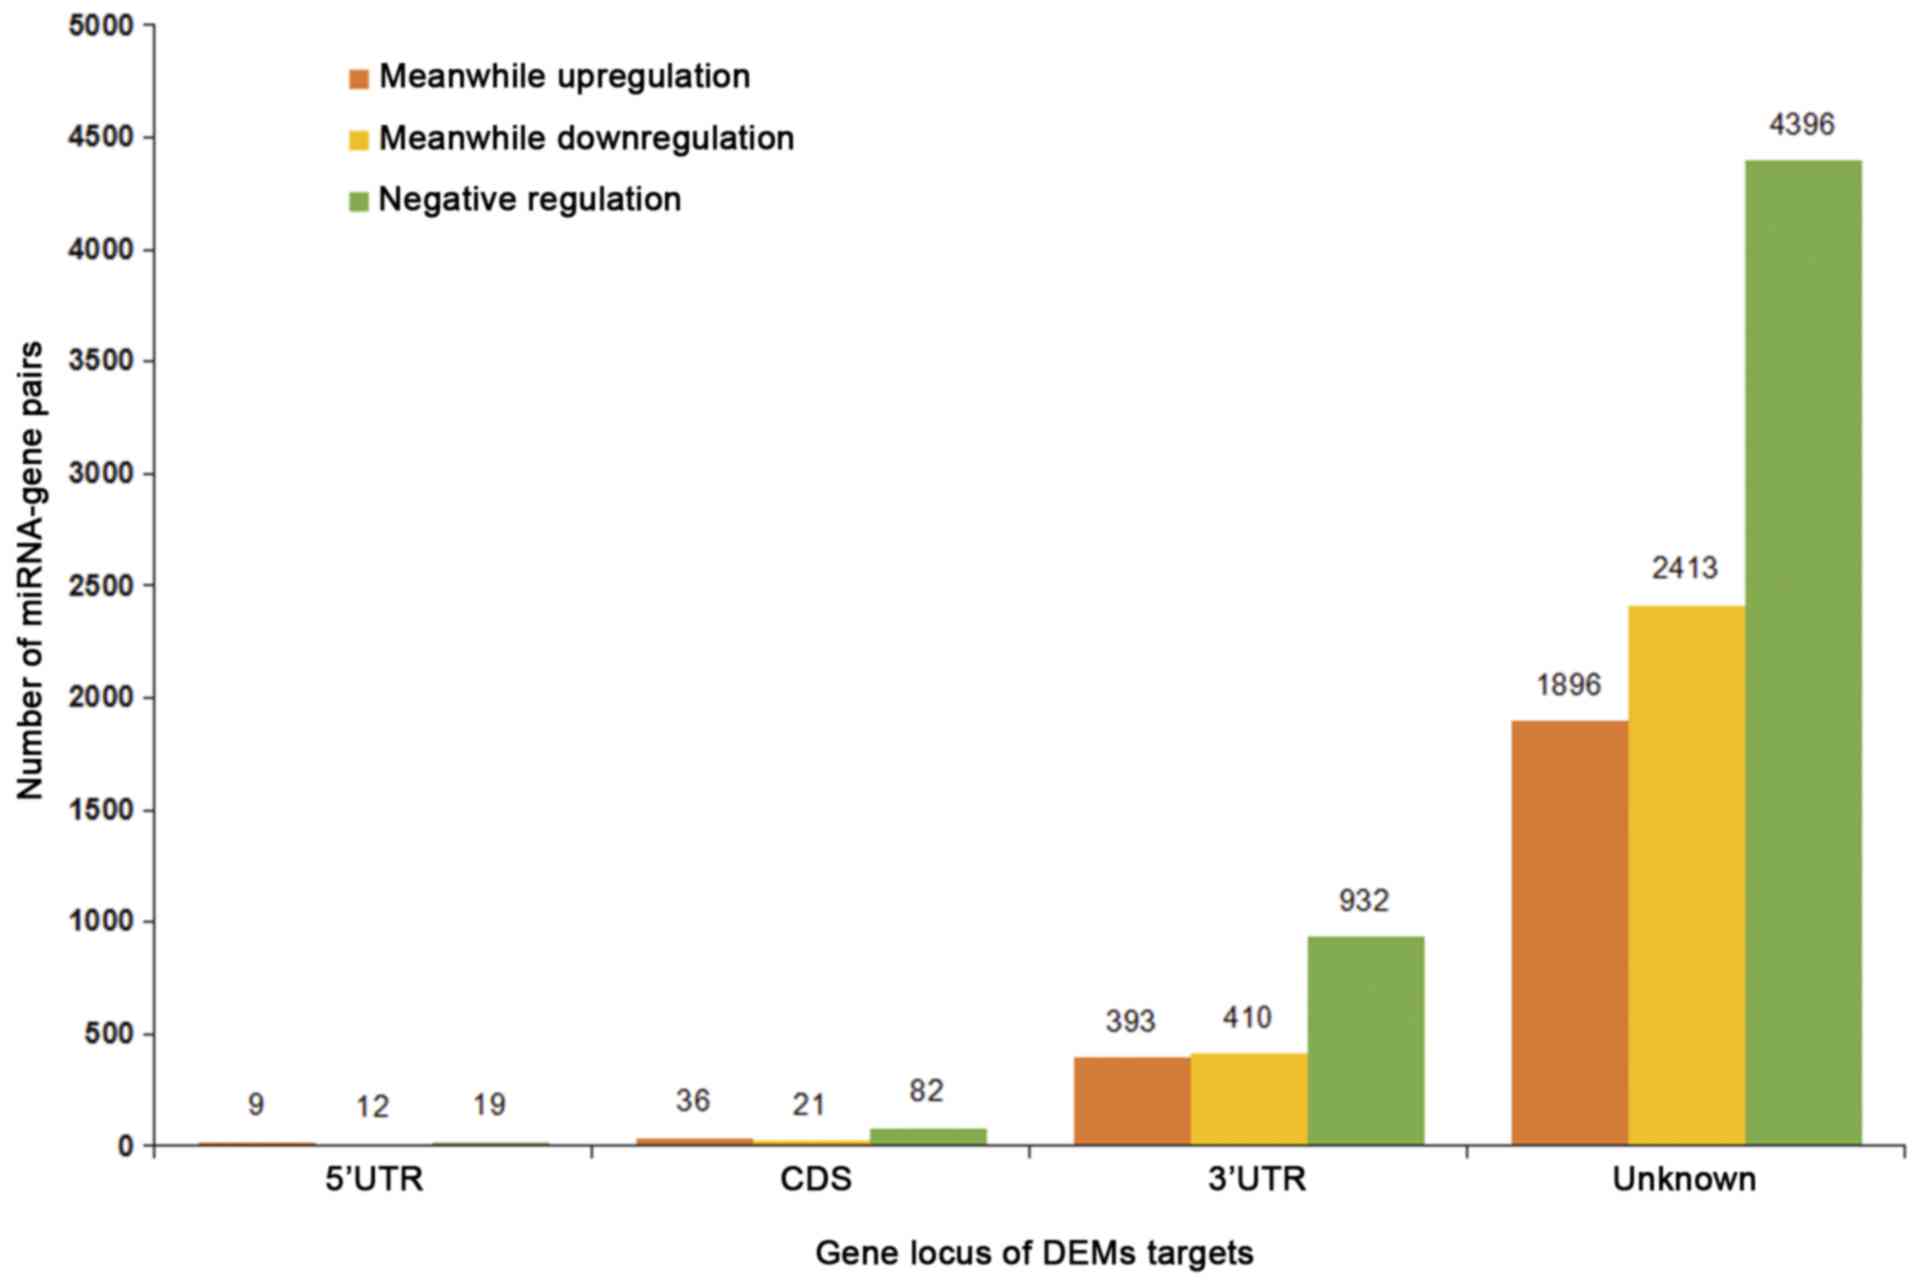
Targets of DEMs
The target genes of DEMs were identified in at least
5 algorithms of the miRWalk database and therefore, 10,601
miRNA-gene pairs were obtained. The locations of the target genes
and the regulation trends of the miRNA-gene pairs are presented in
Fig. 2. More targets were located in
the 3′-UTR, fewer in the 5′-UTR and coding domain sequence (CDS)
and the majority of miRNA-gene pairs were negatively regulated.
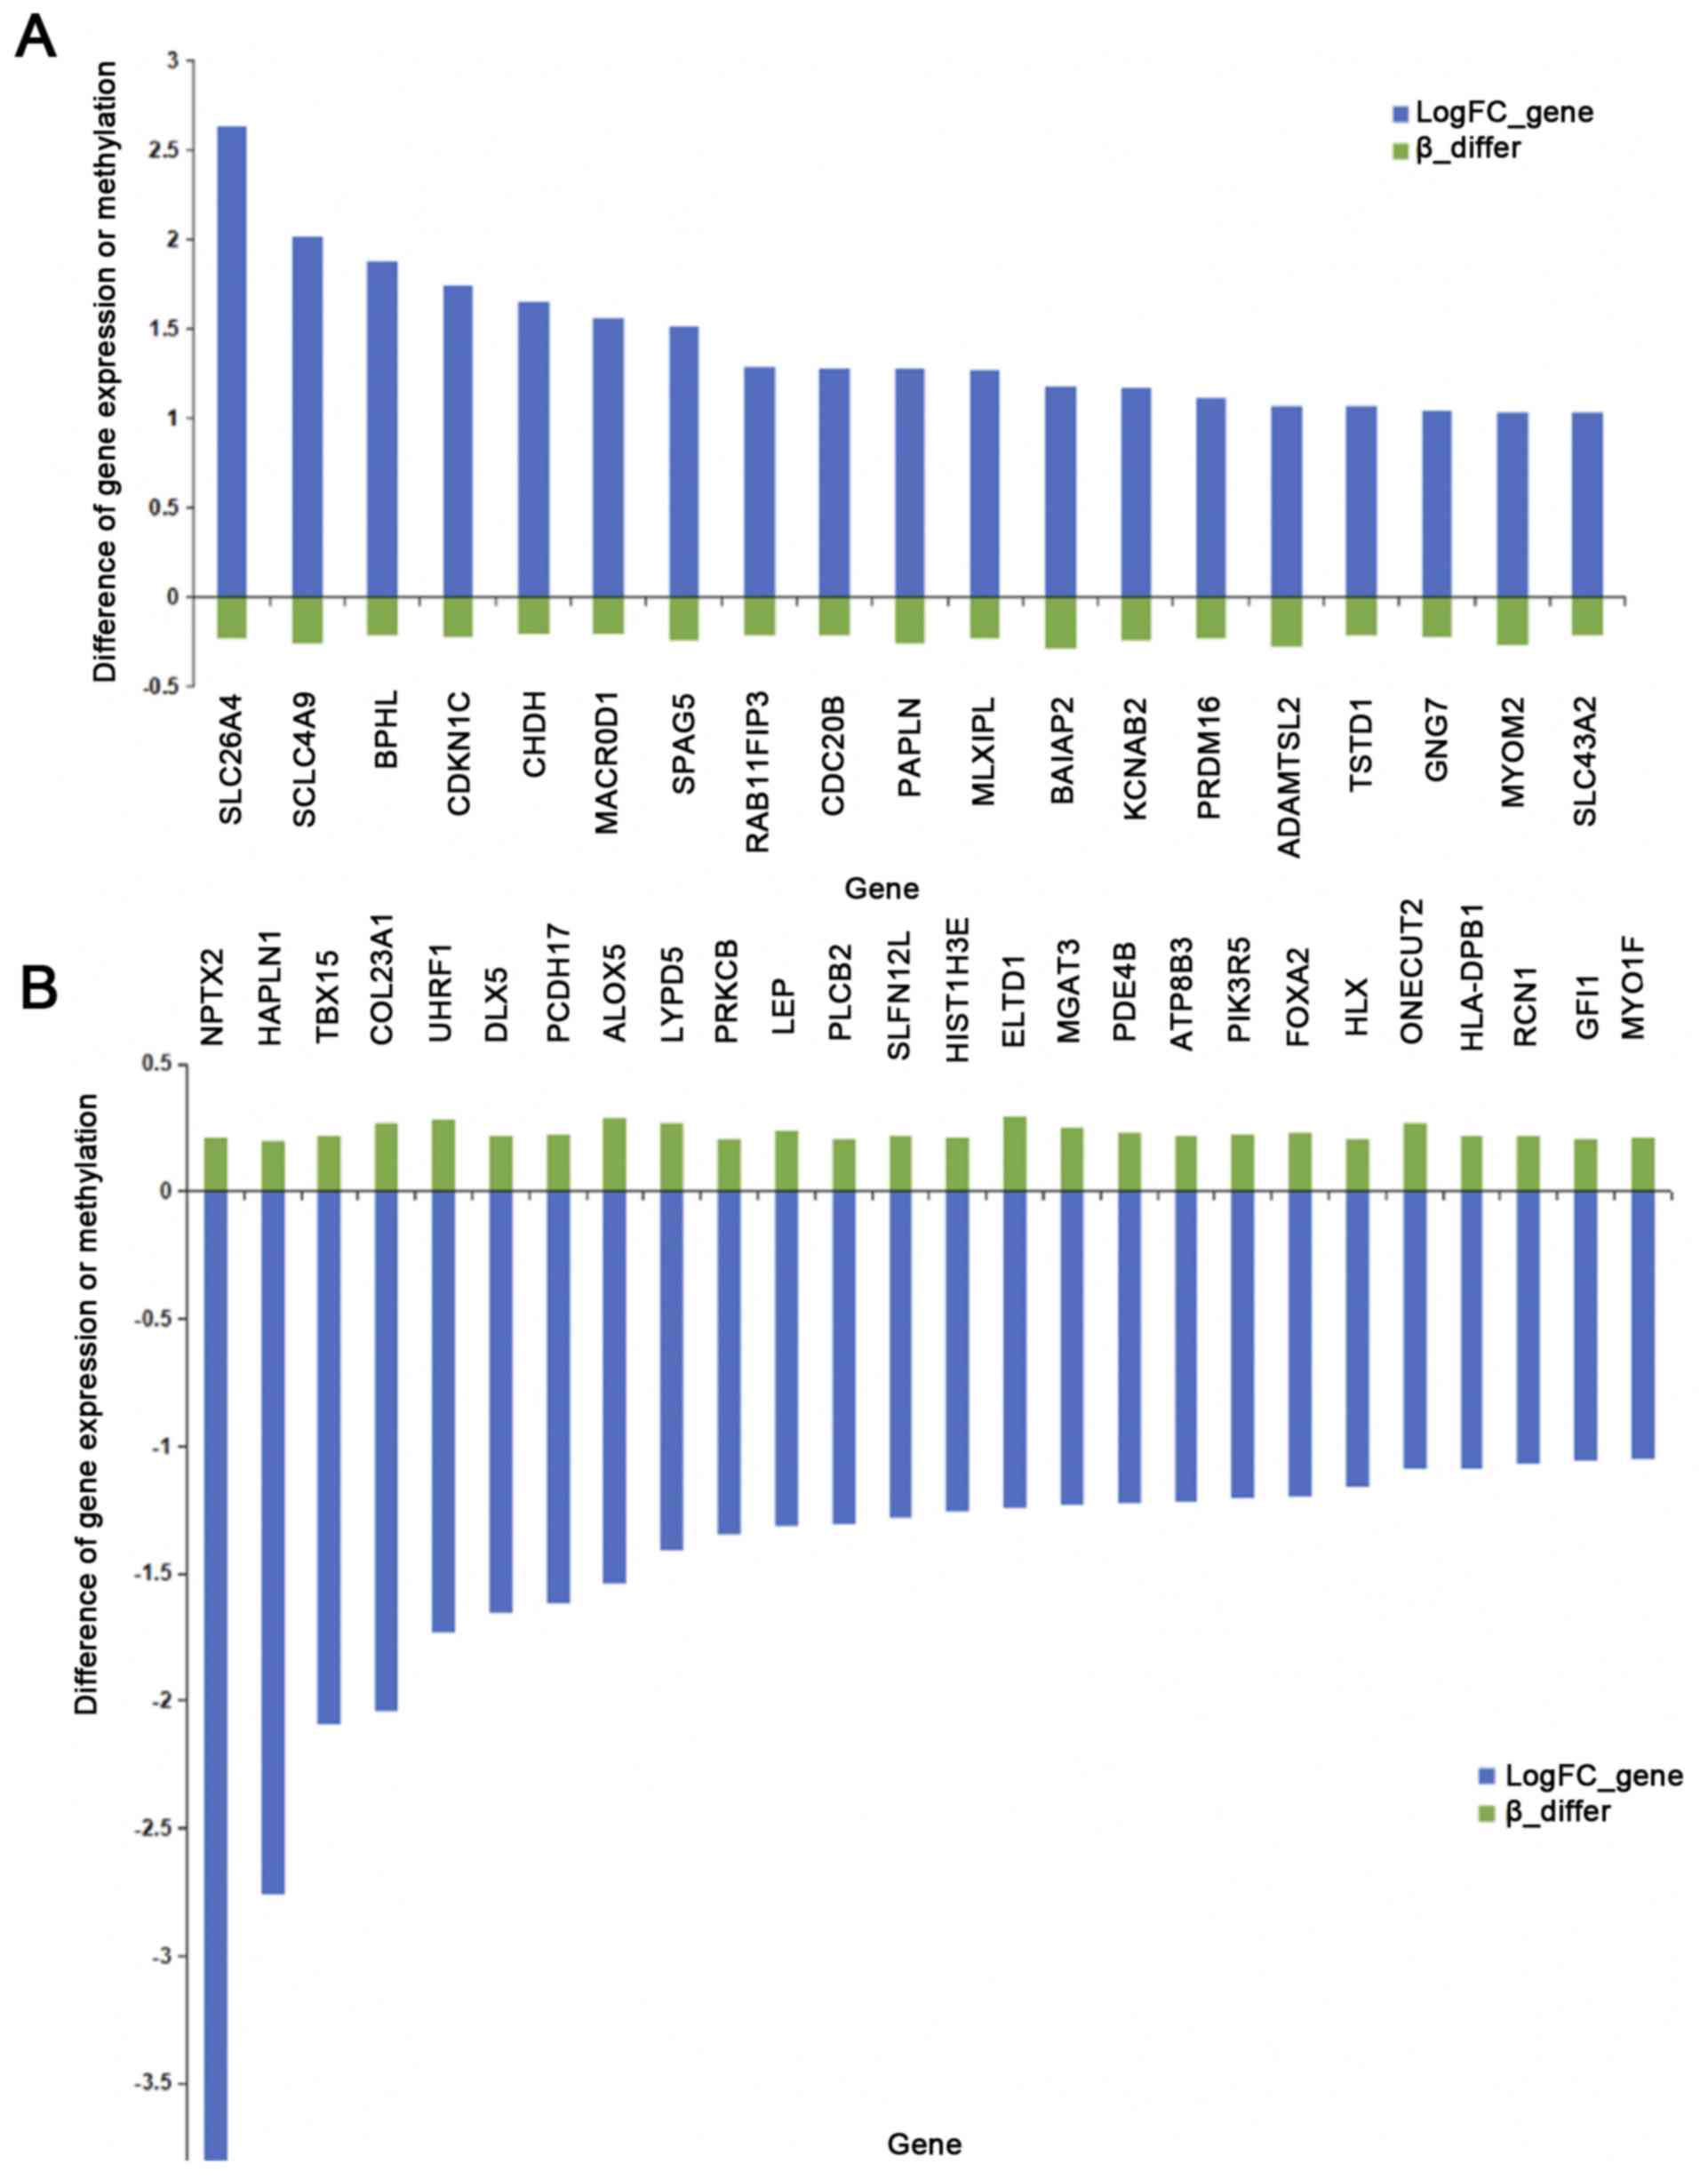
Combination of DEGs, DEMs and
DMSs
In total, 143 DEGs involved in DMSs were identified
in ccRCC samples compared with normal kidney samples. The gene
expression level and DNA methylation level of 45 of these genes
exhibited inverse associations (Fig.
3). A total of 851 miRNA-gene pairs were simultaneously
involved in DEGs, DEMs and DMS-located genes. Among them, there
were 127 miRNA-gene pairs, the genes of which were negatively
associated with corresponding DEMs and DMSs. Furthermore, 32 of
these miRNA-gene pairs, of which the targeted genes had
well-defined genetic locations, are presented in Table VI. The 32 miRNA-gene pairs were
composed of 15 genes and 14 miRNAs. HAPLN1 had the most
significant differences in expression and was regulated by
hsa-miR-204 and hsa-miR-218. Results of the
verification are presented in Table
VII; HAPLN1 had a lower expression level and a
significantly higher methylation level in ccRCC tissues than in
adjacent non-cancerous tissues (P<0.0001); the expression of
hsa-miR-204 and hsa-miR-218 was significantly higher
in ccRCC tissues than in adjacent non-cancerous tissues
(P<0.0001).
| Table VI.The 32 microRNA-gene pairs, the
target genes of which were negatively regulated by corresponding
differentially expressed miRNA and differentially methylated sites,
and had well-defined genetic locations. |
Table VI.
The 32 microRNA-gene pairs, the
target genes of which were negatively regulated by corresponding
differentially expressed miRNA and differentially methylated sites,
and had well-defined genetic locations.
| MicroRNA | Gene | MiRNA_logFC | Gene_LogFC | Beta_diff | Gene_locus | Methy_loc |
|---|
| hsa-miR-204 | HAPLN1 | 3179.242 | −2.756 | 0.202 | 3′-UTR | TSS1500 |
| hsa-miR-218 | HAPLN1 | 189.092 | −2.756 | 0.202 | 3′-UTR | TSS1500 |
| hsa-miR-106b | SLC26A4 | −519.831 | 2.631 | −0.227 | 3′-UTR | TSS1500; Body |
| hsa-miR-106b | BPHL | −519.831 | 1.878 | −0.211 | 3′-UTR | Body |
| hsa-miR-124 | DLX5 | 18.996 | −1.652 | 0.221 | 3′-UTR | Body |
|
hsa-miR-125a-5p | ALOX5 | 125.869 | −1.537 | 0.288 | 3′-UTR | Body |
| hsa-miR-183 | ALOX5 | 10.550 | −1.537 | 0.288 | 3′-UTR | Body |
|
hsa-miR-125a-5p | LEP | 125.869 | −1.314 | 0.236 | 3′-UTR | TSS1500 |
| hsa-miR-29b | LEP | 1101.186 | −1.314 | 0.236 | 3′-UTR | TSS1500 |
| hsa-miR-29c | LEP | 1699.774 | −1.314 | 0.236 | 3′-UTR | TSS1500 |
| hsa-miR-30b | LEP | 1746.324 | −1.314 | 0.236 | 3′-UTR | TSS1500 |
| hsa-let-7a | PLCB2 | 4972.969 | −1.303 | 0.206 | 3′-UTR | Body |
| hsa-let-7c | PLCB2 | 580.187 | −1.303 | 0.206 | 3′-UTR | Body |
| hsa-let-7f | PLCB2 | 4506.520 | −1.303 | 0.206 | 3′-UTR | Body |
| hsa-let-7g | PLCB2 | 531.008 | −1.303 | 0.206 | 3′-UTR | Body |
| hsa-miR-204 | PDE4B | 3179.242 | −1.224 | 0.232 | 3′-UTR | TSS200;TSS1500 |
|
hsa-miR-125a-5p | PIK3R5 | 125.869 | −1.203 | 0.222 | 3′-UTR | TSS200 |
| hsa-miR-29b | PIK3R5 | 1101.186 | −1.203 | 0.222 | 3′-UTR | TSS200 |
| hsa-miR-29c | PIK3R5 | 1699.774 | −1.203 | 0.222 | 3′-UTR | TSS200 |
| hsa-miR-337-5p | FOXA2 | 6.426 | −1.198 | 0.233 | 3′-UTR | Body; 3′UTR |
| hsa-let-7a | HLX | 3179.242 | −2.756 | 0.202 | 3′-UTR | 3′-UTR |
| hsa-let-7c | HLX | 189.092 | −2.756 | 0.202 | 3′-UTR | 3′-UTR |
| hsa-let-7f | HLX | −519.831 | 2.631 | −0.227 | 3′-UTR | 3′-UTR |
| hsa-let-7g | HLX | −519.831 | 1.878 | −0.211 | 3′-UTR | 3′-UTR |
| hsa-miR-30b | HLX | 1746.324 | −1.157 | 0.206 | 3′-UTR | 3′-UTR |
|
hsa-miR-125a-5p | ONECUT2 | 125.869 | −1.087 | 0.271 | CDS | 1stExon |
| hsa-miR-124 | HLA-DPB1 | 18.996 | −1.084 | 0.220 | 3′-UTR | Body |
| hsa-miR-106b | ADAMTSL2 | −519.831 | 1.073 | −0.277 | 3′-UTR | Body |
| hsa-let-7a | MYO1F | 4972.969 | −1.050 | 0.212 | CDS | Body |
| hsa-let-7c | MYO1F | 580.187 | −1.050 | 0.212 | CDS | Body |
| hsa-let-7f | MYO1F | 4506.520 | −1.050 | 0.212 | CDS | Body |
| Table VII.Results of methylation-specific
polymerase chain reaction and reverse transcription-polymerase
chain reaction. |
Table VII.
Results of methylation-specific
polymerase chain reaction and reverse transcription-polymerase
chain reaction.
| Group | HAPLN1-methy | HAPLN1-mRNA | Hsa-miR-204 | Hsa-miR-218 |
|---|
| ccRCC tissues | 4.228±1.061 | 0.466±0.512 | 4.377±1.057 | 4.627±1.189 |
| Adjacent
tissues | 1.034±0.024 | 1.064±0.671 | 1.037±0.021 | 1.029±0.020 |
| P-value | <0.0001 | <0.0001 | <0.0001 | <0.0001 |
| T | 9.69 | −6.06 | 15.23 | 14.93 |
Discussion
Genetic variations are associated with the
occurrence and development of RCC. miRNAs regulate gene expression
and serve an important role in the development of cancer. The
methylation status of certain genes is associated with cancer
development and metastatic recurrence in ccRCC. In the present
study, the mRNA and miRNA expression profiles, as well as the
methylation profiles, were analyzed. A total of 2,172 DEGs, 202
DEMs and 2,172 DMSs were identified in ccRCC samples compared with
normal kidney samples. The DEGs were enriched in 1,015 GO terms,
and the majority of them were associated with the plasma membrane,
extracellular exosome and material transport, including the plasma
membrane part, extracellular exosome and ion transport (Table IV). Plasma membrane part was the most
significant GO term for the DEGs. Plasma membrane part is a
cellular component term, which participates in regulating DNA
methylation and the mechanism of glioma (17–19). Human
plasma membrane-associated sialidase (NEU3), an important cellular
component of cell membrane part, serves crucial roles in the
regulation of cell surface functions. Ueno et al (20) reported that NEU3 was upregulated in
RCC and promoted interleukin-6-induced apoptosis suppression and
cell motility. Tringali et al (21) demonstrated a crucial role of NEU3 in
RCC malignancy by acting as a key regulator of the β1
integrin-recycling pathway and FAK/Akt signaling. Therefore, the
cellular component term of plasma membrane part was associated with
the progression of RCC. Furthermore, the DEGs were enriched in 69
KEGG pathways, including graft-versus-host disease, staphylococcus
aureus infection, type I diabetes mellitus and rheumatoid
arthritis. Graft-versus-host disease (GvHD) was the most
significant pathway. GvHD is a medical complication following the
receipt of transplanted tissue from a genetically different person.
It is commonly associated with stem cell transplant (bone marrow
transplant), but the term also applies to other forms of tissue
graft. A previous study revealed a reduced rate of GvHD during
cyclophosphamide-using non-myeloablative cell therapy against renal
cancer (22). Another study indicated
that the graft vs. tumor reactivity following allogeneic stem cell
transplantation may be unavoidably associated with GvHD in patients
with RCC (23). Additionally,
Massenkeil et al (24)
reported that non-myeloablative stem cell transplantation in
metastatic renal cell carcinoma delayed GvHD. In the present study,
we hypothesized that GvHD may serve certain roles in the
pathogenesis of RCC and that further functional studies were
required.
Following combination analysis of DEGs, DEMs and
DMSs, HAPLN1 was one of the DEGs that was negatively
regulated by their corresponding targeted DEMs and DMSs, and it had
well-defined genetic locations. Furthermore, HAPLN1
exhibited the most pronounced differences in expression, and was
negatively regulated by hsa-miR-204 and hsa-miR-218.
Table VI indicates that
hsa-miR-204 and hsa-miR-218 targeted the 3′-UTR of
HAPLN1. It is well known that miRNAs block the transcription
of their target genes when they target the 3′-UTR (25). In the present study, the expression of
HAPLN1 was negatively associated with the expression of
hsa-miR-204 and hsa-miR-218. Additionally, the
methylation site of HAPLN1 is located in the transcriptional
start site 1,500 bp (TSS1500) region. In this region, gene
methylation may lead to deletion or downregulation of gene
expression. In the present study, the expression of HAPLN1
was negatively associated with the methylation level. Furthermore,
HAPLN1 and hsa-miR-204 were the most significantly
different gene and DEM, respectively (Table VI). HAPLN1 is a protein that
in humans is encoded by the HAPLN1 gene. HAPLN1 is an
extracellular matrix component serving an important role in heart
development, and is associated with cerebral creatine deficiency
syndrome and fracture. It was reported that overexpression of
HAPLN1 and its SP-IgV domain increased the tumorigenic properties
of mesothelioma (26). Yau et
al (27) identified HAPLN1
as a novel prognostic gene candidate to predict the outcome of
breast cancer. Mebarki et al (28) proved that HAPLN1 reflected a signaling
network leading to stemness, mesenchymal commitment and progression
in hepatocellular carcinoma. The present study, revealed that
HAPLN1 had a low expression level and a high methylation
level in ccRCC tissues (Table VII),
which may be involved in the occurrence of ccRCC.
Hsa-miR-204 was identified to be highly expressed in
lymphocytic leukemia, and it was differentially expressed during
the progression of recurrence in hepatocellular carcinoma and
gastric cancer (29–31). Hsa-miR-218 was reported to
serve an important role in the proliferation and metastasis of
colon carcinoma (32). Additionally,
hsa-miR-218 may inhibit the multidrug resistance of gastric
cancer cells (33). In the present
study, hsa-miR-204 and hsa-miR-218 were proven to be
highly expressed in ccRCC tissues, and may serve certain roles in
the pathogenesis of RCC by targeting HAPLN1.
In conclusion, the present study identified certain
biomarkers of RCC by combination analysis of a mRNA expression
profile, a miRNA expression profile and a methylation profile,
including HAPLN1, hsa-miR-204 and hsa-miR-218.
Additionally, the cellular component of plasma membrane part and
the pathway of GvHD may be involved in the pathogenesis of RCC.
However, there are certain limitations to the present study. The
sample size was small in the profiles and verification, and
therefore the identified genes and miRNAs may have greater
specificity and less universality. The biomarkers screened in the
present study provided an indication to study the pathogenesis of
RCC. Additionally, HAPLN1, hsa-miR-204 and
hsa-miR-218 require further investigation in larger samples
to elucidate their exact function and clinical significance.
Acknowledgements
Not applicable.
Funding
No funding was received.
Availability of data and materials
All data generated or analyzed during the present
study are included in this published article.
Authors' contributions
YX designed the experiments. ZW and ZZ performed
data analysis. ZW and CZ interpreted the data and wrote the
manuscript. ZW and YX discussed the results and revised the
manuscript. All authors contributed to discussions regarding the
results and the manuscript. All authors have read and approved the
final manuscript.
Ethics approval and consent to
participate
Written informed consent was obtained when the
patients were accepted by the Second Hospital of Tianjin Medical
University. All procedures were performed in accordance with the
ethical standards of the institutional and/or national research
committee.
Consent for publication
Consent for publication was obtained from all
patients.
Competing interests
The authors declare that they have no competing
interests.
References
|
1
|
Hsieh JJ, Purdue MP, Signoretti S, Swanton
C, Albiges L, Schmidinger M, Heng DY, Larkin J and Ficarra V: Renal
cell carcinoma. Nat Rev Dis Primers. 3:170092017. View Article : Google Scholar : PubMed/NCBI
|
|
2
|
Protzel C, Maruschke M and Hakenberg OW:
Epidemiology, aetiology, and pathogenesis of renal cell carcinoma.
Eur Urol Supp. 11:52–59. 2012. View Article : Google Scholar
|
|
3
|
Baek M, Jung JY, Kim JJ, Park KH and Ryu
DS: Characteristics and clinical outcomes of renal cell carcinoma
in children: a single center experience. Int J Urol. 17:737–740.
2010. View Article : Google Scholar : PubMed/NCBI
|
|
4
|
Häggström C, Rapp K, Stocks T, Manjer J,
Bjørge T, Ulmer H, Engeland A, Almqvist M, Concin H, Selmer R, et
al: Correction: Metabolic factors associated with risk of renal
cell carcinoma. PloS One. 8:e574752013. View Article : Google Scholar : PubMed/NCBI
|
|
5
|
Trpkov K, Hes O, Agaimy A, Bonert M,
Martinek P, Magi-Galluzzi C, Kristiansen G, Lüders C, Nesi G,
Compérat E, et al: Fumarate hydratase-deficient renal cell
carcinoma is strongly correlated with fumarate hydratase mutation
and hereditary leiomyomatosis and renal cell carcinoma syndrome. Am
J Surg Pathol. 40:8652016. View Article : Google Scholar : PubMed/NCBI
|
|
6
|
Matsuura K, Nakada C, Mashio M, Narimatsu
T, Yoshimoto T, Tanigawa M, Tsukamoto Y, Hijiya N, Takeuchi I,
Nomura T, et al: Downregulation of SAV1 plays a role in
pathogenesis of high-grade clear cell renal cell carcinoma. BMC
Cancer. 11:5232011. View Article : Google Scholar : PubMed/NCBI
|
|
7
|
White NM, Bao TT, Grigull J, Youssef YM,
Girgis A, Diamandis M, Fatoohi E, Metias M, Honey RJ, Stewart R, et
al: miRNA profiling for clear cell renal cell carcinoma: Biomarker
discovery and identification of potential controls and consequences
of miRNA dysregulation. J Urol. 186:1077–1083. 2011. View Article : Google Scholar : PubMed/NCBI
|
|
8
|
Fedorko M, Pacik D, Wasserbauer R, Juracek
J, Varga G, Ghazal M and Nussir MI: microRNAs in the pathogenesis
of renal cell carcinoma and their diagnostic and prognostic utility
as cancer biomarkers. Int J Biol Markers. 31:e26–e37. 2015.
View Article : Google Scholar
|
|
9
|
Tsai HC and Baylin SB: Cancer epigenetics:
Linking basic biology to clinical medicine. Cell Res. 21:502–517.
2011. View Article : Google Scholar : PubMed/NCBI
|
|
10
|
Ricketts CJ, Morris MR, Gentle D, Brown M,
Wake N, Woodward ER, Clarke N, Latif F and Maher ER: Genome-wide
CpG island methylation analysis implicates novel genes in the
pathogenesis of renal cell carcinoma. Epigenetics. 7:278–290. 2012.
View Article : Google Scholar : PubMed/NCBI
|
|
11
|
Wang X, Chen X, Han W, Ruan A, Chen L,
Wang R, Xu Z, Xiao P3, Lu X, Zhao Y, et al: miR-200c targets CDK2
and suppresses tumorigenesis in renal cell carcinoma. Mol Cancer
Res. 13:1567–1577. 2015. View Article : Google Scholar : PubMed/NCBI
|
|
12
|
Wei JH, Haddad A, Wu KJ, Zhao HW, Kapur P,
Zhang ZL, Zhao LY, Chen ZH, Zhou YY, Zhou JC, et al: A
CpG-methylation-based assay to predict survival in clear cell renal
cell carcinoma. Nat Commun. 6:86992015. View Article : Google Scholar : PubMed/NCBI
|
|
13
|
Wiberg AO, Liu L, Tong Z, Myslivets E,
Ataie V, Kuo BP, Alic N and Radic S: Photonic preprocessor for
analog-to-digital-converter using a cavity-less pulse source. Opt
Express. 20:B419–B427. 2012. View Article : Google Scholar : PubMed/NCBI
|
|
14
|
Dennis G Jr, Sherman BT, Hosack DA, Yang
J, Gao W, Lane HC and Lempicki RA: DAVID: Database for annotation,
visualization, and integrated discovery. Genome Biol. 4:P32003.
View Article : Google Scholar : PubMed/NCBI
|
|
15
|
Dweep H, Sticht C, Pandey P and Gretz N:
miRWalk-database: Prediction of possible miRNA binding sites by
‘walking’ the genes of three genomes. J Biomed Inform. 44:839–847.
2011. View Article : Google Scholar : PubMed/NCBI
|
|
16
|
Livak KJ and Schmittgen TD: Analysis of
relative gene expression data using real-time quantitative PCR and
the 2(-Delta Delta C(T)) method. Methods. 25:402–408. 2001.
View Article : Google Scholar : PubMed/NCBI
|
|
17
|
Nautiyal S, Carlton VE, Lu Y, Ireland JS,
Flaucher D, Moorhead M, Gray JW, Spellman P, Mindrinos M, Berg P
and Faham M: High-throughput method for analyzing methylation of
CpGs in targeted genomic regions. Proc Natl Acad Sci USA.
107:12587–12592. 2010. View Article : Google Scholar : PubMed/NCBI
|
|
18
|
Gao YF, Shu Y, Yang L, He YC, Li LP, Huang
G, Li HP and Jiang Y: A graphic method for identification of novel
glioma related genes. Biomed Res Int. 2014:8919452014. View Article : Google Scholar : PubMed/NCBI
|
|
19
|
Denham J, O'Brien BJ, Harvey JT and
Charchar FJ: Genome-wide sperm DNA methylation changes after 3
months of exercise training in humans. Epigenomics. 7:717–731.
2015. View Article : Google Scholar : PubMed/NCBI
|
|
20
|
Ueno S, Saito S, Wada T, Yamaguchi K,
Satoh M, Arai Y and Miyagi T: Plasma membrane-associated sialidase
is up-regulated in renal cell carcinoma and promotes
interleukin-6-induced apoptosis suppression and cell motility. J
Biol Chem. 281:7756–7764. 2006. View Article : Google Scholar : PubMed/NCBI
|
|
21
|
Tringali C, Lupo B, Silvestri I, Papini N,
Anastasia L, Tettamanti G and Venerando B: The plasma membrane
sialidase NEU3 regulates the malignancy of renal carcinoma cells by
controlling β1 integrin internalization and recycling. J Biol Chem.
287:42835–42845. 2012. View Article : Google Scholar : PubMed/NCBI
|
|
22
|
Eto M, Harano M, Tatsugami K, Harada M,
Kamiryo Y, Kiyoshima K, Hamaguchi M, Tsuneyoshi M, Yoshikai Y and
Naito S: Cyclophosphamide-using nonmyeloablative allogeneic cell
therapy against renal cancer with a reduced risk of
graft-versus-host disease. Clin Cancer Res. 13:1029–1035. 2007.
View Article : Google Scholar : PubMed/NCBI
|
|
23
|
van Bergen CA, Verdegaal EME, Honders MW,
Hoogstraten C, Steijn-van Tol AQ, de Quartel L, de Jong J, Meyering
M, Falkenburg JH, Griffioen M and Osanto S: Durable remission of
renal cell carcinoma in conjuncture with graft versus host disease
following allogeneic stem cell transplantation and donor lymphocyte
infusion: Rule or exception? PloS One. 9:e851982014. View Article : Google Scholar : PubMed/NCBI
|
|
24
|
Massenkeil G, Roigas J, Nagy M, Wille A,
Stroszczynski C, Mapara MY, Loening S, Dörken B and Arnold R:
Nonmyeloablative stem cell transplantation in metastatic renal cell
carcinoma: Delayed graft-versus-tumor effect is associated with
chimerism conversion but transplantation has high toxicity. Bone
Marrow Transplant. 34:309–316. 2004. View Article : Google Scholar : PubMed/NCBI
|
|
25
|
Ahanda Endale ML, Fritz ER, Estellé J, Hu
ZL, Madsen O, Groenen MA, Beraldi D, Kapetanovic R, Hume DA,
Rowland RR, et al: Prediction of altered 3′-UTR miRNA-binding sites
from RNA-Seq data: The swine leukocyte antigen complex (SLA) as a
model region. Plos One. 7:e486072012. View Article : Google Scholar : PubMed/NCBI
|
|
26
|
Ivanova AV, Goparaju CM, Ivanov SV, Nonaka
D, Cruz C, Beck A, Lonardo F, Wali A and Pass HI: Protumorigenic
role of HAPLN1 and its IgV domain in malignant pleural
mesothelioma. Clin Cancer Res. 15:2602–2611. 2009. View Article : Google Scholar : PubMed/NCBI
|
|
27
|
Yau C, Esserman L, Moore DH, Waldman F,
Sninsky J and Benz CC: A multigene predictor of metastatic outcome
in early stage hormone receptor-negative and triple-negative breast
cancer. Breast Cancer Res. 12:R852010. View Article : Google Scholar : PubMed/NCBI
|
|
28
|
Mebarki S, Désert R, Sulpice L, Sicard M,
Desille M, Canal F, Schneider Dubois-Pot H, Bergeat D, Turlin B,
Bellaud P, et al: De novo HAPLN1 expression hallmarks Wnt-induced
stem cell and fibrogenic networks leading to aggressive human
hepatocellular carcinomas. Oncotarget. 7:39026–39043. 2016.
View Article : Google Scholar : PubMed/NCBI
|
|
29
|
Zanette DL, Rivadavia F, Molfetta GA,
Barbuzano FG, Proto-Siqueira R, Silva WA Jr, Falcão RP and Zago MA:
miRNA expression profiles in chronic lymphocytic and acute
lymphocytic leukemia. Braz J Med Biol Res. 40:1435–1440. 2007.
View Article : Google Scholar : PubMed/NCBI
|
|
30
|
Yang Z, Miao R, Li G, Wu Y, Robson SC,
Yang X, Zhao Y, Zhao H and Zhong Y: Identification of recurrence
related microRNAs in hepatocellular carcinoma after surgical
resection. Int J Mol Sci. 14:1105–1118. 2013. View Article : Google Scholar : PubMed/NCBI
|
|
31
|
Wang XW, Wu Y, Wang D and Qin ZF: microRNA
network analysis identifies key microRNAs and genes associated with
precancerous lesions of gastric cancer. Genet Mol Res.
13:8695–8703. 2014. View Article : Google Scholar : PubMed/NCBI
|
|
32
|
Jiang B, Liu GW and Xie HH: Expression and
its clinical significance of hsa-miR-218 in tissues of colon
carcinoma. Med Info. 2010.
|
|
33
|
Zhang XL, Shi HJ, Wang JP, Tang HS and Cui
SZ: miR-218 inhibits multidrug resistance (MDR) of gastric cancer
cells by targeting hedgehog/smoothened. Int J Clin Exp Pathol.
8:6397–6406. 2015.PubMed/NCBI
|