Introduction
Metabolic alterations in cancer cells can enhance
cell growth and survival by promoting energy metabolism (1–3). In
addition, previous metabolomic analyses of colorectal and kidney
cancer cells have revealed increased levels of reduced glutathione
(GSH) in tumors along with changes in glycolysis, amino acid
metabolism and the tricarboxylic acid cycle (4–7). These
observations suggest that the GSH-dependent defense system against
reactive oxygen species (ROS) serves a critical role in these types
of cancer. ROS were recently demonstrated to induce ferroptosis,
which is an iron-dependent form of non-apoptotic and non-necrotic
cell death (8–10). Ferrostatin-1 has been identified as a
compound that attenuates ferroptosis by blocking lipid peroxidation
(11,12). Erastin, a cystine uptake inhibitor, is
hypothesized to induce ferroptosis by suppressing the synthesis of
GSH, leading to lipid oxidation (8).
Glutamate-cysteine ligase (GCL; EC 6.3.2.2),
composed of a GCL catalytic subunit (GCLC) and GCL modifier subunit
(GCLM), is the rate-limiting enzyme in GSH biosynthesis, and is
responsible for converting glutamine and cysteine to
γ-glutamylcysteine (13). Buthionine
sulfoximine (BSO) is a GCLC inhibitor. Ferroptosis induction by BSO
in cancer cells has not been fully clarified. In an early clinical
trial, BSO was identified to deplete tumor glutathione levels when
administered by continuous infusion but did not demonstrate
clinical benefits against cancer (14). However, targeting sensitive cancer
cell types that have been identified using markers for GCLC
inhibitor-sensitivity may optimize the effects of these drugs.
Therefore, the present study investigated whether BSO induced
ferroptosis in cancer cells, and whether the cellular glutathione
level may be a marker for GCLC inhibitor-sensitivity.
Materials and methods
Cell-free GCLC enzymatic assay
Expression of N-terminal His-tagged human GCLM was
induced with 1 mM isopropyl-β-D-thiogalactoside (IPTG, Wako Pure
Chemical Industries, Ltd., Osaka, Japan) at 30°C for 5 h in
Escherichia coli. Expression of C-terminal His-tagged human
GCLC was induced with 1 mM IPTG at 16°C for 16 h in Escherichia
coli. GCLC and GCLM proteins were purified by Ni-NTA affinity
chromatography (Qiagen, Hilden, Germany), followed by Superdex 200
gel filtration chromatography (GE Healthcare, Piscataway, NJ, USA),
as previously described (15).
Following purification, the enzymes were used for the subsequent
studies. 0.1, 1, 10, and 100 µM of BSO (Sigma-Aldrich; Merck KGaA,
Darmstadt, Germany) was premixed with enzymes (10 nM for each) for
30 min prior to the addition of 200 µM adenosine triphosphate
(ATP), 1.2 mM glutamic acid and 200 µM cysteine. Following
incubation for 60 min, the reaction was terminated by adding 1%
formic acid solution and the ATP and γ-glutamylcysteine levels were
measured using RapidFire300 mass spectrometry (Agilent
Technologies, Inc., Santa Clara, CA, USA) coupled with API4000
triple quadrupole mass spectrometer (AB Sciex, Framingham, MA). The
analytical data were integrated using RapidFire Integrator software
(version 4.0; Agilent Technologies, Inc.).
Cell lines
The cell lines used in the present study were
purchased from American Type Culture Collection (Manassas, VA,
USA), DS Pharma Biomedical (Osaka, Japan), and Horizon Discovery
Ltd. (Cambridge, UK). The cells were maintained at 37°C in an
atmosphere of 5% CO2 in RPMI-1640 (Thermo Fisher
Scientific, Inc., Waltham, MA, USA) with 10% fetal bovine serum
(FBS; Thermo Fisher Scientific, Inc.). All cell lines used are
summarized in Table I.
 | Table I.All cancer cell lines used in the
present study. |
Table I.
All cancer cell lines used in the
present study.
| Cell line | Organ | Supplier | Catalog number | Experimental
use |
|---|
| 769P | Kidney | ATCC | CRL-1933 | Fig. 3 |
| 786-O | Kidney | ATCC | CRL-1932 | Table II; Fig. 3 |
| A-498 | Kidney | ATCC | HTB-44 | Tables II and III; Fig.
3 |
| A2780 | Ovary | DS pharma
(ECACC) | 93112519 | Table II |
| A2780/CDDP | Ovary | DS pharma
(ECACC) | 93112517 | Table II |
| A704 | Kidney | ATCC | HTB-45 | Fig. 3 |
| ACHN | Kidney | ATCC | CRL-1611 | Table II; Fig. 3 |
| Caki-1 | Kidney | ATCC | HTB-46 | Fig. 3 |
| Caki-2 | Kidney | ATCC | HTB-47 | Table II; Fig. 3 |
| COLO 205 | Colon | ATCC | CRL-222 | Table II |
| DLD-1 | Colon | Horizon
discovery | HD PAR-086 | Fig. 3 |
| DU 145 | Prostate | ATCC | HTB-81 | Table II |
| G401 | Kidney | ATCC | CRL-1441 | Fig. 3 |
| G402 | Kidney | ATCC | CRL-1440 | Tables II and III; Fig.
3 |
| HCT-116 | Colon | ATCC | CCL-247 | Tables II and III; Fig.
3 |
| HCT-15 | Colon | ATCC | CCL-225 | Table II |
| HT-29 | Colon | ATCC | HTB-38 | Table II; Fig. 2 |
| LS 174T | Colon | ATCC | CL-188 | Table II |
| MIA PaCa-2 | Pancreas | ATCC | CRL-1420 | Fig. 3 |
| PANC-1 | Pancreas | DS pharma
(ECACC) | 87092802 | Table II; Figs. 1 and 2 |
| PC-3 | Prostate | ATCC | CRL-1435 | Table II; Fig. 3 |
| RCC4 VHL-/- | Kidney | DS pharma
(ECACC) | 3112702 | Table II; Fig. 3 |
| RCC4 VHL+/+ | Kidney | DS pharma
(ECACC) | 3112703 | Table II; Fig. 3 |
| RKO | Colon | ATCC | CRL-2577 | Table II |
| SK-NEP-1 | Kidney | ATCC | HTB-48 | Fig. 3 |
| SW156 | Kidney | ATCC | CRL-2175 | Fig. 3 |
| SW48 | Colon | Horizon
discovery | HD PAR-006 | Table II; Fig. 2 |
| SW480 | Colon | ATCC | CCL-228 | Table II |
| SW620 | Colon | ATCC | CCL-227 | Table II |
Viability assays and determination of
cellular glutathione
The cells were seeded at 1,000–3,000 cells/100 µl in
each well of a 96-well plate. The following day, BSO, GSH monoethyl
ester (GSHee; Bachem AG, Bubendorf, Switzerland), ferrostatin-1,
N-acetylcysteine (NAC; both from Sigma-Aldrich; Merck KGaA),
cisplatin and ferric ammonium citrate (FAC; both from Wako Pure
Chemical Industries, Ltd.) were added to the wells. After a 24-h
incubation, the cellular total glutathione level [including GSH and
glutathione disulphide (GSSG)] was determined using a GSH/GSSG-Glo
Assay (Promega Corporation, Madison, WI, USA). Following a 3-day
incubation, cell viability was assessed using a Cell Titer-Glo
Luminescent Cell Viability Assay (Promega Corporation). To analyze
the basal levels of total glutathione (GSH+GSSG) without BSO
treatment, the total glutathione levels and cell viability were
measured 2 days after the cells were plated.
Analysis of mutations and copy number
of the von Hippel-Lindau tumor suppressor (VHL) gene in cancer cell
lines
GSH is oxidized into GSSG when neutralizing ROS
(16). GSSG may be reduced into GSH
by glutathione reductase using NADPH (17) whose major source is pentose phosphate
pathway (PPP) (18). PPP branches
from glycolysis (18) that is known
to be regulated by various cancer associated genes including
hypoxia-inducible factor 1-α (19–21) whose
expression is often upregulated by VHL deficiency (22). Therefore, VHL status is potentially
associated with the regulation of the ROS defense system by GSH. In
order to examine the association between VHL status, BSO
sensitivity and glutathione levels, the VHL status of cancer
cells were analyzed. VHL mutation data were downloaded from
the Catalog of Somatic Mutations in Cancer database, Cell Lines
Project v79 (ftp://ftp.sanger.ac.uk/pub/CGP/cosmic). The copy
number data for VHL were downloaded from the Cancer Cell
Line Encyclopedia (http://www.broadinstitute.org/ccle).
Measurement of lipid peroxidation
A total of 1×10⁶ PANC-1 cells were seeded
in a 10-cm dish, treated with BSO the following day, and incubated
for 24 h at 37°C. Subsequently, the cells were stripped with 0.25%
trypsin at 37°C. The cells were incubated with 5 µM BODIPY 581/591
C11 Lipid Peroxidation Sensor (Thermo Fisher Scientific, Inc.) for
30 min. Following two washes with PBS, the cells were re-suspended
in BD FACS flow sheath fluid (BD Biosciences, San Jose, CA, USA).
The lipid peroxidation level was assessed using FACS Verse™ system
and analyzed with FAC Suite v1.0.5.3841 (both BD Biosciences).
Metabolomic analysis of colorectal
tumors and cell lines
As described in the previous report (23), all the experiments were conducted
according to a study protocol approved by the Institutional Ethics
Committee of Kagawa University (Heisei 24–040) upon obtaining
informed consent from all subjects. The tumor and normal tissues
were surgically obtained from 275 colorectal cancer patients who
had not received any prior treatments in Kagawa University Hospital
from January 2012 to December 2013 according to the methods of the
previous report (23). Of the 275
patients, 5 (1.8%), 2 (0.7%), 36 (13.1%), 102 (37.1%), 85 (30.9%),
45 (16.4%), had adenoma (median age, 77 years; range, 52–84 years;
male/female, 1:4) and a clinical stage of 0 (median age, 73 years;
range, 73–74 years; male/female, 1:1), I (median age, 70 years;
range, 35–89 years; male/female, 22:14), II (median age, 73 years;
range, 35–96 years; male/female, 64:38), III (median age, 70 years;
range, 28–92 years; male/female, 42:43), IV (median age, 67 years;
range, 37–88 years; male/female, 25:20), respectively. The absolute
amounts of metabolites in clinical colorectal tumor samples
(n=275), their matched normal tissues (n=275) (23) and cell lines (RCC4
VHL−/− and RCC4 VHL+/+) were
measured using capillary electrophoresis-triple
quadrupole/time-of-flight MS at Keio University (Tsuruoka, Japan),
according to the methods of Yuan et al (24) and Soga et al (25–27).
SDS-PAGE and western blot
analysis
The anti-heat-shock protein 90 antibody (cat no.
CST4877; dilution, 1:2,000) for western blotting was purchased from
Cell Signaling Technology, Inc. (Danvers, MA, USA). Antibodies
against GCLC (cat no. ab190685; dilution, 1:5,000) and GSH
synthetase (GSS; cat no. ab124811; dilution, 1:2,000) were
purchased from Abcam (Cambridge, MA, USA). Cells (DLD-1, HCT-116,
MIA PaCa-2, PC-3, 769P, 786-O, A-498, A704, ACHN, Caki-1, Caki-2,
G401, G402, RCC4 VHL−/−, RCC4
VHL+/+, SK-NEP-1, SW156) were lysed in SDS sample
buffer (Bio-Rad Laboratories, Inc., Hercules, CA, USA) and heated
at 95°C for 5 min. Cell lysates (3 µg) were separated using
SDS-PAGE (7.5–15% gradient gel) and transferred onto Sequi-Blot™
polyvinylidene fluoride membranes (Bio-Rad Laboratories, Inc.). The
membranes were blocked with Starting Block™ T20 PBS
Blocking Buffer (Thermo Fisher Scientific, Inc.) and probed
overnight at 4°C with the primary antibodies diluted with 10%
Blocking Ace (DS Pharma Biomedical) in PBS containing 0.1%
Tween-20. The membranes were subsequently washed with PBS
containing 0.1% Tween-20 (Wako Pure Chemical Industries, Ltd.) and
incubated for one hour at room temperature with horseradish
peroxidase-labeled secondary antibody (Cell Signaling Technology;
cat. no. 7074; dilution 1:3,000) diluted with Can Get
Signal® immunoreaction enhancer solution II. The
membrane was washed with PBS containing 0.1% Tween-20 three times
for 10 min, and chemiluminescence was used to detect the
antibody-labeled proteins using SuperSignal West Femto Maximum
Sensitivity Substrate (Thermo Fisher Scientific, Inc.) and detected
with the LAS-3000 Luminescent Image Analyzer (Fujifilm Holdings
Corporation, Tokyo, Japan).
Gene expression analysis of tumors
from patients with colorectal cancer
The levels of gene expression of GCLC and GSS in
colorectal tumors (n=41) and their matched normal tissues (n=39)
were analyzed using the Agilent Expression Array Sure Print G3
Human Gene Expression v2 8×60K Microarray (Agilent Technologies,
Inc.) at Keio University (16).
Statistical analysis
The half-maximal inhibitory concentration
(IC50) values in the GCLC enzymatic assays were
determined using the XLfit software 5.4.0.8 (IDBS, Guildford, UK)
or GraphPad Prism v5.01 (GraphPad Software, Inc., La Jolla, CA,
USA). The IC50 values of the viability studies were
determined using a nonlinear regression curve fitted using GraphPad
Prism v.6.01. Differences in cell viability and rescue assays
between the control and treatment groups were analyzed using a
Williams' test, and the combination effects were evaluated using a
two-way analysis of variance followed by a Tukey's test.
Correlation between glutathione levels and growth inhibition by 100
µM of BSO in cancer cells was evaluated using Pearson correlation
analysis. Correlations between basal glutathione levels and GCLC or
GSS protein levels in cancer cells were determined by linear
regression analysis. Correlation between log2(T/N)
values of GSH and total glutathione (GSH+GSSG) in tissue samples
from patients with colorectal cancer was evaluated by Pearson
correlation analysis. Correlations between total glutathione
(GSH+GSSG) and GCLC or GSS mRNA levels (T/N) in tissue samples from
patients with colorectal cancer were also evaluated by Pearson
correlation analysis. P<0.025 was considered to indicate a
statistically significant difference in the statistical tests for
rescue studies. In the rest of the statistical tests, P<0.05 was
considered to indicate a statistically significant difference in
all statistical tests other than the rescue studies.
Results
Pharmacological properties of BSO
In the cell-free GCLC enzymatic assay, BSO inhibited
the activity of GCLC with an IC50 of 570 nM [95%
confidence interval (CI) 429–757 nM; Fig.
1A]. BSO reduced the total glutathione (GSH+GSSG) levels in
PANC-1 cells (Fig. 1B) and induced
lipid peroxidation, which was attenuated by NAC and α-tocopherol
(Fig. 1C). In addition, BSO decreased
the viability of PANC-1 cells (Fig.
1D), and this effect was attenuated by the addition of a
membrane-permeable GSH derivative, GSHee (Fig. 1E), and NAC (Fig. 1F). These results indicate that cell
viability was inhibited by the suppression of intracellular
glutathione and the subsequent lipid peroxidation.
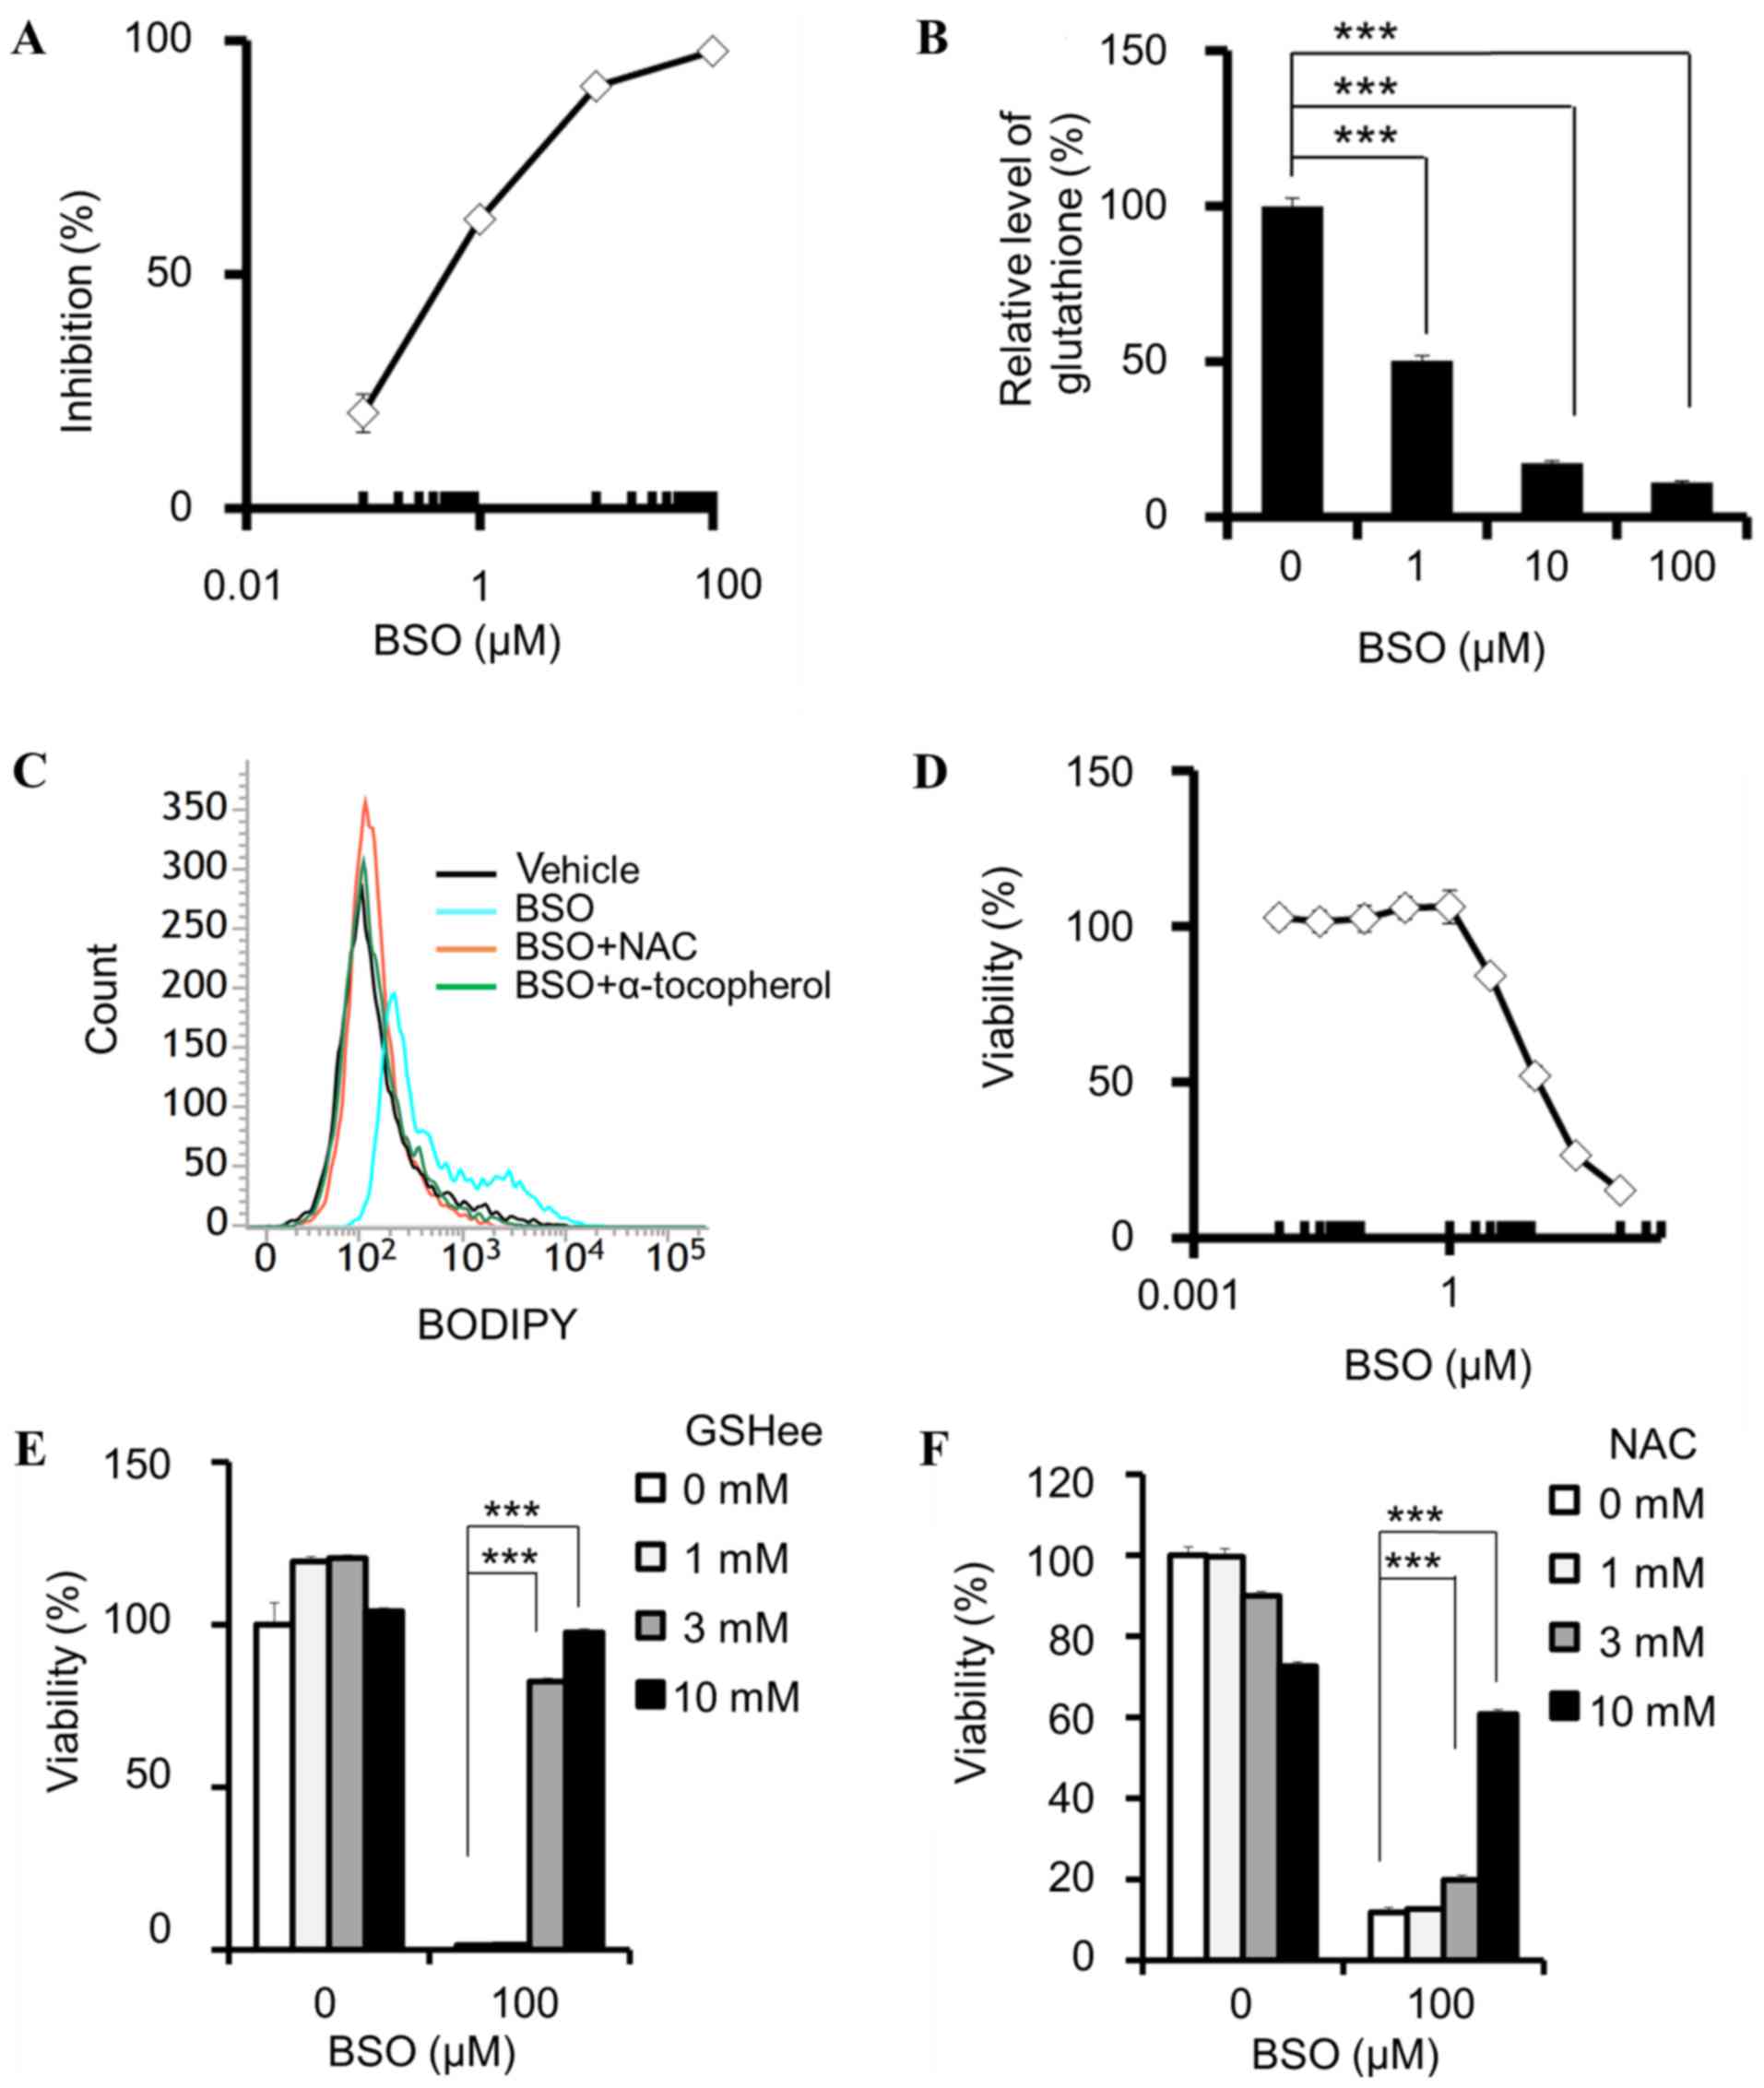 | Figure 1.BSO suppresses glutathione
biosynthesis and decreases cell viability. (A) Enzymatic inhibition
of GCL by BSO. (B-F) Cellular effects of BSO in PANC-1 cells. (B)
GSH+GSSG levels, normalized by cellular ATP, determined following
incubation with BSO for 24 h. (C) Induction of lipid peroxidation
by 100 µM BSO, and attenuation by 10 mM NAC and 100 µM
α-tocopherol. (D) BSO-induced decrease in cell viability, and
rescue effects of (E) GSHee and (F) NAC. (A, n=4 and D, n=3) Data
are presented as the mean ± SD. (B, E and F) Data are presented as
the mean ± SD (n=3); ***P<0.0005 using Williams' test. BSO,
buthionine sulfoximine; GCL, glutamate-cysteine ligase; GSH,
glutathione (reduced form); GSSG, glutathione disulphide; ATP,
adenosine triphosphate; NAC, N-acetylcysteine; GSHee, GSH monoethyl
ester; SD, standard deviation; BODIPY, boron dipyrromethene. |
BSO induces ferroptosis
GSH reduction has been identified to induce
ferroptosis, which can be reversed by ferrostatin-1 (11,12). In
the present study, the viability-reducing effect of BSO on PANC-1
cells was rescued by ferrostatin-1 (Fig.
2A), indicating that BSO induces ferroptosis in cancer cells.
In addition, ferroptosis is hypothesized to depend on intracellular
iron concentration (8); therefore,
the present study examined the effects of iron on BSO-induced
inhibition. FAC synergistically enhanced the BSO-induced inhibition
of PANC-1 (Fig. 2B) and HT-29
(Fig. 2C) cell viability. These
results indicate that the inhibitory effects of BSO are
iron-dependent. The BSO-induced inhibition of SW48 cell viability
was attenuated by NAC (Fig. 2D), but
not ferrostatin-1 (Fig. 2E).
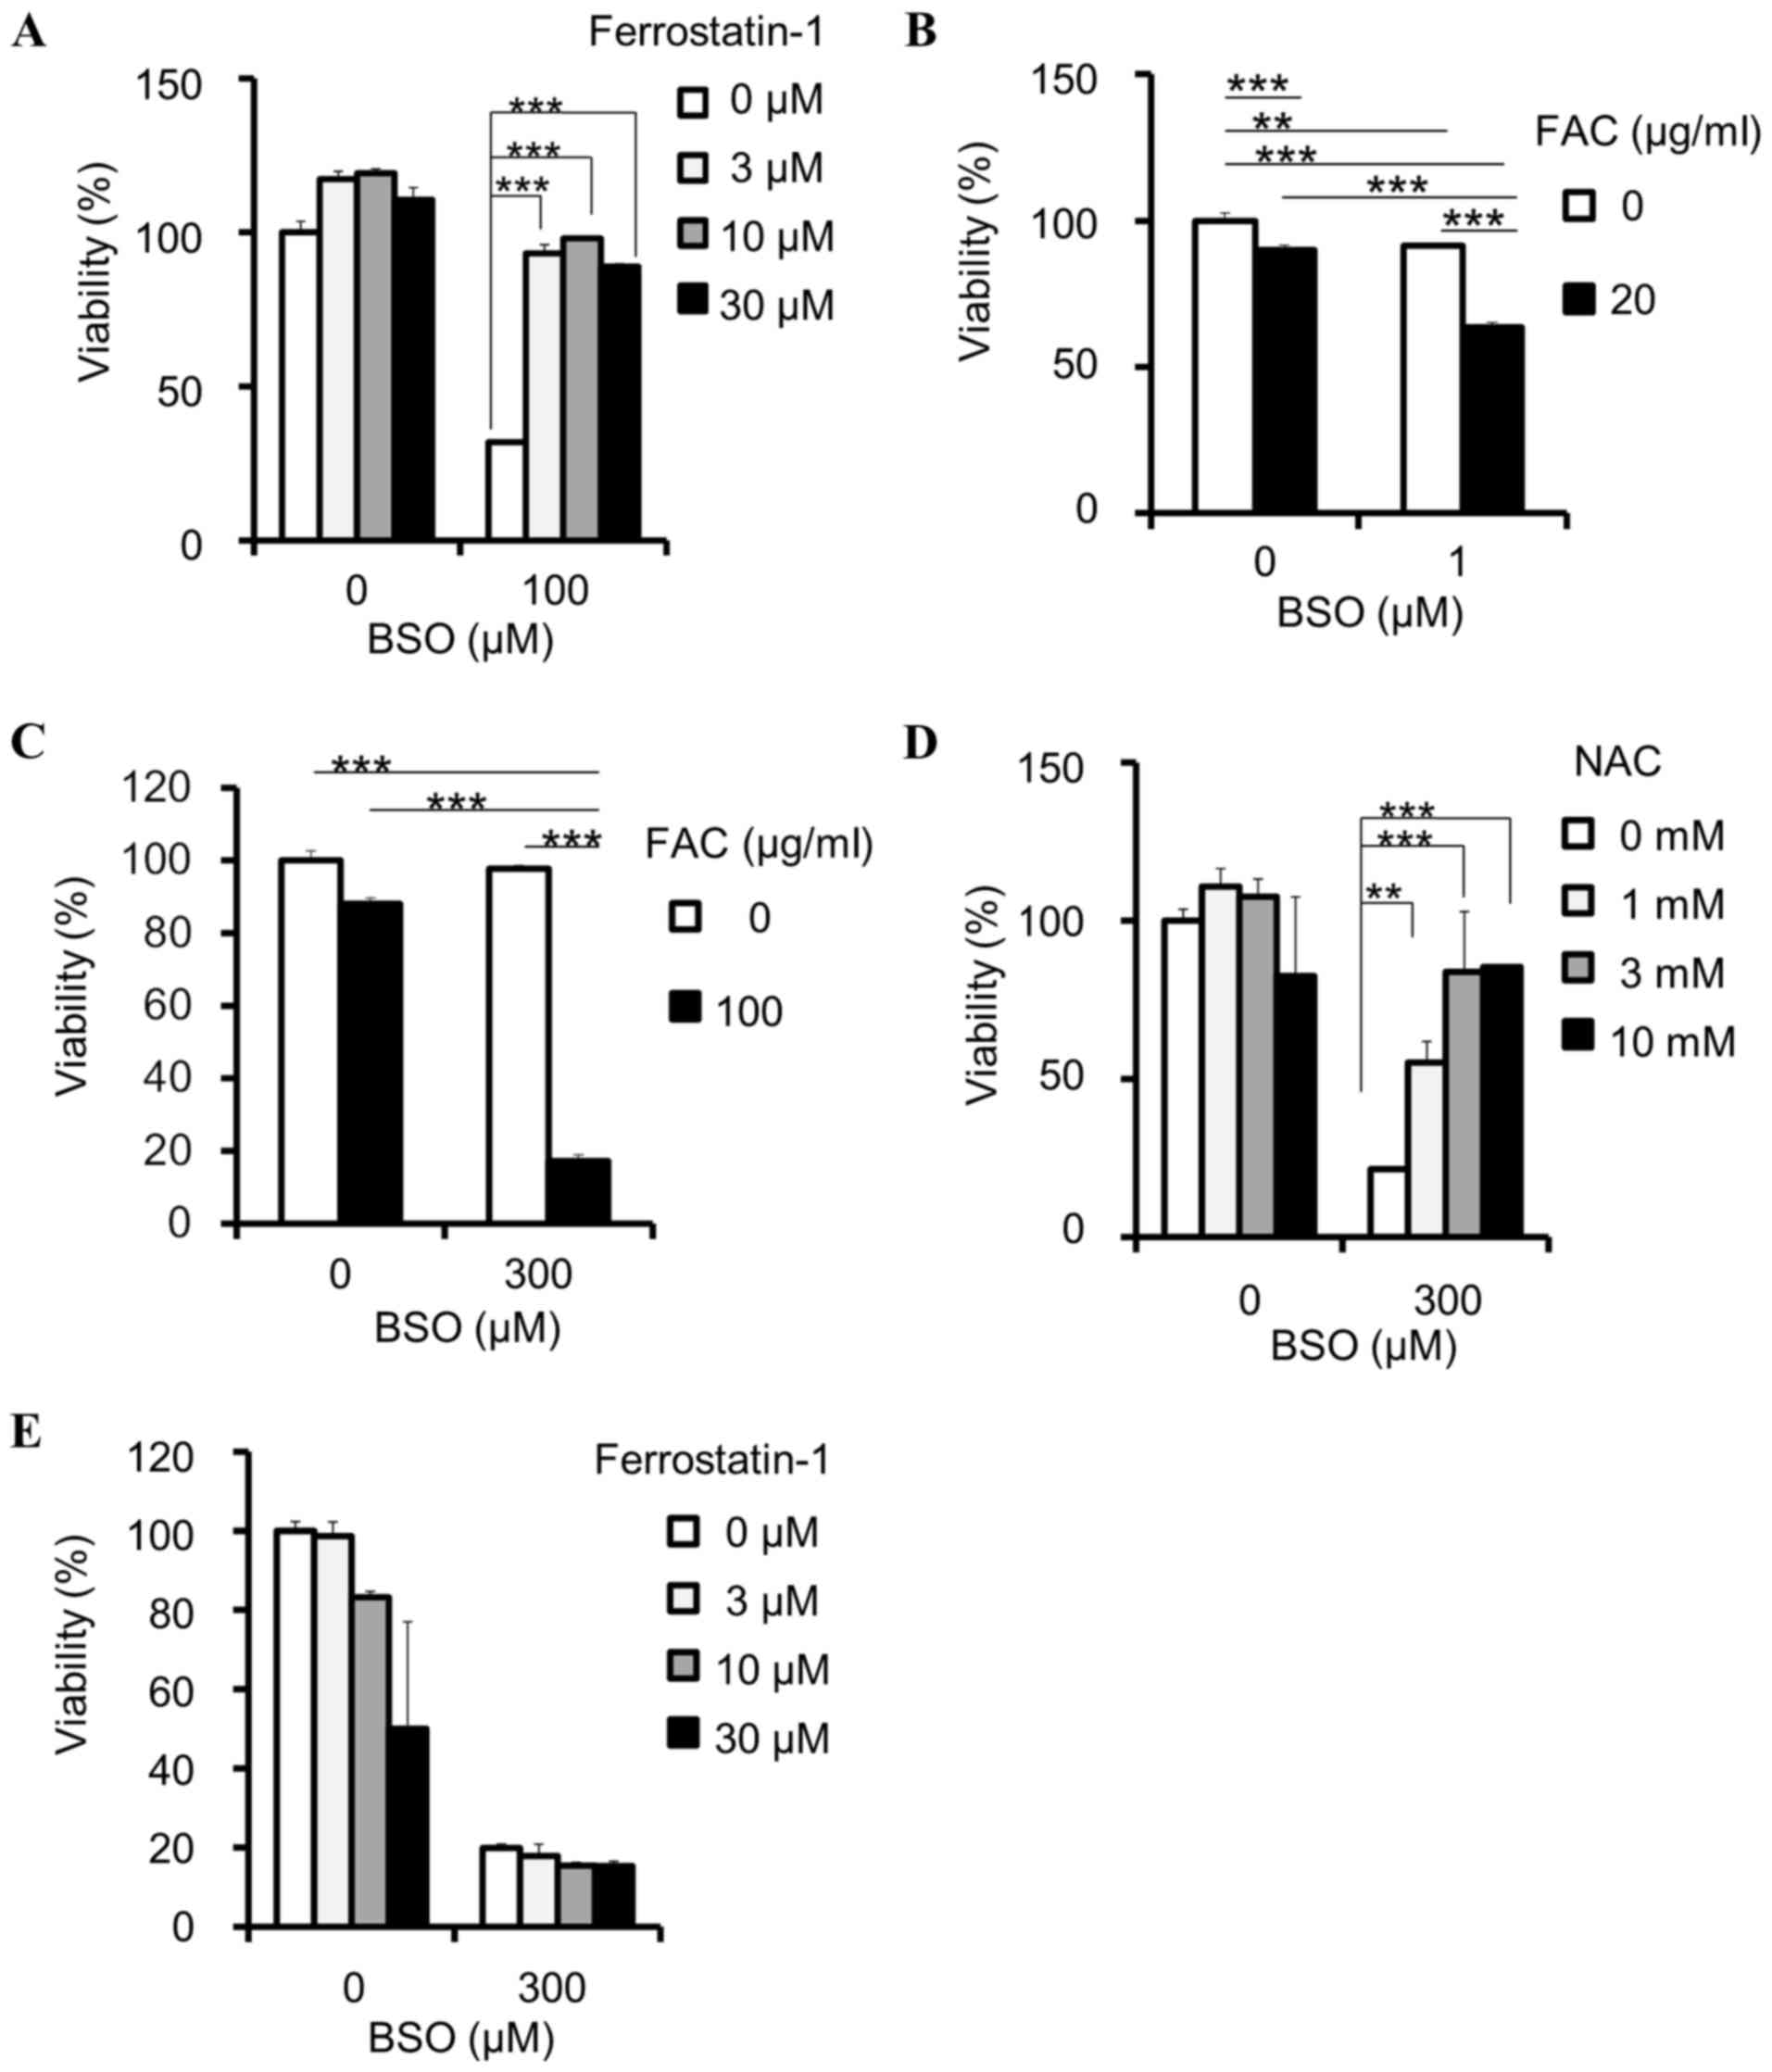 | Figure 2.BSO induces ferroptosis in cancer
cells. (A) Rescue effects of ferrostatin-1 against BSO-induced
decrease of cell viability in PANC-1 cell lines; ***P<0.0005
using Williams' test. (B) Effects of FAC on viability reduction by
BSO in PANC-1 cells, compared by two-way ANOVA: BSO and FAC
interaction, P<0.001, F=69.56; BSO, P<0.001, F=266.89; FAC,
P<0.001, F=312.01; Tukey's post hoc test, **P<0.01 and
***P<0.001. (C) Effects of FAC on viability reduction by BSO in
HT-29, compared by two-way ANOVA: BSO and FAC interaction,
P<0.001, F=157.96; BSO, P<0.001, F=179.84; FAC, P<0.001,
F=287.57; Tukey's post hoc test, ***P<0.001. Effects of (D) NAC
and (E) ferrostatin-1 on cell viability reduction by BSO in SW48
cells; **P<0.005 and ***P<0.0005 using Williams' test. Data
are presented as the mean ± standard deviation (n=3). BSO,
buthionine sulfoximine; FAC, ferric ammonium citrate; ANOVA,
analysis of variance; NAC, N-acetylcysteine. |
Sensitivity of cancer cell lines to
BSO
Cell panel viability assays were conducted, and
various colorectal, kidney, pancreatic and ovarian cancer cell
lines demonstrated high sensitivity to BSO (Table II). To examine whether the
glutathione levels may be a sensitivity marker for BSO, the
correlation between the basal levels of total glutathione
(GSH+GSSG) and sensitivity to BSO of cancer cells was investigated.
BSO-sensitive cells (G402, RCC4 VHL−/−, and
A-498) tended to exhibit lower glutathione levels (P=0.08) compared
with those of insensitive cells (RCC4 VHL+/+,
Caki-2, and HCT-116) (Fig. 3A). GCLC
inhibition suppresses cellular glutathione levels (Fig. 1B); therefore, the differences in
glutathione levels among cancer cells may be attributable to
different protein levels of enzymes in the GSH biosynthesis
pathway. The correlation between glutathione levels and the protein
levels of GCLC or GSS were examined, and it was identified that
GCLC protein and glutathione levels were positively correlated
(r2=0.814, P=0.04) in cancer cells (Fig. 3B and C). By contrast, GSS protein and
glutathione levels were not correlated (r2=0.021,
P=0.82; Fig. 3B and C).
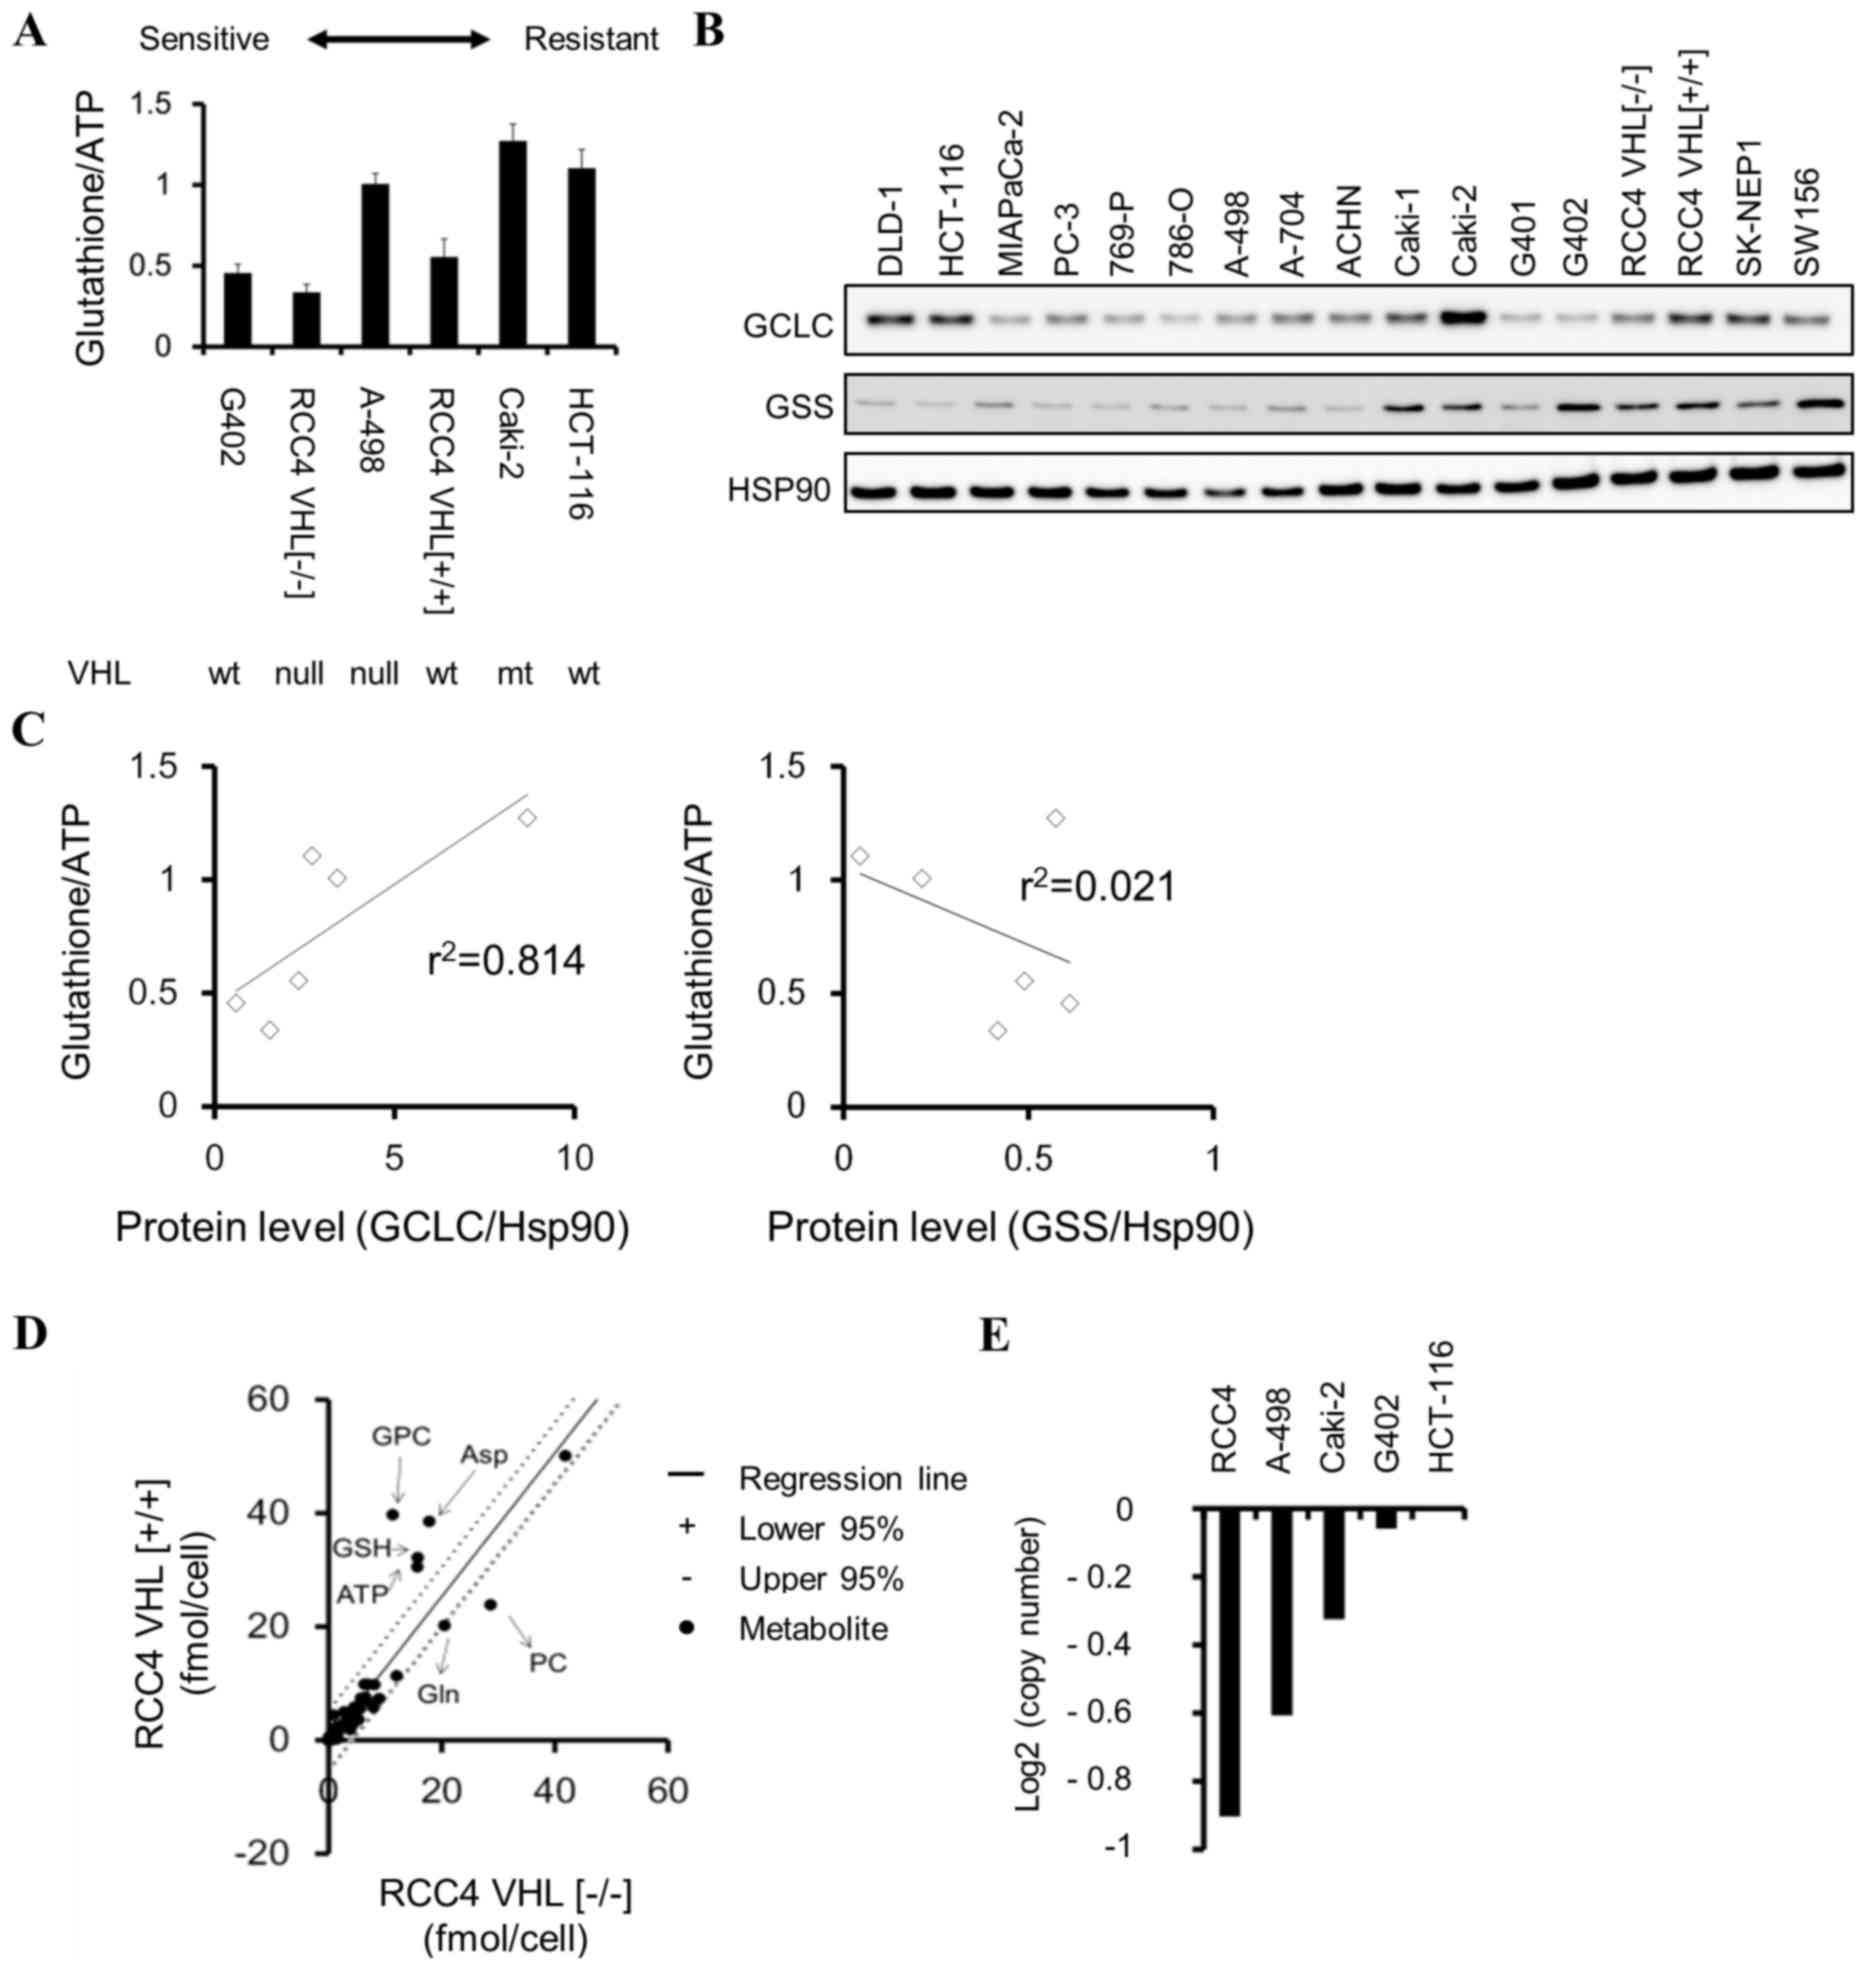 | Figure 3.Glutathione levels in cancer cells.
(A) Total glutathione (GSH + glutathione disulphide) levels,
normalized to cellular ATP levels, in various cancer cell lines.
Data are presented as the mean ± standard deviation (n=3). (B)
Western blot analysis of GCLC, GSS and Hsp90 across various cancer
cell lines. (C) Correlation between glutathione and GCLC or GSS
protein levels in HCT-116, A-498, Caki-2, G402, RCC4
VHL−/−, RCC4 VHL+/+.
Correlations were determined by linear regression analysis (P=0.04
for glutathione and GCLC; P=0.82 for glutathione and GSS). (D)
Metabolic differences between isogenic renal cell carcinoma RCC4
cell lines identified using 95% confidence interval bands of
regression analysis. (E) Copy number analysis of the VHL
gene in cancer cell lines using Cancer Cell Line Encyclopedia data.
GSH, glutathione (reduced form); ATP, adenosine triphosphate; GCLC,
glutamate-cysteine ligase catalytic subunit; GSS, GSH synthetase;
Hsp90, heat shock protein 90; VHL, von Hippel-Lindau tumor
suppressor; wt, wild-type; mt, mutant-type; PC, phosphorylcholine;
GPC, glycerophosphorylcholine; Asp, aspartic acid; Gln,
glutamine. |
| Table II.Sensitivity of cancer cell lines to
buthionine sulfoximine. |
Table II.
Sensitivity of cancer cell lines to
buthionine sulfoximine.
| Cell line | Organ | LogIC50
(M) |
|---|
| G402 | Kidney | −5.73 |
| PANC-1 | Pancreas | −5.33 |
| RCC4
VHL−/− | Kidney | −4.77 |
| 786-O | Kidney | −4.10 |
| A-498 | Kidney | −4.09 |
| A2780 CDDP | Ovary | −4.05 |
| SW48 | Colon | −4.04 |
| A2780 | Ovary | −3.81 |
| PC-3 | Prostate | >-3.5 |
| HCT-15 | Colon | >-3.5 |
| SW620 | Colon | >-3.5 |
| RCC4
VHL+/+ | Kidney | >-4.0 |
| COLO 205 | Colon | >-3.5 |
| LS 174T | Colon | >-3.5 |
| HCT-116 | Colon | >-3.5 |
| RKO | Colon | >-3.5 |
| HT-29 | Colon | >-3.5 |
| SW480 | Colon | >-3.5 |
| ACHN | Kidney | >-3.5 |
| Caki-2 | Kidney | >-4.0 |
| DU 145 | Prostate | >-3.5 |
RCC4 plus vector (RCC4 VHL−/−)
kidney cancer cells, which do not express VHL, were more
sensitive to BSO compared with isogenic RCC4 plus VHL [RCC4
VHL(+/+)] cells which do express VHL
(logIC50, −4.77 vs. −4.0 M, respectively; Table II). Total glutathione and GSH levels
were lower in RCC4 VHL−/− cells compared with
RCC4 VHL+/+ cells (Fig.
3A and D). The association between VHL status, BSO
sensitivity and glutathione levels was additionally investigated
using G402 (VHL wild-type), HCT-116 (VHL wild-type),
VHL-deficient A498 (Fig. 3E;
Table III) and VHL-mutant
Caki-2 cells. However, no clear correlation was observed between
the VHL status and sensitivity to BSO, or VHL status
and glutathione levels in these cancer cell lines (Table II; Fig.
3A).
| Table III.Mutational analysis of von
Hippel-Lindau tumor suppressor gene in cancer cell lines using
Catalog of Somatic Mutations in Cancer database. |
Table III.
Mutational analysis of von
Hippel-Lindau tumor suppressor gene in cancer cell lines using
Catalog of Somatic Mutations in Cancer database.
| Cell line | AA mutation | CDS mutation |
|---|
| A-498 | p.G144Fsa14 | c.426–429 del |
| G402 | – | – |
| HCT-116 | – | – |
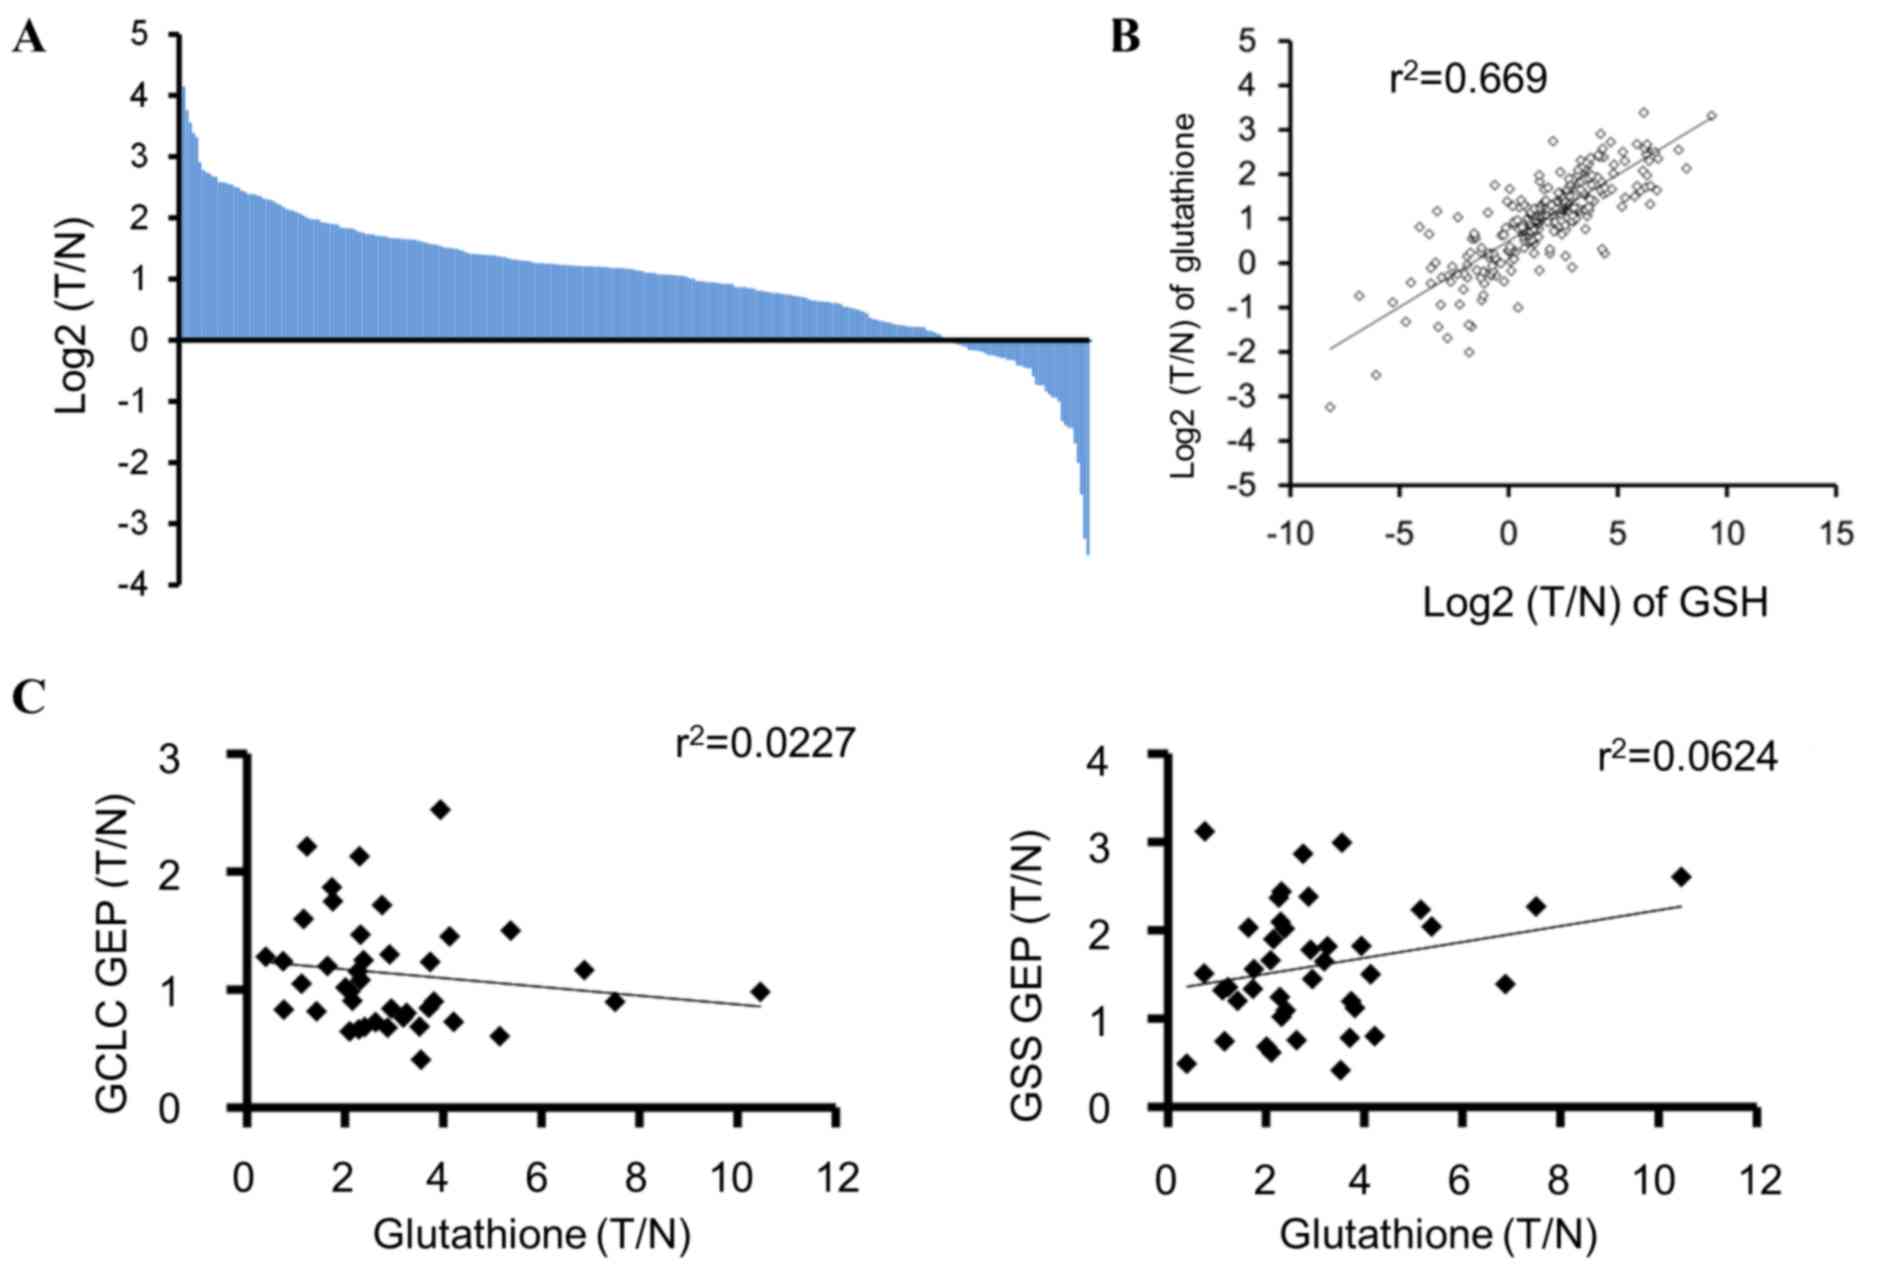
Glutathione levels in tumors from
patients with colorectal cancer
To examine the occurrence of tumors in patients with
low glutathione levels, the total glutathione and GSH levels in
tumors and their matched normal tissues from the patients with
colorectal cancer were measured. The glutathione level was
upregulated in the majority of tumors compared with that in the
matched normal tissues; however, ~15% (44/284) of the tumor samples
demonstrated lower glutathione levels compared with those of the
matched normal tissues (Fig. 4A).
Total glutathione and GSH levels were positively correlated
(r2=0.669, P=8.18×10−66; Fig. 4B). In addition, the correlation
between GCLC and GSS mRNA expression and glutathione levels was
examined in tumors from patients with colorectal cancer, and no
marked correlation was observed (Fig.
4C).
Discussion
In clinical trials, BSO has been shown to deplete
glutathione in tumors, but has not demonstrated substantial
therapeutic benefits (13,28). Thus, selecting sensitive cancer types
and patients using sensitivity markers may enhance the clinical
efficacy of anticancer therapies (29–31).
However, sensitive cancer types and sensitivity markers for GCLC
inhibitors remain incompletely characterized. Therefore, the
present study investigated potentially BSO-sensitive cancer cell
types and a sensitivity marker for GCLC inhibitors using BSO in
cultured cancer cells. In a cell viability assay, colorectal
(SW48), kidney (G402, RCC4 VHL−/− and 786-O),
pancreatic (PANC-1), and ovarian (A2780 CDDP) cancer cells
demonstrated sensitivity to BSO, suggesting that treatment with a
GCLC inhibitor may be beneficial for these cancer types. The
potential sensitivity of kidney cancer to GCLC inhibitors is
supported by the present study, in which, kidney cancer cell lines
were identified to be vulnerable to erastin (8). Subsequently, the association between
basal intracellular glutathione levels and cellular sensitivity to
BSO was investigated, and it was demonstrated that BSO-insensitive
cell lines tended to exhibit lower glutathione levels compared with
the sensitive cells. These results suggest that low glutathione
tumor levels may be a sensitivity marker for GCLC inhibitors.
Furthermore, the analysis of tumors and their
matched normal tissues from patients with colorectal cancer
revealed that 15% of colorectal cancers exhibited lower glutathione
tumor levels compared with those of the matched normal tissues.
These low-glutathione-content tumor populations may be useful for
examining the clinical benefits of GCLC inhibitors. Glutathione and
GSH levels were correlated, suggesting that glutathione may be
substituted with GSH. Furthermore, proton and carbon-13 nuclear
magnetic resonance has been suggested to be able to detect GSH
non-invasively (32). These
technologies may be applied during the selection of patients for
treatment with GCLC inhibitors. The differences in glutathione
levels between cancer cell types may be caused by differences in
GCLC protein levels. In the present study, protein levels of GCLC
and glutathione were correlated among G-402, RCC4
VHL−/−, A-498, RCC4 VHL+/+,
Caki-2, and HCT-116 cells. By contrast, patient tumor samples did
not demonstrate a significant correlation between glutathione and
GCLC mRNA expression, and differences between GCLC protein levels
and GCLC mRNA expression levels may explain this result; however,
additional studies are required to elucidate this.
In addition, VHL status was examined as a
potential regulator of glutathione levels. Although RCC4
VHL−/− cells demonstrated lower glutathione
levels compared with those of RCC4 VHL (+/+)
cells, this observation was consistent with the analyses of other
cancer cell lines. Therefore, VHL is not likely to be
correlated with glutathione levels. Other gene alterations may have
obscured the effects of VHL status and, therefore,
additional studies are required to clarify the association between
VHL status and sensitivity to GCLC inhibitors.
Ferroptosis is a newly-identified type of
ROS-induced cell death (8–10), which the cysteine-uptake inhibitor
erastin has been shown to induce (8–10).
However, whether the inhibition of enzymes involved in GSH
biosynthesis induces ferroptosis has not been fully determined.
This was addressed in the present study by inhibiting GCLC using
BSO, which subsequently induced the lipid peroxidation that is
required for ferroptosis (8). In
addition, the BSO-induced decrease in cell viability was attenuated
by a ferroptosis inhibitor, ferrostatin-1. Furthermore, ferroptosis
is dependent on cellular iron (8),
and treatment with iron enhanced the BSO-induced reduction in
viability of PANC-1 cells, indicating its dependence on iron. These
results demonstrated that the inhibition of GCLC by BSO induced
ferroptosis PANC-1 cells. Based on its iron-dependence, cancer with
high iron levels may be sensitive to GCLC inhibitors, and a
combination therapy with iron may enhance the anticancer effects of
GCLC inhibitors. By contrast, HT-29 cells demonstrated more marked
combination effects of BSO and iron, although they were less
sensitive to the treatment with BSO alone in comparison with PANC-1
cells. There may have been differences in the intracellular iron
concentration between PANC-1 and HT-29, which may have caused the
differences observed in their sensitivity to the treatment.
Additional studies are required to elucidate the mechanism
underlying the differences in sensitivity. Notably, in SW48 cells,
NAC exerted rescue effects whereas ferrostatin-1 did not,
indicating that BSO may induce cell death in this cell line by a
ferroptosis-independent mechanism. In conclusion, the present study
demonstrated that GCLC inhibition induces ferroptosis in cancer
cells, and low glutathione tumor levels may be used as a
sensitivity marker for GCLC inhibitors.
Acknowledgements
The authors would like to thank the following
employees of Takeda Pharmaceutical Company Limited: Mr. Shunsuke
Ebara for technical assistance, Dr Akito Kadotani and Mr. Shinichi
Matsumoto for performing the GCLC enzymatic assay, and Mr. Koji
Yamamoto for providing bioinformatics analysis.
Funding
Takeda Pharmaceutical Company Limited, Japan,
supported the present study. The present study was also supported
by funds from the AMED-CREST from the Japan Agency for Medical
Research and Development, AMED and research funds from the Yamagata
prefectural government and the City of Tsuruoka.
Availability of data and materials
The data sets generated and/or analyzed during the
present study are available from the corresponding author upon
reasonable request.
Authors' contributions
SN and TH conceived and designed the experiments.
SN, HA, YI, SK, AH and TS performed the experiments. All authors
analyzed the data. TS contributed reagents, materials and analysis
tools. SN drafted the manuscript. TH reviewed the manuscript. All
authors read, revised and approved the final version of the
manuscript.
Ethics approval and consent to
participate
All the experiments were conducted according to a
study protocol approved by the Institutional Ethics Committee of
Kagawa University (Heisei 24–040) upon obtaining informed consent
from all subjects.
Consent for publication
All the experiments were conducted according to a
study protocol approved by the Institutional Ethics Committee of
Kagawa University (Heisei 24–040) upon obtaining informed consent
from all subjects.
Competing interests
Mr. Satoru Nishizawa, Mr. Hideo Araki, Dr Yoshinori
Ishikawa, Mr. Satoshi Kitazawa, Mr. Akito Hata, and Dr Takahito
Hara are employees of Takeda Pharmaceutical Company Limited, Japan,
which supported the present study.
References
|
1
|
Warburg O: On the origin of cancer cells.
Science. 123:309–314. 1956. View Article : Google Scholar : PubMed/NCBI
|
|
2
|
Vander Heiden MG, Cantley LC and Thompson
CB: Understanding the Warburg effect: The metabolic requirements of
cell proliferation. Science. 324:1029–1033. 2009. View Article : Google Scholar : PubMed/NCBI
|
|
3
|
Cairns RA, Harris IS and Mak TW:
Regulation of cancer cell metabolism. Nat Rev Cancer. 11:85–95.
2011. View
Article : Google Scholar : PubMed/NCBI
|
|
4
|
Hakimi AA, Reznik E, Lee CH, Creighton CJ,
Brannon AR, Luna A, Aksoy BA, Liu EM, Shen R, Lee W, et al: An
integrated metabolic atlas of clear cell renal cell carcinoma.
Cancer Cell. 29:104–116. 2016. View Article : Google Scholar : PubMed/NCBI
|
|
5
|
Denkert C, Budczies J, Weichert W,
Wohlgemuth G, Scholz M, Kind T, Niesporek S, Noske A, Buckendahl A,
Dietel M and Fiehn O: Metabolite profiling of human colon
carcinoma-deregulation of TCA cycle and amino acid turnover. Mol
Cancer. 7:722008. View Article : Google Scholar : PubMed/NCBI
|
|
6
|
Wang H, Wang L, Zhang H, Deng P, Chen J,
Zhou B, Hu J, Zou J, Lu W, Xiang P, et al: ¹H NMR-based metabolic
profiling of human rectal cancer tissue. Mol Cancer. 12:1212013.
View Article : Google Scholar : PubMed/NCBI
|
|
7
|
Li B, Qiu B, Lee DS, Walton ZE, Ochocki
JD, Mathew LK, Mancuso A, Gade TP, Keith B, Nissim I and Simon MC:
Fructose-1,6-bisphosphatase opposes renal carcinoma progression.
Nature. 513:251–255. 2014. View Article : Google Scholar : PubMed/NCBI
|
|
8
|
Dixon SJ, Lemberg KM, Lamprecht MR, Skouta
R, Zaitsev EM, Gleason CE, Patel DN, Bauer AJ, Cantley AM, Yang WS,
et al: Ferroptosis: An iron-dependent form of nonapoptotic cell
death. Cell. 149:1060–1072. 2012. View Article : Google Scholar : PubMed/NCBI
|
|
9
|
Yang WS, SriRamaratnam R, Welsch ME,
Shimada K, Skouta R, Viswanathan VS, Cheah JH, Clemons PA, Shamji
AF, Clish CB, et al: Regulation of ferroptotic cancer cell death by
GPX4. Cell. 156:317–331. 2014. View Article : Google Scholar : PubMed/NCBI
|
|
10
|
Yang WS and Stockwell BR: Ferroptosis:
Death by lipid peroxidation. Trends Cell Biol. 26:165–176. 2016.
View Article : Google Scholar : PubMed/NCBI
|
|
11
|
Skouta R, Dixon SJ, Wang J, Dunn DE, Orman
M, Shimada K, Rosenberg PA, Lo DC, Weinberg JM, Linkermann A and
Stockwell BR: Ferrostatins inhibit oxidative lipid damage and cell
death in diverse disease models. J Am Chem Soc. 136:4551–4556.
2014. View Article : Google Scholar : PubMed/NCBI
|
|
12
|
Xie Y, Hou W, Song X, Yu Y, Huang J, Sun
X, Kang R and Tang D: Ferroptosis: Process and function. Cell Death
Differ. 23:369–379. 2016. View Article : Google Scholar : PubMed/NCBI
|
|
13
|
Lu SC: Glutathione synthesis. Biochim
Biophys Acta. 1830:3143–3153. 2013. View Article : Google Scholar : PubMed/NCBI
|
|
14
|
Bailey HH, Ripple G, Tutsch KD,
Arzoomanian RZ, Alberti D, Feierabend C, Mahvi D, Schink J, Pomplun
M, Mulcahy RT and Wilding G: Phase I study of continuous-infusion
L-S,R-buthionine sulfoximine with intravenous melphalan. J Natl
Cancer Inst. 89:1789–1796. 1997. View Article : Google Scholar : PubMed/NCBI
|
|
15
|
Sakamoto K, Adachi Y, Komoike Y, Kamada Y,
Koyama R, Fukuda Y, Kadotani A, Asami T and Sakamoto JI: Novel
DOCK2-selective inhibitory peptide that suppresses B-cell line
migration. Biochem Biophys Res Commun. 483:183–190. 2017.
View Article : Google Scholar : PubMed/NCBI
|
|
16
|
Winterbourn CC and Brennan SO:
Characterization of the oxidation products of the reaction between
reduced glutathione and hypochlorous acid. Biochem J. 326:87–92.
1997. View Article : Google Scholar : PubMed/NCBI
|
|
17
|
Winkler BS, DeSantis N and Solomon F:
Multiple NADPH-producing pathways control glutathione (GSH) content
in retina. Exp Eye Res. 43:829–847. 1986. View Article : Google Scholar : PubMed/NCBI
|
|
18
|
Patra KC and Hay N: The pentose phosphate
pathway and cancer. Trends Biochem Sci. 39:347–354. 2014.
View Article : Google Scholar : PubMed/NCBI
|
|
19
|
Muñoz-Pinedo C, El Mjiyad N and Ricci JE:
Cancer metabolism: Current perspectives and future directions. Cell
Death Dis. 3:e2482012. View Article : Google Scholar : PubMed/NCBI
|
|
20
|
Singh D, Arora R, Kaur P, Singh B, Mannan
R and Arora S: Overexpression of hypoxia-inducible factor and
metabolic pathways: Possible targets of cancer. Cell Biosci.
7:622017. View Article : Google Scholar : PubMed/NCBI
|
|
21
|
Courtnay R, Ngo DC, Malik N, Ververis K,
Tortorella SM and Karagiannis TC: Cancer metabolism and the Warburg
effect: The role of HIF-1 and PI3K. Mol Biol Rep. 42:841–851. 2015.
View Article : Google Scholar : PubMed/NCBI
|
|
22
|
Haase VH: The VHL tumor suppressor: Master
regulator of HIF. Curr Pharm Des. 15:3895–3903. 2009. View Article : Google Scholar : PubMed/NCBI
|
|
23
|
Satoh K, Yachida S, Sugimoto M, Oshima M,
Nakagawa T, Akamoto S, Tabata S, Saitoh K, Kato K, Sato S, et al:
Global metabolic reprogramming of colorectal cancer occurs at
adenoma stage and is induced by MYC. Proc Natl Acad Sci USA.
114:E7697–E7706. 2017. View Article : Google Scholar : PubMed/NCBI
|
|
24
|
Yuan M, Breitkopf SB, Yang X and Asara JM:
A positive/negative ion-switching, targeted mass spectrometry-based
metabolomics platform for bodily fluids, cells, and fresh and fixed
tissue. Nat Protoc. 7:872–881. 2012. View Article : Google Scholar : PubMed/NCBI
|
|
25
|
Soga T and Heiger DN: Amino acid analysis
by capillary electrophoresis electrospray ionization mass
spectrometry. Anal Chem. 72:1236–1241. 2000. View Article : Google Scholar : PubMed/NCBI
|
|
26
|
Soga T, Ohashi Y, Ueno Y, Naraoka H,
Tomita M and Nishioka T: Quantitative metabolome analysis using
capillary electrophoresis mass spectrometry. J Proteome Res.
2:488–494. 2003. View Article : Google Scholar : PubMed/NCBI
|
|
27
|
Soga T, Igarashi K, Ito C, Mizobuchi K,
Zimmermann HP and Tomita M: Metabolomic profiling of anionic
metabolites by capillary electrophoresis mass spectrometry. Anal
Chem. 81:6165–6174. 2009. View Article : Google Scholar : PubMed/NCBI
|
|
28
|
Bailey HH, Mulcahy RT, Tutsch KD,
Arzoomanian RZ, Alberti D, Tombes MB, Wilding G, Pomplun M and
Spriggs DR: Phase I clinical trial of intravenous L-buthionine
sulfoximine and melphalan: An attempt at modulation of glutathione.
J Clin Oncol. 12:194–205. 1994. View Article : Google Scholar : PubMed/NCBI
|
|
29
|
Mehta S, Shelling A, Muthukaruppan A,
Lasham A, Blenkiron C, Laking G and Print C: Predictive and
prognostic molecular markers for cancer medicine. Ther Adv Med
Oncol. 2:125–148. 2010. View Article : Google Scholar : PubMed/NCBI
|
|
30
|
Dienstmann R, Rodon J and Tabernero J:
Biomarker-driven patient selection for early clinical trials. Curr
Opin Oncol. 25:305–312. 2013.PubMed/NCBI
|
|
31
|
Schmidt KT, Chau CH, Price DK and Figg WD:
Precision oncology medicine: The clinical relevance of
patient-specific biomarkers used to optimize cancer treatment. J
Clin Pharmacol. 56:1484–1499. 2016. View Article : Google Scholar : PubMed/NCBI
|
|
32
|
Terpstra M, Vaughan TJ, Ugurbil K, Lim KO,
Schulz SC and Gruetter R: Validation of glutathione quantitation
from STEAM spectra against edited 1H NMR spectroscopy at 4T:
Application to schizophrenia. MAGMA. 18:276–282. 2005. View Article : Google Scholar : PubMed/NCBI
|