Introduction
Breast cancer is the most common malignancy in
females and remains a major cause of cancer-associated mortality
for females globally, particularly in less developed countries
(1). As of yet, the risk factors for
breast cancer remain uncertain, but have been indicated to be
associated with complex and heterogeneous processes involving
reproductive, hormonal and numerous other potential factors,
including being overweight, menopausal hormone therapy, physical
inactivity and alcohol intake (2,3). The
incidence rate of breast cancer remains at a relatively high level
(4). Despite improved diagnostics,
advanced surgical techniques and growing numbers of anticancer
drugs and targeted therapies that have largely improved the
clinical outcomes of breast cancer, the recurrence or metastasis
frequently occurs and the long-term survival of patients with
breast cancer is not optimistic (4–6);
therefore, it is necessary to further investigate the underling
mechanisms of initiation and development of breast cancer.
Furthermore, novel biomarkers that may serve as therapeutic targets
or prognostic indicators are also urgently required.
E2Fs are a group of transcription factors, including
≥10 members encoded by eight distinct genes (7). The majority of studies have divided E2Fs
into two subgroups: Transcriptional activators (E2F1-E2F3) and
repressors (E2F4-E2F8) based on their structures and functions
(7,8).
At present, E2Fs have been well characterized as central regulators
of cell cycle progression (9). During
G0 and early G1 phase, unphosphorylated pRB
binds to certain E2Fs and negatively regulates their
transcriptional activity (10).
Subsequently, cyclin-dependent kinase complexes mediating
phosphorylation of pRB in late G1 phase enable E2Fs to activate
target genes, resulting in DNA and protein synthesis that are
necessary for S-phase entry (10).
Furthermore, an increasing number of studies have revealed the
roles of E2Fs beyond simply participating in the regulation of the
cell cycle (11,12). Numerous other physiological processes,
including proliferation, apoptosis, DNA damage repair, senescence
and autophagy, which were known to be crucial for tumor
progression, have also been determined to heavily rely on the
involvement of E2Fs (11,12).
In human malignances, E2Fs are frequently
deregulated. Expression of E2F1 was reported to be elevated in lung
cancer, compared with normal tissues, and a high level of E2F1 was
significantly associated with a poorer prognosis (13,14). In
hepatocellular carcinoma (HCC), E2F1, E2F3, E2F4 and E2F8 are
overexpressed in tumor specimens (15–17).
Overexpression of E2F8 contributes to HCC cell proliferation via
promoting cells to entry into S-phase, which may be mediated by the
transcriptional effect of E2F8 on cyclin D1 (16). Previous studies have determined that
several E2Fs were upregulated in ovarian cancer, and high
expression levels of E2F4 and E2F7 were associated with an improved
prognosis, while E2F8 indicated a reduced overall survival (OS)
(18–20). Recent studies have also provided
evidence demonstrating that E2Fs family may act as promising
biomarkers in breast cancer (21–23). A
study based on 165 lymph node-negative breast carcinomas
demonstrated that patients with E2F1-positive tumors would exhibit
a reduced disease-free survival (DFS) or overall survival (OS) rate
than those with E2F1-negative tumors (21). Similarly, increased nuclear expression
of E2F4 demonstrated reduced survival outcomes for patients with
breast cancer (22). Fujiwara et
al (23) determined that E2F2
expression was associated with relapse-free survival (RFS)
rate.
Although these data indicated that E2Fs may serve as
reliable markers for breast cancer, the different expression
levels, various biological functions, detailed molecular mechanisms
and prognostic significance of the majority of E2Fs members remain
elusive. A comprehensive study of all eight E2F genes is
required.
Materials and methods
Oncomine database and the cancer
genome atlas (TCGA) data
Oncomine (http://www.oncomine.org), an online microarray
database, was utilized to examine the mRNA expression levels of
E2Fs in breast cancer. The thresholds were restricted as follows:
P-value=0.0001; fold-change=2; gene rank=10%; and data type, mRNA.
For each gene, comparison by cancer vs. normal analysis was
performed. Cancer type, fold change, Student's t-test value,
P-value and sample size were abstracted from comparisons with
statistical significance. Integrin mRNA HiSeq expression data of
TCGA were downloaded from the Cancer Genomics Browser of University
of California Santa Cruz (version 2015-02-24; https://genome-cancer.ucsc.edu/).
Kaplan-Meier database analysis
Kaplan-Meier plotter (KM plotter; http://kmplot.com/analysis/) (24) was used to determine the prognostic
values of E2Fs in breast cancer. KM plotter is an online database
containing microarray gene expression data and survival information
derived from Gene Expression Omnibus (https://www.ncbi.nlm.nih.gov/), European
Genome-Phenome Archive (https://ega.crg.eu/) and TCGA containing a total of
4,142 patients with breast cancer with survival data. For each gene
symbol, the desired probe ID was identified according to the file
of probe sets provided by KM plotter. Patients were divided into
high and low expression groups by median values of mRNA expression
level and survival analyses were performed without follow-up
restrictions. In brief, the desired probe IDs representing eight
genes were separately entered into the database to perform
Kaplan-Meier survival analysis for OS, RFS, distant metastasis-free
survival (DMFS) and post-progression survival (PPS) Kaplan-Meier
Plots, which were automatically generated by the database. Subgroup
analyses were performed via separating patients based on the
factors of expression of: Estrogen receptor (ER), progesterone
receptor (PR), human epidermal growth factor 2 (HER-2) and lymph
node status. Factors were defined as either positive or negative,
with the status information being included in the database. The
number of cases, hazard ratios (HRs), 95% confidence intervals
(CIs) and log rank P-values were obtained from the webpage of the
KM plotter.
Statistical analysis
An un-paired Student's t-test was performed to
examine the mRNA expression difference between tumor and normal
tissues from TCGA using SPSS 20.0 (IBM Corp., Armonk, NY, USA). The
boxplots were created using GraphPad software 5.0 (GraphPad
Software, Inc., La Jolla, CA, USA). Data are expressed as mean ±
standard error of the mean. P<0.05 was considered to indicate a
statistically significant significance.
Results
Expression levels of E2Fs in breast
cancer
The mRNA expression levels of E2Fs via cancer vs.
normal analysis were firstly investigated using the Oncomine
database, which contains publicly available microarray data from
multiple cancer types, including breast carcinoma. With the
following thresholds: P-value=0.0001; fold change=2; gene rank=10%,
E2F1 was determined to be overexpressed in breast cancer tissues,
compared with normal samples, according to datasets from TCGA and
Gluck et al (25). A total of
nine comparisons, including datasets from Curtis et al
(26), Gluck et al (25), TCGA, Zhao et al (27) and Richardson et al (28), revealed that the mRNA expression level
of E2F2 was higher in breast cancer samples than in healthy
controls. By contrast, the dataset by Radvanyi et al
(29) demonstrated a lower expression
level of E2F2 in breast cancer, but caution should be taken due to
the limited sample size, with only six normal controls against two
invasive lobular breast carcinomas. In datasets by Curtis et
al (26) and Richardson et
al (28), E2F3 was significantly
upregulated in breast cancer, compared with normal tissues.
However, all 13 datasets available for E2F4 indicated no expression
difference between tumor and normal groups. Based on datasets by
Richardson et al (28) and
TCGA, it was determined that the transcription levels of E2F5 in
ductal breast carcinoma and invasive breast carcinoma were higher
than in normal breast tissues. As for E2F6, there were seven
datasets in Oncomine, but none of these revealed a significant
statistical difference between tumor and normal samples. The mRNA
expression level of E2F7 was notably increased in breast cancer
when datasets by Richardson et al (28) and TCGA were analyzed. Similarly, the
mRNA expression level of E2F8 was increased in breast carcinomas,
compared with normal tissues in datasets by Gluck et al
(25) and TCGA. All of the results
are summarized in Table I.
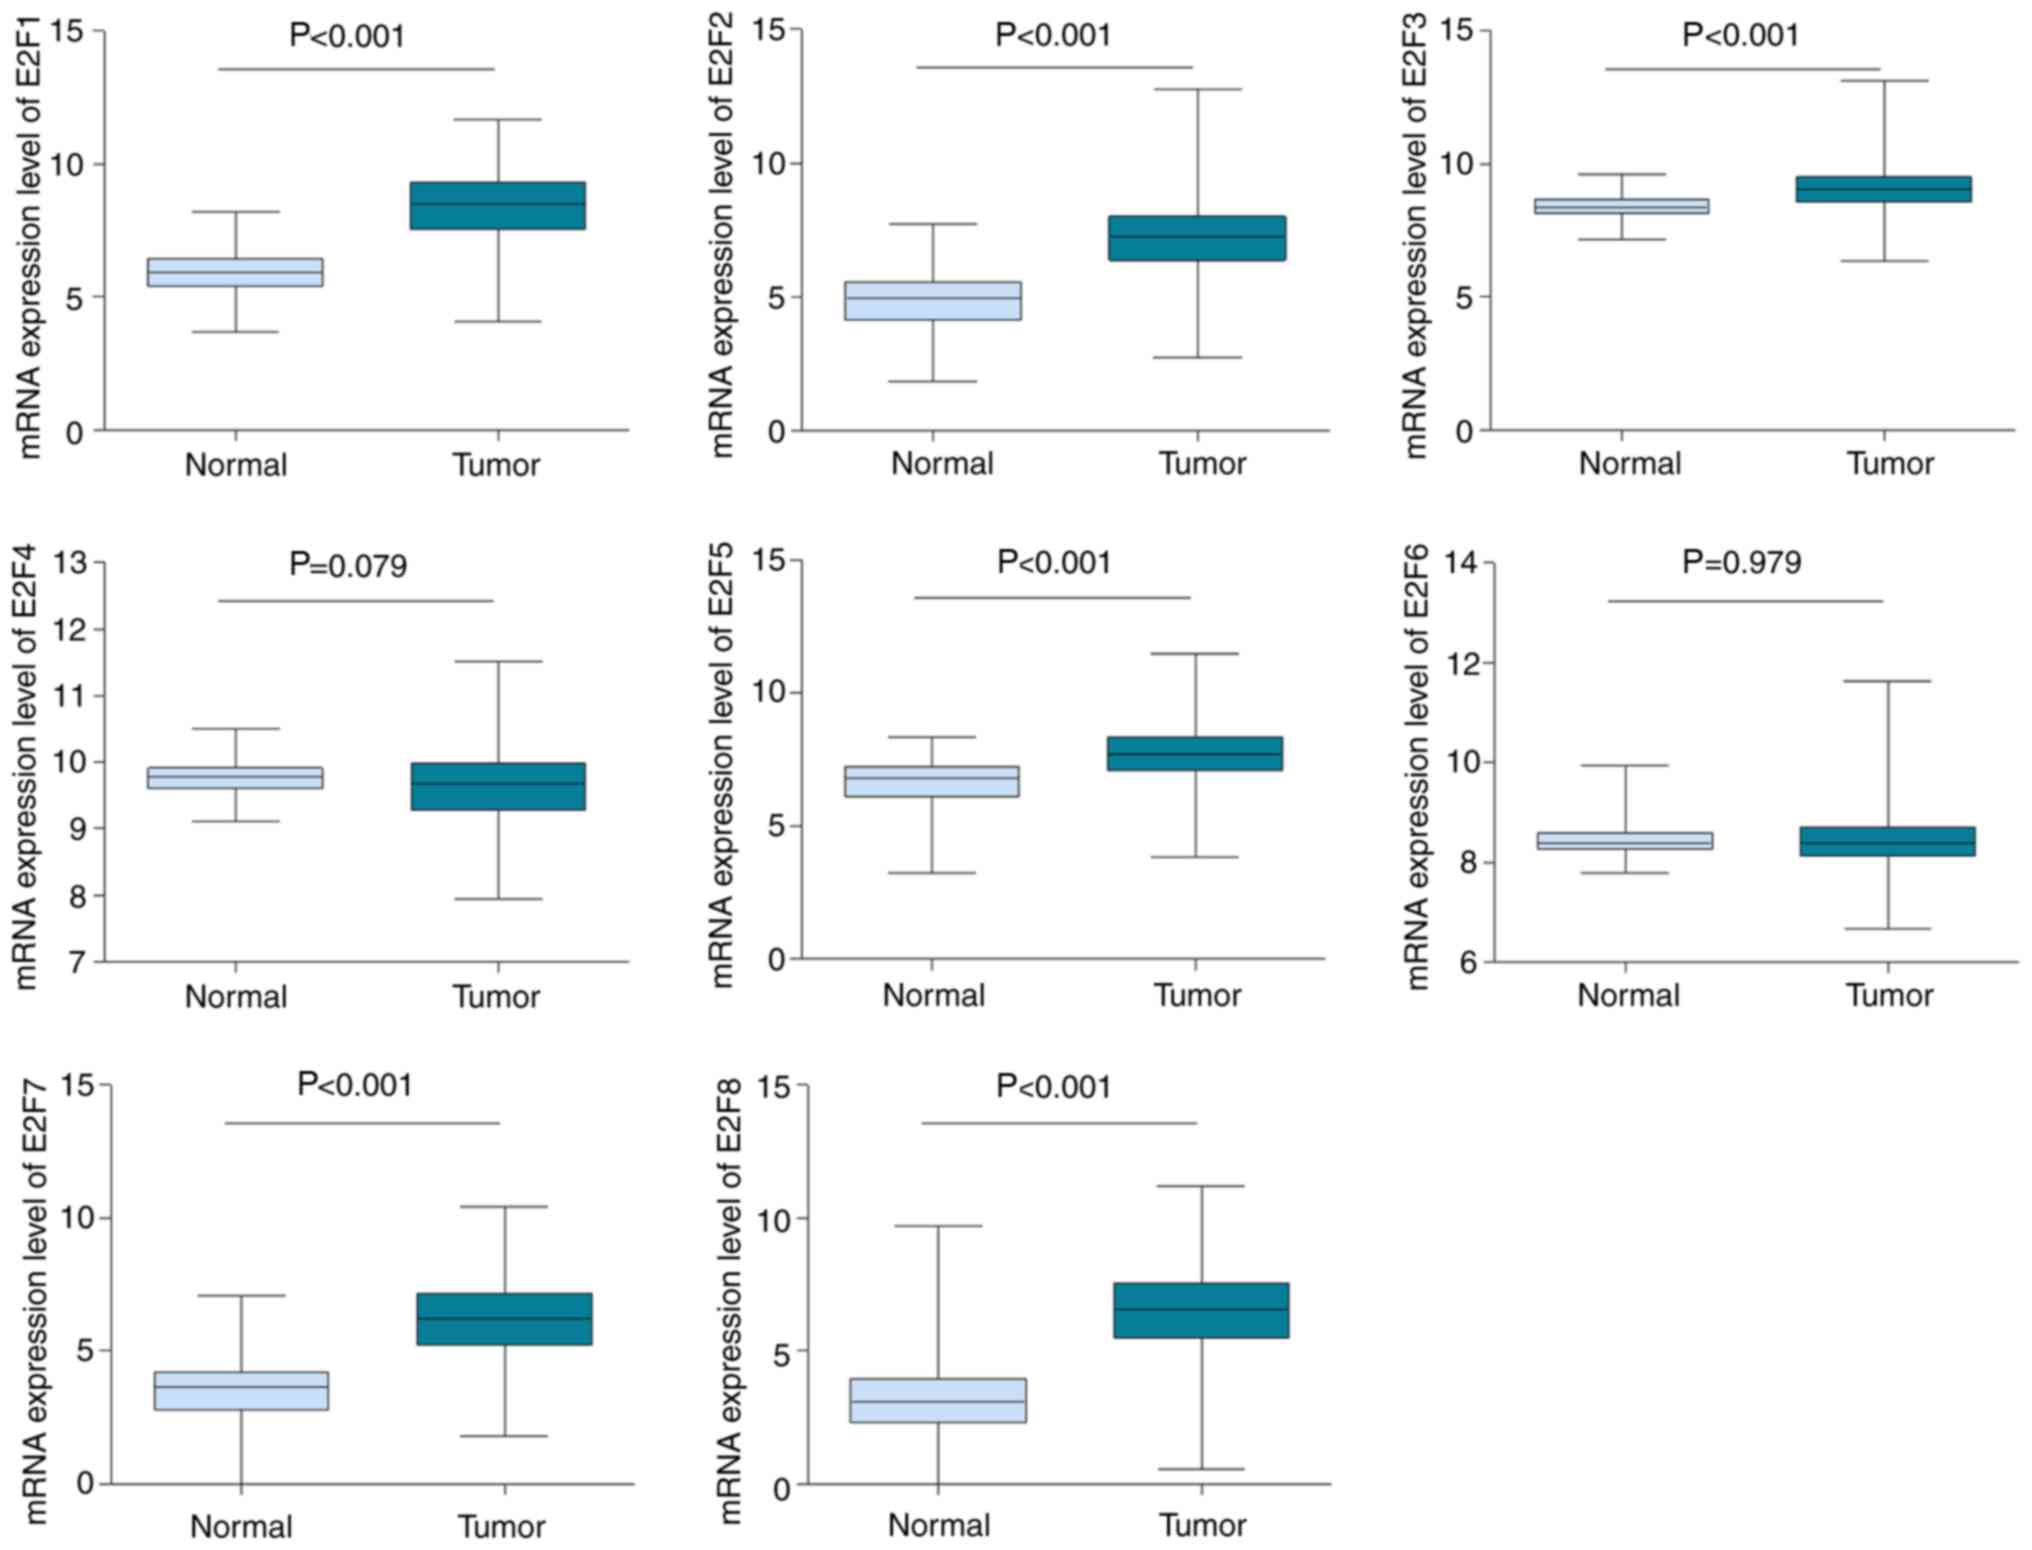
Furthermore, the mRNA HiSeq expression data involving 1,095 tumors
and 113 normal samples from TCGA database was utilized to further
investigate and confirm the expression difference of E2Fs in breast
cancer and normal tissue. As depicted in Fig. 1, consistent with the Oncomine data,
the mRNA expression levels of E2F1, E2F2, E2F3, E2F5, E2F7 and E2F8
were determined to be upregulated in breast cancer (P<0.001),
compared with normal tissues. There was no difference in
transcription levels of E2F4 and E2F6 between tumor tissues and
normal tissues (Fig. 1).
 | Table I.Analyses of E2Fs in breast
cancer. |
Table I.
Analyses of E2Fs in breast
cancer.
| Gene symbol | Dataset | Reporter | Normal (no. of
cases) | Tumor (no. of
cases) | Fold-change | T-value | P-value |
|---|
| E2F1 | TCGA Breast | A_23_P80032 | Breast (61) | Invasive breast
carcinoma (76) | 2.734 | 11.690 |
1.68×10⁻²² |
|
|
| A_23_P80032 | Breast (61) | Invasive ductal
breast carcinoma (389) | 3.216 | 18.607 |
4.37×10⁻³⁵ |
|
|
| A_23_P80032 | Breast (61) | Invasive lobular
breast carcinoma (36) | 2.088 | 6.425 |
1.56×10⁻⁸ |
|
| Gluck Breast | 26634 | Breast (4) | Invasive breast
carcinoma (154) | 2.545 | 10.681 |
2.29×10⁻⁵ |
| E2F2 | Curtis Breast | ILMN_1777233 | Breast (144) | Medullary breast
carcinoma (32) | 5.025 | 14.502 |
1.28×10⁻¹⁶ |
|
|
| ILMN_1777233 | Breast (144) | Invasive ductal
breast carcinoma (1,556) | 2.767 | 33.780 |
3.89×10−93 |
|
|
| ILMN_1777233 | Breast (144) | Invasive breast
carcinoma (21) | 2.315 | 6.844 |
3.56×10⁻⁷ |
|
| Gluck Breast | 20301 | Breast (4) | Invasive breast
carcinoma (154) | 2.637 | 11.788 |
7.06×10⁻⁷ |
|
| TCGA Breast | A_23_P408957 | Breast (61) | Invasive ductal
breast carcinoma (389) | 3.790 | 18.457 |
7.38×10⁻³⁵ |
|
|
| A_23_P408957 | Breast (61) | Invasive breast
carcinoma (76) | 3.094 | 11.308 |
1.62×10⁻²¹ |
|
|
| A_23_P408955 | Breast (61) | Invasive lobular
breast carcinoma (36) | 2.243 | 7.520 |
6.13×10⁻¹¹ |
|
| Zhao Breast | IMAGE: 293331 | Breast (3) | Invasive ductal
breast carcinoma (37) | 2.222 | 6.084 |
7.11×10⁻⁶ |
|
| Richardson Breast
2 | 228361_at | Breast (7) | Ductal breast
carcinoma (40) | 3.077 | 6.237 |
5.25×10⁻⁵ |
| E2F3 | Curtis Breast | ILMN_1669502 | Breast (144) | Medullary breast
carcinoma (32) | 2.522 | 11.118 |
2.89×10⁻¹³ |
|
| Richardson Breast
2 | 203692_s_at | Breast (7) | Ductal breast
carcinoma (40) | 3.558 | 8.624 |
9.00×10⁻⁹ |
| E2F4 | Not available |
|
|
|
|
|
|
| E2F5 | Richardson Breast
2 | 221586_s_at | Breast (7) | Ductal breast
carcinoma (40) | 2.573 | 6.253 |
9.00×10⁻⁸ |
|
| TCGA Breast | A_23_P31713 | Breast (61) | Invasive breast
carcinoma (76) | 2.077 | 7.228 |
1.75×10⁻¹¹ |
| E2F6 | Not available |
|
|
|
|
|
|
| E2F7 | Richardson Breast
2 | 228033_s_at | Breast (7) | Ductal breast
carcinoma (40) | 4.535 | 7.879 |
4.65×10⁻¹⁰ |
|
| TCGA Breast | A_23_P336178 | Breast (61) | Invasive breast
carcinoma (76) | 5.193 | 12.912 |
1.43×10⁻²⁵ |
|
|
| A_23_P336178 | Breast (61) | Invasive ductal
breast carcinoma (389) | 7.456 | 22.097 |
5.96×10−40 |
|
|
| A_23_P336178 | Breast (61) | Invasive lobular
breast carcinoma (36) | 4.262 | 9.860 |
8.61×10⁻¹⁵ |
| E2F8 | Gluck Breast | 20493 | Breast (4) | Invasive breast
carcinoma (154) | 2.489 | 13.421 |
4.37×10⁻⁶ |
|
| TCGA Breast | A_23_P35871 | Breast (61) | Invasive lobular
breast carcinoma (36) | 5.188 | 9.033 |
2.05×10⁻¹⁴ |
|
|
| A_23_P35871 | Breast (61) | Invasive breast
carcinoma (76) | 7.581 | 11.979 |
5.70×10⁻²³ |
|
|
|
NM_024680_1_1600 | Breast (61) | Invasive ductal
breast carcinoma (389) | 2.416 | 17.311 |
2.20×10⁻³⁴ |
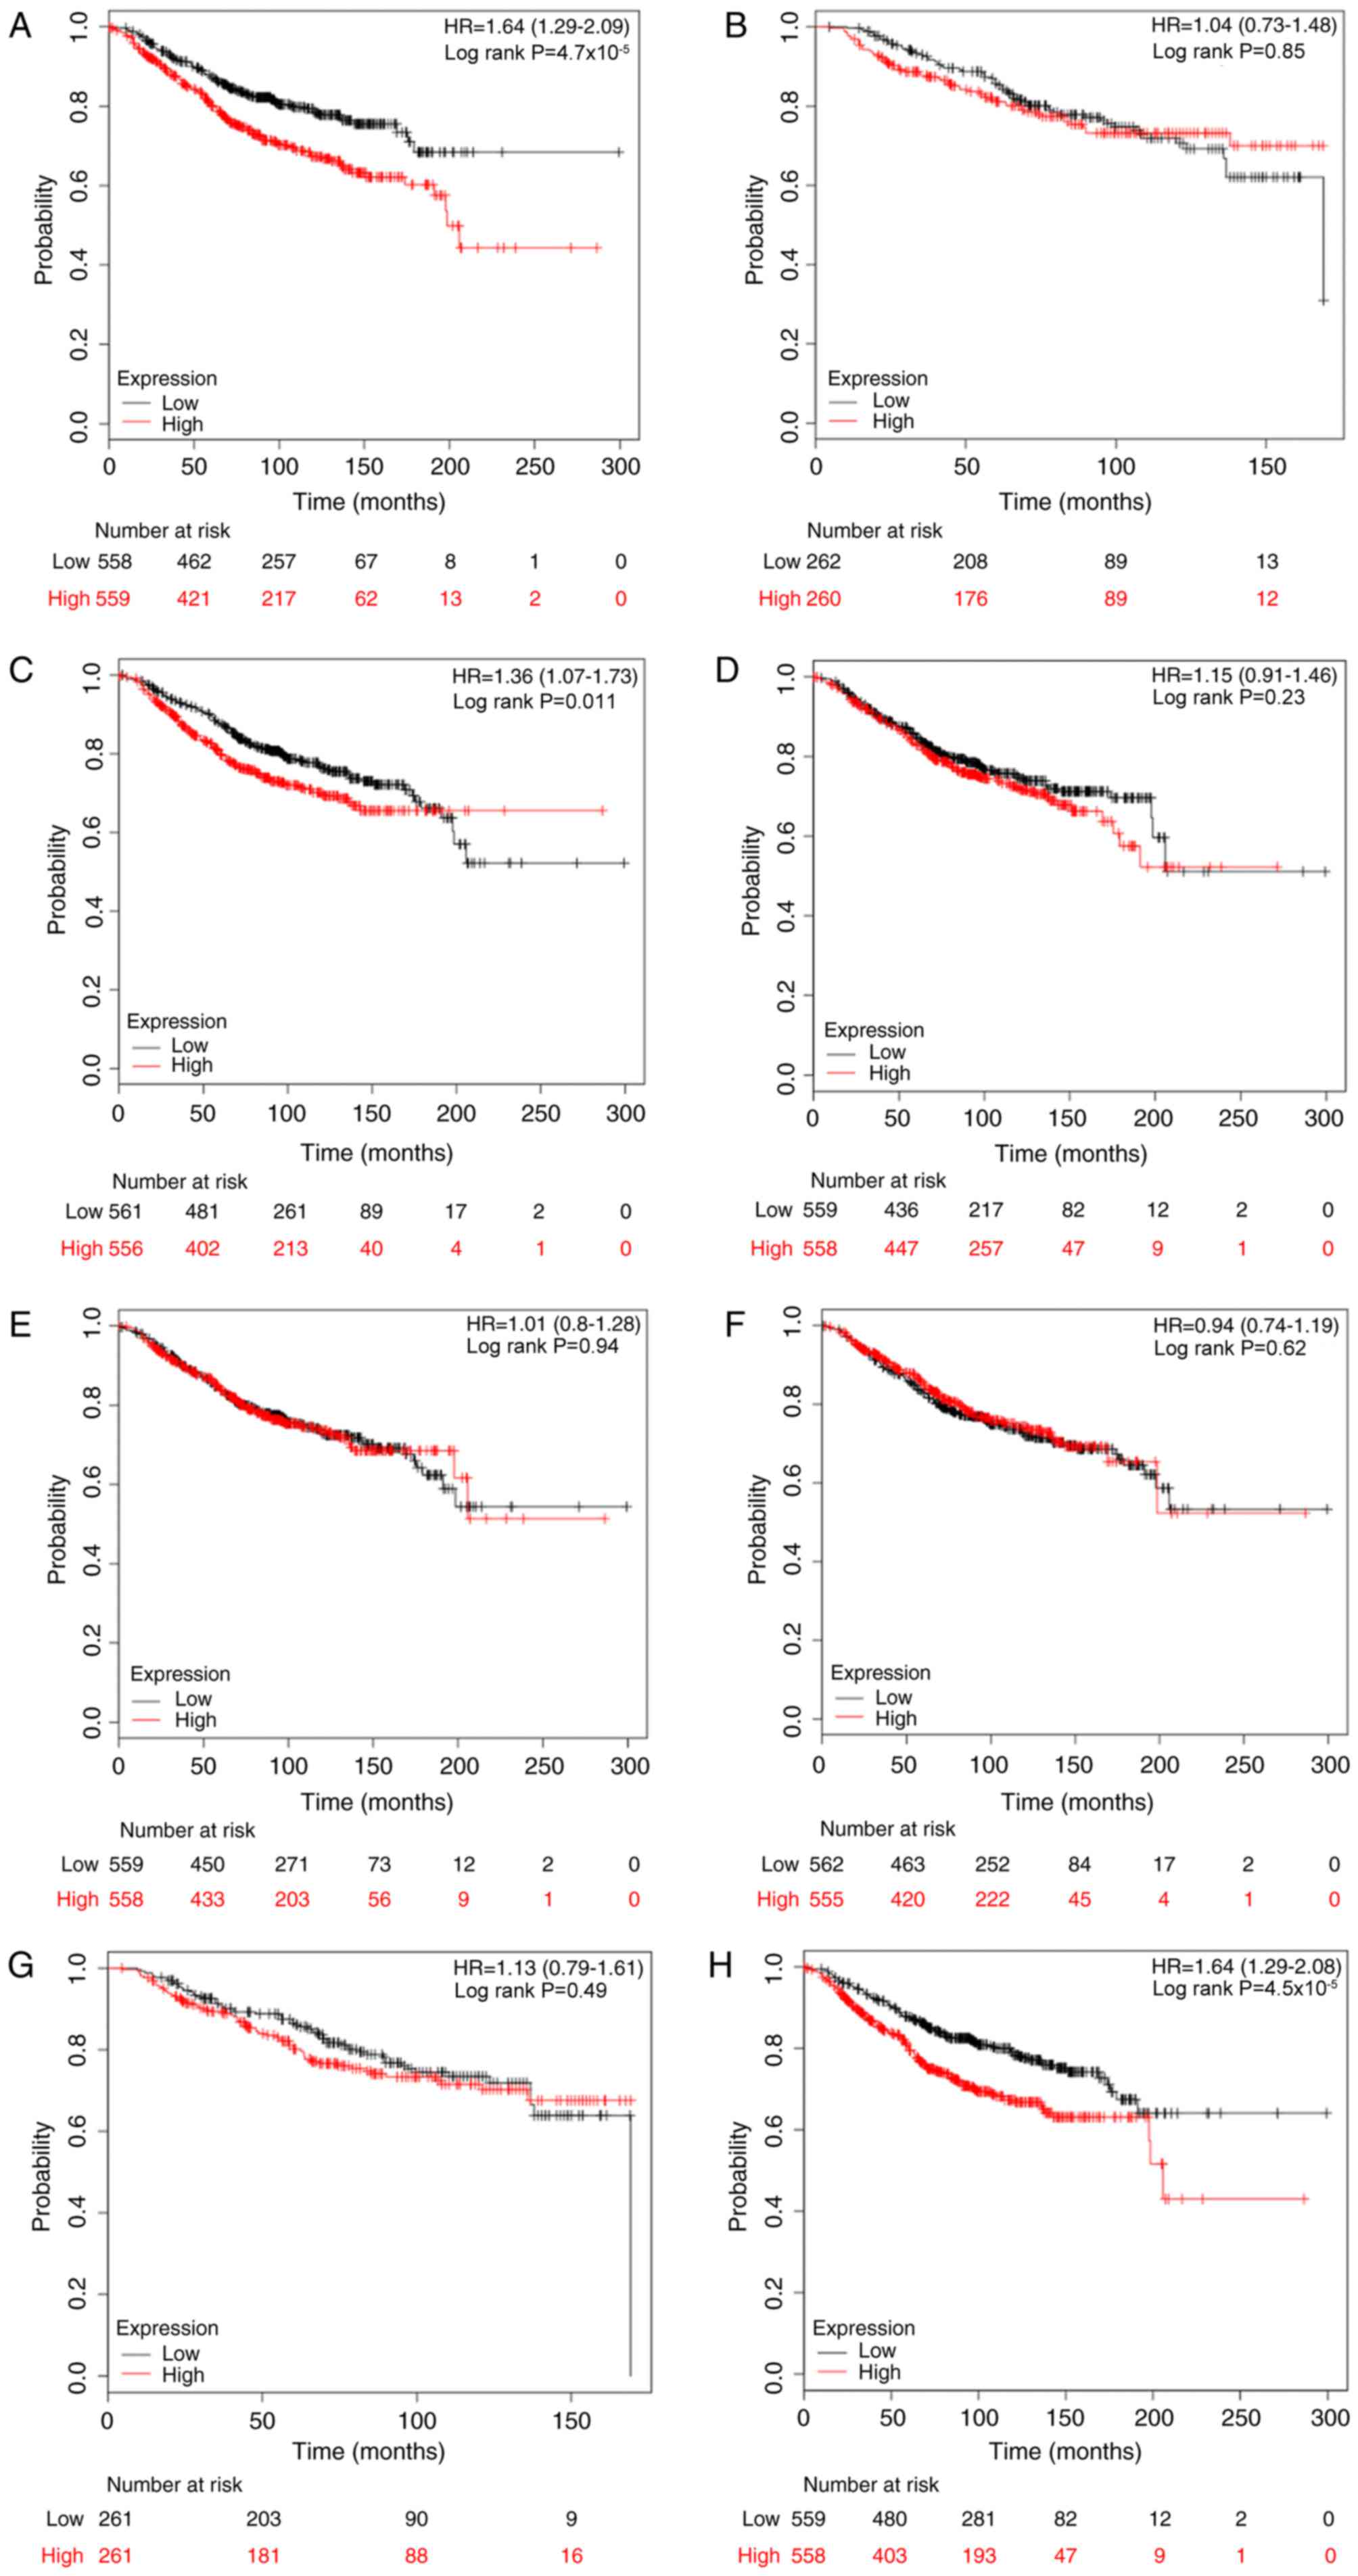
Association of the expression of E2Fs
and OS rates in patients with breast cancer
The association between E2Fs and OS rates was
determined using the KM plotter database. The desired Affymetrix
IDs were as follows: 204947_at, E2F1; 228361_at, E2F2; 203693_s_at,
E2F3; 202248_at, E2F4; 221586_s_at, E2F5; 203957_at, E2F6;
228033_at, E2F7; and 219990_at, E2F8. As depicted in Fig. 2, it was determined that high mRNA
expression of E2F1, E2F3 and E2F8 was significantly associated with
reduced OS rates for patients with breast cancer, with HR=1.64
(1.29–2.09) and P<0.001; HR=1.36 (1.07–1.73) and P=0.011; and
HR=1.64 (1.29–2.08) and P<0.001, compared with the low
expression group, respectively. However, as for the other five
members, E2F2 and E2F4-7, there was no clear association with OS
(Fig. 2).
Following this, the prognostic values of E2Fs were
examined in patients with breast cancer based on
clinicopathological features, including ER, PR, HER-2 and lymph
node status (Table II). The results
demonstrated that high expression of E2F1 (HR, 1.82; 95% CI,
1.18–2.81; P=0.006), E2F3 (HR, 1.92; 95% CI, 1.25–2.95; P=0.003)
and E2F8 (HR, 2.94; 95% CI, 1.87–4.63; P<0.001) indicated
reduced OS rates in ER-positive patients, but not in ER-negative
patients. Notably, high expression of E2F2, E2F5 and E2F6 were
determined to be significantly associated with improved OS rates in
ER-negative patients, with HR=0.29 (95% CI, 0.09–0.92) and P=0.025;
HR=0.39 (95% CI, 0.21–0.71) and P=0.001; HR=0.52 (95% CI,
0.29–0.94) and P=0.027, respectively. Since there were a limited
number of cases with PR information, analysis of the prognostic
significance of E2Fs stratifying by PR status in KM plotter was not
conducted. Although E2F1 and E2F5 were associated with OS in
HER-2-positive patients, the results should be treated with caution
due to a small sample size (n=28). Furthermore, increased E2F5
predicted an improved OS rate in lymph node-positive patients (HR,
0.60; 95% CI, 0.36–1.00; P=0.048), whilst E2F1 (HR, 2.15; 95% CI,
1.39–3.32; P<0.001) and E2F8 (HR, 2.14; 95% CI, 1.40–3.28;
P<0.001) were significantly associated with reduced OS rates in
lymph node-negative patients.
| Table II.The association between E2Fs and
overall survival for patients with breast cancer based on
clinicopathological features. |
Table II.
The association between E2Fs and
overall survival for patients with breast cancer based on
clinicopathological features.
|
|
| Positive
status | Negative
status |
|---|
|
|
|
|
|
|---|
| Clinicopathological
factor | Gene symbol | Cases | HR (95% CI) | P-value | Cases | HR (95% CI) | P-value |
|---|
| ER | E2F1 | 377 | 1.82
(1.18–2.81) | 0.006a | 142 | 0.83
(0.47–1.46) | 0.512 |
|
| E2F2 | 42 | 1.33
(0.36–5.00) | 0.669 | 45 | 0.29
(0.09–0.92) | 0.025a |
|
| E2F3 | 377 | 1.92
(1.25–2.95) | 0.003a | 142 | 0.77
(0.44–1.35) | 0.362 |
|
| E2F4 | 377 | 1.20
(0.79–1.82) | 0.403 | 142 | 0.68
(0.38–1.22) | 0.192 |
|
| E2F5 | 377 | 1.03
(0.68–1.56) | 0.897 | 142 | 0.39
(0.21–0.71) | 0.001a |
|
| E2F6 | 377 | 1.41
(0.93–2.15) | 0.107 | 142 | 0.52
(0.29–0.94) | 0.027a |
|
| E2F7 | 42 | 0.84
(0.23–3.15) | 0.801 | 45 | 0.74
(0.27–1.98) | 0.543 |
|
| E2F8 | 377 | 2.94
(1.87–4.63) |
<0.001a | 142 | 0.95
(0.54–1.67) | 0.866 |
| PR | N/A |
|
|
|
|
|
|
| HER-2 | E2F1 | 28 | 0.22
(0.06–0.81) | 0.013a | 62 | 1.04
(0.36–2.96) | 0.945 |
|
| E2F2 | 26 | 0.36
(0.10–1.39) | 0.125 | 62 | 1.38
(0.48–3.97) | 0.554 |
|
| E2F3 | 28 | 0.50
(0.16–1.55) | 0.221 | 62 | 0.68
(0.24–1.98) | 0.481 |
|
| E2F4 | 28 | 0.70
(0.22–2.18) | 0.534 | 62 | 1.39
(0.48–4.00) | 0.544 |
|
| E2F5 | 28 | 0.27
(0.08–0.88) | 0.020a | 62 | 0.39
(0.12–1.24) | 0.097 |
|
| E2F6 | 28 | 0.56
(0.18–1.78) | 0.320 | 62 | 0.53
(0.18–1.59) | 0.251 |
|
| E2F7 | 26 | 0.79
(0.24–2.61) | 0.704 | 62 | 1.02
(0.36–2.91) | 0.969 |
|
| E2F8 | 28 | 0.62
(0.20–1.91) | 0.404 | 62 | 1.02
(0.36–2.91) | 0.975 |
| Lymph node | E2F1 | 197 | 1.27
(0.77–2.11) | 0.342 | 425 | 2.15
(1.39–3.32) |
<0.001a |
|
| E2F2 | 118 | 0.77
(0.36–1.66) | 0.504 | 77 | 0.62
(0.19–2.07) | 0.433 |
|
| E2F3 | 197 | 1.34
(0.81–2.21) | 0.255 | 425 | 1.10
(0.73–1.66) | 0.655 |
|
| E2F4 | 197 | 1.39
(0.84–2.30) | 0.199 | 425 | 0.71
(0.47–1.08) | 0.107 |
|
| E2F5 | 197 | 0.60
(0.36–1.00) | 0.048a | 425 | 1.00
(0.66–1.51) | 0.995 |
|
| E2F6 | 197 | 0.63
(0.38–1.06) | 0.079 | 425 | 0.71
(0.46–1.09) | 0.112 |
|
| E2F7 | 118 | 0.84
(0.40–1.77) | 0.650 | 77 | 1.52
(0.48–4.78) | 0.474 |
|
| E2F8 | 197 | 0.78
(0.47–1.30) | 0.342 | 425 | 2.14
(1.40–3.28) |
<0.001a |
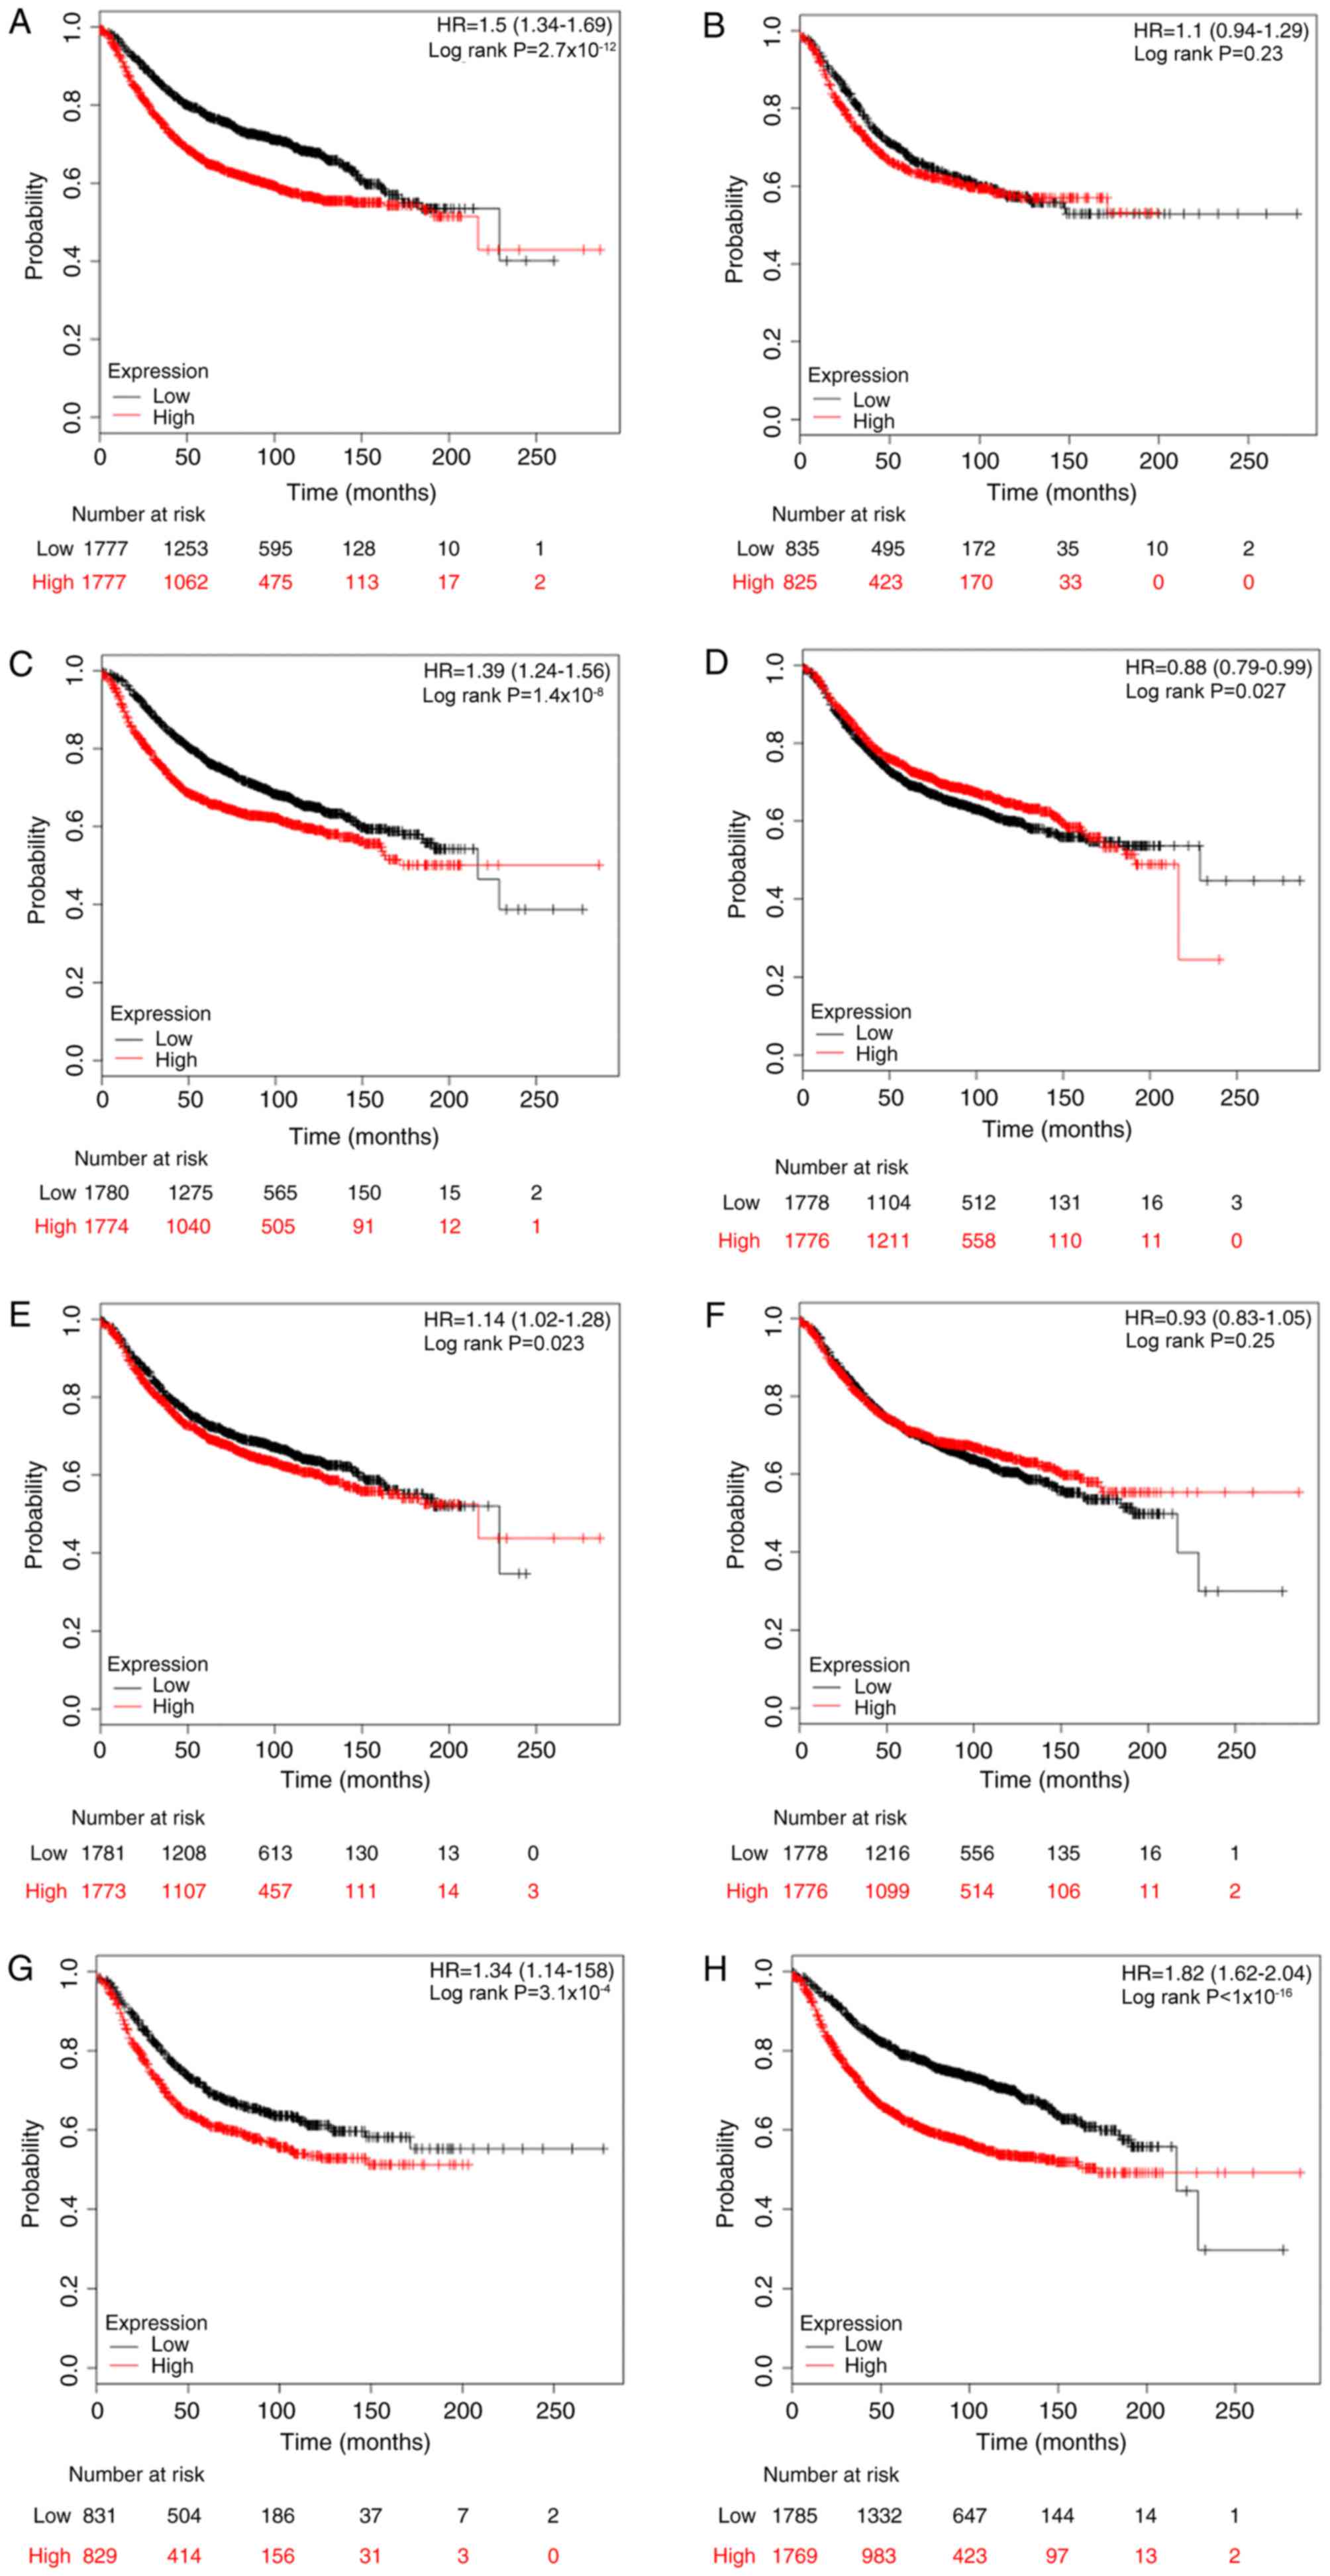
Association between E2F expression and
RFS rates in patients with breast cancer
The prognostic values of E2Fs for RFS rates were
then investigated using the KM plotter database, with the desired
Affymetrix IDs of each gene symbol. Kaplan-Meier analyses indicated
that high mRNA expression levels of E2F1, E2F3, E2F5, E2F7 and E2F8
were all significantly associated with reduced RFS rates (E2F1: HR,
1.50, 95% CI, 1.34–1.69, P<0.001; E2F3: HR, 1.39, 95% CI,
1.24–1.56, P<0.001; E2F5: HR, 1.14, 95% CI, 1.02–1.28, P=0.023;
E2F7: HR, 1.34, 95% CI, 1.14–1.58, P<0.001; and E2F8: HR, 1.82,
95% CI, 1.62–2.04, P<0.001), while E2F4 was associated with
improved RFS rates (HR, 0.88; 95% CI, 0.79–0.99; P=0.027). By
contrast, E2F2 and E2F6 were not associated with RFS rates. The
Kaplan-Meier curves are presented in Fig.
3.
When analyses were performed by stratifying patients
into subgroups based on the clinicopathological features, it was
determined that E2F1, E2F7 and E2F8 were significantly associated
with reduced RFS rates in patients with ER-positive breast cancer
(E2F1: HR, 1.49, 95% CI, 1.25–1.77, P<0.001; E2F7: HR, 1.50, 95%
CI, 1.09–2.05, P=0.011; and E2F8: HR, 1.75, 95% CI, 1.47–2.09,
P<0.001), but not in the ER-negative cohort (Table III). By contrast, high expression of
E2F5 and E2F6 predicted improved RFS rates in ER-negative patients
but not in ER-positive patients. With regards to PR status, E2F1,
E2F7 and E2F8 indicated a reduced RFS rate in PR-positive patients,
while E2F2 and E2F4 predicted a reduced RFS rate in the PR-negative
group (Table III). In the
HER-2-positive subgroup, only E2F2 was marginally associated with
RFS rate (HR, 0.57; 95% CI, 0.33–0.99; P=0.045). However, high
expression of E2F2 indicated an opposite association with RFS in
the HER-2-negative subgroup (HR, 1.80; 95% CI, 1.33–2.44;
P<0.001). In addition, E2F1, E2F3, E2F7 and E2F8 were also
significantly associated with reduced RFS rates in HER-2-negative
patients (Table III). E2F1, E2F3,
E2F7 and E2F8 were associated with reduced RFS rates in lymph
node-positive and HER-2-negative patients (Table III). E2F2 was determined to be
associated with reduced RFS rates in the lymph node-positive
subgroup (HR, 1.52; 95% CI, 1.16–2.00; P=0.003).
| Table III.The association between E2Fs and
relapse-free survival for patients with breast cancer based on
clinicopathological features. |
Table III.
The association between E2Fs and
relapse-free survival for patients with breast cancer based on
clinicopathological features.
|
|
| Positive
status | Negative
status |
|---|
|
|
|
|
|
|---|
| Clinicopathological
factor | Gene symbol | Cases | HR (95% CI) | P-value | Cases | HR (95% CI) | P-value |
|---|
| ER | E2F1 | 1802 | 1.49
(1.25–1.77) |
<0.001a | 671 | 1.13
(0.88–1.44) | 0.332 |
|
| E2F2 | 695 | 1.35
(0.99–1.85) | 0.056 | 313 | 0.99
(0.69–1.41) | 0.941 |
|
| E2F3 | 1802 | 1.18
(0.99–1.40) | 0.060 | 671 | 0.91
(0.71–1.17) | 0.461 |
|
| E2F4 | 1802 | 1.14
(0.96–1.36) | 0.131 | 671 | 1.05
(0.82–1.35) | 0.674 |
|
| E2F5 | 1802 | 1.13
(0.95–1.34) | 0.174 | 671 | 0.75
(0.58–0.96) | 0.021a |
|
| E2F6 | 1802 | 1.19
(1.00–1.41) | 0.052 | 671 | 0.75
(0.58–0.96) | 0.021a |
|
| E2F7 | 695 | 1.50
(1.09–2.05) | 0.011a | 313 | 1.14
(0.79–1.62) | 0.487 |
|
| E2F8 | 1802 | 1.75
(1.47–2.09) |
<0.001a | 671 | 1.16
(0.91–1.49) | 0.227 |
| PR | E2F1 | 525 | 1.84
(1.27–2.68) | 0.001a | 483 | 1.10
(0.81–1.49) | 0.550 |
|
| E2F2 | 489 | 1.34
(0.92–1.96) | 0.130 | 372 | 1.44
(1.00–2.05) | 0.046a |
|
| E2F3 | 525 | 1.21
(0.85–1.74) | 0.292 | 483 | 1.05
(0.77–1.43) | 0.756 |
|
| E2F4 | 525 | 1.24
(0.86–1.78) | 0.243 | 483 | 1.57
(1.15–2.14) | 0.004a |
|
| E2F5 | 525 | 1.20
(0.83–1.71) | 0.329 | 483 | 1.09
(0.80–1.48) | 0.581 |
|
| E2F6 | 525 | 1.05
(0.73–1.51) | 0.777 | 483 | 0.79
(0.58–1.08) | 0.142 |
|
| E2F7 | 489 | 1.66
(1.13–2.44) | 0.010a | 372 | 1.02
(0.71–1.45) | 0.930 |
|
| E2F8 | 525 | 2.04
(1.40–2.96) |
<0.001a | 483 | 1.12
(0.82–1.52) | 0.482 |
| HER-2 | E2F1 | 168 | 1.09
(0.65–1.84) | 0.737 | 756 | 1.61
(1.23–2.10) |
<0.001a |
|
| E2F2 | 150 | 0.57
(0.33–0.99) | 0.045a | 635 | 1.80
(1.33–2.44) |
<0.001a |
|
| E2F3 | 168 | 1.03
(0.61–1.72) | 0.925 | 756 | 1.50
(1.15–1.96) | 0.003a |
|
| E2F4 | 168 | 1.09
(0.65–1.84) | 0.736 | 756 | 1.25
(0.96–1.63) | 0.099 |
|
| E2F5 | 168 | 0.67
(0.40–1.14) | 0.137 | 756 | 1.17
(0.90–1.52) | 0.253 |
|
| E2F6 | 168 | 0.82
(0.48–1.38) | 0.453 | 756 | 1.09
(0.84–1.42) | 0.505 |
|
| E2F7 | 150 | 0.79
(0.46–1.36) | 0.396 | 635 | 2.02
(1.48–2.74) |
<0.001a |
|
| E2F8 | 168 | 0.96
(0.57–1.62) | 0.883 | 756 | 1.84
(1.41–2.42) |
<0.001a |
| Lymph node | E2F1 | 945 | 1.44
(1.16–1.80) | 0.001a | 1813 | 1.60
(1.34–1.91) |
<0.001a |
|
| E2F2 | 665 | 1.52
(1.16–2.00) | 0.003a | 451 | 1.40
(0.93–2.10) | 0.107 |
|
| E2F3 | 945 | 1.33
(1.07–1.66) | 0.011a | 1813 | 1.47
(1.23–1.75) |
<0.001a |
|
| E2F4 | 945 | 1.23
(0.99–1.54) | 0.061 | 1813 | 1.11
(0.93–1.32) | 0.253 |
|
| E2F5 | 945 | 1.11
(0.89–1.38) | 0.349 | 1813 | 1.09
(0.91–1.29) | 0.343 |
|
| E2F6 | 945 | 1.06
(0.85–1.32) | 0.600 | 1813 | 0.95
(0.80–1.13) | 0.558 |
|
| E2F7 | 665 | 1.33
(1.01–1.74) | 0.041a | 451 | 1.89
(1.25–2.86) | 0.002a |
|
| E2F8 | 945 | 1.53
(1.22–1.90) |
<0.001a | 1813 | 1.73
(1.45–2.07) |
<0.001a |
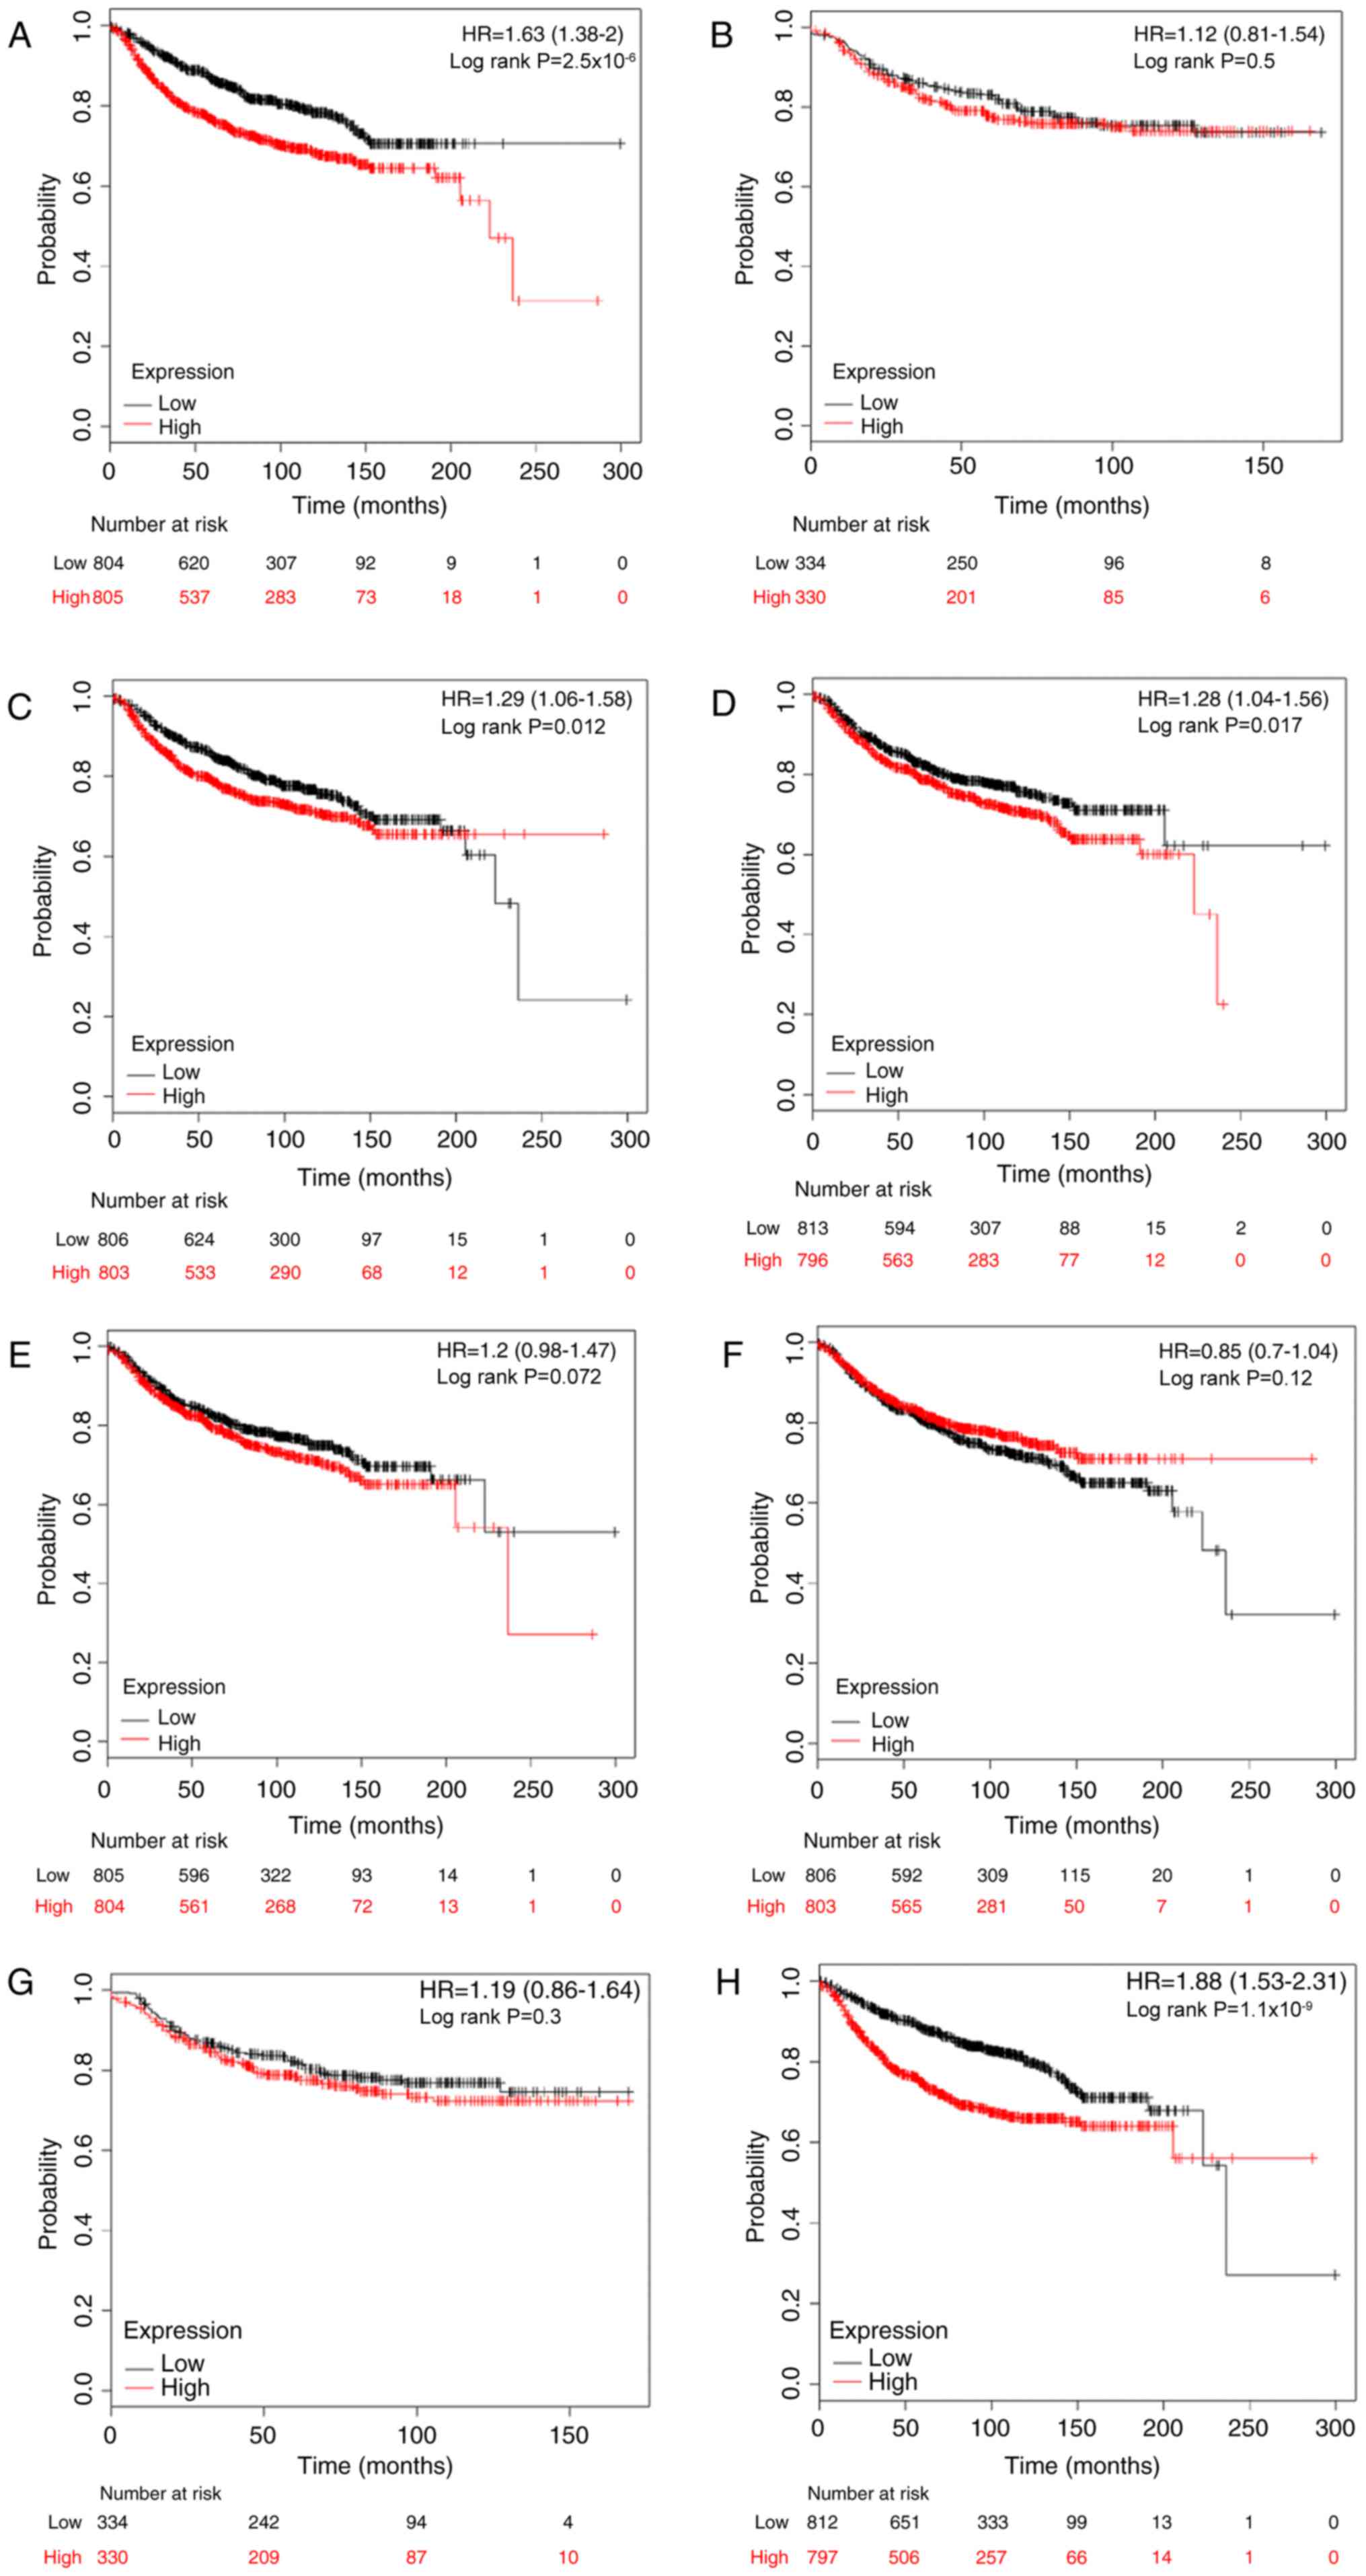
Association between E2F expression and
DMFS rates in patients with breast cancer
Metastasis is the most common cause of mortality in
breast cancer, and 20–30% individuals initially diagnosed with
early breast cancer would exhibit distant metastasis (30). Following this, the prognostic
significance of E2Fs to DMFS was investigated. High expression
levels of E2F1, E2F3, E2F4 and E2F8 were significantly associated
with worse DMFS in patients with breast cancer, with HR=1.63; 95%
CI, 1.33–2.00 and P<0.001 (Fig.
4A); HR=1.29; 95% CI, 1.06–1.58 and P=0.012 (Fig. 4C); HR=1.28; 95% CI, 1.04–1.56 and
P=0.017 (Fig. 4D); and HR=1.88; 95%
CI, 1.53–2.31 and P<0.001 (Fig.
4H), respectively. However, there was no difference in DMFS
between high and low expression groups for the other four E2Fs
(Fig. 4B, E-G).
The prognostic values of E2Fs were investigated by
subgroup analysis. High mRNA expression of E2F1 was associated with
reduced DMFS rates in ER-positive patients (HR, 1.89; 95% CI,
1.29–2.75; P<0.001) and lymph node-negative patients (HR, 1.76;
95% CI, 1.32–2.35; P<0.001). E2F2 and E2F4 were not associated
with any subgroups. Upregulated E2F3 predicted reduced DMFS rates
in lymph node-negative breast cancer (HR, 1.49; 95% CI, 1.12–1.99;
P=0.006). In the ER-negative subgroup, a high level of E2F5 was
significantly associated with an improved DMFS rate (HR, 0.59; 95%
CI, 0.35–0.99; P=0.044). Elevated E2F6 was significantly associated
with improved DMFS rates in ER-negative (HR, 0.51; 95% CI,
0.29–0.81; P=0.012), PR-negative (HR, 0.36; 95% CI, 0.16–0.82;
P=0.012), HER-2-positive (HR, 0.35; 95% CI, 0.12–0.98; P=0.037),
lymph node-positive (HR, 0.65; 95% CI, 0.43–1.00; P=0.046) and
lymph node-negative patients (HR, 0.68; 95% CI, 0.51–0.91;
P=0.009). However, in contrast to the results in the overall
cohort, high expression of E2F7 demonstrated an improved DMFS rate
for HER-2-positive patients (HR, 0.25; 95% CI, 0.08–0.75; P=0.007).
Finally, increased E2F8 was significantly associated with reduced
DMFS rates in ER-positive (HR, 2.74; 95% CI, 1.68–4.04; P<0.001)
and lymph node-negative (HR, 2.01; 95% CI, 1.50–2.69; P<0.001)
patients. All KM analysis results are summarized in Table IV.
| Table IV.The association between E2Fs and
distant metastasis-free survival for patients with breast cancer
based on clinicopathological features. |
Table IV.
The association between E2Fs and
distant metastasis-free survival for patients with breast cancer
based on clinicopathological features.
|
|
| Positive
status | Negative
status |
|---|
|
|
|
|
|
|---|
| Clinicopathological
factor | Gene symbol | Cases | HR (95% CI) | P-value | Cases | HR (95% CI) | P-value |
|---|
| ER | E2F1 | 577 | 1.89
(1.29–2.75) |
<0.001a | 170 | 1.01
(0.61–1.69) | 0.958 |
|
| E2F2 | 161 | 1.79
(0.69–4.64) | 0.221 | 68 | 0.79
(0.34–1.83) | 0.583 |
|
| E2F3 | 577 | 1.05
(0.73–1.50) | 0.812 | 170 | 0.96
(0.57–1.60) | 0.867 |
|
| E2F4 | 577 | 1.38
(0.96–1.97) | 0.082 | 170 | 0.82
(0.49–1.37) | 0.451 |
|
| E2F5 | 577 | 1.42
(0.99–2.04) | 0.057 | 170 | 0.59
(0.35–0.99) | 0.044a |
|
| E2F6 | 577 | 0.93
(0.65–1.34) | 0.707 | 170 | 0.51
(0.29–0.87) | 0.012a |
|
| E2F7 | 161 | 1.57
(0.61–4.05) | 0.348 | 68 | 0.69
(0.30–1.62 | 0.394 |
|
| E2F8 | 577 | 2.74
(1.86–4.04) |
<0.001a | 170 | 0.84
(0.50–1.41) | 0.512 |
| PR | E2F1 | 122 | 1.49
(0.43–5.12) | 0.522 | 95 | 1.35
(0.64–2.83) | 0.433 |
|
| E2F2 | 122 | 0.92
(0.28–3.01) | 0.887 | 95 | 1.59
(0.75–3.38) | 0.224 |
|
| E2F3 | 122 | 2.32
(0.61–8.85) | 0.203 | 95 | 0.97
(0.46–2.04) | 0.932 |
|
| E2F4 | 122 | 0.42
(0.11–1.61) | 0.193 | 95 | 1.90
(0.88–4.08) | 0.095 |
|
| E2F5 | 122 | 3.27
(0.86–12.42) | 0.065 | 95 | 0.91
(0.43–1.93) | 0.808 |
|
| E2F6 | 122 | 0.60
(0.18–2.03) | 0.409 | 95 | 0.36
(0.16–0.82) | 0.012a |
|
| E2F7 | 122 | 0.79
(0.24–2.60) | 0.701 | 95 | 1.16
(0.55–2.44) | 0.697 |
|
| E2F8 | 122 | 1.87
(0.55–6.39) | 0.311 | 95 | 1.56
(0.74–3.30) | 0.242 |
| HER-2 | E2F1 | 66 | 1.12
(0.44–2.82) | 0.810 | 82 | 1.63
(0.46–5.76) | 0.447 |
|
| E2F2 | 66 | 1.00
(0.40–2.53) | 0.996 | 82 | 2.38
(0.61–9.20) | 0.195 |
|
| E2F3 | 66 | 1.09
(0.43–2.76) | 0.853 | 82 | 2.39
(0.62–9.24) | 0.193 |
|
| E2F4 | 66 | 1.33
(0.53–3.36) | 0.543 | 82 | 0.64
(0.18–2.28) | 0.492 |
|
| E2F5 | 66 | 0.44
(0.17–1.18) | 0.092 | 82 | 1.58
(0.44–5.59) | 0.477 |
|
| E2F6 | 66 | 0.35
(0.12–0.98) | 0.037a | 82 | 1.55
(0.44–5.50) | 0.492 |
|
| E2F7 | 66 | 0.25
(0.08–0.75) | 0.007a | 82 | 2.43
(0.63–9.39) | 0.184 |
|
| E2F8 | 66 | 1.46
(0.57–3.71) | 0.425 | 82 | 4.48
(0.95–21.1) | 0.038 |
| Lymph node | E2F1 | 337 | 1.32
(0.87–2.01) | 0.185 | 896 | 1.76
(1.32–2.35) |
<0.001a |
|
| E2F2 | 172 | 1.52
(0.82–2.84) | 0.181 | 162 | 1.88
(0.78–4.55) | 0.154 |
|
| E2F3 | 337 | 1.17
(0.77–1.77) | 0.462 | 896 | 1.49
(1.12–1.99) | 0.006a |
|
| E2F4 | 337 | 1.50
(0.99–2.29) | 0.055 | 896 | 1.16
(0.87–1.54) | 0.305 |
|
| E2F5 | 337 | 1.00
(0.66–1.52) | 0.985 | 896 | 1.27
(0.96–1.68) | 0.099 |
|
| E2F6 | 337 | 0.65
(0.43–1.00) | 0.046a | 896 | 0.68
(0.51–0.91) | 0.009a |
|
| E2F7 | 172 | 0.85
(0.46–1.58) | 0.613 | 162 | 1.90
(0.78–4.61) | 0.149 |
|
| E2F8 | 337 | 1.31
(0.86–1.98) | 0.207 | 896 | 2.01
(1.50–2.69) |
<0.001a |
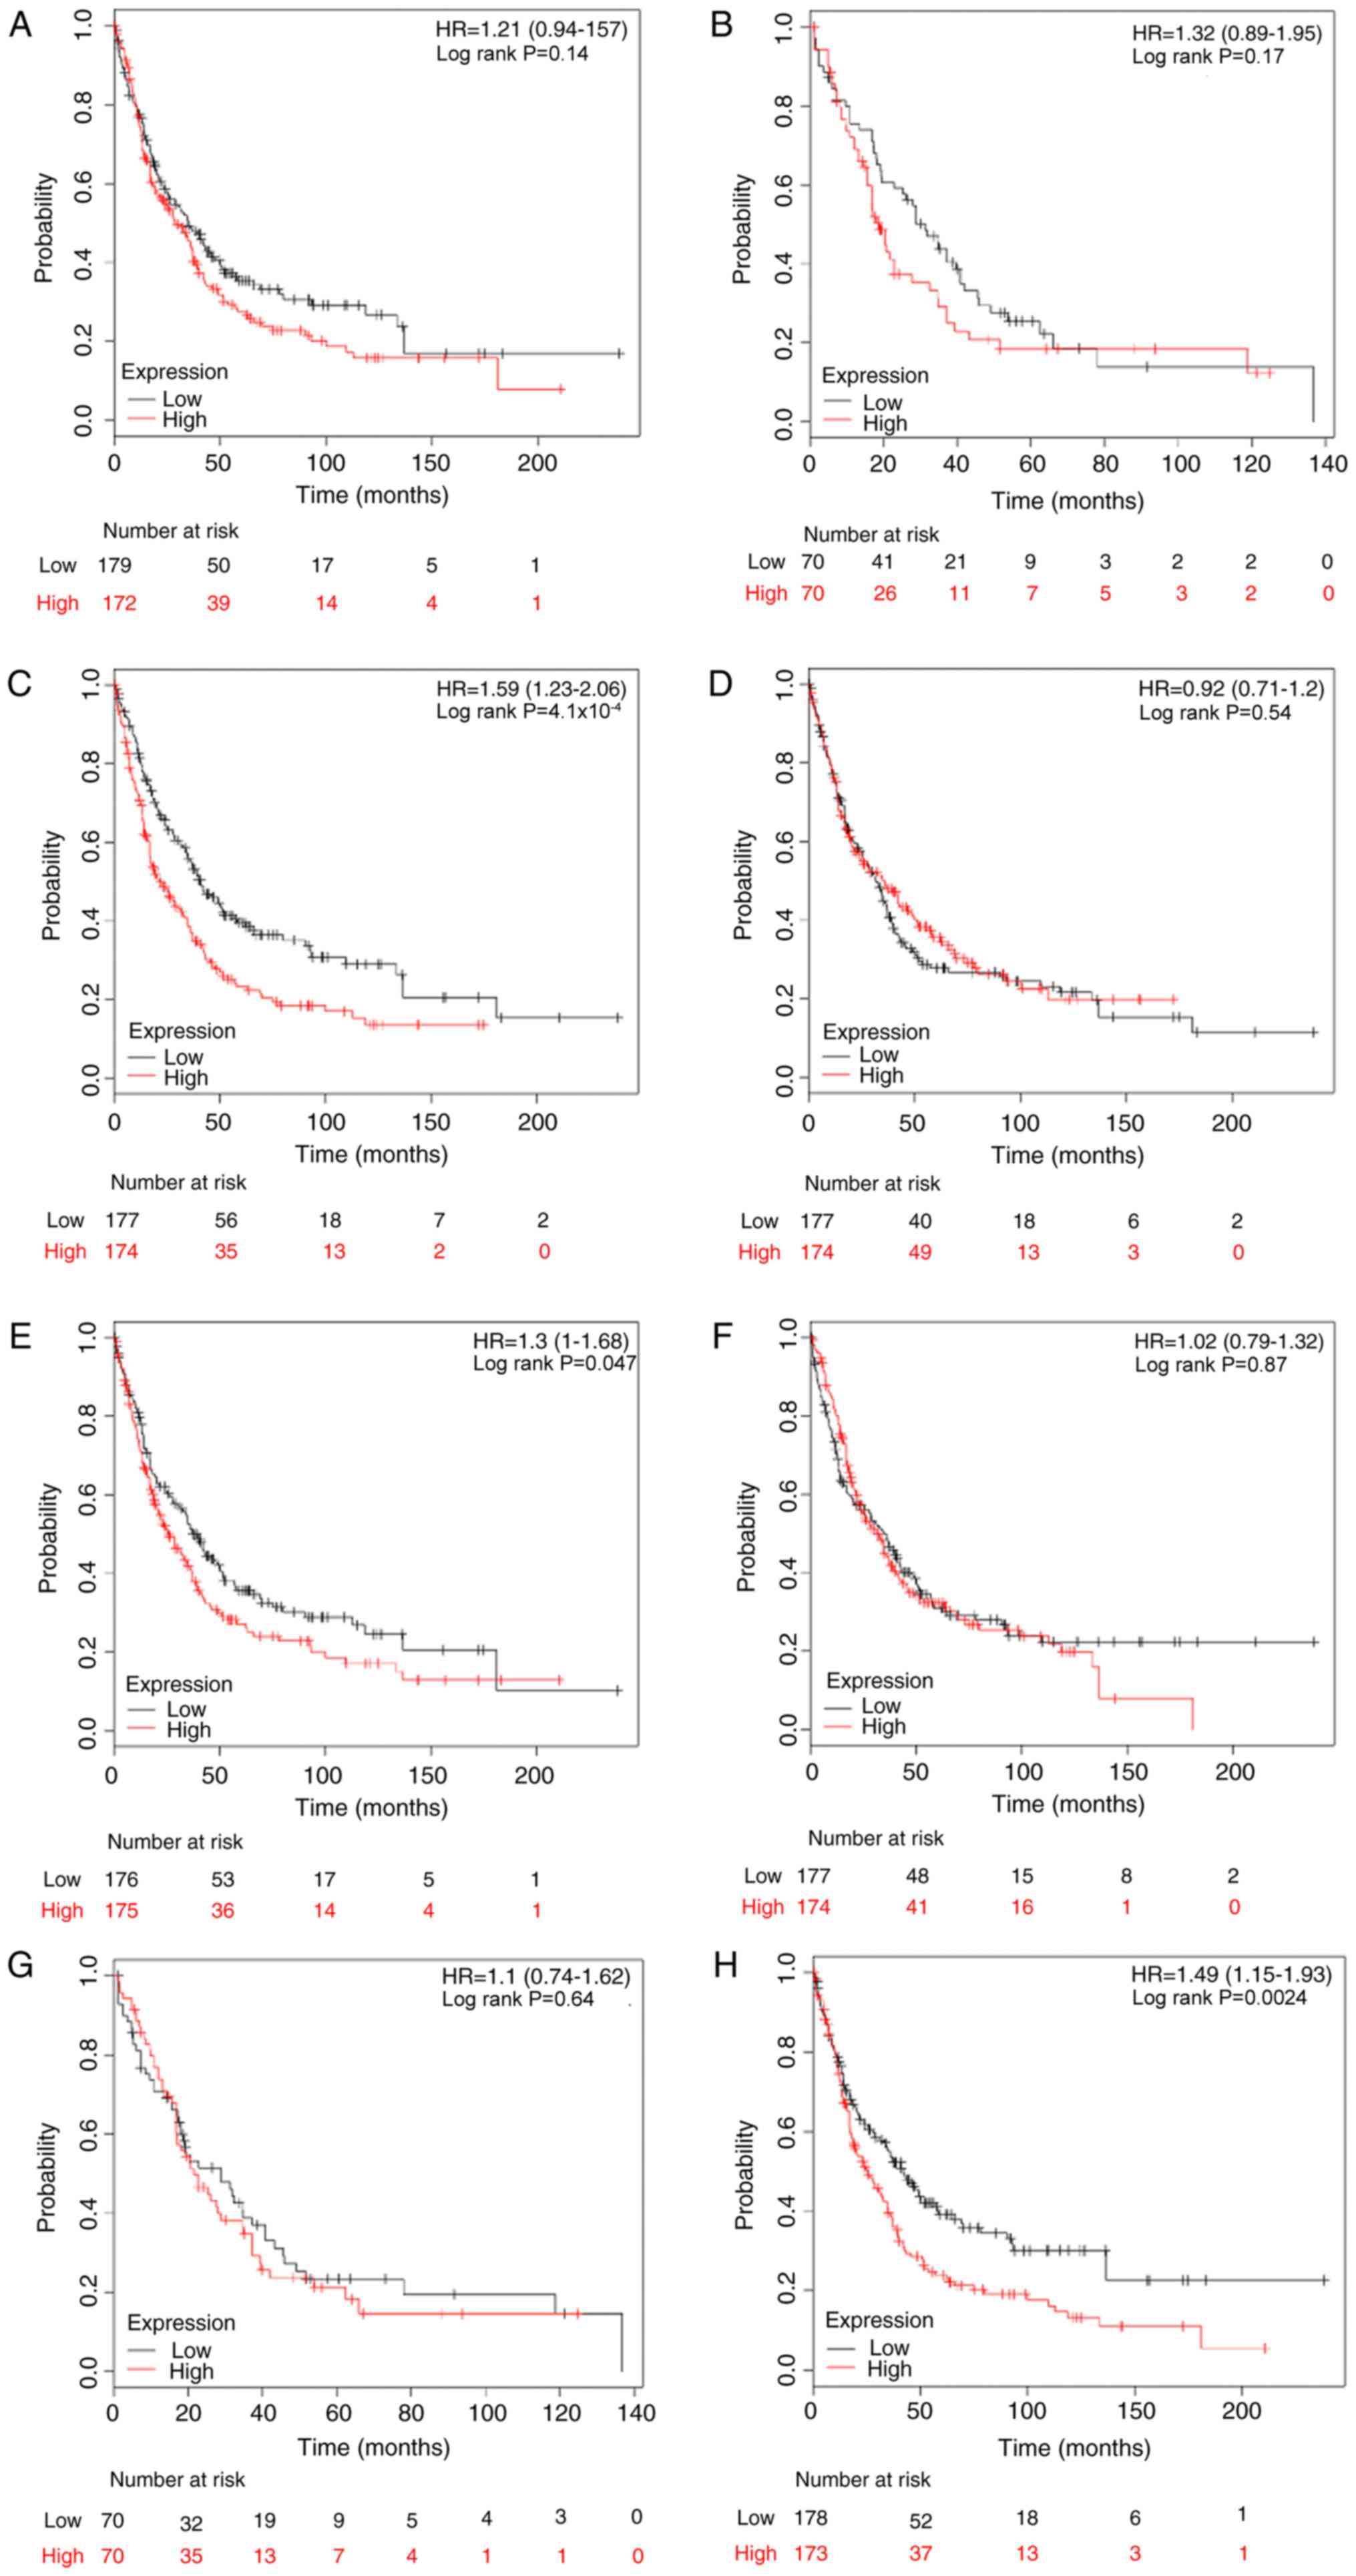
Association between E2F expression and
PPS rates in patients with breast cancer
The association between E2F and predictive
significance of PPS rates was also determined using the KM plotter
database. The results demonstrated that only high expression levels
of E2F3, E2F5 and E2F8 were associated with reduced PPS rates in
patients with breast cancer, with HR=1.59 (1.23–2.06) and
P<0.001; HR=1.30 (1.00–1.68) and P=0.047; and HR=1.49
(1.15–1.93) and P=0.002, respectively (Fig. 5).
By stratifying patients into different subgroups by
clinicopathological features, it was determined that high
expression of E2F3 (HR, 1.73; 95% CI, 1.11–2.71; P=0.015) and E2F8
(HR, 2.22; 95% CI, 1.41–3.49; P<0.001) indicated reduced PPS
rates in ER-positive breast cancer (Table
V). Furthermore, KM analyses indicated a significant
association between PPS rate and patients with lymph node-negative
breast cancer with elevated E2F1 (HR, 1.58; 95% CI, 1.01–2.47;
P=0.042), E2F4 (HR, 0.60; 95% CI, 0.38–0.93; P=0.022) and E2F8 (HR,
1.75; 95% CI, 1.12–2.74; P=0.015). However, subgroup analysis of
the prognostic values for E2Fs in the ER-positive and PR-positive
cohort was not conducted for the limited number of patients. No
positive result was observed in patients with PR-negative breast
cancer (Table V).
| Table V.The association between E2Fs and
post-progression survival for patients with breast cancer based on
clinicopathological features. |
Table V.
The association between E2Fs and
post-progression survival for patients with breast cancer based on
clinicopathological features.
|
|
| Positive
status | Negative
status |
|---|
|
|
|
|
|
|---|
| Clinicopathological
factor | Gene symbol | Cases | HR (95% CI) | P-value | Cases | HR (95% CI) | P-value |
|---|
| ER | E2F1 | 144 | 1.18
(0.76–1.84) | 0.452 | 68 | 0.94
(0.52–1.70) | 0.850 |
|
| E2F2 | N/A |
|
| 26 | 0.47
(0.16–1.36) | 0.153 |
|
| E2F3 | 144 | 1.73
(1.11–2.71) | 0.015a | 68 | 1.04
(0.57–1.87) | 0.904 |
|
| E2F4 | 144 | 1.05
(0.67–1.64) | 0.836 | 68 | 0.90
(0.50–1.62) | 0.719 |
|
| E2F5 | 144 | 1.01
(0.65–1.57) | 0.966 | 68 | 0.86
(0.48–1.55) | 0.614 |
|
| E2F6 | 144 | 1.12
(0.72–1.74) | 0.617 | 68 | 0.62
(0.34–1.12 | 0.111 |
|
| E2F7 | N/A |
|
| 26 | 0.79
(0.30–2.12) | 0.646 |
|
| E2F8 | 144 | 2.22
(1.41–3.49) |
<0.001a | 68 | 0.94
(0.52–1.69) | 0.827 |
| PR | N/A |
|
|
|
|
|
|
| HER2 | E2F1 | N/A |
|
| 27 | 0.88
(0.31–2.52) | 0.808 |
|
| E2F2 | N/A |
|
| 27 | 1.06
(0.36–3.06) | 0.920 |
|
| E2F3 | N/A |
|
| 27 | 1.61
(0.56–4.62) | 0.372 |
|
| E2F4 | N/A |
|
| 27 | 0.75
(0.25–2.20) | 0.594 |
|
| E2F5 | N/A |
|
| 27 | 0.89
(0.29–2.71) | 0.837 |
|
| E2F6 | N/A |
|
| 27 | 0.40
(0.13–1.20) | 0.090 |
|
| E2F7 | N/A |
|
| 27 | 0.92
(0.32–2.64) | 0.887 |
|
| E2F8 | N/A |
|
| 27 | 1.35
(0.47–3.89) | 0.576 |
| Lymph node | E2F1 | 82 | 0.76
(0.44–1.32) | 0.335 | 148 | 1.58
(1.01–2.47) | 0.042 |
|
| E2F2 | 44 | 1.61
(0.70–3.73) | 0.257 | N/A |
|
|
|
| E2F3 | 82 | 1.60
(0.92–2.77) | 0.091 | 148 | 1.24
(0.80–1.93) | 0.329 |
|
| E2F4 | 82 | 1.48
(0.86–2.57) | 0.157 | 148 | 0.60
(0.38–0.93) | 0.022a |
|
| E2F5 | 82 | 0.92
(0.53–1.60) | 0.778 | 148 | 1.14
(0.74–1.76) | 0.560 |
|
| E2F6 | 82 | 0.93
(0.53–1.61) | 0.795 | 148 | 0.81
(0.52–1.25) | 0.342 |
|
| E2F7 | 44 | 1.21
(0.53–2.76) | 0.653 | N/A |
|
|
|
| E2F8 | 82 | 0.78
(0.45–1.36) | 0.385 | 148 | 1.75
(1.12–2.74) | 0.013a |
Discussion
E2Fs have been implicated in numerous human cancer
types (7). Deregulated expression of
E2Fs was demonstrated to be a common phenomenon in malignances
(31). Depending on the context, E2Fs
were regarded as oncogenes or tumor suppressors and exerted exactly
opposite functions during tumorigenesis (11); therefore, identifying the underling
mechanisms of the E2F-mediated cell cycle, differentiation,
apoptosis and numerous other pivotal physiological progressions,
and unraveling how they are involved in different types of human
cancer may provide novel therapeutic strategies. In addition, a
number of studies have confirmed the significant associations
between E2Fs, and clinicopathological features and survival
outcomes of patients with cancer, which indicated that E2Fs may
serve as predictive biomarkers for specific carcinomas (13,18,21).
However, inconsistent expression patterns and prognostic
significance, even in the same type of carcinoma, have been
frequently observed in previous studies (18–20). In
the present study, the transcription levels and prognostic
significance of all eight E2F genes in breast cancer were
systematically investigated using the Oncomine, TCGA and KM plotter
databases.
E2F1-3 were classified as activator E2Fs due to
their ability to induce the transcription of target genes during
the transition from G1 to S phase in cell cycle progression
(32). In structure, a nuclear
localization signal adjacent to the cyclin-binding domains of E2Fs
ensures entrance into the nucleus and modulates their
transcriptional activity (33). Two
previous studies have indicated that the mRNA expression level of
E2F1 was much lower in breast cancer tissues than in normal tissues
(34,35); however, it may be contradictory that a
high transcription level of E2F1 was positively associated with
tumor cell proliferation and indicated a poorer prognosis for
patients with breast cancer (21,36). E2F2
was indicated to exhibit oncogenic or tumor suppressive activity
depending on the context (37). For
example, E2F2 contributed to cell proliferation in primary mouse
embryo fibroblasts and downregulation of E2F2 inhibited cell
proliferation in breast cancer (38,39).
However, Pusapati et al (40)
demonstrated that inactivation of E2F2 significantly promoted tumor
formation in K5.Myc transgenic mice, which indicated a
tumor-suppressor role of E2F2. It has been reported that either
E2F3a or E2F3b is sufficient to regulate E2F target gene
transcription and cell proliferation in the absence of other E2F
activators, E2F1 and E2F2 (41). A
recent study demonstrated that E2F3 was upregulated in the majority
of breast cancer cell lines and that E2F3 depletion significantly
suppressed cell proliferation (42).
In the present study, it was determined that E2F1-3 were all
upregulated in breast cancer. Notably, high mRNA expression of E2F1
and E2F3 were significantly associated with reduced OS, RFS and
DMFS rates. Furthermore, it was determined that E2F1-3 may be
associated with survival outcomes in an ER, PR, HER-2 and lymph
node status-specific manner. For instance, upregulated E2F1
indicated reduced OS rates in ER-positive but not in patients with
ER-negative breast cancer. Although no significant association was
observed between E2F2 and clinical outcomes in all breast cancer
patients, subgroup analysis determined that E2F2 was associated
with reduced RFS rates in patients with PR-negative, HER-2-negative
or lymph node-positive breast cancer.
As repressor members of the E2F family, E2F4 and
E2F5 were reported to contribute toward cell transformation,
proliferation and cell cycle progression in the presence of a
dimerization partner and inhibitory pocket proteins (Rbs) (43,44). In a
previous study, E2F4 was able to cooperate with any Rbs, while E2F5
was predominantly associated with p130 (45). In breast cancer, the expression level
of E2F4 was determined to be lower in primary and metastatic
tissues, compared with corresponding normal samples, which
indicated a tumor suppressor function for E2F4 (35); however, a more recent study
demonstrated that overexpression of E2F4 in the nuclei of breast
cancer cells was associated with multiple advanced
clinicopathological characteristics and poorer clinical outcomes
for patients with breast cancer (22). In the present study, it was determined
that there was no mRNA expression difference between tumor and
normal tissues; however, a relatively high level of E2F4 was
significantly associated with an improved RFS rate, but not with a
reduced DMFS rate. Similar to that of E2F4, the present
understanding of E2F5 was also limited in breast cancer. A group of
microRNAs (miRNAs/miRs), including miR-34a, miR-106, miR-132 and
miR-181a, was proven to target E2F5 in a number of cancer types
(46). Umemura et al (47) demonstrated that E2F5-positive breast
cancer was characterized by a higher Ki-67 index and an aggressive
histological pathology. Furthermore, the DFS rate was reduced in
lymph node-negative patients with E2F5-positive breast cancer,
compared with patients with E2F5-negative breast cancer (47). Consistently, it was determined that
E2F5 was upregulated in breast tumors, compared with normal
tissues, and a high mRNA expression level of E2F5 predicted reduced
RFS and PPS rates. Notably, a high level of E2F5 was significantly
associated with improved OS, RFS and DMFS rates in ER-negative
patients and with an improved OS rate in HER-2-positive and lymph
node-positive patients by subgroup analysis. Accordingly, with
these preliminary results, the actual roles of E2F4 and E2F5
require further clarification in breast cancer.
E2F6-8 have similar functions with the repressor
group but it is distinct in molecular mechanisms (48,49).
Although exhibiting a high level of homology with E2F1-5 in the
heterodimerization and DNA binding domains, E2F6-8 lacks a
transactivation domain and an Rb-binding domain, thereby acting as
pocket protein-independent transcriptional repressor (50). In addition, E2F6 was demonstrated to
act as a repressor through interaction with the polycomb complex,
whereas E2F7 and E2F8 were able to form homodimers or heterodimers
to suppress the transcription of target genes (48,49).
Recently, Tang et al (51)
reported that the regulation of BRCA1 by miR-185 was mediated by
E2F6, which indicated a critical role of E2F6 in breast cancer,
though no expression difference of E2F6 was detected between tumors
and normal tissue in the present study. In a previous study, E2F7
was overexpressed in tamoxifen-resistant breast cancer cells and
silencing E2F7 re-sensitized resistant cells to tamoxifen (52). Furthermore, high expression of E2F7
was significantly associated with reduced RFS rate in patients with
ERα-positive breast cancer treated with tamoxifen (52). In the present study, it was determined
that high expression of E2F7 was associated with reduced a RFS not
only in ER-positive but also in patients with PR-positive and
HER-2-negative breast cancer; however, E2F7 was associated with an
improved DMFS rate in patients with HER-2-positive breast cancer.
Notably, a high expression of E2F8 was significantly associated
with reduced OS, RFS, DMFS and PPS rates. This was similar to a
recent study reported by Ye et al (53), which indicated that upregulated E2F8
was correlated with a poorer prognosis in breast cancer.
Specifically, it was also demonstrated that E2F8 indicated a poorer
prognosis in patients with ER-positive, PR-positive and
HER-2-negative breast cancer.
In summary, it was concluded that mRNA expression
levels of E2F1, E2F2, E2F3, E2F5, E2F7 and E2F8 are notably
increased in breast carcinoma, while the expression of E2F4 and
E2F6 is not altered in tumors, compared with normal tissues.
Furthermore, significant associations between E2Fs and clinical
outcomes of patients with breast cancer were also identified. These
results indicated that E2Fs may serve as promising biomarkers for
breast cancer; however, further studies concerning molecular
mechanisms, focusing on individual E2Fs or combining several E2Fs,
are required to facilitate the clinical application of E2Fs serving
as prognostic indicators or therapeutic targets in breast
cancer.
Acknowledgements
Not applicable.
Funding
The present study was supported by National Natural
Science Foundation of China (grant nos. 81472475 and 81102007),
Chongqing Science and Technology Commission (grant no.
cstc2016jcyjA0313) and Scientific Research Foundation of Chongqing
Medical University (grant no. 201408).
Availability of data and materials
The datasets generated and/or analyzed during the
current study are available in the Oncomine (http://www.oncomine.org), TCGA (https://cancergenome.nih.gov/), and KM-plotter
(http://kmplot.com/analysis/) databases
repository.
Authors' contributions
GR and HL conceived and designed the study. YL, JH,
SX, DY, and JS performed data analyses. YL, JH, and HL contributed
reagents/materials/analysis tools. YL and HL wrote the paper. All
authors read and approved the final manuscript.
Ethics approval and consent to
participate
Not applicable.
Consent for publication
Not applicable.
Competing interests
The authors declare that they have no competing
interests.
References
|
1
|
Torre LA, Bray F, Siegel RL, Ferlay J,
Lortet-Tieulent J and Jemal A: Global cancer statistics, 2012. CA
Cancer J Clin. 65:87–108. 2015. View Article : Google Scholar : PubMed/NCBI
|
|
2
|
Chlebowski RT, Manson JE, Anderson GL,
Cauley JA, Aragaki AK, Stefanick ML, Lane DS, Johnson KC,
Wactawski-Wende J, Chen C, et al: Estrogen plus progestin and
breast cancer incidence and mortality in the Women's health
initiative observational study. J Natl Cancer Inst. 105:526–535.
2013. View Article : Google Scholar : PubMed/NCBI
|
|
3
|
Althuis MD, Dozier JM, Anderson WF, Devesa
SS and Brinton LA: Global trends in breast cancer incidence and
mortality 1973–1997. Int J Epidemiol. 34:405–412. 2005. View Article : Google Scholar : PubMed/NCBI
|
|
4
|
DeSantis C, Ma J, Bryan L and Jemal A:
Breast cancer statistics, 2013. CA Cancer J Clin. 64:52–62. 2014.
View Article : Google Scholar : PubMed/NCBI
|
|
5
|
Redig AJ and McAllister SS: Breast cancer
as a systemic disease: A view of metastasis. J Intern Med.
274:113–126. 2013. View Article : Google Scholar : PubMed/NCBI
|
|
6
|
Assi HA, Khoury KE, Dbouk H, Khalil LE,
Mouhieddine TH and El Saghir NS: Epidemiology and prognosis of
breast cancer in young women. J Thorac Dis. 5 Suppl 1:S2–S8.
2013.PubMed/NCBI
|
|
7
|
Tsantoulis PK and Gorgoulis VG:
Involvement of E2F transcription factor family in cancer. Eur J
Cancer. 41:2403–2414. 2005. View Article : Google Scholar : PubMed/NCBI
|
|
8
|
Attwooll C, Lazzerini Denchi E and Helin
K: The E2F family: Specific functions and overlapping interests.
EMBO J. 23:4709–4716. 2004. View Article : Google Scholar : PubMed/NCBI
|
|
9
|
Bell LA and Ryan KM: Life and death
decisions by E2F-1. Cell Death Differ. 11:137–142. 2004. View Article : Google Scholar : PubMed/NCBI
|
|
10
|
Stevens C and La Thangue NB: E2F and cell
cycle control: A double-edged sword. Arch Biochem Biophys.
412:157–169. 2003. View Article : Google Scholar : PubMed/NCBI
|
|
11
|
Wu Z, Zheng S and Yu Q: The E2F family and
the role of E2F1 in apoptosis. Int J Biochem Cell Biol.
41:2389–2397. 2009. View Article : Google Scholar : PubMed/NCBI
|
|
12
|
Jiang H, Martin V, Gomez-Manzano C,
Johnson DG, Alonso M, White E, Xu J, McDonnell TJ, Shinojima N and
Fueyo J: The RB-E2F1 pathway regulates autophagy. Cancer Res.
70:7882–7893. 2010. View Article : Google Scholar : PubMed/NCBI
|
|
13
|
Gorgoulis VG, Zacharatos P, Mariatos G,
Kotsinas A, Bouda M, Kletsas D, Asimacopoulos PJ, Agnantis N,
Kittas C and Papavassiliou AG: Transcription factor E2F-1 acts as a
growth-promoting factor and is associated with adverse prognosis in
non-small cell lung carcinomas. J Pathol. 198:142–156. 2002.
View Article : Google Scholar : PubMed/NCBI
|
|
14
|
Huang CL, Liu D, Nakano J, Yokomise H,
Ueno M, Kadota K and Wada H: E2F1 overexpression correlates with
thymidylate synthase and survivin gene expressions and tumor
proliferation in non small-cell lung cancer. Clin Cancer Res.
13:6938–6946. 2007. View Article : Google Scholar : PubMed/NCBI
|
|
15
|
Liu LX, Jiang HC, Liu ZH, Zhu AL, Zhang
WH, Wu LF, Zhou J, Wang XQ and Wu M: Expression of cell
cycle/growth regulator genes in human hepatocellular carcinoma and
adjacent normal liver tissues. Oncol Rep. 10:1771–1775.
2003.PubMed/NCBI
|
|
16
|
Deng Q, Wang Q, Zong WY, Zheng DL, Wen YX,
Wang KS, Teng XM, Zhang X, Huang J and Han ZG: E2F8 contributes to
human hepatocellular carcinoma via regulating cell proliferation.
Cancer Res. 70:782–791. 2010. View Article : Google Scholar : PubMed/NCBI
|
|
17
|
Palaiologou M, Koskinas J, Karanikolas M,
Fatourou E and Tiniakos DG: E2F-1 is overexpressed and
pro-apoptotic in human hepatocellular carcinoma. Virchows Arch.
460:439–446. 2012. View Article : Google Scholar : PubMed/NCBI
|
|
18
|
De Meyer T, Bijsmans IT, Van de Vijver KK,
Bekaert S, Oosting J, Van Criekinge W, van Engeland M and Sieben
NL: E2Fs mediate a fundamental cell-cycle deregulation in
high-grade serous ovarian carcinomas. J Pathol. 217:14–20. 2009.
View Article : Google Scholar : PubMed/NCBI
|
|
19
|
Reimer D, Sadr S, Wiedemair A, Goebel G,
Concin N, Hofstetter G, Marth C and Zeimet AG: Expression of the
E2F family of transcription factors and its clinical relevance in
ovarian cancer. Ann N Y Acad Sci. 1091:270–281. 2006. View Article : Google Scholar : PubMed/NCBI
|
|
20
|
Lu KH, Patterson AP, Wang L, Marquez RT,
Atkinson EN, Baggerly KA, Ramoth LR, Rosen DG, Liu J, Hellstrom I,
et al: Selection of potential markers for epithelial ovarian cancer
with gene expression arrays and recursive descent partition
analysis. Clin Cancer Res. 10:3291–3300. 2004. View Article : Google Scholar : PubMed/NCBI
|
|
21
|
Han S, Park K, Bae BN, Kim KH, Kim HJ, Kim
YD and Kim HY: E2F1 expression is related with the poor survival of
lymph node-positive breast cancer patients treated with
fluorouracil, doxorubicin and cyclophosphamide. Breast Cancer Res
Treat. 82:11–16. 2003. View Article : Google Scholar : PubMed/NCBI
|
|
22
|
Rakha EA, Pinder SE, Paish EC, Robertson
JF and Ellis IO: Expression of E2F-4 in invasive breast carcinomas
is associated with poor prognosis. J Pathol. 203:754–761. 2004.
View Article : Google Scholar : PubMed/NCBI
|
|
23
|
Fujiwara K, Yuwanita I, Hollern DP and
Andrechek ER: Prediction and genetic demonstration of a role for
activator E2Fs in Myc-induced tumors. Cancer Res. 71:1924–1932.
2011. View Article : Google Scholar : PubMed/NCBI
|
|
24
|
Szász AM, Lánczky A, Nagy A, Förster S,
Hark K, Green JE, Boussioutas A, Busuttil R, Szabó A and Győrffy B:
Cross-validation of survival associated biomarkers in gastric
cancer using transcriptomic data of 1,065 patients. Oncotarget.
7:49322–49333. 2016. View Article : Google Scholar : PubMed/NCBI
|
|
25
|
Gluck S, Ross JS, Royce M, McKenna EF Jr,
Perou CM, Avisar E and Wu L: TP53 genomics predict higher clinical
and pathologic tumor response in operable early-stage breast cancer
treated with docetaxel-capecitabine ± trastuzumab. Breast Cancer
Res Treat. 132:781–791. 2012. View Article : Google Scholar : PubMed/NCBI
|
|
26
|
Curtis C, Shah SP, Chin SF, Turashvili G,
Rueda OM, Dunning MJ, Speed D, Lynch AG, Samarajiwa S, Yuan Y, et
al: The genomic and transcriptomic architecture of 2,000 breast
tumours reveals novel subgroups. Nature. 486:346–352. 2012.
View Article : Google Scholar : PubMed/NCBI
|
|
27
|
Zhao H, Langerød A, Ji Y, Nowels KW,
Nesland JM, Tibshirani R, Bukholm IK, Kåresen R, Botstein D,
Børresen-Dale AL and Jeffrey SS: Different gene expression patterns
in invasive lobular and ductal carcinomas of the breast. Mol Biol
Cell. 15:2523–2536. 2004. View Article : Google Scholar : PubMed/NCBI
|
|
28
|
Richardson AL, Wang ZC, De Nicolo A, Lu X,
Brown M, Miron A, Liao X, Iglehart JD, Livingston DM and Ganesan S:
X chromosomal abnormalities in basal-like human breast cancer.
Cancer Cell. 9:121–132. 2006. View Article : Google Scholar : PubMed/NCBI
|
|
29
|
Radvanyi L, Singh-Sandhu D, Gallichan S,
Lovitt C, Pedyczak A, Mallo G, Gish K, Kwok K, Hanna W, Zubovits J,
et al: The gene associated with trichorhinophalangeal syndrome in
humans is overexpressed in breast cancer. Proc Natl Acad Sci USA.
102:11005–11010. 2005. View Article : Google Scholar : PubMed/NCBI
|
|
30
|
Kennecke H, Yerushalmi R, Woods R, Cheang
MC, Voduc D, Speers CH, Nielsen TO and Gelmon K: Metastatic
behavior of breast cancer subtypes. J Clin Oncol. 28:3271–3277.
2010. View Article : Google Scholar : PubMed/NCBI
|
|
31
|
Suzuki T, Yasui W, Yokozaki H, Naka K,
Ishikawa T and Tahara E: Expression of the E2F family in human
gastrointestinal carcinomas. Int J Cancer. 81:535–538. 1999.
View Article : Google Scholar : PubMed/NCBI
|
|
32
|
Wu L, Timmers C, Maiti B, Saavedra HI,
Sang L, Chong GT, Nuckolls F, Giangrande P, Wright FA, Field SJ, et
al: The E2F1-3 transcription factors are essential for cellular
proliferation. Nature. 414:457–462. 2001. View Article : Google Scholar : PubMed/NCBI
|
|
33
|
Muller H, Moroni MC, Vigo E, Petersen BO,
Bartek J and Helin K: Induction of S-phase entry by E2F
transcription factors depends on their nuclear localization. Mol
Cell Biol. 17:5508–5520. 1997. View Article : Google Scholar : PubMed/NCBI
|
|
34
|
Worku D, Jouhra F, Jiang GW, Patani N,
Newbold RF and Mokbel K: Evidence of a tumour suppressive function
of E2F1 gene in human breast cancer. Anticancer Res. 28:2135–2139.
2008.PubMed/NCBI
|
|
35
|
Ho GH, Calvano JE, Bisogna M and Van Zee
KJ: Expression of E2F-1 and E2F-4 is reduced in primary and
metastatic breast carcinomas. Breast Cancer Res Treat. 69:115–122.
2001. View Article : Google Scholar : PubMed/NCBI
|
|
36
|
Vuaroqueaux V, Urban P, Labuhn M,
Delorenzi M, Wirapati P, Benz CC, Flury R, Dieterich H, Spyratos F,
Eppenberger U and Eppenberger-Castori S: Low E2F1 transcript levels
are a strong determinant of favorable breast cancer outcome. Breast
Cancer Res. 9:R332007. View Article : Google Scholar : PubMed/NCBI
|
|
37
|
Johnson DG and Degregori J: Putting the
oncogenic and tumor suppressive activities of E2F into context.
Curr Mol Med. 6:731–738. 2006. View Article : Google Scholar : PubMed/NCBI
|
|
38
|
Leone G, Sears R, Huang E, Rempel R,
Nuckolls F, Park CH, Giangrande P, Wu L, Saavedra HI, Field SJ, et
al: Myc requires distinct E2F activities to induce S phase and
apoptosis. Mol Cell. 8:105–113. 2001. View Article : Google Scholar : PubMed/NCBI
|
|
39
|
Nguyen-Vu T, Vedin LL, Liu K, Jonsson P,
Lin JZ, Candelaria NR, Candelaria LP, Addanki S, Williams C,
Gustafsson JÅ, et al: Liver × receptor ligands disrupt breast
cancer cell proliferation through an E2F-mediated mechanism. Breast
Cancer Res. 15:R512013. View Article : Google Scholar : PubMed/NCBI
|
|
40
|
Pusapati RV, Weaks RL, Rounbehler RJ,
McArthur MJ and Johnson DG: E2F2 suppresses Myc-induced
proliferation and tumorigenesis. Mol Carcinog. 49:152–156.
2010.PubMed/NCBI
|
|
41
|
Chong JL, Tsai SY, Sharma N, Opavsky R,
Price R, Wu L, Fernandez SA and Leone G: E2f3a and E2f3b contribute
to the control of cell proliferation and mouse development. Mol
Cell Biol. 29:414–424. 2009. View Article : Google Scholar : PubMed/NCBI
|
|
42
|
Vimala K, Sundarraj S, Sujitha MV and
Kannan S: Curtailing overexpression of E2F3 in breast cancer using
siRNA (E2F3)-based gene silencing. Arch Med Res. 43:415–422. 2012.
View Article : Google Scholar : PubMed/NCBI
|
|
43
|
Dirks PB, Rutka JT, Hubbard SL, Mondal S
and Hamel PA: The E2F-family proteins induce distinct cell cycle
regulatory factors in p16-arrested, U343 astrocytoma cells.
Oncogene. 17:867–876. 1998. View Article : Google Scholar : PubMed/NCBI
|
|
44
|
Polanowska J, Le Cam L, Orsetti B, Vallés
H, Fabbrizio E, Fajas L, Taviaux S, Theillet C and Sardet C: Human
E2F5 gene is oncogenic in primary rodent cells and is amplified in
human breast tumors. Genes Chromosomes Cancer. 28:126–130. 2000.
View Article : Google Scholar : PubMed/NCBI
|
|
45
|
Dyson N: The regulation of E2F by
pRB-family proteins. Genes Dev. 12:2245–2262. 1998. View Article : Google Scholar : PubMed/NCBI
|
|
46
|
Tian H, Hou L, Xiong YM, Huang JX, Zhang
WH, Pan YY and Song XR: miR-132 targeting E2F5 suppresses cell
proliferation, invasion, migration in ovarian cancer cells. Am J
Transl Res. 8:1492–1501. 2016.PubMed/NCBI
|
|
47
|
Umemura S, Shirane M, Takekoshi S,
Kusakabe T, Itoh J, Egashira N, Tokuda Y, Mori K and Osamura YR:
Overexpression of E2F-5 correlates with a pathological basal
phenotype and a worse clinical outcome. Br J Cancer. 100:764–771.
2009. View Article : Google Scholar : PubMed/NCBI
|
|
48
|
Trimarchi JM, Fairchild B, Wen J and Lees
JA: The E2F6 transcription factor is a component of the mammalian
Bmi1-containing polycomb complex. Proc Natl Acad Sci USA.
98:1519–1524. 2001. View Article : Google Scholar : PubMed/NCBI
|
|
49
|
Lammens T, Li J, Leone G and De Veylder L:
Atypical E2Fs: New players in the E2F transcription factor family.
Trends Cell Biol. 19:111–118. 2009. View Article : Google Scholar : PubMed/NCBI
|
|
50
|
Moon NS and Dyson N: E2F7 and E2F8 keep
the E2F family in balance. Dev Cell. 14:1–3. 2008. View Article : Google Scholar : PubMed/NCBI
|
|
51
|
Tang H, Liu P, Yang L and Xie X, Ye F, Wu
M, Liu X, Chen B, Zhang L and Xie X: miR-185 suppresses tumor
proliferation by directly targeting E2F6 and DNMT1 and indirectly
upregulating BRCA1 in triple-negative breast cancer. Mol Cancer
Ther. 13:3185–3197. 2014. View Article : Google Scholar : PubMed/NCBI
|
|
52
|
Chu J, Zhu Y, Liu Y, Sun L, Lv X, Wu Y, Hu
P, Su F, Gong C, Song E, et al: E2F7 overexpression leads to
tamoxifen resistance in breast cancer cells by competing with E2F1
at miR-15a/16 promoter. Oncotarget. 6:31944–31957. 2015. View Article : Google Scholar : PubMed/NCBI
|
|
53
|
Ye L, Guo L, He Z, Wang X, Lin C, Zhang X,
Wu S, Bao Y, Yang Q, Song L and Lin H: Upregulation of E2F8
promotes cell proliferation and tumorigenicity in breast cancer by
modulating G1/S phase transition. Oncotarget. 7:23757–23771. 2016.
View Article : Google Scholar : PubMed/NCBI
|