Introduction
Transduction is the process of introducing small
hairpin RNA (shRNA) sequences that are encoded in viral DNA into
cells via viral vector. Upon binding to the cell, the viral genome
is delivered into the cytoplasm, and Dicer protein enzymatically
cleaves the short form of the shRNA from the viral origin. Then,
the shRNA intermediate is imported into the host cell nucleus,
where it is stably integrated into the host genome and interacts
with several proteins to form an RNA-induced silencing complex
(RISC). RISC silences the target gene by recognizing the
corresponding mRNA sequences, and causing their degradation
(1). With each cellular division, the
integrated virus is replicated and passed on to the daughter cells,
thus ensuring continued expression of the targeted sequence
throughout the population. shRNAs are 19–22 bp double-stranded RNA,
and are complementary to specific targets (2).
Cancer cell lines are commonly used to study
carcinogenesis, potential biomarkers and alternative interventions,
as they are homogenous and their supplies are unlimited. The
present study used HepG2, which is a hepatoblastoma cell line
(3). The HepG2 cell line has been
misidentified as hepatocellular carcinoma cell line in previous
scientific reports (4). However, the
misidentification will not affect the outcome of the present study
because it aims to provide a general guideline to optimize
lentiviral transduction in a cell, and is not specific to either
hepatocellular carcinoma or hepatoblastoma. In the present study,
HepG2 was used as a model to silence a gene using the general
guidelines mentioned. Comparison of the outcome in hepatocellular
carcinoma and hepatoblastoma is beyond of the scope of the present
study.
The development of genetic manipulation in the HepG2
cell line is challenging, with transfection methods resulting in
inefficient transduction of the cells. As an alternative,
lentiviral vectors and cationic polymers, including polybrene, have
been used to increase transduction efficiency in the HepG2 cell
line (5,6). HepG2 cells are of interest because
previous studies have demonstrated that γ-tocotrienol treatment
increases peroxiredoxin 4 (PRDX4) gene expression in HepG2
cells (7) and this gene may act as a
sensitive marker of oxidative stress in liver injury (8). These studies suggested that PRDX4 may be
involved in mechanisms that protect against oxidative stress, which
remain unclear. This gap in knowledge requires elucidation at the
molecular level in order to determine the function of PRDX4.
Transduction is a useful approach to determine PRDX4 function,
allowing modification of its expression in different
conditions.
Several critical factors need to be considered in
order to achieve specific and efficient transduction (9–11). These
include cell density, polybrene concentration, serum condition,
incubation time and puromycin antibiotic selection dosage (12–15).
Functional titers and multiplicity of infection (MOI) determination
further help to optimize shRNA delivery into the cells. In
addition, ideal shRNA vector construction and design, which are
crucial to control shRNA expression, also influence the
transduction efficiency. The cells will suffer cytotoxicity and
unwanted side effects if shRNA expression is too high, whereas
transfection will be suboptimal if shRNA expression is too low.
Significant progress has been made in predicting which shRNA
vectors and target sequences are the most effective at reducing
gene expression (16,17).
At present, the only way to measure the efficiency
of specific shRNA target sequences is by direct experimentation.
Variation in cell susceptibility to transduction is one of the
major challenges in determining ideal conditions for high
efficiency of gene transfer events (18,19). Thus,
optimization of each transduction step is recommended to ensure the
transduction conditions to fine-tune shRNA expression. The ability
to control shRNA expression levels is important as silencing of the
targeted gene contributes to cell survival and development
(20). Thus, the present study was
performed to determine the optimum conditions of PRDX4-shRNA
transduction in HepG2 cells, and to determine the critical factors
needed to ensure successful silencing.
Materials and methods
Cell line
HepG2 cells (American Type Culture Collection,
Manassas, VA, USA) were cultured in complete culture media (CCM):
Earle's modified Eagle's medium (Hyclone; GE Healthcare Life
Sciences, Logan, UT, USA) containing 4 mM L-glutamine, 0.1 mM
minimum essential medium (MEM) and non-essential amino acids,
supplemented with 10% fetal bovine serum (FBS; Biowest USA,
Riverside, MO, USA) in a humidified 37°C incubator containing 5%
CO2. HepG2 cells with <10 passages were used for
subsequent experiments.
shRNA sequence and design
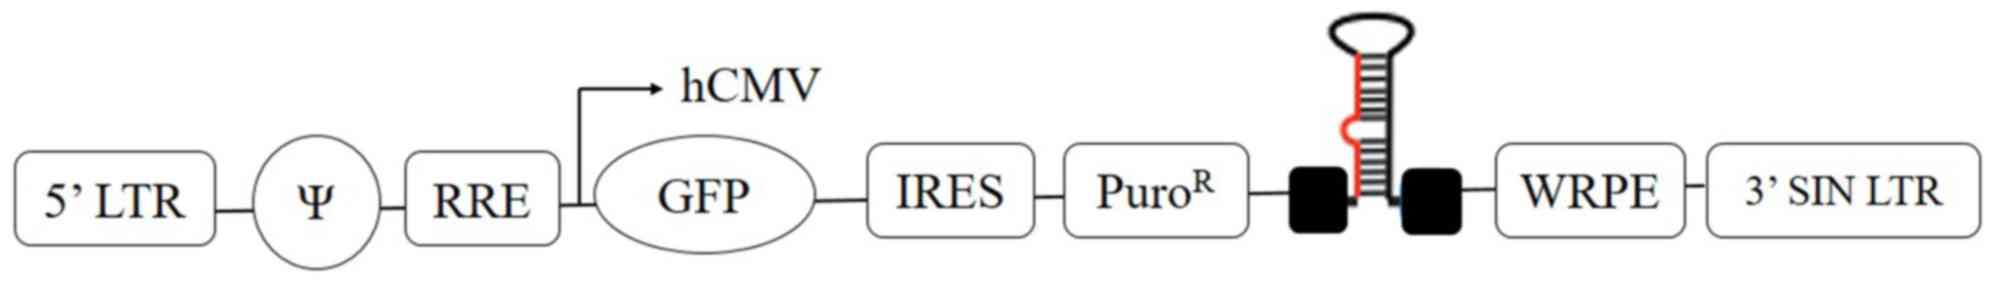
The pGIPZ lentiviral vector of 11.8 kb size (GE
Healthcare Dharmacon Inc., Lafayette, CO, USA) harbors a reporter
and a puromycin resistance gene. The encoded reporter gene is
translated into a green fluorescent protein (GFP). The lentiviral
vector is controlled by the immediate-early cytomegalovirus (CMV)
promoter (Fig. 1). HepG2 cells were
transduced with three individual shRNA clones against PRDX4
(NM_006406.1): sequence 1 (cat. no. 370039), sequence 2 (cat. no.
370042) and sequence 3 (cat. no. 200074) (GE Healthcare Dharmacon
Inc.). Non-targeting negative control shRNA (cat. no. RHS4346),
consisting of a random sequence and a positive control GAPDH-shRNA
lentivirus (cat. no. RHS4372), were used as a control (GE
Healthcare Dharmacon Inc.). The sequences are listed in Table I.
 | Table I.Sequences of PDX4 shRNA and
non-targeting negative control shRNA. |
Table I.
Sequences of PDX4 shRNA and
non-targeting negative control shRNA.
| shRNA | Sequence
(5′-3′) |
|---|
| GAPDH-shRNA
positive control |
|
|
Sense |
ATGGTTTACATGTTCCAAT |
|
Antisense |
ATTGGAACATGTAAACCAT |
| Non-targeting
negative control |
|
|
Sense |
ATCTCGCTTGGGCGAGAGTAAG |
|
Antisense |
CTTACTCTCGCCCAAGCGAGAG |
| shRNA PRDX4
sequence 1 |
|
|
Sense |
GAGCTGAAGTTAACTGATT |
|
Antisense |
AATCAGTTAACTTCAGCTC |
| shRNA PRDX4
sequence 2 |
|
|
Sense |
AGCTGAAGTATTTCGATAA |
|
Antisense |
TTATCGAAATACTTCAGCT |
| shRNA PRDX4
sequence 3 |
|
|
Sense |
ACCTGGTAGTGAAACAATA |
|
Antisense |
TAATTGTTTCACTACCAGGT |
Optimization of basic transduction
conditions
HepG2 cells were seeded at a density of
5×10³, 7.5×10³ and 10×103
cells/well in a final volume of 100 µl CCM in two 96-well plates,
repeated in triplicate for each cell density, and incubated in a
humidified 37°C incubator with 5% CO2 overnight. Cell
density was observed using an inverted microscope (CK 40; Olympus
Corporation, Tokyo, Japan) at 24 h post-transfection. Cell density
that reached 40–50%, confluency was selected to be used in
subsequent experiments and cell densities that resulted in >50%
confluency were excluded. Transduction media (TM) with serum was
freshly prepared, and consisted of a 1:1 ratio of Dulbecco's
modified Eagle's medium (DMEM; Gibco; Thermo Fisher Scientific,
Inc., Waltham, MA, USA) to MEM (Hyclone; GE Healthcare Life
Sciences), 10% FBS and range of polybrene concentrations (0, 2, 4,
6, 8, 10, 12 and 14 µg/ml; Merck KGaA, Darmstadt, Germany). Culture
media was discarded and 50 µl TM with and without serum and the
aforementioned range of polybrene concentrations was added to each
well. A total of 100 µl CCM with 10% FBS was added to the well with
TM and 10% FBS 6 h after the initial addition of TM, whereas 100 µl
CCM with 15% FBS was added to each well that contained TM without
FBS. The same procedure was repeated for the second plate following
incubation for 24 h at 37°C in a humidified atmosphere containing
5% CO2. A cell viability assay was conducted after 24 h
of CCM addition.
The viability assay was conducted by adding 120 µl
of a Cell Titer 96® aQueous One Solution reagent
(Promega Corporation, Madison, WI, USA) that contains a MTS reagent
diluted in CCM medium (20 µl MTS/100 µl CCM) in a 96-well for 2 h
at 37°C. The purple formazan crystals were dissolved and the
viability was analyzed at a wavelength of 490 nm using a microplate
reader (EnSpire; PerkinElmer, Inc., Waltham, MA, USA). Three
individual experiments were performed.
Determination of cytotoxicity
HepG2 cells were plated at a density of
5×10³ cells/well into a 96-well plate in triplicate, and
reached 40–50% confluency the following day. A stock solution of 10
mg/ml puromycin (Santa Cruz Biotechnology, Inc., Dallas, TX, USA)
was reconstituted with 50 mM dimethyl sulfoxide (Merck KGaA,
Darmstadt, Germany). A working concentration range of 1–10 µg/ml
was used. Puromycin stock solution was diluted using CCM to
concentrations of 1.5, 3.0, 5.0, 7.0 and 10.0 µg/ml. Culture media
were discarded, and 100 µl of each puromycin concentration was
added to each well. Media containing the selection antibiotic for
each concentration was replaced every 2–3 days for up to 7 days.
Cell viability assay was performed as aforementioned once per day
until day 7 to determine the visual toxicity effect on HepG2 cells.
Three independent experiments were performed.
Determination of functional titer and
MOI range
To establish the functional titer of lentiviral
particles in HepG2 cells, cells were plated at a density of
7×10⁴ cells/well in 24-well plates in duplicate, and
were permitted to reach 40 to 50% confluency by culturing overnight
in humidified 37°C incubator with 5% CO2. The TM
consisted of a 1:1 ratio of DMEM and MEM, 10% FBS and 12 µg/ml
polybrene, and was freshly prepared. Culture medium was removed and
225 µl TM was added to each well of the 24-well plate. Non-targeted
negative control lentiviral particles were diluted to 5-fold serial
dilutions (5, 25, 125, 625, 3,125, 15,625, 78,125 and 390,625 fold)
in a flat-bottom 96-well plate with TM as a diluent, as previously
described (3). This dilution range
was according to the manufacturer's protocol. The diluted viral
stock was incubated at room temperature for 10 to 20 min prior to
the addition of 25 µl diluted lentiviral particles to the plates.
Following incubation for 24 h, 100 µl CCM was added to the wells.
GFP expression in the HepG2 cells was observed under a fluorescence
microscope (Evos XL Core Imaging System; Thermo Fisher Scientific,
Inc.) 48 h after transduction with the pGIPZ lentivirus. To ensure
maximum accuracy and to compensate for multiple transduction events
per cell, the titers were calculated only from transductions with
dilution factors resulting in <25% transduced cells. In
addition, the number of GFP-positive colonies were counted in
duplicate, for two wells infected with two consecutive dilutions.
GFP-positive colonies were counted at ×10 magnification for 3 to 5
random fields using ImageJ software (version 1.41; National
Institutes of Health, Bethesda, MD, USA).
Functional titer was determined using the following
formula: [493 (number of GFP colonies) × 25 (non-targeting control
dilution)]/[0.025 ml (volume of diluted lentiviral particles
used)]=4.9×10⁵ TU/ml. The functional titer of the
non-targeting control was stated in the certificate of analysis
provided by the manufacturer. This functional titer was used in the
calculation of the volume of lentiviral particles required to
infect HepG2 cells at the desired MOI.
HepG2 cell transduction
Three control groups and three shRNA sequences were
established. Each group was set-up in technical triplicate wells.
The control group consisted of HepG2 cells with TM, the positive
control consisted of HepG2 cells and GAPDH-shRNA lentivirus, and
the negative control consisted of HepG2 cells and
non-targeting-shRNA lentivirus. HepG2 cells were cultured in a
96-well plate at a density of 5×10³ cells/well, reached
40–50% confluency following 24 h incubation at 37°C and underwent
transduction using optimized optimal conditions. The lentiviral
particles of sequences 1, 2 and 3 were diluted at
4.9×10⁵ TU/ml functional titer for MOI of 20, 15 and 10
with TM consists of 1 MEM: 1 DMEM, 10% FBS and 12 µg/ml polybrene
(Merck KGaA, Darmstadt, Germany).
The volume of lentivirus required was calculated
using the following formula: i) [5×10³ (number of cells
seeded) × MOI 20]/[4.9×105 TU/ml (functional titer of
HepG2 cells)]=lentiviral volume, and ii) Lentiviral volume (µ1)
×7=final volume of lentiviral stock (µ1).
The lentiviral volume was multiplied to 7 to allow 3
volumes for triplicate wells of MOI 20, 3-fold dilution to achieve
MOI 15, and 10, 5 and 1 volume for liquid overage during pipetting.
The final volume lentiviral stock was calculated for MOI 20. Serial
dilutions were performed for MOI 15, 10 and 5 from the MOI 20
stock. The diluted lentiviral particles were incubated at room
temperature between 10 and 20 min. In total, 50 µl diluted virus
particles were added at the indicated MOIs (20, 15, 10 and 5) and
the cells was incubated at 37°C. After 24 h, 100 µl CCM with no
virus particles was added, and the cells were incubated for an
additional 48 h at 37°C for GFP expression. The cells were
harvested using trypLE (Gibco; Thermo Fisher Scientific, Inc.) and
centrifuged at 500 × g for 10 min at room temperature. The
supernatant was discarded, the pellet was resuspended with 1 ml
selection media (MEM, 10% FBS and 7 µg/ml puromycin) then, cultured
in T25 culture flasks (Merck KGaA). Cells were maintained at 37°C
in a humidified atmosphere containing 5% CO2. Selection
media was replaced every ~2–3 days. The selection media was used
for subsequent experiments to ensure that only stably transduced
cell were cultured.
Reverse transcription-quantitative
polymerase chain reaction (qPCR) analysis
Stably silenced cells from each control and shRNA
group were lysed using TRIzol reagent (Gibco: Thermo Fisher
Scientific, Inc.) and the RNA was extracted according to the
manufacturer's protocol. The extracted RNA was quantified using the
NanoDrop 1000 spectrophotometer (NanoDrop Technologies; Thermo
Fisher Scientific, Inc.). Subsequently, 1 µg total RNA was used as
the template for cDNA synthesis, which was performed using a
QuantiNova Reverse Transcription kit (Qiagen, Inc., Valencia, CA,
USA) according to the manufacturer's protocol. cDNA was amplified
using the QuantiNova SYBR Green real time-PCR kit (Qiagen, Inc.)
and the BioRad iQ5 Multicolour Real-time PCR machine (Bio-Rad
Laboratories, Inc., Hercules, CA, USA). GAPDH was used as an
internal control. Three independent experiments were performed on
the same group. The primer sequences for GAPDH (NM_001256799.2)
forward, 5′-TCCCTGAGCTGAACGGGAAG-3′, and reverse,
5′-GGAGGAGTGGGTGTCGCTGT-3′, yielded a 245 bp product and the primer
sequences for the PRDX4 gene (NM_006406.1) forward,
5′-GCAAAGCGAAGATTTCCAAG-3′ and reverse, 5′-GGCCAAATGGGTAAACTGTG-3′
yielded a 217 bp product.
The PCR conditions were as follows: Initial melting
at 95°C for 2 min; followed by 30 cycles at 95°C for 5 sec; 60°C
for 10 sec; and 95°C for 1 min. The final extension was performed
at 55°C for 10 min. Analysis of the melting curve for the primers
was conducted to confirm the specificity of the PCR product, and
the threshold cycle (Cq) value for triplicate reactions was
averaged. The relative expression of PRDX4 mRNA for each sample was
calculated as follows: ΔCq=Cq (sample)-Cq (GAPDH), ΔΔCq
(sample)=ΔCq (sample)-ΔCq (calibrator). The fold changes in mRNA
were calculated through relative quantification (2−ΔΔCq)
(21).
Western blot analysis
Following selection, transduced cell were washed
three times with cold 1X phosphate buffered saline and lysed using
lysis buffer comprised of protease inhibitors (Promega Corporation,
Madison, WI, USA) and RIPA buffer (Merck KGaA). The cell lysates
were suspended in 200 µl lysis buffer and were incubated on ice for
30 min. Following this, the cell lysate was centrifuged at 18,506 ×
g for 30 min at 4°C and the supernatant was collected. The
extracted proteins were quantified using the Bradford protein assay
(Bio-Rad Laboratories, Inc.). Total protein (40 µg per lane) was
treated with SDS sample buffer and heated at 95°C for 2 min. The
protein samples were separated on a 12% SDS-polyacrylamide gel and
transferred onto polyvinylidene difluoride membranes (GE Healthcare
Life Sciences). The membranes were blocked with 5% skimmed milk
diluted with Tween-20 phosphate buffered saline (TPBS; 998 ml 1X
phosphate buffered saline, 2 ml Tween-20) for 1 h at room
temperature. Then, the membranes were incubated overnight with
primary mouse monoclonal anti-PRDX4 (1:500; cat no. ab68344; Abcam,
Cambridge, UK) and mouse monoclonal anti-β-actin (1:1,000; cat no.
ab8224; Abcam) at 4°C. The membranes were then washed with TPBS at
intervals of 5 min. Following this, the membranes were incubated
with polyclonal secondary horseradish peroxidase-conjugated goat
anti-mouse immunoglobulin G (1:2,500; cat no. ab97023; Abcam) for 1
h at room temperature, followed with three washes with TPBS at 5
min intervals. The bands were visualized using enhanced
chemiluminescence reagents (Advansta, Inc., Menlo Park, CA, USA)
and visualized on a Gel Documentation System (GE Healthcare Life
Sciences). Three independent experiments were performed.
Statistical analysis
GraphPad Prism 5 software (GraphPad Software, Inc.,
La Jolla, CA, USA) was used for data processing. Comparisons
between groups were performed using one-way analysis of variance
followed by the Tukey's multiple range test. Quantitative data are
expressed as the mean ± standard deviation. Figures were generated
using GraphPad Prism 5. P<0.05, P<0.01 and P<0.001 were
considered to indicate a statistically significant difference.
Results
Optimization of basic transduction
conditions
Factors measured included cell density, incubation
time, serum conditions and polybrene concentration. The cell
densities used were 5.0×10³, 7.5×10³ and
10.0×10³ cells/well, and cell confluence was observed
under a light microscope on the following day. The results revealed
that densities of 7.5×10³ and 10.0×10³
cells/well resulted in >50% confluence, while a density of
5.0×10³ cells/well did not. Therefore,
5.0×10³ cells/well was the selected HepG2 cell density
that was used for subsequent experiments. There was no significant
difference when comparing 6 and 24 h of incubation for groups with
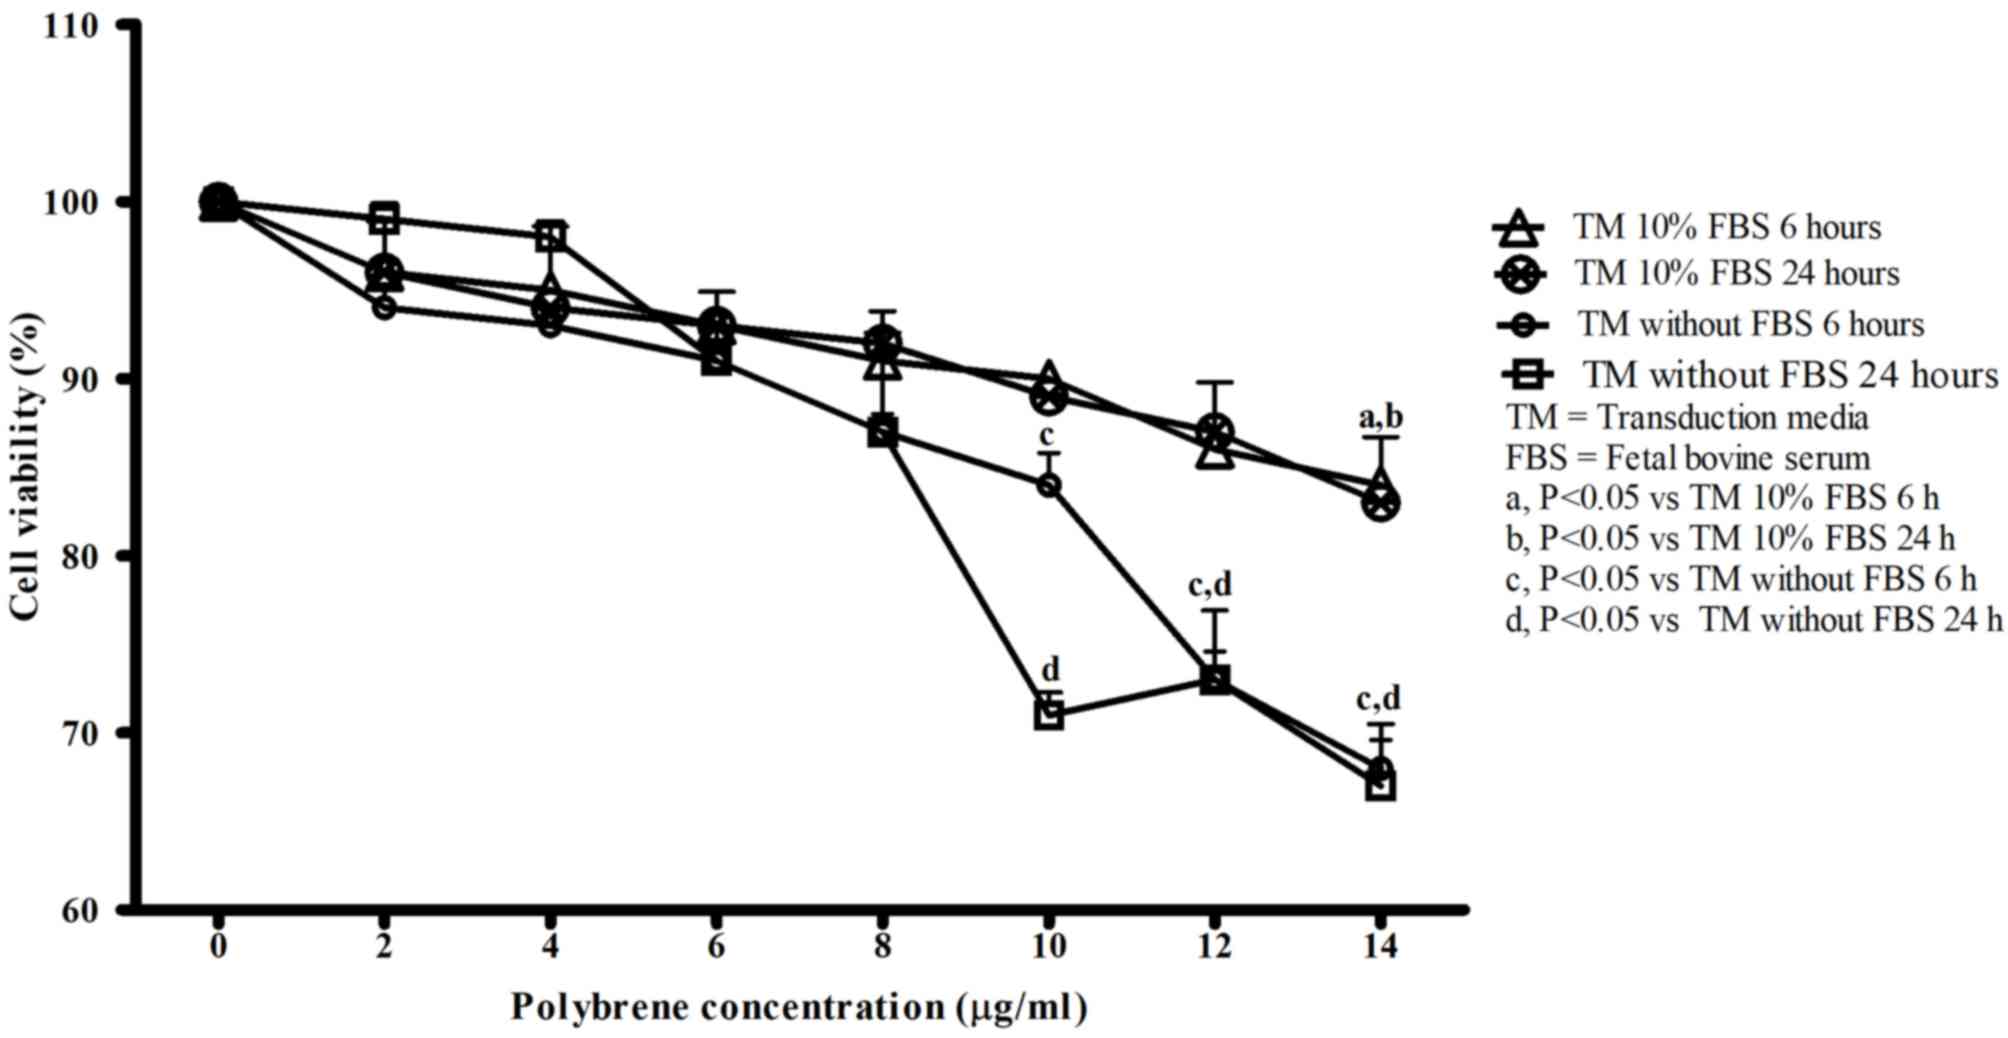
and without FBS in TM. However, as presented in Fig. 2, cells incubated in TM without FBS for
6 and 24 h had decreased cell viability compared with cells
incubated in TM with 10% FBS for 6 and 24 h, with increasing
polybrene concentration. The absence of serum caused polybrene to
significantly reduce cell viability earlier, at 10, 12 and 14 µg/ml
(P<0.001) for the two incubation times. In comparison, when
cells were incubated with TM with 10% FBS, cell viability was only
significantly reduced by 14 µg/ml polybrene (P<0.05). The
highest polybrene concentration which did not affect cell viability
during incubation in TM with 10% FBS was 12 µg/ml. Incubation times
of 6 and 24 h for TM with 10% FBS did not significantly affect cell
viability. An increased duration of exposure to lentivirus may
increase cell transduction efficiency, so an incubation time of 24
h was selected. Thus, a density of 5×10³ cells/well in a
96 well plate, 12 µg/ml polybrene in TM with 10% FBS and a 24 h
incubation time were selected as optimal transduction conditions
for HepG2 cells.
Titration of puromycin
HepG2 cells were subjected to increasing doses of
puromycin from day 3 to 7. The optimal dose was selected. As
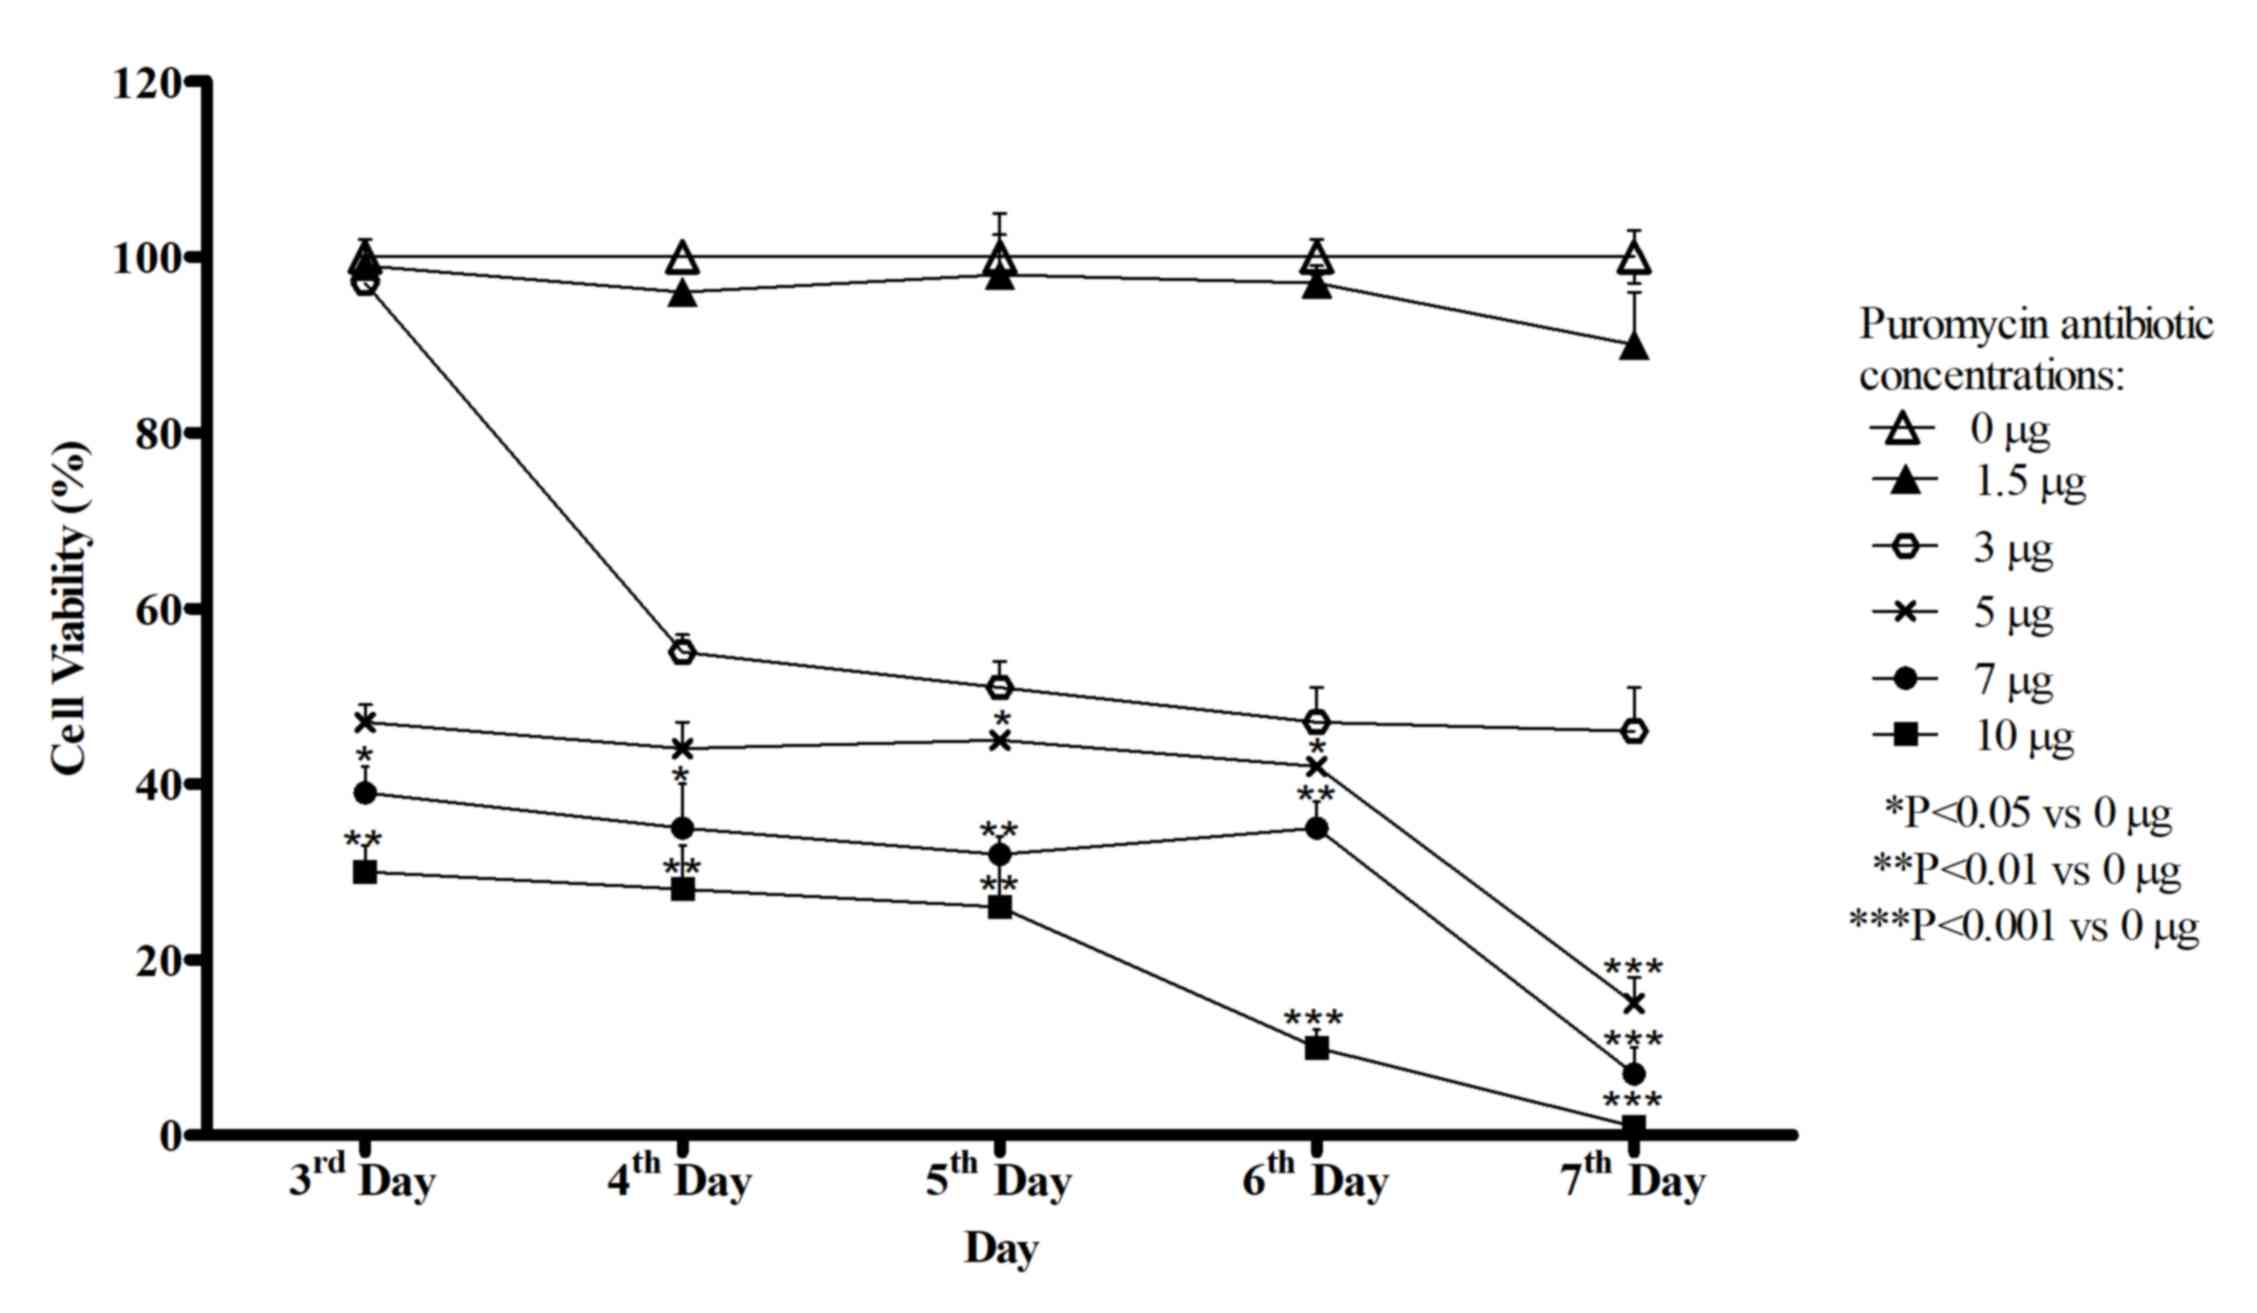
presented in Fig. 3, the viability of
HepG2 cells decreased with increasing doses of puromycin. Based on
a cell viability assay, HepG2 cells exhibited decreased viability
(up to 90% of cell death) at day 7 in response to 7 and 10 µg/ml
puromycin. The optimal puromycin concentration is the lowest dose
that will kill 90–99% non-selected HepG2 cells within 7 days,
therefore a dose of 7 µg/ml puromycin was selected. The transduced
cells were selected and cultured in selection media that consisted
of base media, 10% FBS and 7 µg/ml puromycin to maintain the stable
cell lines generated.
Functional titer and MOI range
determination
Serial dilutions (5-fold) of the non-targeting
lentiviral control were transduced into HepG2 cells in duplicate,
and the number of colonies positive for GFP were used to calculate
functional titer. GFP-positive colonies were counted at the low
dilution of 25X and 125X, while no GFP colonies were generated for
dilutions of 625X to 390,635X (Fig.
4A). A functional titer of 4.9×10⁵ lentiviral
particles was obtained. The optimized functional titer and
transduction conditions were used to transduce a GAPDH positive
control, a non-targeting negative control and three PRDX4-shRNAs
with different sequences at MOI 20, 15, 10 and 5. The results
revealed that no GFP-positive colonies were generated from the
control group for all MOIs, whereas for the GAPDH positive control
group and non-targeting negative control group, GFP was generated
for all MOIs (Fig. 4B). Transduced
colonies decreased as MOI decreased, and only MOI of 20, 15 and 10
were positive for GFP when transduced with shRNA 1, 2 and 3.
Therefore, MOI 20, 15 and 10 were used to transduce HepG2 cells for
subsequent experiments. An overlay of transduced cells with
generated GFP colonies and a comparison of transduced and
non-transduced HepG2 cells is presented in Fig. 4C. The transduced cells have clumpy
morphology and are slower growing compared with non-transduced
cells.
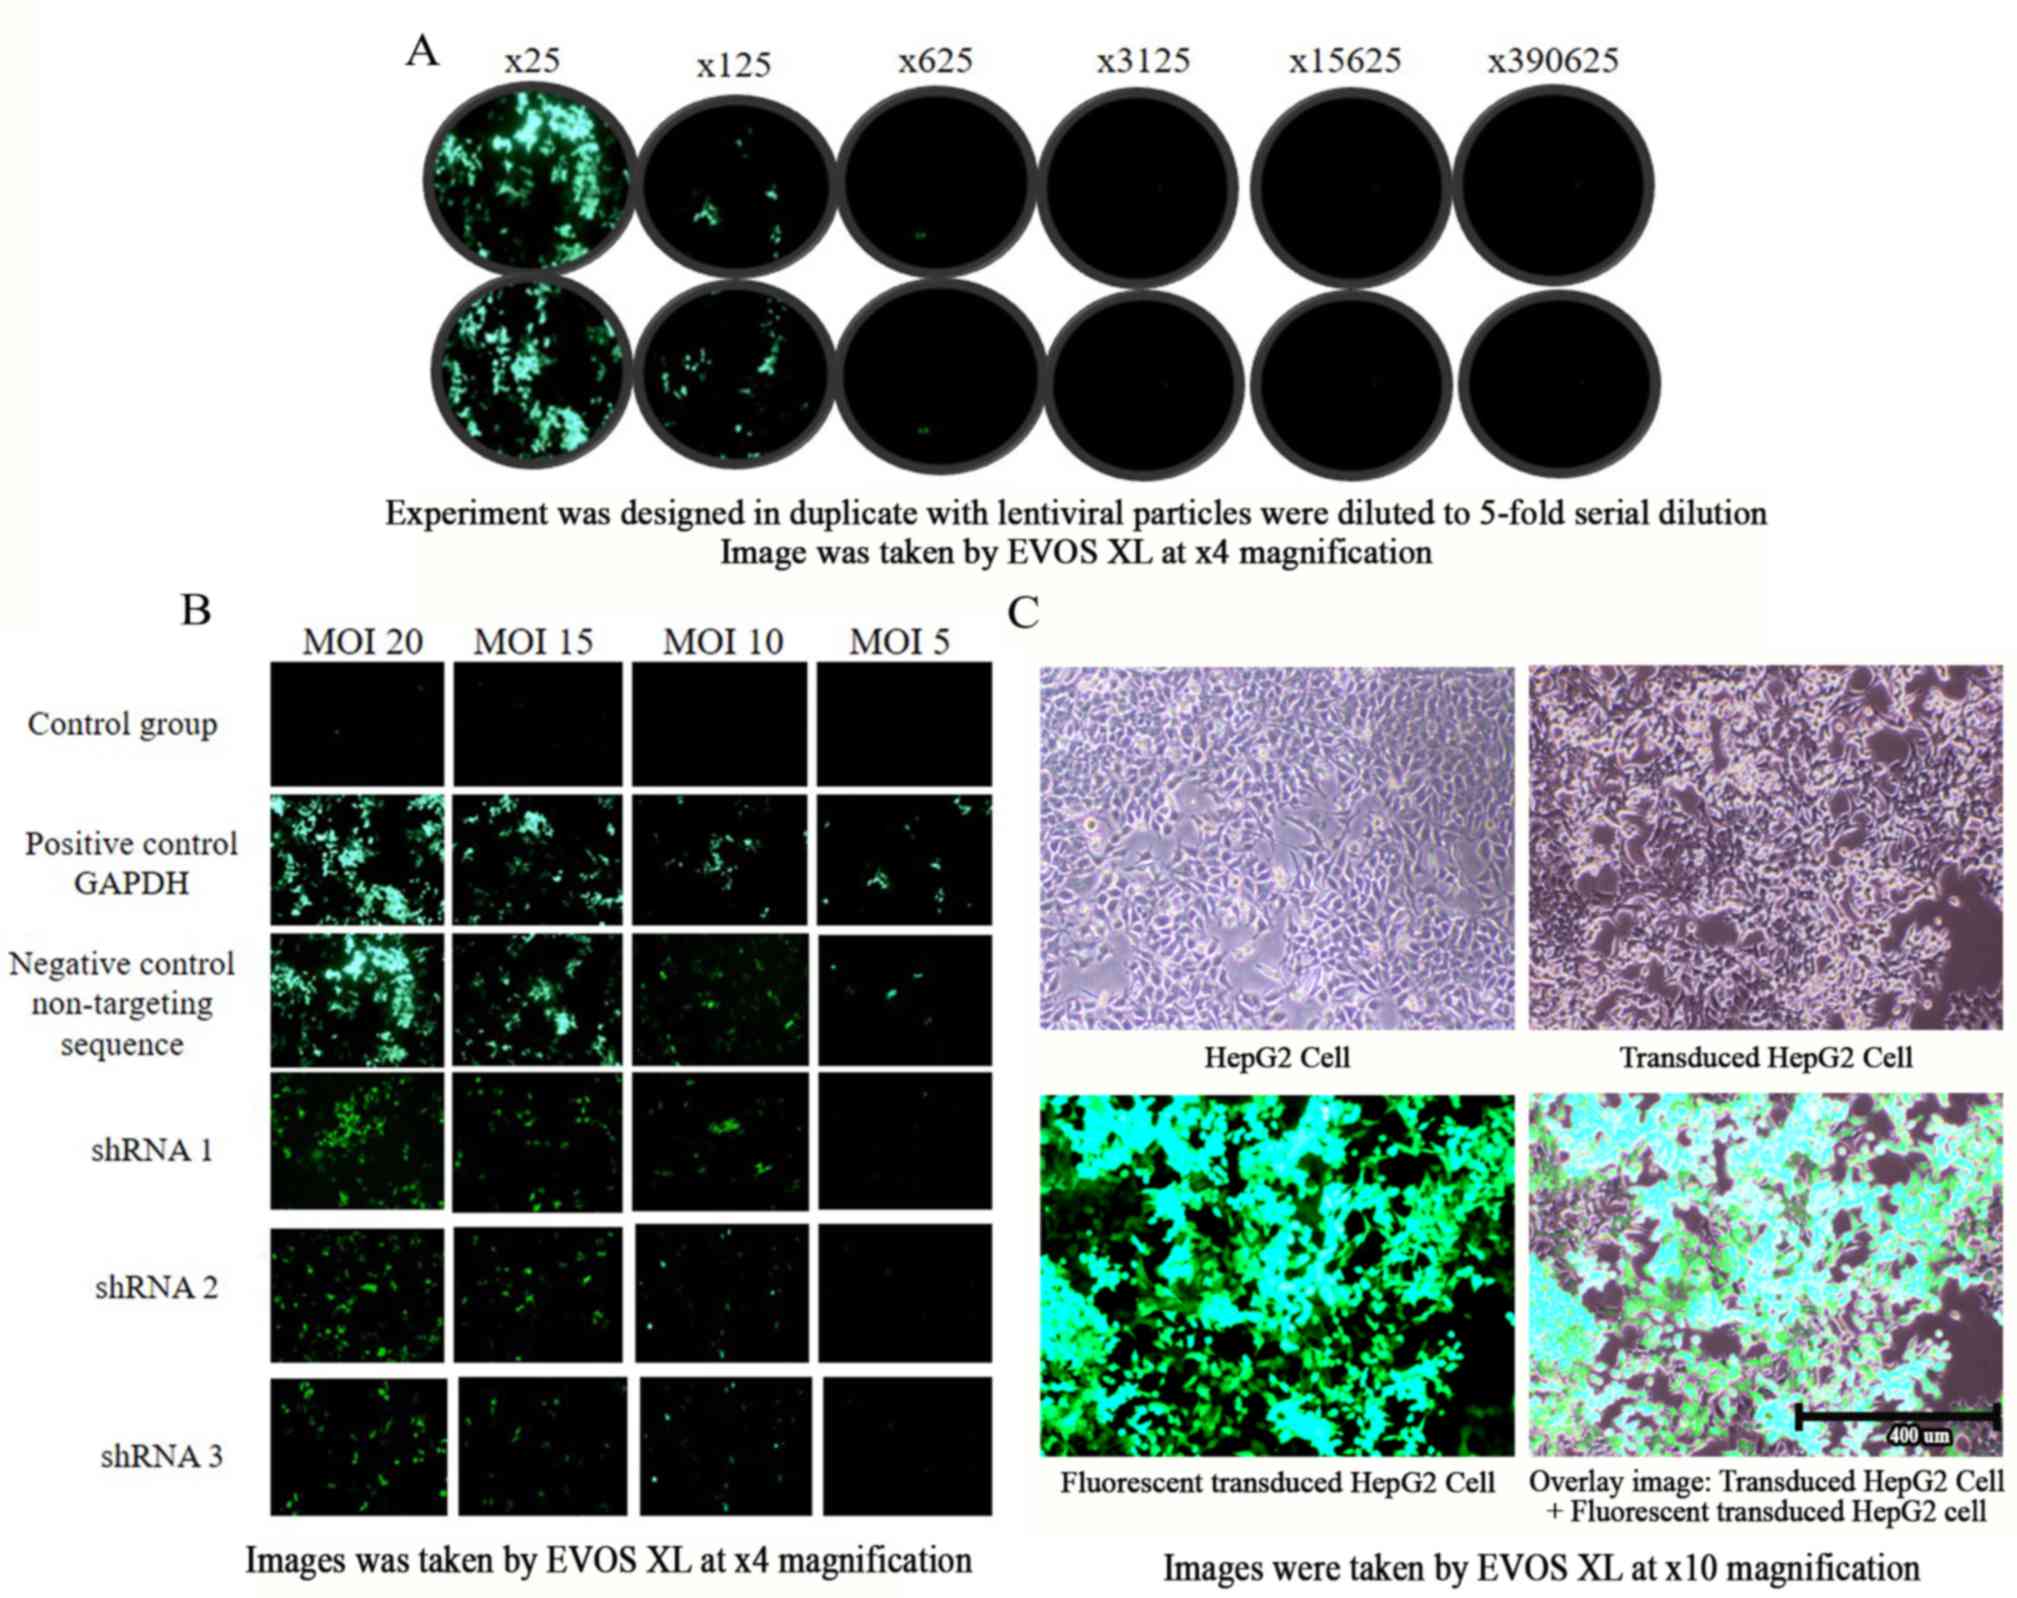 | Figure 4.Green fluorescent protein expression
of HepG2 cells under a fluorescence microscope, EVOS XL. (A)
Functional titer determination. The experiment was designed in
duplicate with lentiviral particle were to 5-fold serial dilutions
as follows: ×25, ×125, ×625, ×3125, ×15625 and ×390625. Image was
taken by fluorescent microscope, EVOS XL (magnification, ×40). (B)
MOI range of HepG2 cells. Image was taken by fluorescent
microscope, EVOS XL (magnification, ×40). (C) Overlaid image of
transduced and non-transduced HepG2 cells (magnification, ×10). The
scale bar represents 400 µm. MOI, multiplicity of infection; shRNA,
small hairpin ribonucleic acid. |
PRDX4 gene expression
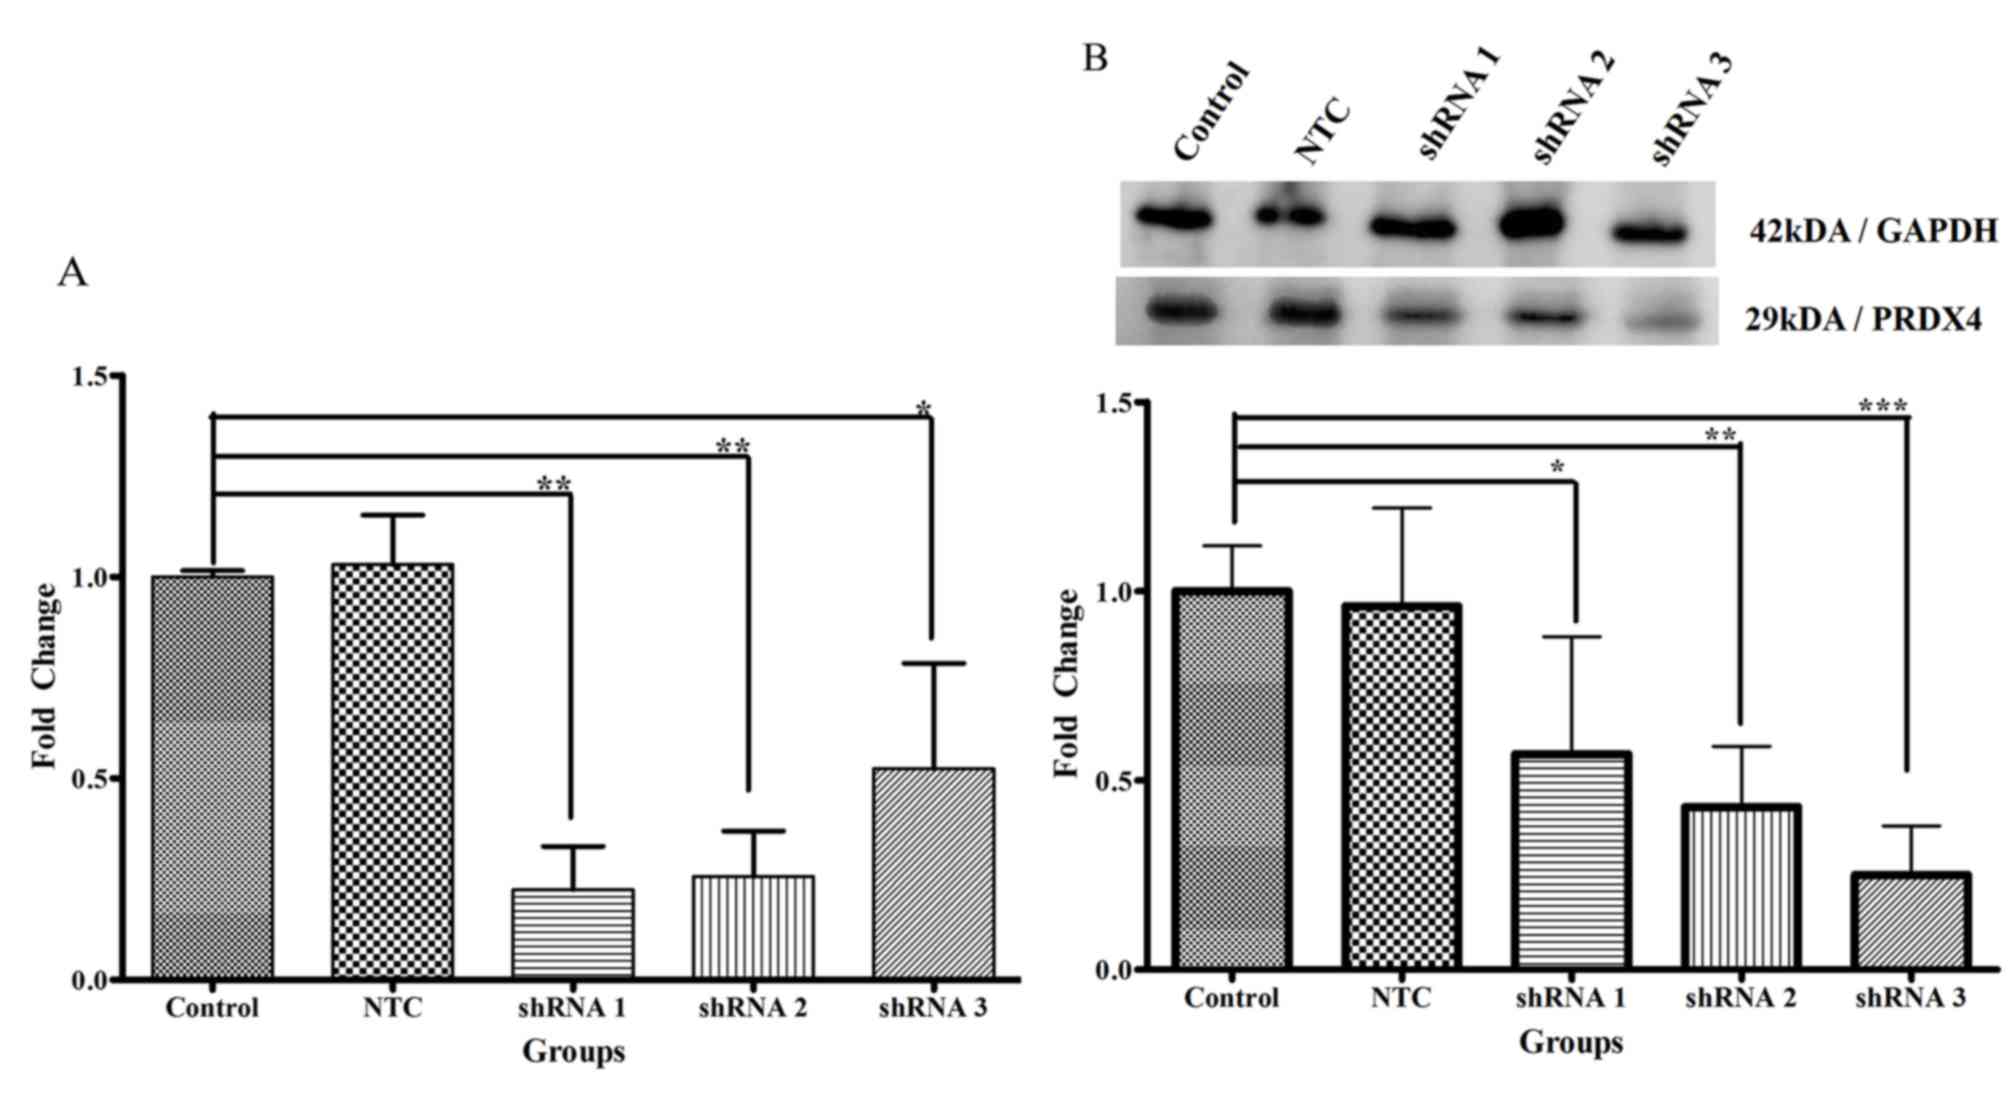
Following transduction for 48 h, shRNA 1 (P<0.01)
and 2 (P<0.01) was significantly reduced PRDX4 mRNA expression,
up to 8-fold, whereas shRNA 3 resulted in a 5-fold reduction
compared with the control group (P<0.05; Fig. 5A). Expression in the non-targeting
control transduction and control groups was not significantly
different. PRDX4 mRNA expression levels in the negative control,
shRNA 1, shRNA 2 and shRNA 3 groups were 1.03±0.12, 0.22±0.11,
0.26±0.11 and 0.52±0.26, respectively. PRDX4 mRNA levels were the
lowest in the cells treated with PRDX4-shRNA 1 and shRNA 2 compared
with the control group.
PRDX4 protein expression
Transduction with shRNA 1 (P<0.05), 2 (P<0.01)
and 3 (P<0.001) for 48 h resulted in a significant reduction of
PRDX4 protein expression (5, 6 and 8-fold, respectively) compared
with the control group (Fig. 5B).
PRDX4 protein expression levels for the non-targeting control,
shRNA 1, shRNA 2 and shRNA 3 were 0.96±0.26, 0.57±0.31, 0.43±0.16
and 0.25±0.13. Compared with the control group, PRDX4 protein
expression levels were lowest in the cells transduced with
PRDX4-shRNA 3.
Discussion
Stable cell lines were generated when GIPZ
lentiviral DNA integrated into the host genome and permanently
expressed the shRNA as the cells divided. Several factors affected
transduction efficiency, including cell density, polybrene
concentration, incubation time, serum condition and antibiotic
selection dose. The best optimization method should consist of at
least two potential shRNA sequences that silence the target gene.
This would provide control for off-target knockdowns, since it is
unlikely for different sequences to produce the same off-target
effects, which increasing the potential for successful gene
knockdown (22). Furthermore,
optimized shRNA constructs require a relatively low copy number of
lentiviral particles, resulting in fewer off-target effects and a
reduction in unwanted silencing effects (23). A good experimental design consists of
a positive control, negative control and untreated control to
further validate the significant and specific silencing effect
(24,25). GFP colonies were generated when the
GIPZ GAPDH positive control was transduced into HepG2 cells
(Fig. 4B). This confirmed that the
plasmid construct was successfully delivered into the cells and
activated the RNA interference pathway without affecting cell
viability or function (26).
Well-characterized positive controls target the housekeeping genes
that are abundantly expressed in the cells. This demonstrated that
expression was neither affected by experimental treatments nor
fluctuated with the cell cycle. One of the major problems faced by
shRNA delivery in mammalian systems is the probability of
triggering off-target effects, inconsistent phenotypes and cellular
toxicity due to interactions between sense and antisense shRNA
strands (27–29). Thus, GIPZ non-targeting negative
controls (NTC) are important to distinguish sequence-specific
silencing from off-target effects. The NTC sequence does not match
with known mammalian genes, having at least three or more
mismatches against any gene as determined via nucleotide alignment.
An ideal NTC sequence produces a minimal effect on cell viability,
and mRNA and protein expression levels should remain comparable
with the control (Fig. 5A and B).
When the NTC is comparable with the control group, it is possible
to conclude that the gene knockdown is specific and that any
downstream effect can be attributed to silencing of the target
gene. Furthermore, it is possible to measure transduction
efficiency by assessing the number of GFP-positive colonies
following transfection with NTC shRNA (Fig. 4A). Untreated control determines the
baseline level of cell viability and target gene level compared
with NTC control (Fig. 5A and B).
Efficient shRNA delivery into cells is paramount.
There should be enough shRNA production to create gene knockdown at
a concentration that does not over activate the RISC complex or
result in toxic effects to the cells. Vector-based shRNA
transduction allows the long-term downregulation of target genes
and but may have variable transduction efficiency, since it is cell
type-dependent. Lentiviral vectors, enhanced promoters and GIPZ
shRNA are elements that serve essential functions in the
maximization of efficient shRNA production in HepG2 cells, and may
increase the probability of transduction events occurring (30,31).
Lentiviral-based vectors with human (h)CMV enhancer have been
reported to infect up to 95% of HepG2 cells and stably integrate
into the host genome for long-term transgene expression (32–34). In
addition, lentiviral vectors result in low toxicity and high
stability with no effect on cell phenotype or cell type (35,36). GIPZ
shRNA design is based on native microRNA-30 primary transcripts to
enable processing by endogenous RNA interference pathways,
resulting in specific silencing and minimized cellular toxicity
(37,38). In addition, the presence of selectable
markers, which are a puromycin resistance gene and a GFP gene
reporter, assist in selecting a stable cell line with an
incorporated vector and expression of the inserted gene to be
cultured. To achieve successful gene silencing, screening >2
shRNA fragments and scaling down to a single fragment which
regulates high levels of transcription may increase the silencing
effect. Silencing activity does not only depend on the shRNA being
100% complementary to the target gene, but also on the location
where shRNA binding occurs. Different shRNA fragments have random
integration sites and will generate a variety of dependent
expression levels (39). The present
study was initiated by the construction of three different shRNA
sequences targeting PRDX4, and later transduced into HepG2 cells
using polybrene to improve the efficiency. Finally, one shRNA
demonstrated the required effect.
Cell density, polybrene concentration, incubation
time and transduction media conditions should be systematically
examined for every cell type and, once optimized, must be kept
constant in all future experiments to ensure reproducible results.
Previous studies have stated that HepG2 cells line maintained the
same expression of drug metabolizing enzymes compared with that in
primary hepatocytes until passage 16 (40,41).
Healthy, actively dividing cells take up foreign nucleic acids more
efficiently than quiescent cells (42). Thus, it is advisable to select cell
lines with <16 passages that are actively dividing for this
approach. It is recommended to maintain the cells at least 24 h
prior initiating the transduction procedure, to ensure they are in
optimum physiological condition for transduction. A cell confluency
>50% is considered to be over-confluent and may cause contact
inhibition, resulting in poor uptake of nucleic acids, thus
decreasing the expression of the transduced gene. However, too few
cells in the culture may result in poor growth without cell-to-cell
contact (43). In the present study,
the transduction process took at least 96 h for the cells to grow,
thus, maintaining a standard seeding protocol from each experiment
will ensure that optimal confluence is reliably achieved.
Generally, a density of 5×10³ cells/well seeded in a
96-well plate reached ~40–50% confluence after 24 h, providing
optimized results for the HepG2 cell line.
A previous study reported that the addition of
polybrene to cells in serum-free media with enhanced lentiviral
transduction efficiency by 2–10-fold (11). However, serum free media and high
concentration of polybrene may reduce cell viability due to the
toxic conditions. Thus, MTS assays were conducted on non-transduced
cells to determine the effect of transduction media condition on
cell viability. FBS provides a higher transduction efficiency
compared with bovine calf serum (9).
However, while the presence of serum in culture media boosts cell
growth, it also increases the chance of endotoxin contamination. It
is important to control for variability among the different brands
of serum, as the quality can significantly affect cell growth and
transduction results. In contrast, heat inactivation of FBS did not
exert a discernible effect on the efficiency of lentiviral
transduction (9). The results
obtained demonstrated that an absence of serum in the culture media
reduced HepG2 cell viability following incubation for 6 and 24 h,
compared with cells incubated in the presence of serum (Fig. 2). Thus, TM with 10% FBS is used to
transduce HepG2 cells. Cellular and viral lipid membranes possess a
net-negative charge. The addition of cationic polymers, including
polybrene, to TM has been suggested since these polymers bind to
the cell surface and neutralize the surface charge, increasing
transduction efficiency by enhancing adsorption of the lentiviral
particles. High polybrene concentrations increase the probability
of transduction events, however, these may also reduce cell
viability. Thus, the optimal concentration of polybrene needs to be
determined to avoid toxicity to the cells. The highest polybrene
concentration of TM with 10% FBS which did not significantly
reduced HepG2 cell viability was 12 µg/ml. If the polybrene
concentration failed to induce significant cellular toxicity after
24 h incubation, this incubation time may be used for subsequent
transductions (44). Incubation for 6
and 24 h with 10% FBS did not affect cell viability in the present
study. In addition, an increased duration of exposure to the
lentivirus will maximize lentiviral infection, increasing
transduction efficiency (12).
A GIPZ lentiviral construct that encodes for a
puromycin resistance gene will only allow the transduced cells to
grow in culture with puromycin, which will kill non-transduced
cells by interrupting their protein synthesis. Construction of a
kill curve is recommended since puromycin concentration is cell
type-dependent. The kill curve construction involved a
dose-response experiment where non-transduced cells were subjected
to increasing concentrations of puromycin to determine the minimum
antibiotic concentration needed to kill all cells over the course
of 3–7 days. Puromycin reached optimum effectiveness after 48 h of
selection and, in general, it took 7 days for a single transduced
colony to form a population of transduced HepG2 cells. The
selection medium, which was comprised of base medium, 10% FBS and
the optimized puromycin concentration (7 µg/ml) was changed daily
for a week. This eliminated potentially toxic substances produced
by the dying cells and maintained the concentration of the
antibiotic at a constant level during the selection process.
Antibiotic dosage is considered low when minimal visual toxicity is
apparent even after 7 days of antibiotic exposure, while the
antibiotic dose is considered high when visual toxicity is evident
within the first 2–3 days of antibiotic selection. The optimal dose
of puromycin was 7 µg/ml, which was the lowest antibiotic
concentration to kill 90–99% of cells (Fig. 3) after 7 days of antibiotic
selection.
The most critical factor to determine for successful
lentiviral transduction is the functional titer. The functional
titer is referred as smallest transduction unit of virus capable of
infecting susceptible cells and expressing the transgene per ml
solution (TU/ml). Serial dilution of non-targeting lentiviral stock
helped to determine the optimal concentration of functional
lentiviral required in HepG2 cells. The functional titer was
4.9×10⁵ TU/ml, and was calculated from a number of GFP
transduced colonies developed after 48 h transduction. An optimized
functional titer only requires a relatively small volume of
lentiviral particles to transduce cells at a constant ratio,
referred as multiplicity of infection (MOI), and thus increases
transduction efficiency. One of the factors that affects the
functional titer is shRNA production. A potent promoter and vector
are essential to produce sufficient amounts of shRNA in HepG2
cells, in order to maximize transduction efficiency. Low shRNA
production will cause transduction to be suboptimal, and higher
levels of shRNA production may inhibit transduction. Functional
titer is also cell type-dependent. Each cell has different level of
susceptibility towards lentiviral infection (45) and an actively dividing cell line would
give a higher transduction rate than non-dividing types of cell
(46). One of the major advantages of
the lentiviral delivery method is the ability to control the number
of viral genomes that enter HepG2 cells by adjusting the MOI. It is
important to note that different cell types may require different
MOIs for knockdown of the target gene. The sensitivity of cells to
lentiviral infection is MOI-dependent: The higher the MOI, the
higher the transduction efficiency. To obtain optimal expression, a
range of MOIs from 20, 15, 10 and 5 were tested on HepG2 cells in
the present study. The results obtained revealed that only MOI 20,
15 and 10 result in significant levels of cell transduction
(Fig. 4B). Constant MOIs of 20, 15
and 10 were used to transduce the HepG2 cells with a
4.9×10⁵ TU/ml functional titer. Working in the smallest
well format and volume helps achieve higher MOI, by using fewer
lentiviral particles to increase transduction efficiency.
Although shRNA functions at the mRNA level,
ultimately it is the reduction in protein level that causes the
observed phenotype. Therefore, validation of gene silencing was
assessed by measuring the corresponding protein and gene reduction
using western blot analysis and qPCR (47). Gene silencing mediated by mRNA may
occur at three stages, including pre-translational,
co-translational, and post-translational steps, which exert direct
and indirect effects on translation machinery (48). This justifies the non-corresponding
effect of PRDX4 silencing on protein reduction at the mRNA level
measured following transfection with each shRNA sequence,
suggesting that PRDX4 expression was not regulated at the mRNA
level. mRNA levels have been demonstrated to not always be
associated with protein expression levels, for example those
observed in human liver tissue (49,50). These
studies emphasized the probabilities of post-transcriptional or
post-translational modifications, and additional unknown regulatory
mechanisms and signaling. Furthermore, different shRNA integration
sites may affect the level of expression. The use of lentiviral
vectors provides a novel method by which HepG2 cells may be stably
genetically manipulated, with minimal effects on the differentiated
hepatic phenotype. Lentiviral infection has previously been
demonstrated to not affect hepatic hallmarks, including the
expression of the nuclear receptors CXADR, Ig-like cell adhesion
molecule, nuclear receptor subfamily 1 group I member 2, retinoid C
receptor α, and hepatocyte nuclear factor 4α, or albumin
expression. Furthermore, HepG2 cells demonstrated that transgene
expression is preserved through cell division and is retained for
the duration of the culture period (36).
In conclusion, the optimal transduction conditions,
which include cell density, polybrene concentration, transduction
media condition, incubation time and selective antibiotic dose,
were identified to produce a HepG2 cell line with stably silenced
PRDX4. The results demonstrated that shRNA 3 significantly
suppressed PRDX4 expression at the mRNA and protein level, and this
shRNA was therefore used in subsequent experiments. This model may
be used to test the effect of nutritional interventions on
hepatoblastoma, and may lead to improved understanding of treatment
strategies for hepatoblastoma and also for patients with liver
cancer in general.
Acknowledgements
The present study was funded by National University
of Malaysia Medical Centre (grant no. FF-2016-063) and the Ministry
of Higher Learning under the Fundamental Research Grant Scheme
(grant no. UKM-AP-2014-024).
Competing interests
The authors declare that they have no competing
interests.
References
|
1
|
Manjunath N, Haoquan W, Sandesh S and
Premlata S: Lentiviral delivery of short hairpin RNAs. Adv Drug
Deliv Rev. 61:732–745. 2009. View Article : Google Scholar : PubMed/NCBI
|
|
2
|
Aigner A: Gene silencing through RNA
interference (RNAi) in vivo: Strategies based on the direct
application of siRNAs. J Biotechnol. 124:12–25. 2006. View Article : Google Scholar : PubMed/NCBI
|
|
3
|
López-Terrada D, Cheung SW, Finegold MJ
and Knowles BB: HepG2 is a hepatoblastoma-derived cell line. Hum
Pathol. 40:1512–1515. 2009. View Article : Google Scholar
|
|
4
|
Pang RTK, Poon TCW, Wong N, Lai PBS, Wong
NLY, Chan CML, Yu JSW, Chan ATC and Sung JJY: Comparison of protein
expression patterns between hepatocellular carcinoma cell lines and
a hepatoblastoma cell line. Clin Proteomics. 1:313–331. 2004.
View Article : Google Scholar
|
|
5
|
Le Bihan O, Chèvre R, Mornet S, Garnier B,
Pitard B and Lambert O: Probing the in vitro mechanism of action of
cationic lipid/DNA lipoplexes at a nanometric scale. Nucleic Acids
Res. 39:1595–1609. 2011. View Article : Google Scholar : PubMed/NCBI
|
|
6
|
Cesaratto L, Vascotto C, D'Ambrosio C,
Scaloni A, Baccarani U, Paron I, Damante G, Calligaris S,
Quadrifoglio F, Tiribelli C and Tell G: Overoxidation of
peroxiredoxins as an immediate and sensitive marker of oxidative
stress in HepG2 cells and its application to the redox effects
induced by ischemia/reperfusion in human liver. Free Radic Res.
39:255–268. 2005. View Article : Google Scholar : PubMed/NCBI
|
|
7
|
Sazli Abdul Rahman F, Jubri Z, Rahman
Abdul M, Karsani SA, Top Md AG and Ngah Wan WZ: Gamma-tocotrienol
treatment increased peroxiredoxin-4 expression in HepG2 liver
cancer cell line. BMC Complement Altern Med. 15:642015. View Article : Google Scholar : PubMed/NCBI
|
|
8
|
Ito R, Takahashi M, Ihara H, Tsukamoto H,
Fujii J and Ikeda Y: Measurement of peroxiredoxin-4 serum levels in
rat tissue and its use as a potential marker for hepatic disease.
Mol Med Rep. 6:379–384. 2012. View Article : Google Scholar : PubMed/NCBI
|
|
9
|
Denning W, Das S, Guo S, Xu J, Kappes JC
and Hel Z: Optimization of the transductional efficiency of
lentiviral vectors: Effect of sera and polycations. Mol Biotechnol.
53:308–314. 2013. View Article : Google Scholar : PubMed/NCBI
|
|
10
|
Logan AC, Nightingale SJ, Haas DL, Cho GJ,
Pepper KA and Kohn DB: Factors influencing the titer and
infectivity of lentiviral vectors. Hum Gene Ther. 15:976–988. 2004.
View Article : Google Scholar : PubMed/NCBI
|
|
11
|
Davis HE, Rosinski M, Morgan JR and
Yarmush ML: Charged polymers modulate retrovirus transduction via
membrane charge neutralization and virus aggregation. Biophys J.
86:1234–1242. 2004. View Article : Google Scholar : PubMed/NCBI
|
|
12
|
Morgan JR, LeDoux JM, Snow RG, Tompkins RG
and Yarmush ML: Retrovirus infection: Effect of time and target
cell number. J Virol. 69:6994–7000. 1995.PubMed/NCBI
|
|
13
|
Andreadis S, Lavery T, Davis HE, Le Doux
JM, Yarmush ML and Morgan JR: Toward a more accurate quantitation
of the activity of recombinant retroviruses: Alternatives to titer
and multiplicity of infection. J Virol. 74:1258–1266. 2000.
View Article : Google Scholar : PubMed/NCBI
|
|
14
|
Dokka S, Toledo D, Shi X, Ye J and
Rojanasakul Y: High-efficiency gene transfection of macrophages by
lipoplexes. Int J Pharm. 206:97–104. 2000. View Article : Google Scholar : PubMed/NCBI
|
|
15
|
Zhang B, Metharom P, Jullie H, Ellem KA,
Cleghorn G, West MJ and Wei MQ: The significance of controlled
conditions in lentiviral vector titration and in the use of
multiplicity of infection (MOI) for predicting gene transfer
events. Genet Vaccines Ther. 2:62004. View Article : Google Scholar : PubMed/NCBI
|
|
16
|
Taxman DJ, Livingstone LR, Zhang J, Conti
BJ, Iocca HA, Williams KL, Lich JD, Ting JP and Reed W: Criteria
for effective design, construction, and gene knockdown by shRNA
vectors. BMC Biotechnol. 6:72006. View Article : Google Scholar : PubMed/NCBI
|
|
17
|
Takasaki S, Kotani S and Konagaya A: An
effective method for selecting siRNA target sequences in mammalian
cells. Cell Cycle. 3:790–795. 2004. View Article : Google Scholar : PubMed/NCBI
|
|
18
|
Luria SE: Cell susceptibility to viruses.
Ann N Y Acad Sci. 61:852–855. 1955. View Article : Google Scholar : PubMed/NCBI
|
|
19
|
Yang L, Bailey L, Baltimore D and Wang P:
Targeting lentiviral vectors to specific cell types in vivo. Proc
Natl Acad Sci USA. 103:11479–11484. 2006. View Article : Google Scholar : PubMed/NCBI
|
|
20
|
Gupta S, Schoer RA, Egan JE, Hannon GJ and
Mittal V: Inducible, reversible, and stable RNA interference in
mammalian cells. Proc Natl Acad Sci USA. 101:1927–1932. 2004.
View Article : Google Scholar : PubMed/NCBI
|
|
21
|
Healthcare G: Technical manual: GIPZ
Lentiviral shRNA. Thermo Sci. 2015.
|
|
22
|
Livak KJ and Schmittgen TD: Analysis of
relative gene expression data using real-time quantitative PCR and
the 2(-Delta Delta C(T)) method. Methods. 25:402–408. 2001.
View Article : Google Scholar : PubMed/NCBI
|
|
23
|
Moore CB, Guthrie EH, Huang MT and Taxman
DJ: Short hairpin RNA (shRNA): Design, delivery, and assessment of
gene knockdown. Methods Mol Biol. 629:141–158. 2010.PubMed/NCBI
|
|
24
|
Svoboda P: Off-targeting and other
non-specific effects of RNAi experiments in mammalian cells. Curr
Opin Mol Ther. 9:248–257. 2007.PubMed/NCBI
|
|
25
|
Huppi K, Martin SE and Caplen NJ: Defining
and assaying RNAi in mammalian cells. Mol Cell. 17:1–10. 2005.
View Article : Google Scholar : PubMed/NCBI
|
|
26
|
Whither RNAi. Nat Cell Biol. 5:489–490.
2003. View Article : Google Scholar : PubMed/NCBI
|
|
27
|
Goncz KK, Gruenert DC and Colosimo A:
Expression vector system and a method for optimization and
confirmation of DNA delivery and quantification of targeting
frequency. Journal. 2005.
|
|
28
|
Feng Y, Nie L, Thakur MD, Su Q, Chi Z,
Zhao Y and Longmore GD: A multifunctional lentiviral-based gene
knockdown with concurrent rescue that controls for off-target
effects of RNAi. Genomics Proteomics Bioinformatics. 8:238–245.
2010. View Article : Google Scholar : PubMed/NCBI
|
|
29
|
Jackson AL and Linsley PS: Noise amidst
the silence: Off-target effects of siRNAs? Trends Genet.
20:521–524. 2004. View Article : Google Scholar : PubMed/NCBI
|
|
30
|
Snøve O Jr and Holen T: Many commonly used
siRNAs risk off-target activity. Biochem Biophys Res Commun.
319:256–263. 2004. View Article : Google Scholar : PubMed/NCBI
|
|
31
|
Matveeva O, Nechipurenko Y, Rossi L, Moore
B, Saetrom P, Ogurtsov AY, Atkins JF and Shabalina SA: Comparison
of approaches for rational siRNA design leading to a new efficient
and transparent method. Nucleic Acids Res. 35:e632007. View Article : Google Scholar : PubMed/NCBI
|
|
32
|
ter Brake O, 't Hooft K, Liu YP, Centlivre
M, von Eije KJ and Berkhout B: Lentiviral vector design for
multiple shRNA expression and durable HIV-1 inhibition. Mol Ther.
16:557–564. 2008. View Article : Google Scholar : PubMed/NCBI
|
|
33
|
Nasri M, Karimi A and Farsani
Allahbakhshian M: Production, purification and titration of a
lentivirus-based vector for gene delivery purposes. Cytotechnology.
66:1031–1038. 2014. View Article : Google Scholar : PubMed/NCBI
|
|
34
|
Nash KL, Jamil B, Maguire AJ, Alexander GJ
and Lever AM: Hepatocyte-specific gene expression from integrated
lentiviral vectors. J Gene Med. 6:974–983. 2004. View Article : Google Scholar : PubMed/NCBI
|
|
35
|
Nishitsuji H, Ikeda T, Miyoshi H, Ohashi
T, Kannagi M and Masuda T: Expression of small hairpin RNA by
lentivirus-based vector confers efficient and stable
gene-suppression of HIV-1 on human cells including primary
non-dividing cells. Microbes Infect. 6:76–85. 2004. View Article : Google Scholar : PubMed/NCBI
|
|
36
|
Rao DD, Vorhies JS, Senzer N and
Nemunaitis J: siRNA vs. shRNA: Similarities and differences. Adv
Drug Deliv Rev. 61:746–759. 2009. View Article : Google Scholar : PubMed/NCBI
|
|
37
|
Zamule SM, Strom SC and Omiecinski CJ:
Preservation of hepatic phenotype in lentiviral-transduced primary
human hepatocytes. Chem Biol Interact. 173:179–186. 2008.
View Article : Google Scholar : PubMed/NCBI
|
|
38
|
Lim LP, Lau NC, Garrett-Engele P, Grimson
A, Schelter JM, Castle J, Bartel DP, Linsley PS and Johnson JM:
Microarray analysis shows that some microRNAs downregulate large
numbers of target mRNAs. Nature. 433:769–773. 2005. View Article : Google Scholar : PubMed/NCBI
|
|
39
|
Li L, Lin X, Khvorova A, Fesik SW and Shen
Y: Defining the optimal parameters for hairpin-based knockdown
constructs. RNA. 13:1765–1774. 2007. View Article : Google Scholar : PubMed/NCBI
|
|
40
|
McIntyre GJ, Arndt AJ, Gillespie KM, Mak
WM and Fanning GC: A comparison of multiple shRNA expression
methods for combinatorial RNAi. Genet Vaccines Ther. 9:92011.
View Article : Google Scholar : PubMed/NCBI
|
|
41
|
Westerink WM and Schoonen WG: Phase II
enzyme levels in HepG2 cells and cryopreserved primary human
hepatocytes and their induction in HepG2 cells. Toxicol In Vitro.
21:1592–1602. 2007. View Article : Google Scholar : PubMed/NCBI
|
|
42
|
Wilkening S and Bader A: Influence of
culture time on the expression of drug-metabolizing enzymes in
primary human hepatocytes and hepatoma cell line HepG2. J Biochem
Mol Toxicol. 17:207–213. 2003. View Article : Google Scholar : PubMed/NCBI
|
|
43
|
Prijic S and Sersa G: Magnetic
nanoparticles as targeted delivery systems in oncology. Radiol
Oncol. 45:1–16. 2011. View Article : Google Scholar : PubMed/NCBI
|
|
44
|
Song H and Yang PC: Construction of shRNA
lentiviral vector. N Am J Med Sci. 2:598–601. 2010. View Article : Google Scholar : PubMed/NCBI
|
|
45
|
Wotherspoon S, Dolnikov A, Symonds G and
Nordon R: Susceptibility of cell populations to transduction by
retroviral vectors. J Virol. 78:5097–5102. 2004. View Article : Google Scholar : PubMed/NCBI
|
|
46
|
Johnston JC, Gasmi M, Lim LE, Elder JH,
Yee JK, Jolly DJ, Campbell KP, Davidson BL and Sauter SL: Minimum
requirements for efficient transduction of dividing and nondividing
cells by feline immunodeficiency virus vectors. J Virol.
73:4991–5000. 1999.PubMed/NCBI
|
|
47
|
Orang Valinezhad A, Safaralizadeh R and
Kazemzadeh-Bavili M: Mechanisms of miRNA-mediated gene regulation
from common downregulation to mRNA-specific upregulation. Int J
Genomics. 2014:9706072014.PubMed/NCBI
|
|
48
|
Zeng Y and Cullen BR: Efficient processing
of primary microRNA hairpins by Drosha requires flanking
nonstructured RNA sequences. J Biol Chem. 280:27595–27603. 2005.
View Article : Google Scholar : PubMed/NCBI
|
|
49
|
Anderson L and Seilhamer J: A comparison
of selected mRNA and protein abundances in human liver.
Electrophoresis. 18:533–537. 1997. View Article : Google Scholar : PubMed/NCBI
|
|
50
|
Schwanhäusser B, Busse D, Li N, Dittmar G,
Schuchhardt J, Wolf J, Chen W and Selbach M: Global quantification
of mammalian gene expression control. Nature. 473:337–342. 2011.
View Article : Google Scholar : PubMed/NCBI
|