Introduction
Ovarian cancer (OC) is a typically fatal disease
worldwide, with >225,000 novel cases and >140,000 mortalities
annually (1,2). Symptoms associated with OC are
non-specific, therefore the majority of patients with OC are
diagnosed at advanced stages of the disease, which markedly
increases the difficulty of treatment and decreases the survival
time (3). Owing to late diagnosis and
poor response to treatment, OC is ranked as the eighth most common
cause of cancer-associated mortality in women worldwide (4). The origin of epithelial ovarian cancer
(EOC) is the epithelial cells of the ovary, and EOC accounts for
~90% of all ovarian cancers (5).
Extensive effort has been made to investigate the pathogenesis of
EOC. It has been demonstrated that the pathogenesis of EOC is
associated with multiple gene mutations (e.g., in genes encoding
AT-rich-interacting domain-containing protein 1A or breast cancer
1/2) (6,7), gene overexpression (e.g., in genes
encoding cyclin D1 or human epidermal growth factor receptor 2)
(8,9)
and dysregulation of signaling pathways (e.g., phosphoinositide
3-kinase/protein kinase B or Wnt/β-catenin) (10,11).
However, limited progress has been achieved in improving the
prognosis and treatment of this disease. Therefore, comprehensive
investigation of the pathogenesis of EOC is required.
Go-Ichi-Ni-San (GINS, meaning five, one, two and
three in Japanese) complexes, first identified by Takayama et
al (12), consist of partner of
Sld five (PSF)1, PSF2, PSF3 and SLD5 (12). GINS complexes are a type of nucleic
acid replication factor and initiate a cyclic structure that serves
a significant function in the initiation of DNA replication
(13). GINS2, also known as PSF2, is
encoded by the GINS2 gene located in humans at chromosomal
locus 16q24 (14). It has been
demonstrated that GINS2 is the central component of the CMG [cell
division cycle 45 (Cdc45)-minichromosome maintenance (MCM)-GINS]
complex, and GINS2 is involved in the initiation of DNA replication
and cell cycle progression (15).
Tumini et al (16) identified
a novel crosstalk between DNA replication and the Fanconi's anemia
(FA) signaling pathway, in which GINS and the core complex help to
load or stabilize the FA core complex onto chromatin, and GINS2
depletion is insufficient to decrease the monoubiquitylation of FA
complementation group D2 or its localization to nuclear foci
following DNA damage (16).
A previous study identified that GINS2 is associated
with the occurrence of genomic DNA damage in untransformed human
fibroblasts (17), suggesting that
GINS2 may be involved in the process of tumorigenesis. A gene
expression meta-analysis identified GINS2 at 16q24 as a potential
metastasis-promoting genes in breast cancer (18). Further studies demonstrated that
increased GINS2 expression was associated with advanced stage of
tumor, poor relapse-free survival, poor distant metastasis-free
survival and poor tamoxifen efficacy in patients with breast cancer
(19,20). An in vitro study identified
that GINS2 expression was enriched in triple negative breast cancer
(TNBC) cell lines, and GINS2 silencing decreased cell
proliferation, invasive capability and stem-like properties of TNBC
cells (21). Therefore, GINS2 has
been considered as a potential prognostic marker and therapeutic
target in breast cancer. On the basis of the analysis of
genome-wide gene expression profiles, GINS2 has been identified as
a tumor-node-metastasis stage-associated gene in lung
adenocarcinoma (22). Furthermore,
GINS2 serves important functions in regulating cell proliferation,
apoptosis and cell cycle transition in leukemic cell lines
(23,24). However, to the best of our knowledge,
the functions of GINS2 in EOC have not been investigated.
In the present study, the expression of GINS2 was
investigated in EOC and normal ovarian tissues using
immunohistochemistry and the effects of GINS2 on cell proliferation
(using cell counting and MTT assays), cell cycle transition (using
propidium iodide staining) and cell apoptosis [using Annexin
V-allophycocyanin (APC) staining] were further studied in an EOC
cell line, SKOV-3. The results of the present study provide
evidence for the potential functions of GINS2 in EOC.
Materials and methods
Cell line culture
The human EOC cell line SKOV-3 was purchased from
the Cell Bank Type Culture Collection of Chinese Academy of
Sciences (CBTCCCAS; Shanghai, China) and another EOC cell line,
OVCAR3, was purchased from the American Type Culture Collection
(Manassas, VA, USA). SKOV-3 cells were cultured in McCoy's 5A
medium (Invitrogen; Thermo Fisher Scientific, Waltham, MA, USA)
with 10% fetal bovine serum (FBS; Ausbian, Sydney, Australia), and
OVCAR3 cells were maintained in RPMI-1640 medium (Corning
Incorporated, Corning, NY, USA) with 20% FBS. 293T cells were
obtained from the CBTCCCAS and were cultured in Dulbecco's modified
Eagle's medium (DMEM; Corning Incorporated) with 10% FBS. All cells
were cultured in a humidified atmosphere at 37°C with 5%
CO2.
Establishment of stable GINS2
knockdown in SKOV-3 cells
For stable knockdown of GINS2, GINS2 (target
sequence, GATTAACCTGAAACAAAGA) or negative control (target
sequence, TTCTCCGAACGTGTCACGT) short hairpin RNAs (shRNAs) were
cloned into lentiviral vector GV115-GFP (Shanghai GeneChem Co.,
Ltd., Shanghai, China). Lentiviral plasmids were purified and
transfected together with pHelper 1.0 and pHelper 2.0 plasmids
(Shanghai GeneChem Co., Ltd.) into 293T cells (in 10-cm plates)
using Lipofectamine® 2000 (Invitrogen; Thermo Fisher
Scientific, Inc.). Culture medium containing lentiviruses was
collected 48 and 72 h after transfection and was used to infect
SKOV-3 cells in the presence of 5 µg/ml Polybrene (Invitrogen;
Thermo Fisher Scientific, Inc.) for 12 h. At 3 days after
infection, green fluorescent protein (GFP) expression was observed
under magnification, ×100 using phase contrast fluorescent
microscopy (Olympus Corporation, Tokyo, Japan).
Reverse transcription-quantitative
polymerase chain reaction (RT-qPCR)
Total RNA from SKOV-3 and OVCAR3 cells was extracted
using TRIzol® reagent (Thermo Fisher Scientific, Inc.)
according to the manufacturer's protocol. A 2-µg amount of total
RNA was used to synthesize first-strand DNA using Moloney murine
leukemia virus reverse transcriptase (Promega Corporation, Madison,
MI, USA) and oligo(dT) primers (Sangon Biotech Co., Ltd., Shanghai,
China). GINS2 mRNA expression was determined using qPCR with SYBR
master mixture (Takara Biotechnology Co., Ltd., Dalian, China) on a
LightCycler 480 instrument (Roche Diagnostics, Basel, Switzerland).
qPCR was carried out at 95°C for 30 sec, then 40 cycles of 95°C for
5 sec and 60°C for 30 sec. GAPDH was used as an internal control
for quantification. The primers for PCR analysis were as follows:
GINS2 forward, 5′-CAGAAATGTCGCCTGCTCC-3′ and reverse,
5′-GGATTTCGTCTGCCTTCG-3′; GAPDH forward,
5′-TGACTTCAACAGCGACACCCA-3′ and reverse,
5′-CACCCTGTTGCTGTAGCCAAA-3′. Relative gene expression was
calculated using the 2−ΔΔCq method and normalized to
GAPDH expression, as described previously (25).
Western blot analysis
Cells at between 36 and 48 h after viral infection
were lysed in lysis buffer containing 100 mM Tris/HCl (pH 6.8), 4%
SDS, 20% glycerol and 2% mercaptoethanol. Protein concentration was
assessed using a bicinchoninic acid protein assay kit (Beyotime
Institute of Biotechnology, Haimen, China), according to the
manufacturer's protocol. An equal amount of total protein (20 µg)
from each sample was resolved by SDS-PAGE (10% gels) and
transferred onto polyvinylidene fluoride membranes. The membranes
were blocked in 5% non-fat milk solution in Tris-buffered saline
and Tween-20 (TBST) at room temperature for 1 h and then further
incubated with the primary antibody for 2 h. The primary antibodies
used were mouse anti-GINS2 (cat. no. SAB1409430; 1:2,000 dilution;
Sigma-Aldrich; Merck KGaA, Darmstadt, Germany) and mouse anti-GADPH
(cat. no. sc-47724; 1:2,000 dilution; Santa Cruz Biotechnology,
Inc., Dallas, TX, USA). Next, the membranes were washed with TBST
three times and incubated with horseradish peroxidase-conjugated
secondary goat anti-mouse IgG (cat. no. sc-2005, 1:2,000 dilution;
Santa Cruz Biotechnology, Inc.) for 2 h. The signals were detected
using enhanced chemiluminescence reagent (Thermo Fisher Scientific,
Inc.).
Cell proliferation assays
Following infection with lentiviruses expressing
GINS2 or scrambled shRNA, the proliferation of SKOV-3 cells
expressing GINS2 shRNA or scrambled shRNA was determined using
high-content screening. SKOV-3 cells were cultured for 48 h and
then split at the exponential growth phase into 96-well plates in
triplicate at a density of 2,000 cells/well. Cells were cultured
for 5 days, and cell images were captured once daily using Celigo
(Nexcelom, Lawrence, MA, USA). The cell numbers in each well were
determined at different time points using Celigo software (version
2.1), and cell proliferation curves were generated.
Cell proliferation was also assessed using an MTT
assay. Stable SKOV-3 cells expressing SKOV-3 or scrambled shRNA
were seeded in 96-well plates at a density of 2,000 cells/well and
incubated at 37°C for 1, 2, 3, 4 or 5 days. Then cells were
incubated with MTT solution (5 mg/ml) for 4 h. Following
incubation, culture medium in each well was removed and 100 µl
dimethyl sulfoxide was added to solubilize the formazan salt. After
5 min, the optical density at 490 nm was determined using a
microplate reader (Tecan Infinite M2009PR; Tecan Group, Ltd.,
Männedorf, Switzerland).
Cell apoptosis assay
Cell apoptosis was determined using an Annexin V-APC
kit (eBioscience; Thermo Fisher Scientific, Inc.), according to the
manufacturer's protocol, and a Guava® easyCyte HT flow
cytometer (EMD Millipore, Billerica, MA, USA). For analysis of
apoptosis, the cells (8.0×10⁵) were stained with 200 µl
binding buffer containing 10 µl Annexin V-APC at room temperature
in the dark for between 10 and 15 min. Following several washes,
cells were analyzed at as wavelength of 633 nm. All experiments
were performed in triplicate.
Cell cycle assay
SKOV-3 cells expressing GINS2 or scrambled shRNA
were seeded into 6-cm dishes for further culture. Upon reaching
~80% confluence, >1×10⁶ cells were collected and
fixed with ice-cold 75% alcohol for >1 h. Cells were then washed
with D-Hanks buffer (Invitrogen; Thermo Fisher Scientific, Inc.)
and stained with propidium iodide (PI) buffer (50 µg/ml PI and 100
µg/ml RNase in D-Hanks buffer) for 30 min at room temperature in
the dark. Following several washes, cell cycle analysis was
performed for 10,000 cells using flow cytometry using a Guava
easyCyte HT instrument.
Immunohistochemistry
Human ovarian tissue arrays including formalin-fixed
normal and EOC tissues were purchased from Cybrdi, Inc. (Frederick,
MD, USA). The tissue array (OV243; 2-mm diameter) included 36 cases
of EOC samples and 12 cases of normal ovarian tissues. According to
the grading criteria of The International Federation of Gynecology
and Obstetrics, EOC samples consisted of 6 grade II samples, 16
grade III samples and 14 grade IV samples. None of the patients
with EOC had received any treatment prior to sample collection.
Following deparaffinization and rehydration, each slide was boiled
in 10 mmol/l citrate buffer (pH 6.0) for 20 min and then blocked
with 10% bovine serum albumin in Tris-buffered saline for 30 min.
Next, the slides were incubated with the primary anti-GINS2
antibody (cat. no. HPA057285; 1:500 dilution; Sigma-Aldrich; Merck
KGaA) at 4°C overnight, followed by incubation with biotinylated
secondary antibody (cat. no. sc-2039; 1:2,000 dilution) for 1 h and
streptavidin-horseradish peroxidase conjugate (cat. no. sc-52234;
1:2,000 dilution; both Santa Cruz Biotechnology, Inc.) for 30 min.
Finally, the slides were stained with diaminobenzidine (cat. no.
sc-24982) for 5 min and then counterstained with hematoxylin (cat.
no. sc-396328; both Santa Cruz Biotechnology, Inc.) for 1 min at
room temperature. The slides were scored by two pathologists who
were blinded to the clinical information of the samples. In the
case of a discrepancy, the two pathologists reviewed the slides
simultaneously to achieve a consensus. GINS2 scoring was performed
by evaluating the intensity of staining and the extent of staining
in the whole tissue. For intensity, 0 indicated negative staining,
1 indicated weak staining, 2 indicated moderate staining and 3
indicated strong staining. For the extent of staining area, 0
indicated 0% staining, 1 indicated 1–25% staining, 2 indicated
26–50% staining, 3 indicated 51–75% staining, and 4 indicated
76–100% staining. The final immunoreactive score was determined by
multiplying the intensity score by the extent score, with the
minimum score attainable being 0 and a maximum score being 12.
Scores ≤6 were considered as low GINS2 expression, whereas scores
>6 were considered as high GINS2 expression.
Statistical analysis
Statistical analysis was performed using SPSS
software (version 17.0; SPSS, Inc., Chicago, IL, USA). All results
are expressed as the mean ± standard deviation of multiple
experiments. Results were analyzed by one-way analysis of variance
and two-tailed Fisher's exact test. P<0.05 was considered to
indicate a statistically significant difference.
Results
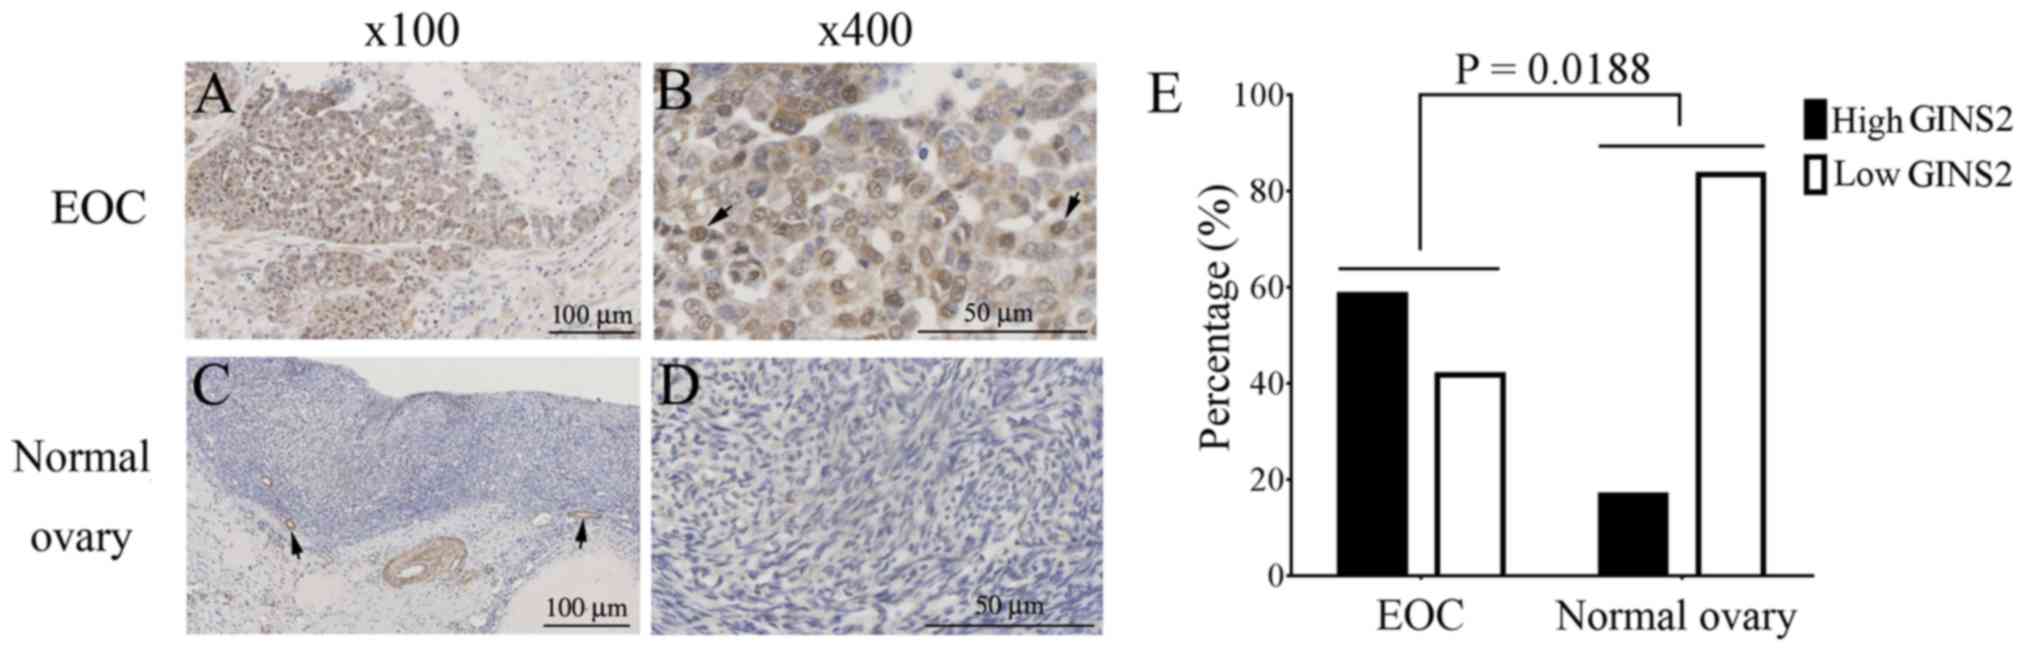
GINS2 is overexpressed in EOC tissues,
but not in normal ovarian tissue
Since GINS2 was highly expressed in breast cancer
and lung adenocarcinoma (19,22), GINS2 expression was determined in 36
samples of EOC tissues and 12 samples of normal ovarian tissues
using immunohistochemical staining. Strong GINS2 signals were
identified in EOC tissues, primarily in the nuclei of carcinoma
cells (Fig. 1A and B), whereas GINS2
expression was weak in normal ovarian tissue, with some signals in
blood vessels (Fig. 1C and D). GINS2
staining was quantified on the basis of intensity and percentage of
GINS2-positive cells. GINS2 was highly expressed in 21/36 EOC
tissue samples (58.33%), but in only 2/12 normal ovarian tissue
samples (16.67%). The difference in GINS2 expression between EOC
and normal ovarian tissues was statistically significant (P=0.0188;
Fig. 1E).
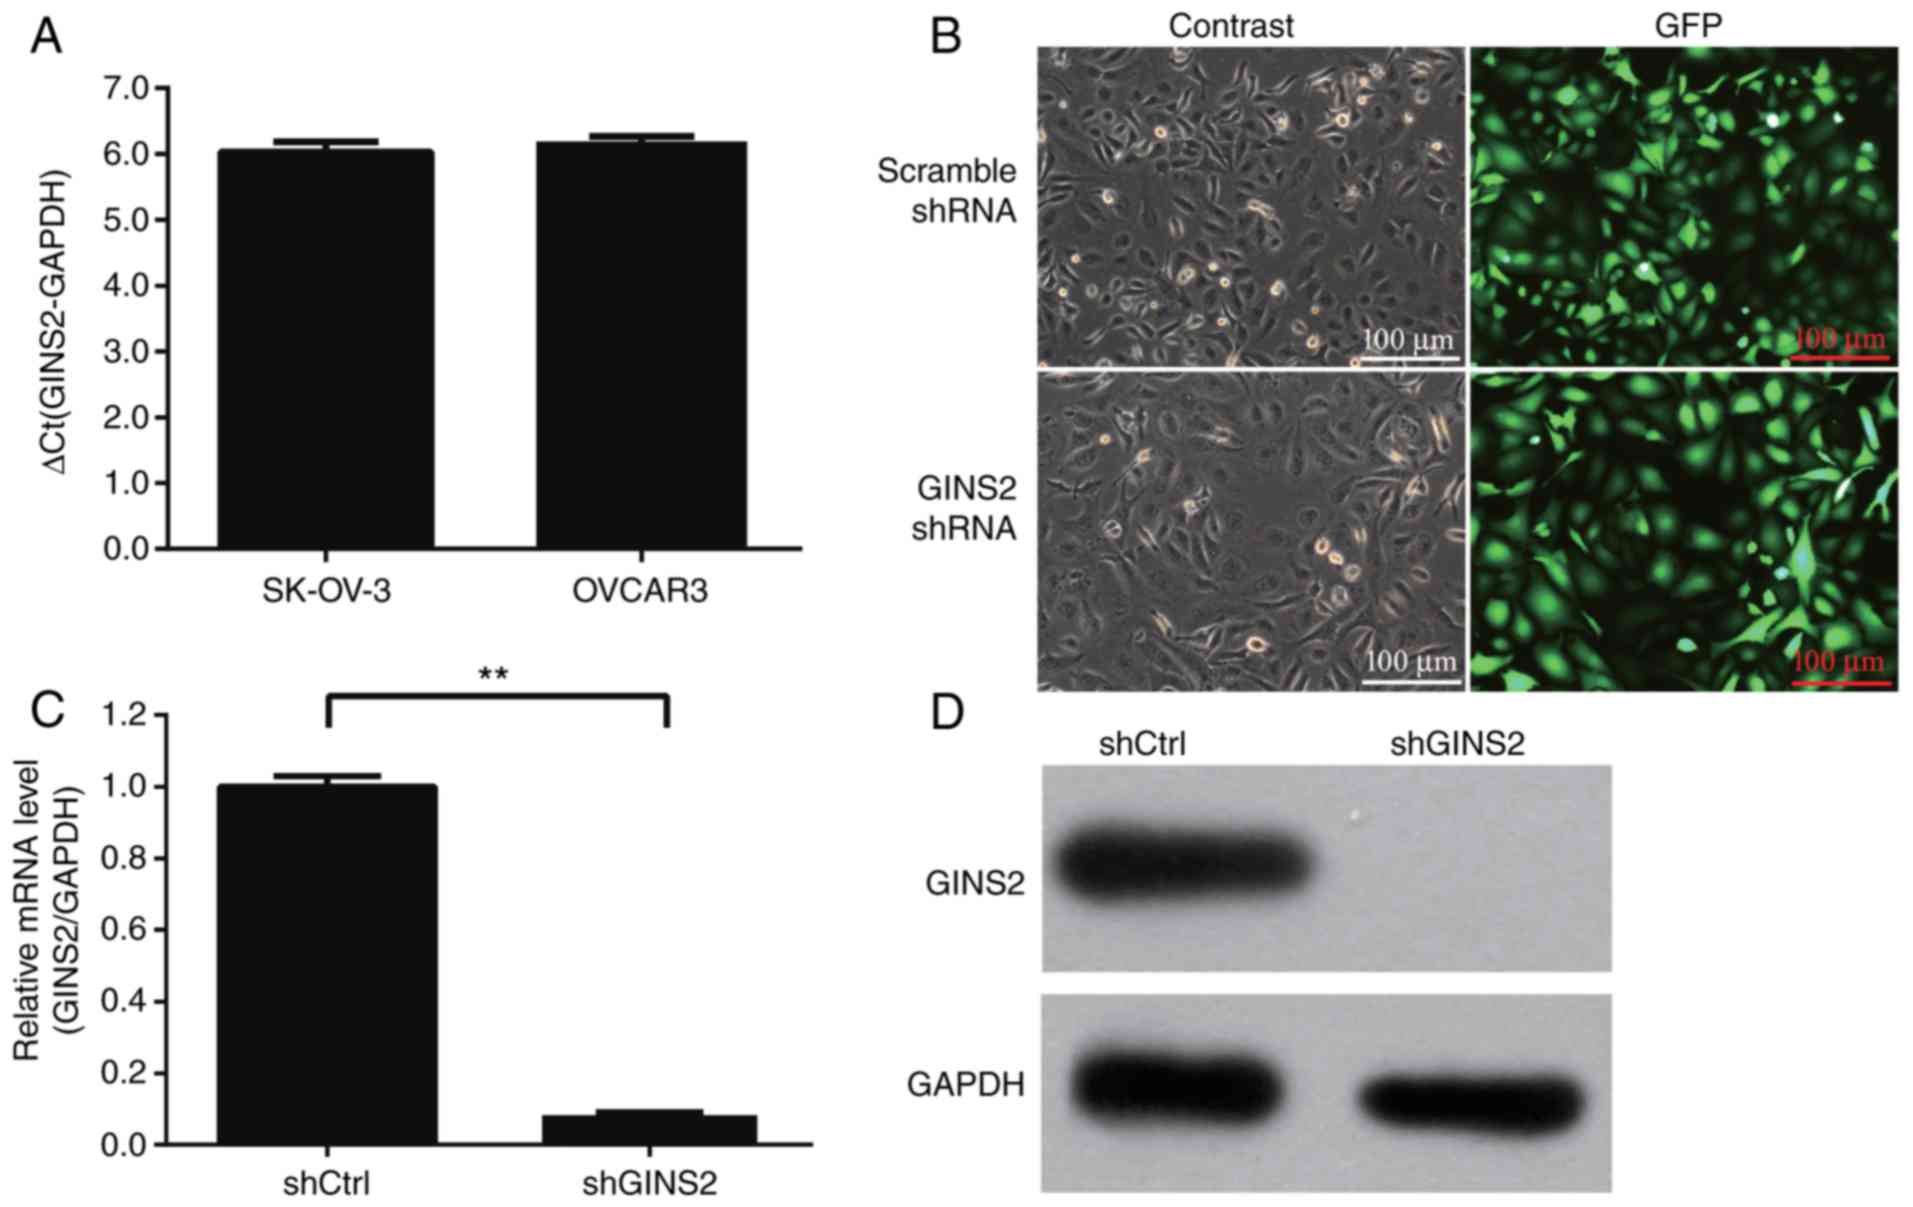
Stable knockdown of GINS2 expression
in EOC cells
To investigate the functions of GINS2 in EOC cells,
the expression of GINS2 mRNA was determined in the EOC cell lines
SKOV-3 and OVCAR3 using RT-qPCR. GINS2 mRNA was highly expressed in
these two cell lines (Fig. 2A). The
SKOV-3 cell line was selected for further functional analyses.
GINS2 mRNA expression was stably knocked down in
SKOV-3 cells using a specific shRNA in a lentiviral vector.
Lentiviruses expressing GINS2 shRNA or scrambled shRNA were
produced by 293T cells and were used to infect SKOV-3 cells. At 48
h after infection, it was observed that >80% of SKOV-3 cells
were GFP-positive, indicating a high infection efficiency (Fig. 2B). At 5 days after infection, the mRNA
and protein expression levels of GINS2 in SKOV-3 cells were
determined using RT-qPCR and Western blotting, respectively. The
mRNA expression level of GINS2 was significantly inhibited (>90%
knockdown) by specific GINS2 shRNA compared with scrambled shRNA
(P<0.001; Fig. 2C) and GINS2
protein expression was identified to be markedly decreased
following GINS2 knockdown by shRNA (Fig.
2D).
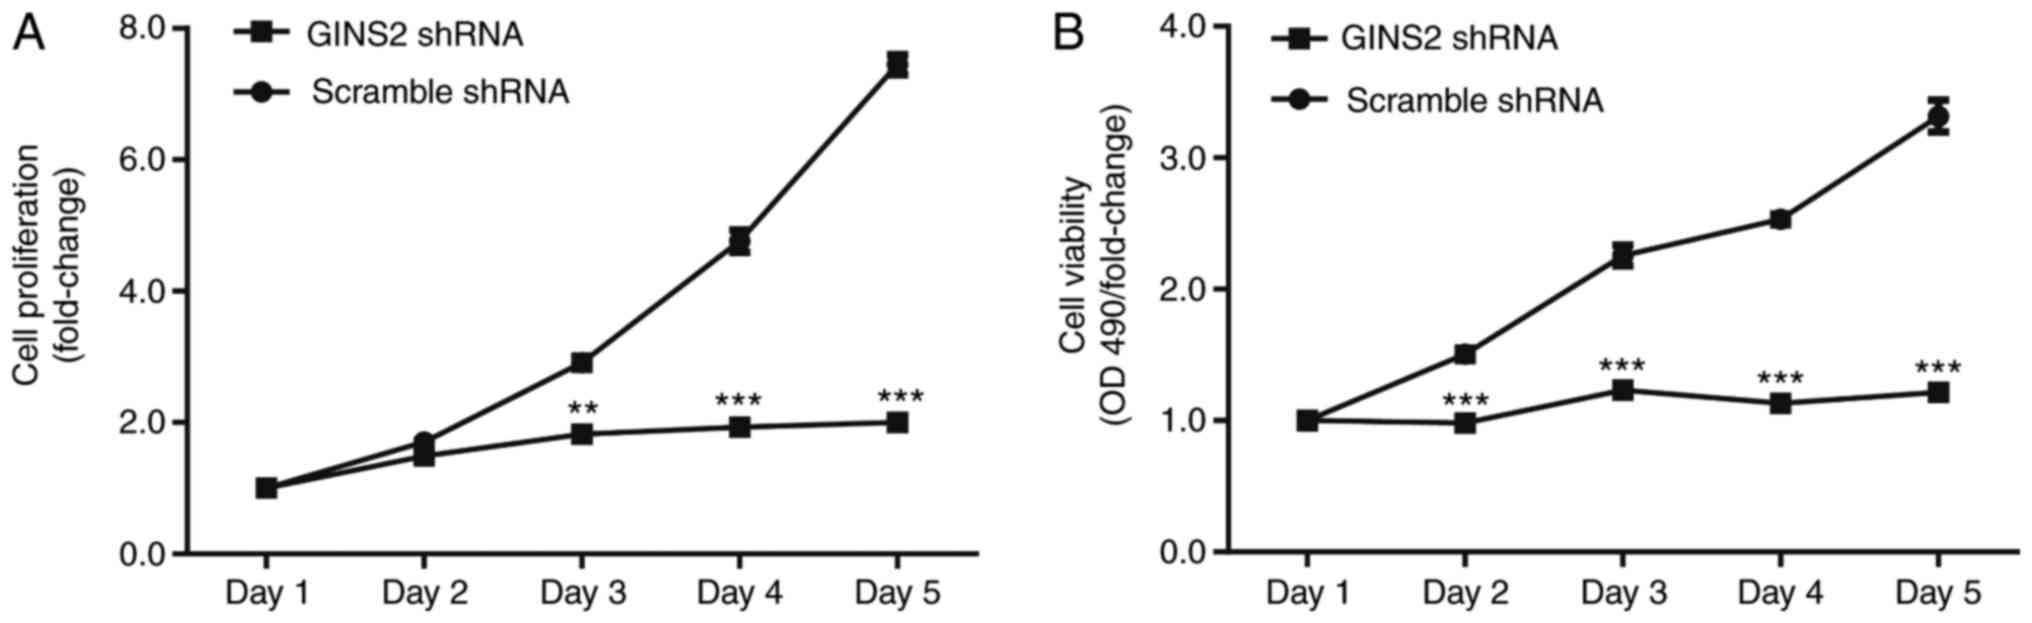
GINS2 knockdown inhibits SKOV-3 cell
proliferation
To investigate the function of GINS2 in cell
proliferation, the proliferation of SKOV-3 cells expressing GINS2
shRNA or scrambled shRNA was determined using high-content
screening. As presented in Fig. 3A,
SKOV-3 cell proliferation was significantly inhibited by GINS2
shRNA (P<0.001). Compared with the number of cells on day 1, the
number of cells in the scrambled shRNA group increased
7.45±0.15-fold after 5 days, whereas it increased only
2.00±0.10-fold in the GINS2 group (Fig.
3A).
The effect of GINS2 knockdown on SKOV-3 cell
viability was investigated using an MTT assay. Compared with day 1,
cell viability in the scrambled shRNA group gradually increased
between day 1 and day 5 (a 3.316±0.122-fold increase by day 5),
whereas cell viability increased only slightly between day 1 and
day 5 (increased by 1.215±0.0324 fold on day 5). The difference in
cell viability between the two groups was statistically significant
after 2 and 3 days (P<0.01 and P<0.001; Fig. 3B).
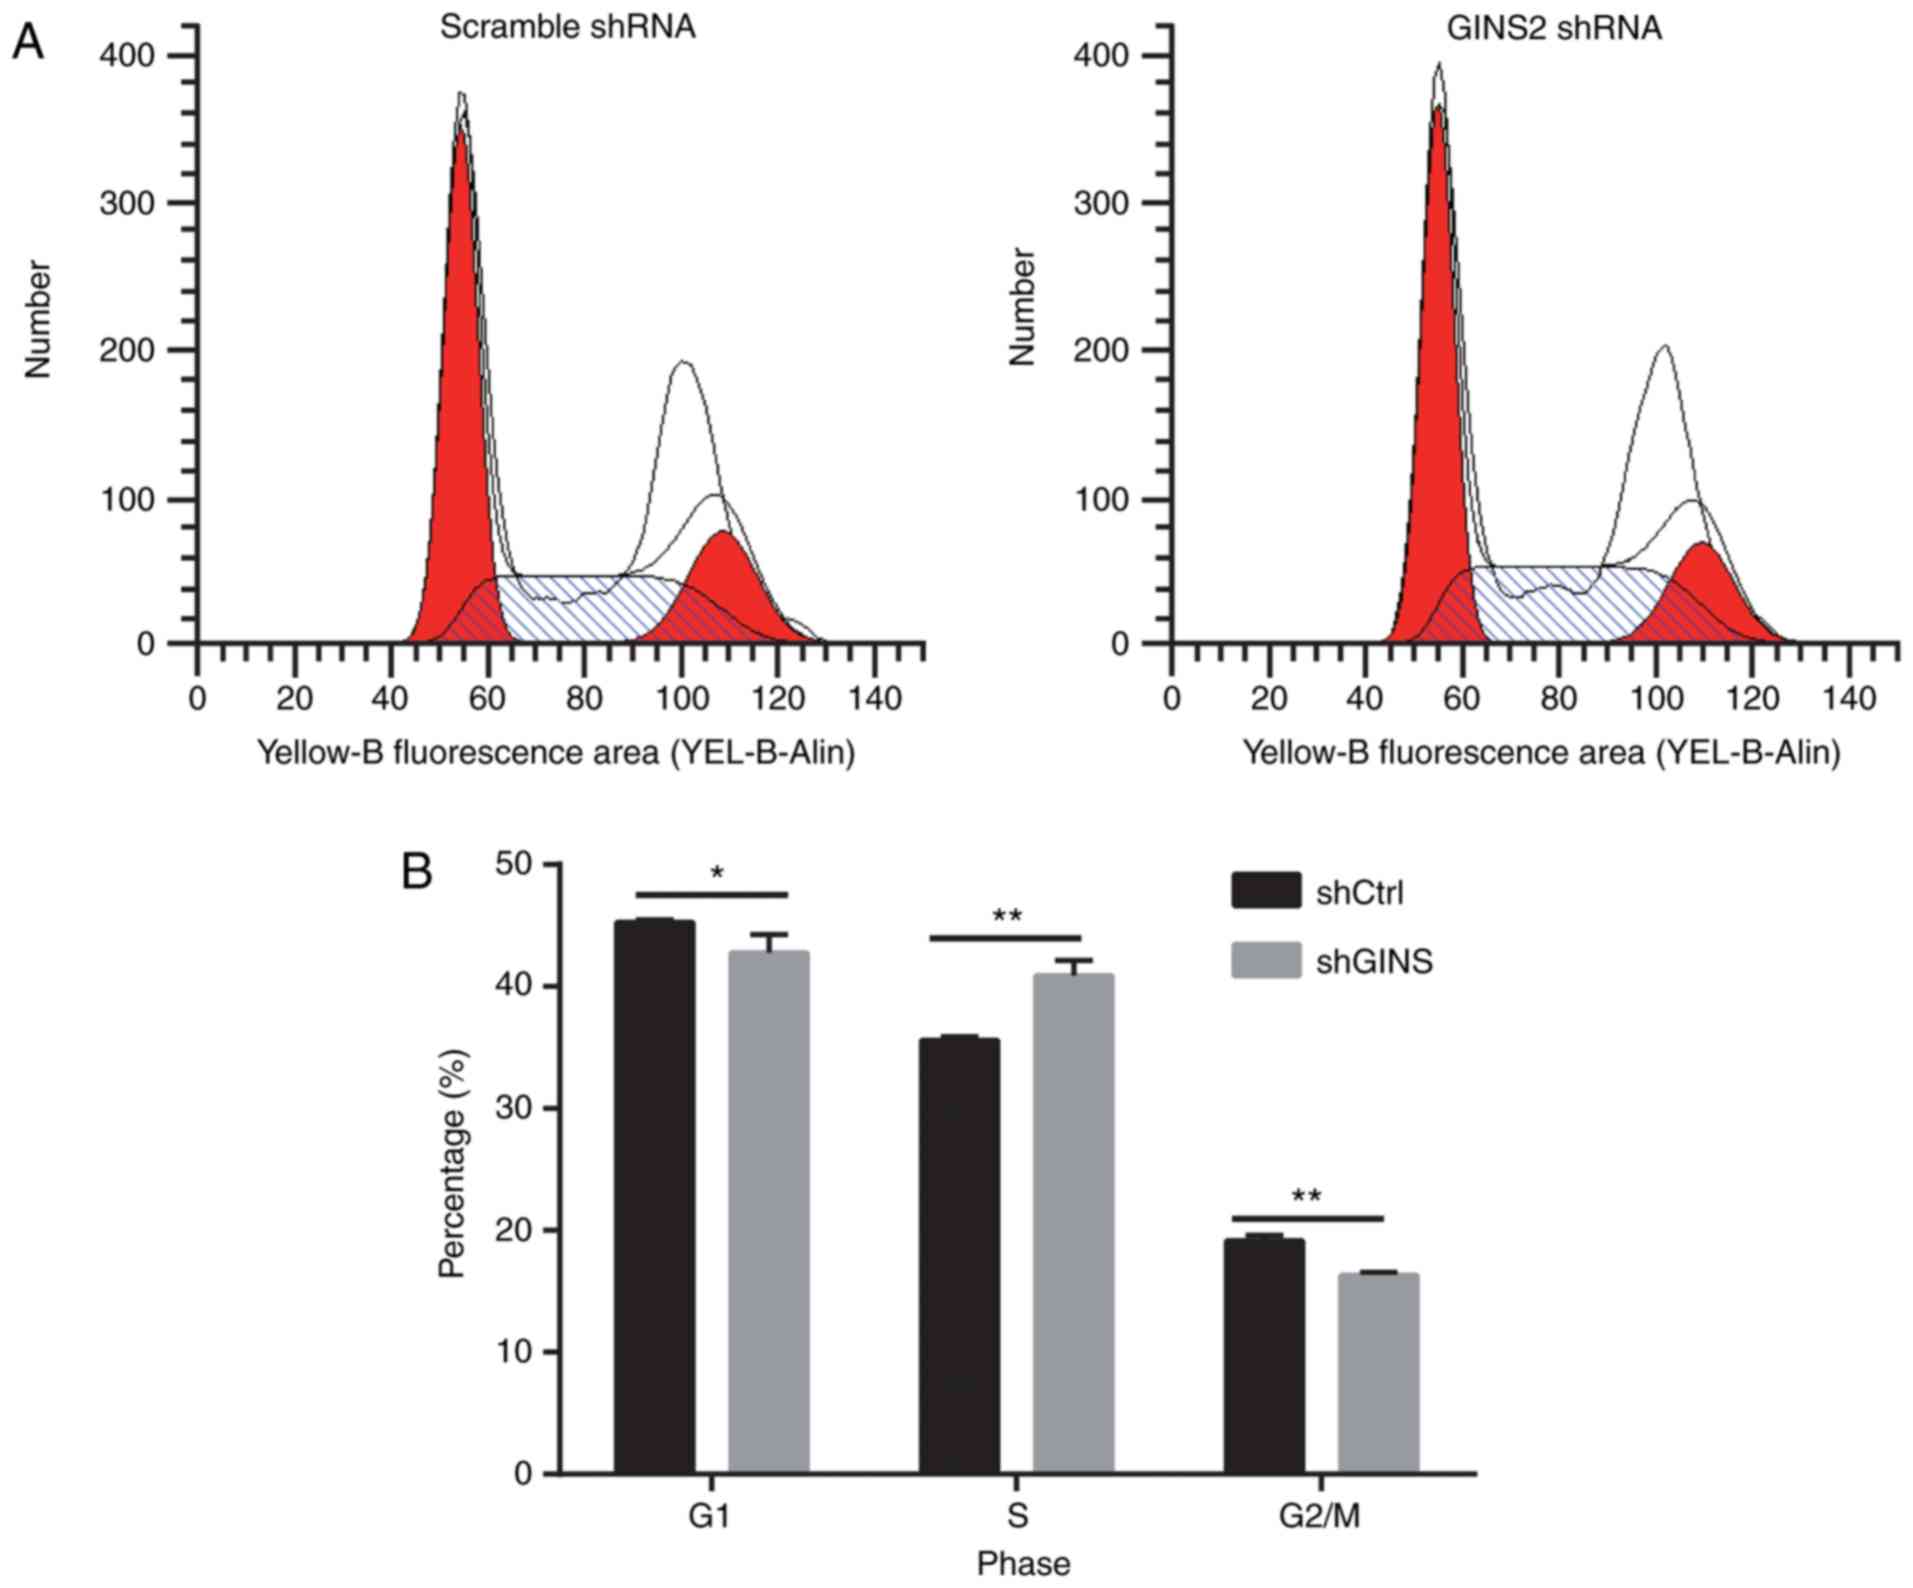
GINS2 knockdown induces cell cycle
arrest in SKOV-3 cells
Since GINS2 knockdown inhibited SKOV-3 cell
proliferation, it was investigated whether GINS2 knockdown affects
SKOV-3 cell cycle progression. Cell cycle analysis was performed
using PI staining and assessed using flow cytometry. Results of
cell cycle progression are presented in Fig. 4A. Cell cycle analysis revealed that,
compared with scrambled shRNA, GINS2 shRNA significantly decreased
the proportion of cells in the G0/G1 phase
(45.25±0.23 compared with 42.79±1.46%; P<0.05) and
G2/M phase (19.13±0.49 compared with 16.33±0.23%;
P<0.01), whereas the percentage of cells in S phase was
significantly increased (35.62±0.29 compared with 40.88±1.25%;
P<0.01) following GINS2 knockdown (Fig. 4B).
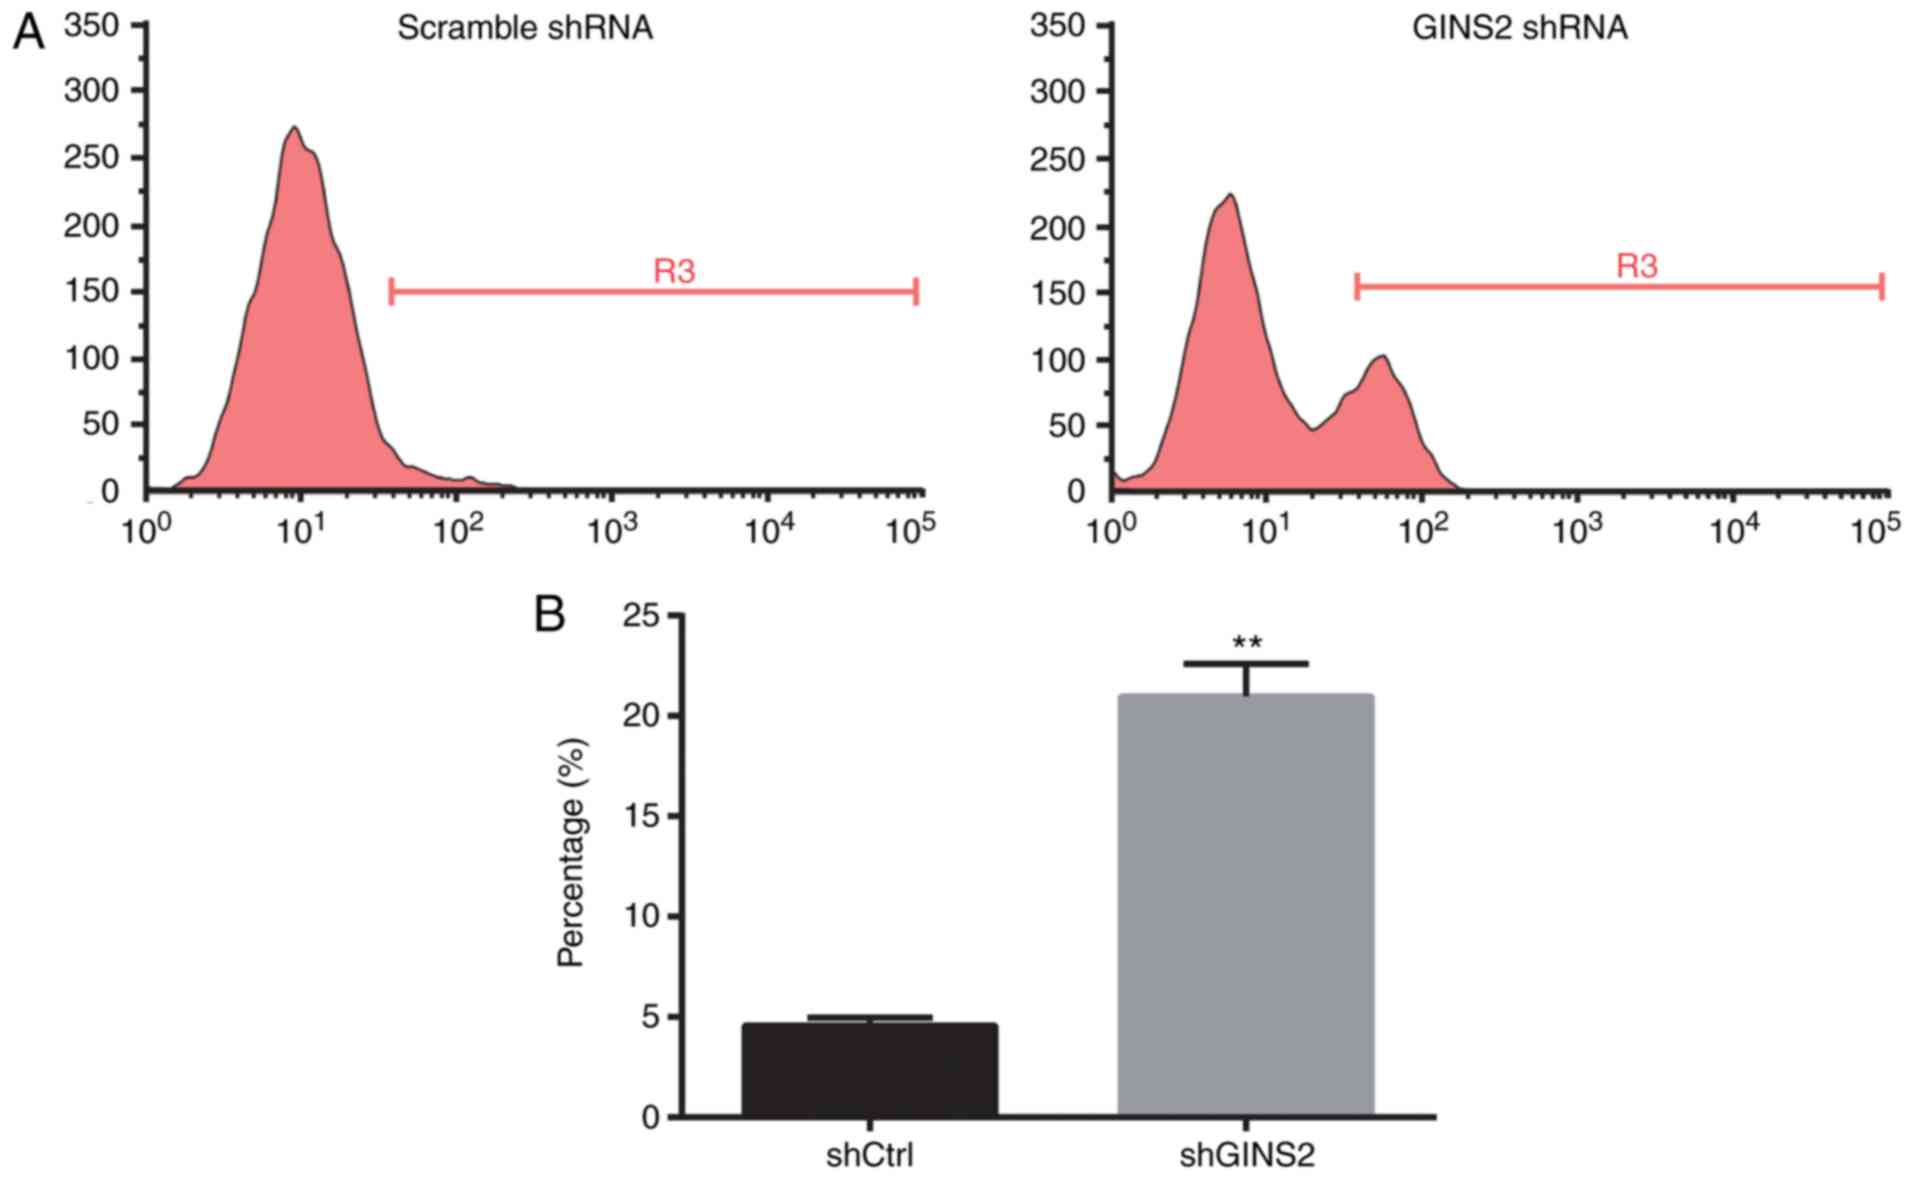
GINS2 knockdown induces apoptosis in
SKOV-3 cells
It was investigated whether GINS2 knockdown affects
apoptosis using Annexin V-APC staining and flow cytometry.
Representative apoptosis assay results are presented in Fig. 5A. Compared with scrambled shRNA, GINS2
shRNA significantly increased apoptosis (4.57±0.40 compared with
20.97±1.63%; P<0.01; Fig. 5B).
Discussion
GINS, a ring-like protein complex involving PSF1,
PSF2 (GINS2), PSF3 and SLD5, was initially extracted from budding
yeast (12). GINS2, as an important
subunit of GINS complexes, mediates the interaction between MCM
complexes and Cdc45 (CDC45-MCM-2-7-GINS) at the initiation of DNA
replication in eukaryotic cells (15). GINS2 has been associated with the
malignancy of a number of types of cancer (20–24). GINS2
is highly expressed in many malignant tumors, including breast
cancer and acute promyelocytic leukemia (20,21,23).
Furthermore, high GINS2 expression is associated with advanced
stage of tumor, poor relapse-free survival times, poor distant
metastasis-free survival times and poor tamoxifen efficacy in
patients with breast cancer (20).
Therefore, GINS2 has been considered as a potential prognostic
marker and therapeutic target in breast cancer. However, to the
best of our knowledge, the association between GINS2 expression and
the progression of EOC remains to be clarified. In the present
study, high expression of GINS2 was observed in EOC tissues and
cell lines. Furthermore, stable GINS2 knockdown in SKOV-3 cells was
able to significantly inhibit cell proliferation, and induce cell
cycle arrest and apoptosis.
It has been demonstrated that the GINS2 transcript
is highly expressed in breast cancer samples, and its level is
associated with lung metastasis, histological grade, and acquired
endocrine therapy resistance in patients with breast cancer
(20). A study by Liu et al
(22) identified GINS2 as a
differentially expressed gene (high expression) in 90 lung
adenocarcinoma samples using gene microarray analysis. In the
present study, GINS2 was identified, for the first time, to be
expressed at high levels in EOC samples from 36 patients and in two
human EOC cell lines. In patients with breast cancer and lung
adenocarcinoma, GINS2 expression was positively associated with the
histological grade of tumors, in which high expression of GINS2 was
observed in 17.2% of grade 1, 50% of grade 2 and 77.1% of grade 3
breast cancer samples, and in stage II lung adenocarcinomas
(20,22). The EOC samples assessed in the present
study were purchased from a commercial company. Since the number of
patients with EOC was limited and data for the clinicopathological
parameters, including lung metastasis, progress-free survival,
prognosis, therapy resistance, were not provided by the company,
GINS2 protein expression was compared only between EOC samples and
normal ovarian tissues. Therefore, in future studies, GINS2
expression should be investigated in a large number of patients
with EOC of different histological grades and with complete
clinicopathological data in order to assess the association between
GINS2 protein expression and other clinicopathological parameters
of EOC.
Since GINS2 mediates the interaction between MCM
complexes and Cdc45 at the initiation of DNA replication in
eukaryotic cells (15), it is
reasonable to hypothesize that GINS2 is involved in the regulation
of cell cycle progression and proliferation. It has been
demonstrated that GINS2 serves important functions in the
proliferation of leukemia cells (23,24). In
leukemia cell lines (HL60, K562 and NB4), GINS2 knockdown by siRNA
significantly suppressed cell proliferation and induced cell cycle
arrest at the G2 phase through activation of the p38
mitogen-activated protein kinase signaling pathway, whereas
overexpression of GINS2 in HL60 cells promoted cell proliferation
(23,24). In the present study, it was also
identified that GINS2 knockdown in SKOV-3 cells significantly
suppressed cell proliferation. However, GINS2 knockdown induced
cell cycle arrest at the S phase, but not the G2 phase
as demonstrated in leukemia cells. Eukaryotic cell cycle
progression is tightly regulated by the complexes consisting of
cyclins and cyclin-dependent kinases (CDKs), in which cyclin
D-CDK4/6 is required for G1 progression, cyclin E-CDK2
is required for the G1-S transition, cyclin A-CDK2 is
required for S phase progression and cyclin A/B-CDC2 is required
for the G2-M transition (26,27). Thus,
the expression of cyclins and CDKs is often used to assess cell
proliferation and cell cycle transition. Although the effect of
GINS2 knockdown on the expression of cyclins and CDKs was not
investigated in SKOV-3 cells, previous studies demonstrated that
GINS2 knockdown decreases the expression of cyclin A, cyclin B1,
cyclin D1 and CDK1 in leukemia cells (23,24). These
results support the hypothesis that GINS2 knockdown induces cell
cycle arrest at the S or G2 phase. Furthermore, aberrant
cell cycle regulation is the major cause for over-proliferation of
tumor cells. The S phase is a critical period during which cells
commit to proliferation or growth arrest (26). Individual replication origins are
activated at the onset of S phase through the assembly of
replication factors, including Sld3, GINS, Cut5, Drc1, Cdc45,
replication protein A and the DNA polymerase α-primase complex
(28). GINS2 regulates the chromosome
segregation, probably through its function in centromere
replication at the S phase (29). In
eukaryotes, the process of DNA replication occurs at S phase in a
highly coordinated manner, in which GINS associates with
replication origins and then with neighboring fragments during this
period (30). Understanding the
regulation of the S phase transition is central to clarifying the
pathogenesis of many diseases, particularly cancer (31).
Uncontrolled cell proliferation and decreased
apoptosis are two major characteristics of the majority of cancer
cells. In the present study, it was observed that GINS2 knockdown
significantly induced apoptosis in SKOV-3 cells. Consistent with
these results, previous studies also demonstrated that GINS2
knockdown induced apoptosis in leukemia cells (23,24).
Furthermore, GINS2 knockdown significantly increased the expression
of the pro-apoptotic protein B-cell lymphoma 2 (Bcl-2)-associated X
protein, but decreased the expression of the anti-apoptotic protein
Bcl-2 (23,24), although the underlying molecular
mechanisms remain to be clarified. Since the present study is, to
the best of our knowledge, the first to investigate GINS2 functions
in EOC, the expression pattern of GINS2 was initially investigated
in EOC samples and then investigated major functions (cell
proliferation and apoptosis) of GINS2 in an EOC cell line. The
results of the present study provide a solid basis for future
studies, in which the functions of GINS2 in EOC and precise
underlying molecular mechanisms should be validated in vitro
and in vivo.
In summary, the results of the present study
demonstrate that GINS2 was highly expressed in human EOC samples
and cell lines. The silencing of GINS2 expression in SKOV-3 cells
inhibited cell proliferation, induced cell cycle arrest at S phase
and increased apoptosis. Therefore, these results suggest that
GINS2 may be involved in the progression and malignancy of EOC,
although the functions of GINS2 in the tumorigenesis of human EOC
and underlying molecular mechanisms require further
investigation.
Acknowledgements
Not applicable.
Funding
The present study was supported by The Youth Fund of
Guizhou Provincial People's Hospital (grant no.
GZSYQN[2017]09).
Availability of data and materials
The datasets used and/or analyzed during the current
study are available from the corresponding author on reasonable
request.
Authors' contributions
TY and MX conceived and designed the study. TY, EJ,
AY, WL and QW performed the experiments. TY and WL wrote the paper.
TY, WL, EJ, AY and MX reviewed and edited the manuscript. All
authors read and approved the manuscript.
Ethics approval and consent to
participate
Not applicable.
Consent for publication
Not applicable.
Competing interests
The authors declare that they have no competing
interests.
Glossary
Abbreviations
Abbreviations:
|
EOC
|
epithelial ovarian cancer
|
|
GINS
|
Go-Ichi-Ni-San
|
|
FA
|
Fanconi's anemia
|
|
TNBC
|
triple negative breast cancer
|
|
CBTCCCAS
|
Cell Bank Type Culture Collection of
Chinese Academy of Sciences
|
|
FBS
|
fetal bovine serum
|
|
RT-qPCR
|
reverse transcription-quantitative
polymerase chain reaction
|
|
PI
|
propidium iodide
|
|
CDK
|
cyclin-dependent kinase
|
References
|
1
|
Ferlay J, Shin HR, Bray F, Forman D,
Mathers C and Parkin DM: Estimates of worldwide burden of cancer in
2008: GLOBOCAN 2008. Int J Cancer J Int Du Cancer. 127:2893–2917.
2010. View Article : Google Scholar
|
|
2
|
Siegel R, Naishadham D and Jemal A: Cancer
statistics, 2013. CA Cancer J Clin. 63:11–30. 2013. View Article : Google Scholar : PubMed/NCBI
|
|
3
|
Brown PO and Palmer C: The preclinical
natural history of serous ovarian cancer: Defining the target for
early detection. PLoS Med. 6:e10001142009. View Article : Google Scholar : PubMed/NCBI
|
|
4
|
Torre LA, Bray F, Siegel RL, Ferlay J,
Lortet-Tieulent J and Jemal A: Global cancer statistics, 2012. CA
Cancer J Clin. 65:87–108. 2015. View Article : Google Scholar : PubMed/NCBI
|
|
5
|
Auersperg N, Wong A, Choi K, Kang S and
Leung P: Ovarian surface epithelium: Biology, endocrinology, and
pathology. Endocr Rev. 22:255–288. 2001. View Article : Google Scholar : PubMed/NCBI
|
|
6
|
Wu JN and Roberts CWM: ARID1A mutations in
cancer: Another epigenetic tumor suppressor? Cancer Discov.
3:35–43. 2013. View Article : Google Scholar : PubMed/NCBI
|
|
7
|
Maistro S, Teixeira N, Encinas G, Katayama
ML, Niewiadonski VD, Cabral LG, Ribeiro RM, Junior Gaburo N, de
Gouvêa AC, Carraro DM, et al: Germline mutations in BRCA1 and BRCA2
in epithelial ovarian cancer patients in Brazil. BMC Cancer.
16:9342016. View Article : Google Scholar : PubMed/NCBI
|
|
8
|
Hashimoto T, Yanaihara N, Okamoto A,
Nikaido T, Saito M, Takakura S, Yasuda M, Sasaki H, Ochiai K and
Tanaka T: Cyclin D1 predicts the prognosis of advanced serous
ovarian cancer. Exp Ther Med. 2:213–219. 2011. View Article : Google Scholar : PubMed/NCBI
|
|
9
|
Chao WR, Lee MY, Lin WL, Chen CK, Lin JC,
Koo CL, Sheu GT and Han CP: HER2 amplification and overexpression
are significantly correlated in mucinous epithelial ovarian cancer.
Hum Pathol. 45:810–816. 2014. View Article : Google Scholar : PubMed/NCBI
|
|
10
|
Bai H, Li H, Li W, Gui T, Yang J, Cao D
and Shen K: The PI3K/AKT/mTOR pathway is a potential predictor of
distinct invasive and migratory capacities in human ovarian cancer
cell lines. Oncotarget. 6:25520–25532. 2015. View Article : Google Scholar : PubMed/NCBI
|
|
11
|
Burkhalter RJ, Symowicz J, Hudson LG,
Gottardi CJ and Stack MS: Integrin regulation of beta-catenin
signaling in ovarian carcinoma. J Biol Chem. 286:23467–23475. 2011.
View Article : Google Scholar : PubMed/NCBI
|
|
12
|
Takayama Y, Kamimura Y, Okawa M, Muramatsu
S, Sugino A and Araki H: GINS, a novel multiprotein complex
required for chromosomal DNA replication in budding yeast. Genes
Dev. 17:1153–1165. 2003. View Article : Google Scholar : PubMed/NCBI
|
|
13
|
Chang YP, Wang G, Bermudez V, Hurwitz J
and Chen XS: Crystal structure of the GINS complex and functional
insights into its role in DNA replication. Proc Natl Acad Sci USA.
104:12685–12690. 2007. View Article : Google Scholar : PubMed/NCBI
|
|
14
|
MacNeill SA: Structure and function of the
GINS complex, a key component of the eukaryotic replisome. Biochem
J. 425:489–500. 2010. View Article : Google Scholar : PubMed/NCBI
|
|
15
|
Kang YH, Galal WC, Farina A, Tappin I and
Hurwitz J: Properties of the human Cdc45/Mcm2-7/GINS helicase
complex and its action with DNA polymerase epsilon in rolling
circle DNA synthesis. Proc Natl Acad Sci USA. 109:6042–6047. 2012.
View Article : Google Scholar : PubMed/NCBI
|
|
16
|
Tumini E, Plevani P, Muzi-Falconi M and
Marini F: Physical and functional crosstalk between Fanconi anemia
core components and the GINS replication complex. DNA Repair
(Amst). 10:149–158. 2011. View Article : Google Scholar : PubMed/NCBI
|
|
17
|
Barkley LR, Song I, Zou Y and Vaziri C:
Reduced expression of GINS complex members induces hallmarks of
pre-malignancy in primary untransformed human cells. Cell Cycle.
8:1577–1588. 2009. View Article : Google Scholar : PubMed/NCBI
|
|
18
|
Thomassen M, Tan Q and Kruse TA: Gene
expression meta-analysis identifies chromosomal regions and
candidate genes involved in breast cancer metastasis. Breast Cancer
Res Treat. 113:239–249. 2009. View Article : Google Scholar : PubMed/NCBI
|
|
19
|
Rantala JK, Edgren H and Lehtinen L:
Integrative functional genomics analysis of sustained polyploidy
phenotypes in breast cancer cells identifies an oncogenic profile
for GINS2. Neoplasia. 12:877–888. 2010. View Article : Google Scholar : PubMed/NCBI
|
|
20
|
Zheng M, Zhou Y, Yang X, Tang J, Wei D,
Zhang Y, Jiang JL, Chen ZN and Zhu P: High GINS2 transcript level
predicts poor prognosis and correlates with high histological grade
and endocrine therapy resistance through mammary cancer stem cells
in breast cancer patients. Breast Cancer Res Treat. 148:423–436.
2014. View Article : Google Scholar : PubMed/NCBI
|
|
21
|
Peng L, Song Z, Chen D, Linghu R, Wang Y,
Zhang X, Kou X, Yang J and Jiao S: GINS2 regulates matrix
metallopeptidase 9 expression and cancer stem cell property in
human triple negative breast cancer. Biomed Pharmacother.
84:1568–1574. 2016. View Article : Google Scholar : PubMed/NCBI
|
|
22
|
Liu M, Pan H, Zhang F, Zhang Y, Zhang Y,
Xia H, Zhu J, Fu W and Zhang X: Identification of TNM
stage-specific genes in lung adenocarcinoma by genome-wide
expression profiling. Oncol Lett. 6:763–768. 2013. View Article : Google Scholar : PubMed/NCBI
|
|
23
|
Gao Y, Wang S, Liu B and Zhong L: Roles of
GINS2 in K562 human chronic myelogenous leukemia and NB4 acute
promyelocytic leukemia cells. Int J Mol Med. 31:1402–1410. 2013.
View Article : Google Scholar : PubMed/NCBI
|
|
24
|
Zhang X, Zhong L, Liu BZ, Gao YJ, Gao YM
and Hu XX: Effect of GINS2 on proliferation and apoptosis in
leukemic cell line. Int J Med Sci. 10:1795–1804. 2013. View Article : Google Scholar : PubMed/NCBI
|
|
25
|
Livak KJ and Schmittgen TD: Analysis of
relative gene expression data using real-time quantitative PCR and
the 2(-delta delta (T))method. Methods. 25:402–408. 2001.
View Article : Google Scholar : PubMed/NCBI
|
|
26
|
Bertoli C, Skotheim JM and de Bruin RA:
Control of cell cycle transcription during G1 and S phases. Nat Rev
Mol Cell Biol. 14:518–528. 2013. View
Article : Google Scholar : PubMed/NCBI
|
|
27
|
Fisher RP: CDKs and cyclins in
transition(s). Curr Opin Genet Dev. 7:32–38. 1997. View Article : Google Scholar : PubMed/NCBI
|
|
28
|
Yabuuchi H, Yamada Y, Uchida T,
Sunathvanichkul T, Nakagawa T and Masukata H: Ordered assembly of
Sld3, GINS and Cdc45 is distinctly regulated by DDK and CDK for
activation of replication origins. EMBO J. 25:4663–4674. 2006.
View Article : Google Scholar : PubMed/NCBI
|
|
29
|
Choi JM, Lim HS, Kim JJ, Song OK and Cho
Y: Crystal structure of the human GINS complex. Genes Dev.
21:1316–1321. 2007. View Article : Google Scholar : PubMed/NCBI
|
|
30
|
Cohen SM, Chastain PD II, Cordeiro-Stone M
and Kaufman DG: DNA replication and the GINS complex: Localization
on extended chromatin fibers. Epigenetics Chromatin. 2:62009.
View Article : Google Scholar : PubMed/NCBI
|
|
31
|
Tessema M, Lehmann U and Kreipe H: Cell
cycle and no end. Virchows Arch. 444:313–323. 2004. View Article : Google Scholar : PubMed/NCBI
|