Introduction
Lung cancer is the leading cause of
cancer-associated mortality worldwide, of which non-small cell lung
cancer (NSCLC) accounts for ~80% of all cases (1). Survival rate analyses of patients with
lung cancer have become a key point of interest in recent years.
Survival rates of patients with NSCLC are associated with early
diagnosis and treatment, as well as a number of other factors
including the stage of the disease, which is based on the
evaluation of the tumor (T), node (N) and metastasis (M) grading
system, and the assignment of disease staging (I–IV) (2). Collectively, these factors are important
in determining patient prognosis; however, it is important to note
that numerous patients presenting at early stage are capable of
relapse (3,4).
Currently, lung cancer-associated pathological
differences are not yet well-established; however,
[18F]fluorodeoxyglucose (18F-FDG) positron
emission tomography (PET)/computed tomography (CT) may be a useful
tool in observing tumor characteristics and patient prognosis
non-invasively. Metabolic tumor burden measurements including
metabolic tumor volume (MTV) and total lesion glycolysis (TLG) have
been developed previously, which provide information on tumor
volume and metabolic activity, respectively (5,6). Despite
previous studies demonstrating the superiority of MTV and/or TLG
calculations compared with the maximum standardized uptake value
(SUVmax) for measuring tumor burden, the practicality of
using MTV and/or TLG has not been without controversy (7). In addition, PET Response Criteria In
Solid Tumors (PERCIST) 1.0 recommends that the standardized uptake
value corrected for lean body mass (SUL)peak should
replace the traditional standardized uptake value
(SUV)max; however, an association between SUL and
long-term survival rates has not yet been demonstrated.
Furthermore, intratumoral heterogeneity characterized by PET has
demonstrated a predictive and prognostic value over SUV
measurements (8,9). In the present study, the prognostic
value of 18F-FDG PET/CT parameters, including
SUVmax, SUVmean, SULmax,
SULmean, SULpeak, MTV and TLG, were
investigated for the management of patients with NSCLC.
Materials and methods
Patients
The present study was approved by the Institutional
Review Board of Tianjin Medical University Cancer Institute and
Hospital (Tianjin, China). A retrospective review of the medical
records of patients with NSCLC who had undergone baseline
18F-FDG-PET/CT prior to initial therapy was conducted.
Written informed consent was obtained from each patient prior to
each PET/CT scan. All patients were followed up for ≥5 years after
surgery. A total of 203 consecutive patients (62.05±10.78 years)
who were pathologically diagnosed with NSCLC at Tianjin Medical
University Cancer Institute and Hospital (Tianjin, China) between
February 2004 and August 2010 were included in the present study.
Inclusion criteria included: i) All patients had a pre-therapy
baseline PET/CT scan; ii) primary lung cancer was treated using
surgery; iii) patients had no history or concurrent diagnosis of
another type of cancer; and iv) patients were followed up for ≥5
years after surgery.
PET/CT protocol
All patients were required to fast for ≥6 h prior to
the 60 min uptake period of 18F-FDG (3.70-4.81 mBq/kg).
Blood glucose was measured using a finger blood test (CNGQFOC8,
UltraVue; Johnson & Johnson, Shanghai, China) prior to the
injection to ensure that levels were <6.8 mmol/l. Scanning was
performed from head to thigh using a PET/CT system (Discovery ST4;
GE Healthcare, Chicago, IL, USA). The protocol included an initial
CT scan followed by PET acquisition. The initial CT was performed
at 120 kV and 100 mA, and the slice thickness was 5 mm. PET data
were obtained in three-dimensional mode with an acquisition time of
2 min for each bed, with between 6 and 8 bed positions being
completed. PET images were reconstructed with attenuation
correction calculated from co-registered CT images using ordered
subset expectation maximization (OSEM) iterative algorithm
(10). Following completion of
acquisition, separate PET images, CT images and fused PET/CT data
were available for review in coronal, sagittal and axial planes
using an Xeleris review station (GE Healthcare) and PET volume
computerized assisted reporting (PETVCAR) on an Advantage
Workstation (version 4.6; GE Healthcare,) (11) was used to analyze results.
Image analysis
Images were observed using a Xeleris review station,
which allowed visualization of PET/CT and fused sections in
transverse, coronal and sagittal planes. Images were interpreted by
two board-certified nuclear medicine physicians who were informed
of patients' clinical data at the time of scanning; however, they
were not aware of the patient outcome.
Metabolic characteristics of lung cancer using
18F-FDG uptake assisted in defining the volume of
interest (VOI) metabolic parameter, which was created over the lung
cancer (>0.5 cm in diameter) using PETVCAR on an Advantage
Workstation (version 4.6; GE Healthcare). PETVCAR is an automated
segmentation software system that uses an iterative adaptive
algorithm to detect the threshold level; this separates the target
volume from the background tissue by determining the
SUVmax and the SUVmean within a target
volume, with a weighting factor of 0.5 (12). A VOI was placed around the primary
tumor to ensure that all the tumor activity was within the VOI,
while avoiding regions of physiologically increased activity (e.g.
18F-FDG uptake in the heart). If high-activity
structures could not be avoided, they were removed prior to
analysis.
When segmentation is at an estimated threshold,
PETVCAR was used to calculate the following parameters for lung
cancer VOI: SUVmax and SULmax were defined as
the maximum SUV and SUL, respectively, within the target volume,
and were derived from the single voxel with the highest tracer
uptake within the VOI; SUVmean and SULmean
were calculated as the sum of SUV or SUL in each voxel within the
target volume, divided by the number of voxels within the target
volume, which were derived from all voxels within the VOI, assuming
that it reflected the tracer uptake within that VOI;
SULpeak was defined as the largest possible mean value
of a 1 cm3 spherical region of interest (ROI) within a
tumor; MTVPETVCAR represented the contoured tumor
tissues with accumulation of 18F-FDG;
TLGPETVCAR was defined as the product of
SUVmean and MTV; SD was defined as the standard
deviation of SUV.
Once segmentation had reached the maximum percentage
threshold, PETVCAR was used to calculate several parameters for
lung cancer VOI, including MTV25, MTV42, MTV50 and MTV75%, which
were defined as tumor volume with an absolute threshold of 25, 42,
50 and 75% of the histogram of SUVmax, respectively.
When segmentation was at a fixed threshold
(SUV>2.5), PETVCAR was used to calculate several parameters for
lung cancer VOI, including MTV2.5, and TLG2.5. MTV2.5 was defined
as tumor volume with SUV >2.5 being the absolute threshold,
whereas TLG2.5 was defined as the product of SUVmean and
MTV2.5.
Lung cancer staging
Disease staging was determined according to the TNM
staging system and PET/CT results. Brain magnetic resonance imaging
scans were performed in order to detect any potential brain
metastases. If patients had undergone a mediastinoscopy, these
results superseded the imaging results in mediastinum nodal
staging. Tumor location was divided into right upper lung, right
middle lung, right lower lung, left upper lung, left lower lung and
double lung. According to the different pathological types, all
patients with NSCLC were divided into three groups: Adenocarcinoma,
squamous cell carcinoma and others.
Statistical analysis
Multivariate analyses using Cox's proportional
hazards regression were performed for the assessment of the
association between initial PET/CT measurements and overall
survival (OS). Multivariate models were adjusted for sex, age,
smoking status, disease staging, SUVmean,
SUVmax, SULmean, SULmax,
SULpeak, MTVPETVCAR, MTV2.5, MTV25%, MTV42%,
MTV50%, MTV75%, TLGPETVCAR, TLG2.5 and SD. K-M estimator
curves were constructed following the production of three
approximately equal-sized groups (n=65, 64 and 64) using tertiles
from each PET/CT measurement, and the differences in survival rates
within these groups were assessed using the log-rank test. OS
curves were plotted using the K-M estimator method, and the
differences in survival rates within these groups were assessed
using the log-rank test. Statistical analysis was used to assess
whether these new measurements provided any additional information
regarding patient survival rates compared with the risk factor
provided by assessing the cancer stage. OS was calculated from the
date of surgery to the last follow-up or the time of patient
mortality. P<0.05 was considered to indicate a statistically
significant difference. All statistical analyses were performed
using SPSS (version 17.0; SPSS, Inc., Chicago, IL, USA).
Results
Patient characteristics
In total, 203 patients fulfilled the inclusion
criteria, of which 114 were adenocarcinoma, 66 were squamous cell
carcinoma, 10 were adenosquamous carcinoma, 4 were large cell
carcinoma, 3 were atypical carcinoid, 2 were poorly differentiated
mucous epidermoid carcinoma, 2 were lymphoepithelioma-like
carcinoma and 2 were sarcomatoid carcinoma (Table I).
 | Table I.Patient characteristics. |
Table I.
Patient characteristics.
| Variables | No. of
patients | Proportion, % |
|---|
| Sex |
|
|
|
Male | 116 | 57.1 |
|
Female | 87 | 42.9 |
| Histology |
|
|
|
Adenocarcinoma | 114 | 56.2 |
|
Squamous cell carcinoma | 66 | 32.5 |
|
Others | 23 | 11.3 |
| Smoking
history |
|
|
|
Adenocarcinoma | 44 | 38.6 |
|
Squamous cell carcinoma | 58 | 87.9 |
| Others | 17 | 73.9 |
| Stage |
|
|
| IA | 72 | 35.5 |
| IB | 32 | 15.8 |
|
IIA | 33 | 16.3 |
|
IIB | 9 | 4.4 |
|
IIIA | 34 | 16.7 |
|
IIIB | 7 | 3.4 |
| IV | 16 | 7.9 |
| Tumor location |
|
|
|
RUL | 60 | 29.6 |
|
RML | 17 | 8.4 |
|
RLL | 36 | 17.7 |
|
LUL | 48 | 23.6 |
|
LLL | 41 | 20.2 |
| DL | 1 | 0.5 |
Survival rate analyses
The 5-year survival rate of 203 patients was 57±3%
(mean ± standard error of the mean). The 95% confidence interval
for the 5-year cumulative survival rate of patients was 62.88 and
51.11%.
Multivariate models were adjusted for different
pathological types, sex, age, smoking status, disease stage and
tumor location in 203 patients. Results demonstrated a significant
association between OS and pathological types (P=0.01), and also
stage (P<0.001); however, no significant differences were
identified between OS and sex, age, smoking status and/or location.
In total, 9 patients with adenocarcinoma and 1 patient with
squamous cell carcinoma were associated with undetectable levels of
18F-FDG uptake (Table
II); therefore 18F-FDG parameters were measured in
193 patients. Results demonstrated significant associations between
OS and disease stage [P<0.001; odds ratio (OR)=1.414],
MTVPETVCAR (P=0.002; OR=0.987), MTV2.5 (P=0.009;
OR=0.948), MTV25% (P=0.003; OR=1.055), MTV42% (P=0.04; OR=0.907)
and TLGPETVCAR (P=0.003; OR=1.016). Results presented
little difference between OR values and survival rates, which
suggests that the influence of various parameters on survival rates
are similar; however, no significant associations were identified
between OS and MTV50, MTV75%, TLG2.5, all SUV and/or SUL.
| Table II.Characteristics of PET-negative
patients with NSCLC. |
Table II.
Characteristics of PET-negative
patients with NSCLC.
| Status | Time, months | Stage | Smoking status | Sex | Age, years |
|---|
| Alive | 22.57 | IIIA | Yes | Female | 57 |
| Deceased | 24.90 | IA | No | Male | 58 |
| Deceased | 38.50 | IIIA | Yes | Male | 47 |
| Alive | 39.33 | IIIA | Yes | Female | 62 |
| Deceased | 64.30 | IA | Yes | Female | 47 |
| Deceased | 64.33 | IV | Yes | Female | 57 |
| Deceased | 83.67 | IA | Yes | Female | 50 |
| Alive | 94.60 | IA | No | Male | 57 |
| Alive | 108.00 | IA | Yes | Female | 55 |
According to the results obtained from pathological
analysis, 193 patients were divided into three groups:
Adenocarcinoma, squamous cell carcinoma and others. Cox's
multivariate analyses were performed regarding OS adjusted for
stage, SUVmean, SUVmax, SULmean,
SULmax, SULpeak, MTVPETVCAR,
MTV2.5, MTV25, MTV42, MTV50, MTV75%, TLGPETVCAR, TLG2.5
and SD within each group, respectively. Results obtained from the
adenocarcinoma group demonstrated significant associations between
OS and stage (P<0.001), MTV50% (P=0.002) and MTV42% (P=0.004).
Results obtained from the squamous cell carcinoma group
demonstrated significant associations between OS and
SULmean (P=0.010), MTV25% (P=0.005) and MTV42%
(P=0.001). Results obtained from the others group demonstrated no
significance between OS and all other parameters.
In total, 193 patients were divided into early-stage
(I and II; n=140) and late-stage (III and IV; n=53). Cox's
multivariate analyses were performed with regard to OS adjusted for
stage, SUVmean, SUVmax, SULmean,
SULmax, SULpeak, MTVPETVCAR,
MTV2.5, MTV25%, MTV42%, MTV50%, MTV75%, TLGPETVCAR,
TLG2.5 and SD within each group, respectively. Results from the
early-stage group demonstrated significant associations between OS,
MTV42% (P=0.02; OR=1.572) and MTV50% (P=0.04; OR=0.871).
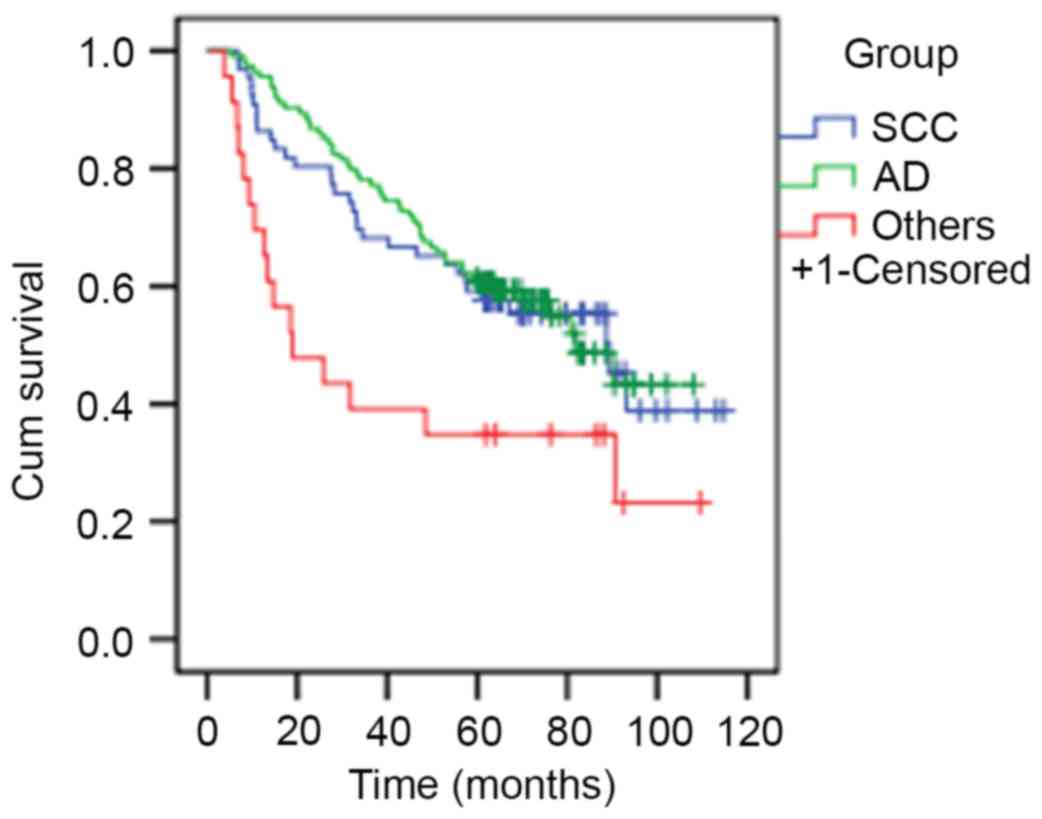
Patients with squamous cell carcinoma or
adenocarcinoma exhibited significantly increased median survival
rates compared with patients within the others group (89.37, 81.80
and 18.93 months, respectively; P=0.009; Fig. 1).
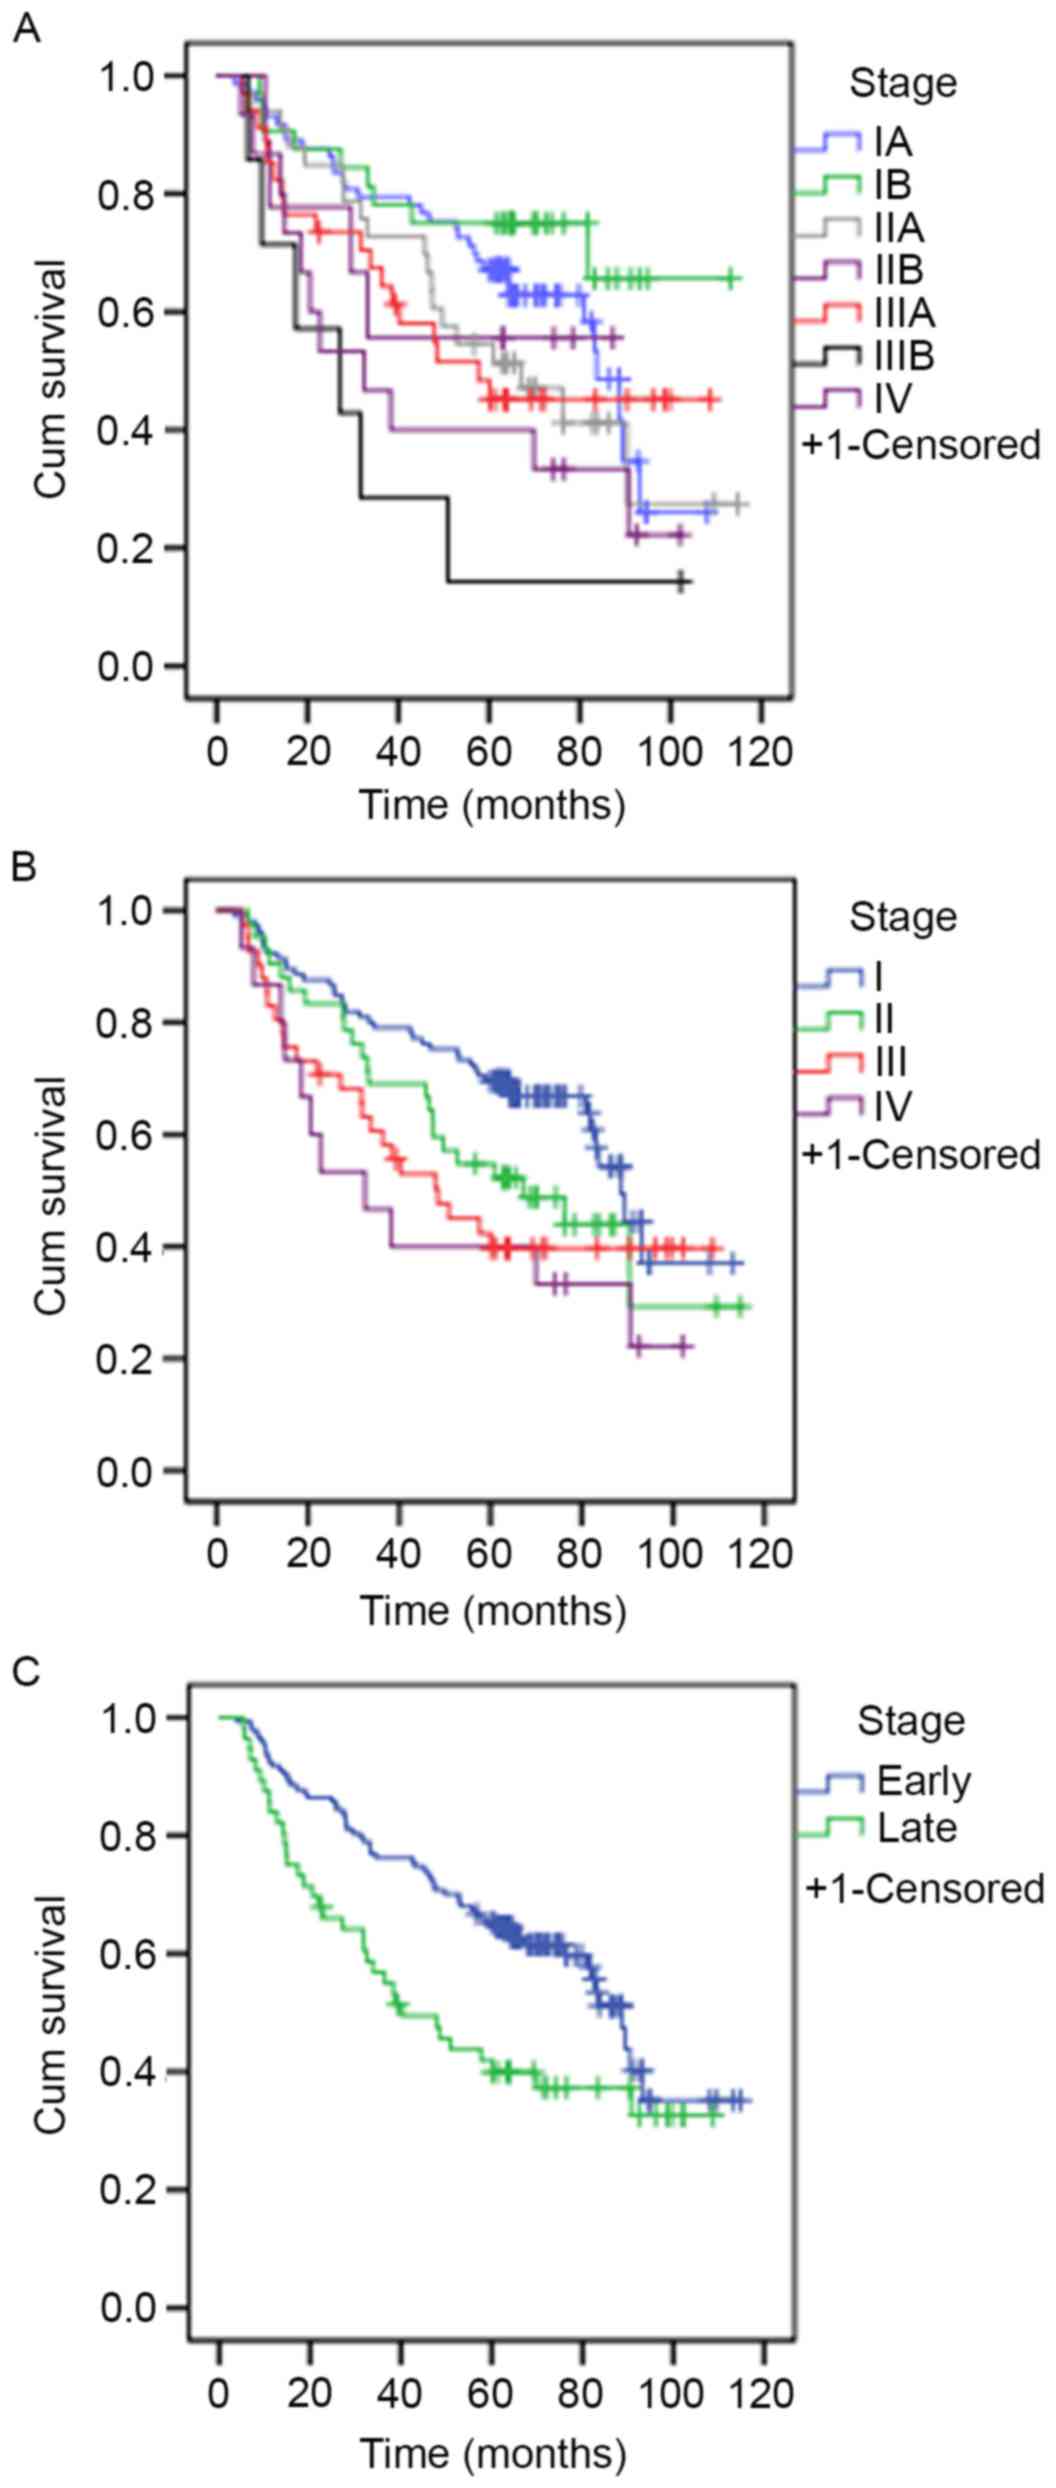
The median survival rate of patients was 83.6 months
at stage IA, >60 months at stage IB, 67.07 months at stage IIA,
>60 months at stage IIB, 57.60 months at stage IIIA, 27.13
months at stage IIIB and 32.5 months at stage IV. These results
were statistically significant (P=0.013). The median survival rates
for patients was 88.67 months at stage I, 67.07 months at stage II,
48.05 months at stage III and 32.5 months at stage IV. These
results were also statistically significant (P=0.02). The median
survival rate of patients who presented at an early-stage was
significantly increased compared with patients who presented at a
late stage (88.67 vs. 40.33 months, respectively; P=0.02). The
survival curves are presented in Fig.
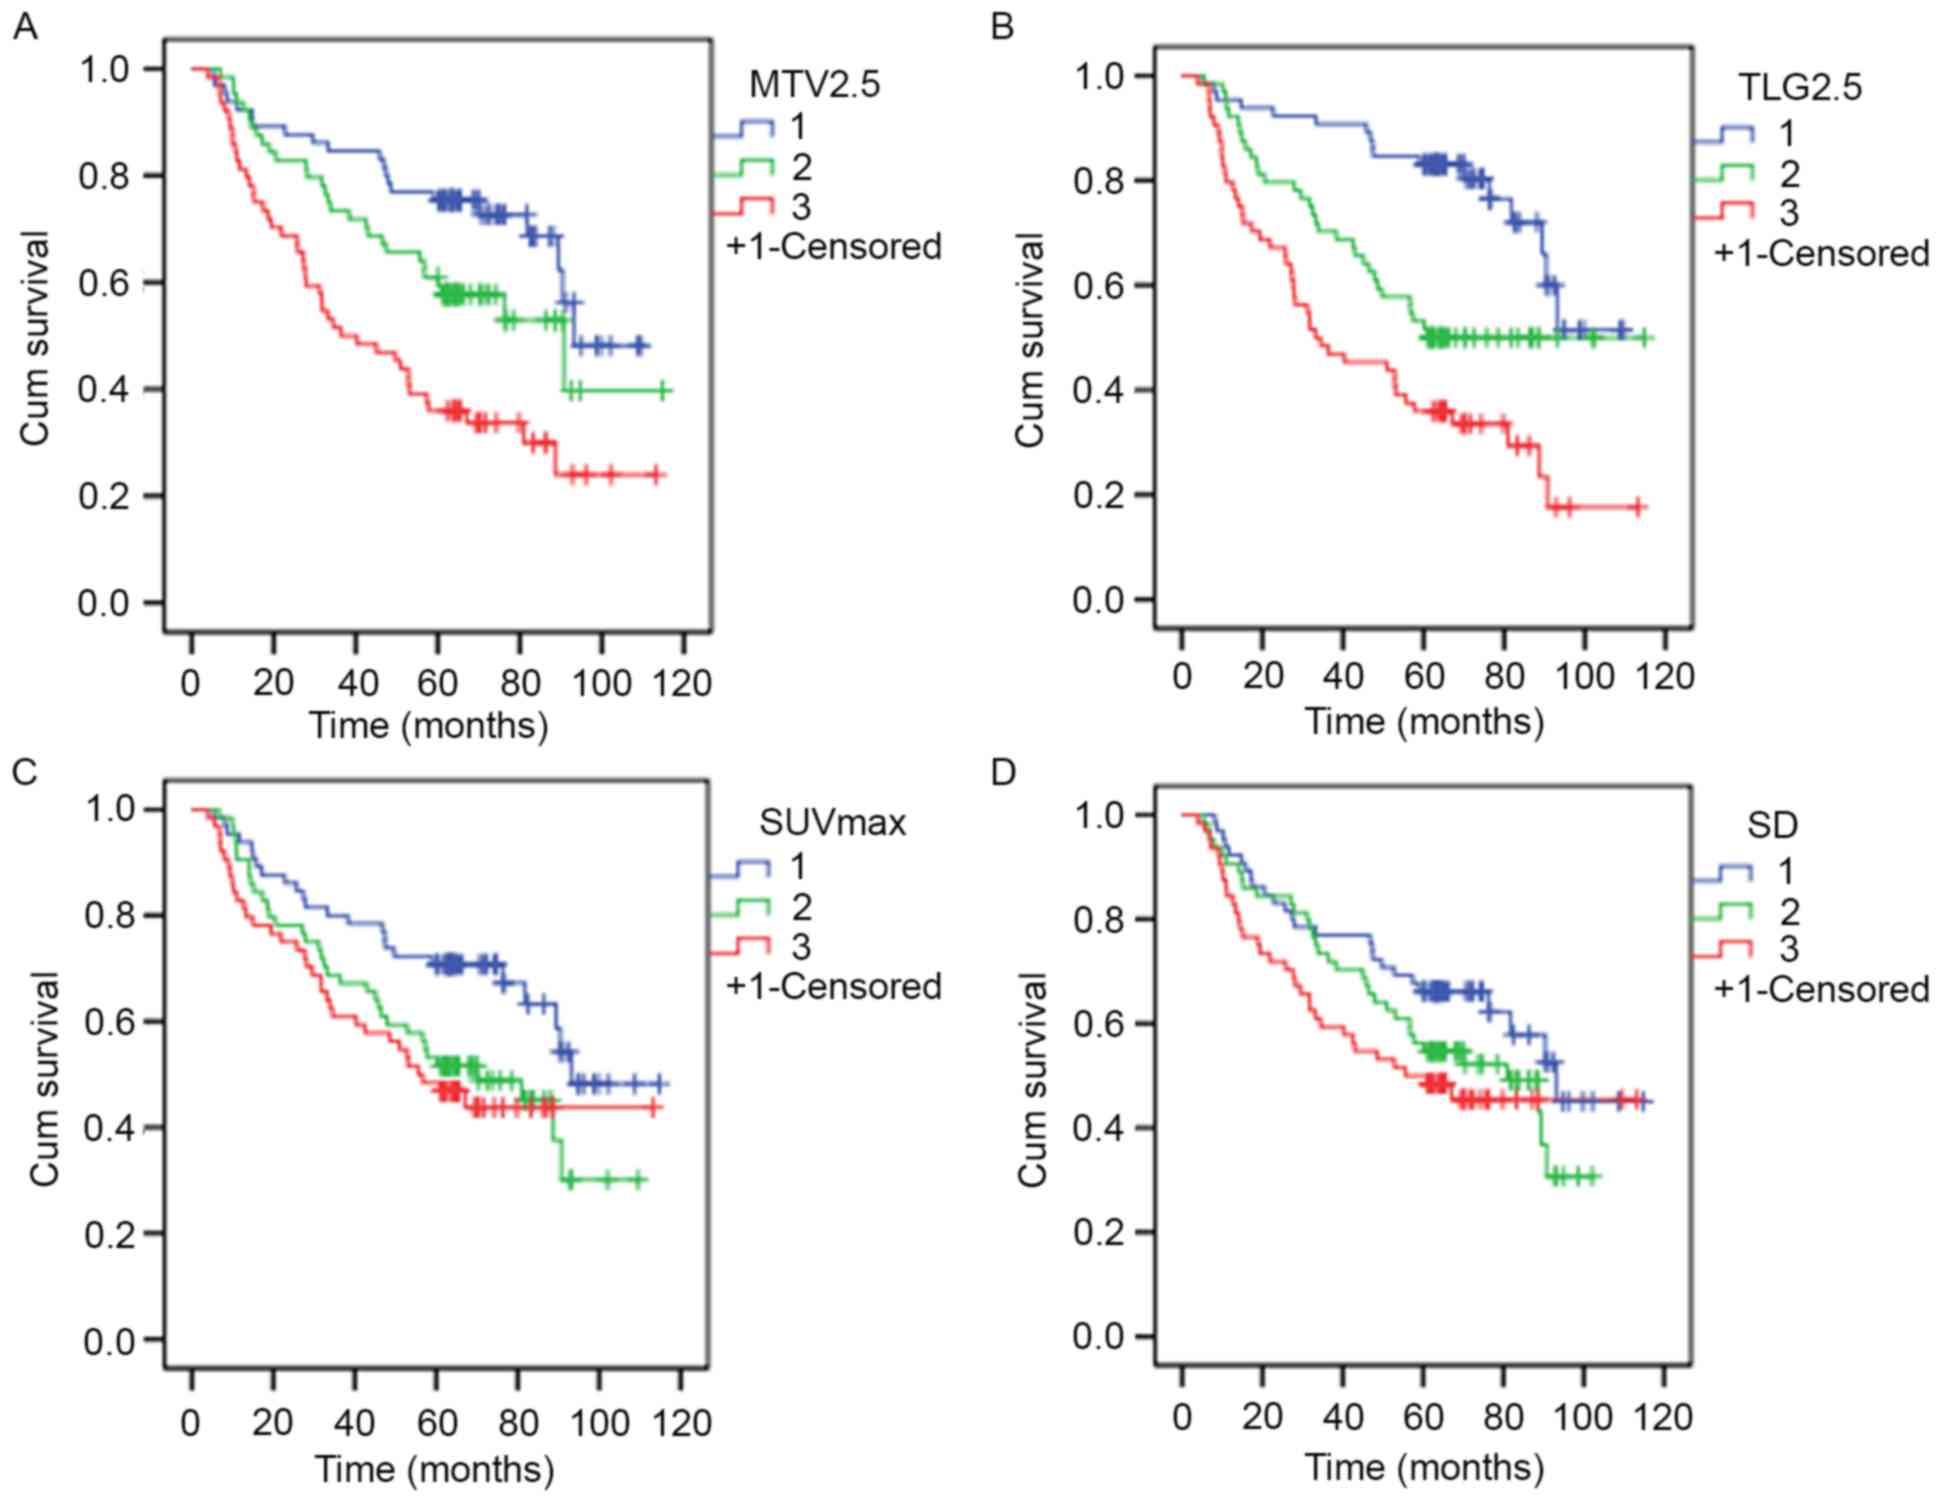
2. K-M estimator curves were constructed following the
formation of three approximately equal-sized groups using tertiles
from PET/CT indices. Results are presented in Table III, with representative survival
rate curves presented in Fig. 3.
Results demonstrated statistical significance among all PET/CT
indices with the exception of SD. Furthermore, results demonstrated
that as OS decreases, metabolism increases.
| Table III.Results from Kaplan-Meier estimator
curves following the formation of three approximately equal-sized
groups using tertiles from each PET/CT indices. |
Table III.
Results from Kaplan-Meier estimator
curves following the formation of three approximately equal-sized
groups using tertiles from each PET/CT indices.
| PET metabolic
index | Log-rank test | P-value |
|---|
|
MTVPETVCAR | 21.709 | <0.001 |
| MTV2.5 | 21.389 | <0.001 |
| MTV25% | 28.489 | <0.001 |
| MTV42% | 19.709 | <0.001 |
| MTV50% | 20.099 | <0.001 |
| MTV75% | 18.154 | <0.001 |
|
TLGPETVCAR | 27.084 | <0.001 |
| TLG 2.5 | 30.520 | <0.001 |
|
SUVmax | 7.942 | 0.019 |
|
SUVmean | 8.224 | 0.016 |
|
SULmax | 15.337 | <0.001 |
|
SULmean | 7.628 | 0.022 |
|
SULpeak | 17.489 | <0.001 |
| SD | 4.591 | 0.101 |
Discussion
In the present study, the prognostic value of
18F-FDG PET/CT metabolic parameters was investigated.
The Cox's multivariate models demonstrated that there were
significant associations between OS and various pathological
parameters and disease stages. The results of the present study are
in agreement with those of previous studies, which demonstrate that
TNM staging may serve as a prognostic marker for patients with lung
cancer (2,13–15).
However, results demonstrated no significant associations between
OS and sex, age, smoking status or tumor location. This is not in
agreement with previous studies, which have demonstrated an
association between these parameters and survival rates (16–18). A
number of studies have discussed the association between tumor
location regarding pre-treatment images and prognosis; however, the
results differed. Lally et al (19) reported that the location of the main
bronchus was one of primary risks associated with mortality;
however, Bandoh et al (20)
demonstrated that no significant difference in prognosis was
identified between the peripheral and central types of lung
cancer.
Cox's multivariate analyses using PET metabolic
indices demonstrated significant associations between OS and
MTVPETVCAR, MTV2.5, MTV25%, MTV42% or
TLGPETVCAR; however, no significant differences were
identified between OS and MTV50%, MTV75%, TLG2.5, or all SUV and
SUL. Therefore, these results suggest that MTV and TLG are improved
prognostic markers for patients with lung cancer compared with SUV
and SUL measurements. 18F-FDG PET/CT-based imaging
parameters including SUVmax, MTV and TLG have been
previously suggested as potential prognostic markers for various
types of neoplasm (21–24). This may be due to SUV and SUL being a
single voxel value, and therefore may not represent total tumor
metabolism. However, accumulating evidence suggests that MTV and
TLG are superior in assessing NSCLC response compared with
SUVmax; however, the efficient determination of these
values is not yet well-established (1,25–29). Results from recent studies demonstrate
that MTV and TLG were computed using a maximum percentage threshold
of 40-50% (30,31). However, other studies used a fixed SUV
threshold, most commonly SUV2.5, where SUV>2.5 is the absolute
threshold (TLG2.5 or MTV2.5), particularly for segmentation of lung
tumors (32–34). Increasing interest in volumetric
indices has led to the development of commercially available tools,
for example PETVCAR, which enables the rapid and simple measurement
of numerous indices for tumor analysis, including various threshold
values of MTV and TLG (typically, 41-70% of SUVmax
within the tumor) (35). However,
there are also several conflicting results regarding the prognostic
value of volumetric parameters in NSCLC (36,37).
Furthermore, the association between survival rates and SUL remains
unclear.
Results from subgroup data with regard to pathology
analysis demonstrated that patients with adenocarcinoma exhibited a
significant association between OS and stage, MTV50% or MTV42%;
patients with squamous cell carcinoma exhibited significant
associations between OS and SULmean, MTV25% or MTV42%;
patients assigned to the others group did not exhibit any
significant associations. Early stage Cox's multivariate analyses
demonstrated significant associations between OS and MTV42% or
MTV50%; however, no significant differences were identified in
late-stage Cox's multivariate analyses. Therefore, MTV50% and/or
MTV42% in adenocarcinoma or early stage, and MTV25% and/or MTV42%
in squamous cell carcinoma may provide an improved prediction of
prognosis compared with other metabolic indexes
(SUVmean, SUVmax, SULmean,
SULmax, SULpeak, MTVPETVCAR,
MTV2.5, MTV75%, TLGPETVCAR, TLG2.5 and SD) for patients
with NSCLC. In 2013, Machtay et al (38) conducted a large prospective
multi-center study investigating 250 patients with stage III NSCLC
and demonstrated that pretreatment SUVmax was not
associated with survival rates.
K-M estimator analyses demonstrated that the
pathology, stage and all PET metabolic parameters with the
exception of SD were significantly associated with OS. These
results are not in agreement with those obtained from the Cox's
multivariate analyses. The K-M survival rate curves of a number of
indexes had a common crossover point, that may have lead to the
different results of K-M estimator analyses and the Cox.
Furthermore, previous studies investigating the use of PET
intratumoral heterogeneity characterization demonstrated a
potential added predictive and prognostic value over simple SUV
measurements (8,9). However, SD demonstrated no significant
association with OS in the Cox's multivariate analyses or the K-M
log-rank test.
It is important to note that the present study has
several limitations. First, the retrospective nature has resulted
in numerous biases including the fact that patient characteristics
may not be representative of an entire population. Secondly, the
present study was performed at a single hospital, and therefore
results are not representative of national or international
populations. Thirdly, all patients had undergone primary lung
cancer surgery, which may induce results bias. Therefore,
prospective large-scale multicenter studies with longer follow-up
periods and patients that have undergone various types of therapy
are required to identify the prognostic markers of post-surgical
outcomes.
In conclusion, 18F-FDG PET/CT
quantitative parameters including MTVPETVCAR, MTV2.5,
MTV25, MTV42% and TLGPETVCAR exhibit prognostic value
for OS; however, MTV50, MTV75%, TLG2.5, SD, all SUV and SUL do not.
There were certain differences within the subgroups. Selection of
appropriate metabolic parameters may be useful in predicting
prognosis for future patients with NSCLC.
Acknowledgements
Not applicable.
Funding
The present study was supported by the National
Natural Science Foundation of Tianjin (grant no. 16JCZDJC35200) and
the Tianjin Municipal Bureau of Health Science and Technology Fund
(grant no. 2013KZ090).
Availability of data and materials
The datasets used and/or analyzed during the current
study are available from the corresponding author on reasonable
request.
Authors' contributions
WX and WM designed this study and prepared this
manuscript; MW, XL, HH, YZ, XS, DD collected clinical samples and
analyzed data.
Ethics approval and consent to
participate
The present study was approved by the Department of
Molecular Imaging and Nuclear Medicine, Tianjin Medical University
Cancer Institute and Hospital (Tianjin, China) and written informed
consent was obtained from all patients.
Patient consent for publication
Written informed consent was obtained from all
participants prior to publication.
Competing interests
The authors declare that they have no competing
interests.
References
|
1
|
Zaizen Y, Azuma K, Kurata S, Sadashima E,
Hattori S, Sasada T, Imamura Y, Kaida H, Kawahara A, Kinoshita T,
et al: Prognostic significance of total lesion glycolysis in
patients with advanced non-small cell lung cancer receiving
chemotherapy. Eur J Radiol. 81:4179–4184. 2012. View Article : Google Scholar : PubMed/NCBI
|
|
2
|
UyBico SJ, Wu CC, Suh RD, Le NH, Brown K
and Krishnam MS: Lung cancer staging essentials: The new TNM
staging system and potential imaging pitfalls. Radiographics.
30:1163–1181. 2010. View Article : Google Scholar : PubMed/NCBI
|
|
3
|
van Rens MT, de la Rivière AB, Elbers HR
and van Den Bosch JM: Prognostic assessment of 2,361 patients who
underwent pulmonary resection for non-small cell lung cancer, stage
I, II, and IIIA. Chest. 117:374–379. 2000. View Article : Google Scholar : PubMed/NCBI
|
|
4
|
Pignon JP, Tribodet H, Scagliotti GV,
Douillard JY, Shepherd FA, Stephens RJ, Dunant A, Torri V, Rosell
R, Seymour L, et al: Lung adjuvant cisplatin evaluation: A pooled
analysis by the LACE Collaborative Group. J Clin Oncol.
26:3552–3559. 2008. View Article : Google Scholar : PubMed/NCBI
|
|
5
|
Lee P, Weerasuriya DK, Lavori PW, Quon A,
Hara W, Maxim PG, Le QT, Wakelee HA, Donington JS, Graves EE and
Loo BW Jr: Metabolic tumor burden predicts for disease progression
and death in lung cancer. Int J Radiat Oncol Biol Phys. 69:328–333.
2007. View Article : Google Scholar : PubMed/NCBI
|
|
6
|
Larson SM, Erdi Y, Akhurst T, Mazumdar M,
Macapinlac HA, Finn RD, Casilla C, Fazzari M, Srivastava N, Yeung
HW, et al: Tumor treatment response based on visual and
quantitative changes in global tumor glycolysis using PET-FDG
imaging. The visual response score and the change in total lesion
glycolysis. Clin Positron Imaging. 2:159–171. 1999. View Article : Google Scholar : PubMed/NCBI
|
|
7
|
Burger IA, Casanova R, Steiger S, Husmann
L, Stolzmann P, Huellner MW, Curioni A, Hillinger S, Schmidtlein CR
and Soltermann A: 18F-FDG PET/CT of non-small cell lung carcinoma
under neoadjuvant chemotherapy: Background based adaptive-volume
metrics outperform TLG and MTV in predicting histopathological
response. J Nucl Med. 57:849–854. 2016. View Article : Google Scholar : PubMed/NCBI
|
|
8
|
Rizk NP, Tang L, Adusumilli PS, Bains MS,
Akhurst TJ, Ilson D, Goodman K and Rusch VW: Predictive value of
initial PET-SUVmax in patients with locally advanced esophageal and
gastroesophageal junction adenocarcinoma. J Thorac Oncol.
4:875–879. 2009. View Article : Google Scholar : PubMed/NCBI
|
|
9
|
Hoekstra CJ, Paglianiti I, Hoekstra OS,
Smit EF, Postmus PE, Teule GJ and Lammertsma AA: Monitoring
response to therapy in cancer using
[18F]-2-fluoro-2-deoxy-D-glucose and positron emission tomography:
An overview of different analytical methods. Eur J Nucl Med.
27:731–743. 2000. View Article : Google Scholar : PubMed/NCBI
|
|
10
|
Merlin T, Visvikis D, Fernandez P and
Lamare F: A novel partial volume effects correction technique
integrating deconvolution associated with denoising within an
iterative PET image reconstruction. Med Phys. 42:804–819. 2015.
View Article : Google Scholar : PubMed/NCBI
|
|
11
|
Moule RN, Kayani I, Prior T, Lemon C,
Goodchild K, Sanghera B, Wong WL and Saunders MI: Adaptive
18fluoro-2-deoxyglucose positron emission tomography/computed
tomography-based target volume delineation in radiotherapy planning
of head and neck cancer. Clin Oncol (R Coll Radiol). 23:364–371.
2011. View Article : Google Scholar : PubMed/NCBI
|
|
12
|
Crivellaro C, Signorelli M, Guerra L, De
Ponti E, Buda A, Dolci C, Pirovano C, Todde S, Fruscio R and Messa
C: 18F-FDG PET/CT can predict nodal metastases but not recurrence
in early stage uterine cervical cancer. Gynecol Oncol. 127:131–135.
2012. View Article : Google Scholar : PubMed/NCBI
|
|
13
|
Edge SB and Compton CC: The American Joint
Committee on Cancer: The 7th edition of the AJCC cancer staging
manual and the future of TNM. Ann Surg Oncol. 17:1471–1474. 2010.
View Article : Google Scholar : PubMed/NCBI
|
|
14
|
Adebonojo SA, Bowser AN, Moritz DM and
Corcoran PC: Impact of revised stage classification of lung cancer
on survival: A military experience. Chest. 115:1507–1513. 1999.
View Article : Google Scholar : PubMed/NCBI
|
|
15
|
Gadgeel SM, Ramalingam SS and Kalemkerian
GP: Treatment of lung cancer. Radiol Clin North Am. 50:961–974.
2012. View Article : Google Scholar : PubMed/NCBI
|
|
16
|
Grivaux M, Zureik M, Marsal L, Asselain B,
Peureux M, Chavaillon JM, Prudhomme A, Carbonnelle M, Goarant E,
Maury B, et al: Five-year survival for lung cancer patients managed
in general hospitals. Rev Mal Respir. 26:37–44. 2009.(In French).
View Article : Google Scholar : PubMed/NCBI
|
|
17
|
Spira A and Ettinger DS: Multidisciplinary
management of lung cancer. N Engl J Med. 350:379–392. 2004.
View Article : Google Scholar : PubMed/NCBI
|
|
18
|
Socinski MA, Morris DE, Masters GA and
Lilenbaum R; American College of Chest Physicians, :
Chemotherapeutic management of stage IV non-small cell lung cancer.
Chest. 123 1 Suppl:226S–243S. 2003. View Article : Google Scholar : PubMed/NCBI
|
|
19
|
Lally BE, Geiger AM, Urbanic JJ, Butler
JM, Wentworth S, Perry MC, Wilson LD, Horton JK, Detterbeck FC,
Miller AA, et al: Trends in the outcomes for patients with limited
stage small cell lung cancer: An analysis of the surveillance,
epidemiology, and end results database. Lung Cancer. 64:226–231.
2009. View Article : Google Scholar : PubMed/NCBI
|
|
20
|
Bandoh S, Fujita J, Ueda Y, Fukunaga Y,
Dohmoto K, Hojo S, Yang Y, Yamaji Y, Takahara J and Ishida T:
Expression of carcinoembryonic antigen in peripheral-or
central-located small cell lung cancer: Its clinical significance.
Jpn J Clin Oncol. 31:305–310. 2001. View Article : Google Scholar : PubMed/NCBI
|
|
21
|
Pak K, Cheon GJ, Nam HY, Kim SJ, Kang KW,
Chung JK, Kim EE and Lee DS: Prognostic value of metabolic tumor
volume and total lesion glycolysis in head and neck cancer: A
systematic review and meta-analysis. J Nucl Med. 55:884–890. 2014.
View Article : Google Scholar : PubMed/NCBI
|
|
22
|
Guy MS, Jacob C, McDonald SD, Dowdy YG and
Kardan A: 18F-FDG PET/CT metabolic variability in
functioning oncocytic parathyroid adenoma with brown tumors. Clin
Nucl Med. 39:393–395. 2014. View Article : Google Scholar : PubMed/NCBI
|
|
23
|
Xu HX, Chen T, Wang WQ, Wu CT, Liu C, Long
J, Xu J, Zhang YJ, Chen RH, Liu L and Yu XJ: Metabolic tumour
burden assessed by 18F-FDG PET/CT associated with serum CA19-9
predicts pancreatic cancer outcome after resection. Eur J Nucl Med
Mol Imaging. 41:1093–1102. 2014. View Article : Google Scholar : PubMed/NCBI
|
|
24
|
Liao S, Penney BC, Wroblewski K, Zhang H,
Simon CA, Kampalath R, Shih MC, Shimada N, Chen S, Salgia R, et al:
Prognostic value of metabolic tumor burden on 18F-FDG PET in
nonsurgical patients with non small cell lung cancer. Eur J Nucl
Med Mol Imaging. 39:27–38. 2012. View Article : Google Scholar : PubMed/NCBI
|
|
25
|
Chung HW, Lee KY, Kim HJ, Kim WS and So Y:
FDG PET/CT metabolic tumor volume and total lesion glycolysis
predict prognosis in patients with advanced lung adenocarcinoma. J
Cancer Res Clin Oncol. 140:89–98. 2014. View Article : Google Scholar : PubMed/NCBI
|
|
26
|
Melloni G, Gajate AM, Sestini S,
Gallivanone F, Bandiera A, Landoni C, Muriana P, Gianolli L and
Zannini P: New positron emission tomography derived parameters as
predictive factors for recurrence in resected stage I non-small
cell lung cancer. Eur J Surg Oncol. 39:1254–1261. 2013. View Article : Google Scholar : PubMed/NCBI
|
|
27
|
Zhang H, Wroblewski K, Liao S, Kampalath
R, Penney BC, Zhang Y and Pu Y: Prognostic value of metabolic tumor
burden from (18)F-FDG PET in surgical patients with non-small-cell
lung cancer. Acad Radiol. 20:32–40. 2013. View Article : Google Scholar : PubMed/NCBI
|
|
28
|
Hyun SH, Ahn HK, Kim H, Ahn MJ, Park K,
Ahn YC, Kim J, Shim YM and Choi JY: Volume-based assessment by
(18)F-FDG PET/CT predicts survival in patients with stage III
non-small-cell lung cancer. Eur J Nucl Med Mol Imaging. 41:50–58.
2014. View Article : Google Scholar : PubMed/NCBI
|
|
29
|
Usmanij EA, de Geus-Oei LF, Troost EG,
Peters-Bax L, van der Heijden EH, Kaanders JH, Oyen WJ, Schuurbiers
OC and Bussink J: 18F-FDG PET early response evaluation of locally
advanced non-small cell lung cancer treated with concomitant
chemoradiotherapy. J Nucl Med. 54:1528–1534. 2013. View Article : Google Scholar : PubMed/NCBI
|
|
30
|
Vargas HA, Burger IA, Goldman DA, Miccò M,
Sosa RE, Weber W, Chi DS, Hricak H and Sala E: Volume-based
quantitative FDG PET/CT metrics and their association with optimal
debulking and progression-free survival in patients with recurrent
ovarian cancer undergoing secondary cytoreductive surgery. Eur
Radiol. 25:3348–3353. 2015. View Article : Google Scholar : PubMed/NCBI
|
|
31
|
Gallicchio R, Mansueto G, Simeon V,
Nardelli A, Guariglia R, Capacchione D, Soscia E, Pedicini P,
Gattozzi D, Musto P and Storto G: F-18 FDG PET/CT quantization
parameters as predictors of outcome in patients with diffuse large
B-cell lymphoma. Eur J Haematol. 92:382–389. 2014. View Article : Google Scholar : PubMed/NCBI
|
|
32
|
Lee JW, Kang CM, Choi HJ, Lee WJ, Song SY,
Lee JH and Lee JD: Prognostic value of metabolic tumor volume and
total lesion glycolysis on preoperative 18F-FDG PET/CT
in patients with pancreatic cancer. J Nucl Med. 55:898–904. 2014.
View Article : Google Scholar : PubMed/NCBI
|
|
33
|
Chung HH, Kim JW, Han KH, Eo JS, Kang KW,
Park NH, Song YS, Chung JK and Kang SB: Prognostic value of
metabolic tumor volume measured by FDG PET/CT in patients with
cervical cancer. Gynecol Oncol. 120:270–274. 2011. View Article : Google Scholar : PubMed/NCBI
|
|
34
|
Seol YM, Kwon BR, Song MK, Choi YJ, Shin
HJ, Chung JS, Cho GJ, Lee JC, Lee BJ, Wang SG, et al: Measurement
of tumor volume by PET to evaluate prognosis in patients with head
and neck cancer treated by chemo-radiation therapy. Acta Oncol.
49:201–208. 2010. View Article : Google Scholar : PubMed/NCBI
|
|
35
|
Moon SH, Hyun SH and Choi JY: Prognostic
significance of volumebased PET parameters in cancer patients.
Korean J Radiol. 14:1–12. 2013. View Article : Google Scholar : PubMed/NCBI
|
|
36
|
Vu CC, Matthews R, Kim B, Franceschi D,
Bilfinger TV and Moore WH: Prognostic value of metabolic tumor
volume and total lesion glycolysis from 18F-FDG PET/CT
in patients undergoing stereotactic body radiation therapy for
stage I non-small-cell lung cancer. Nucl Med Commun. 34:959–963.
2013. View Article : Google Scholar : PubMed/NCBI
|
|
37
|
Kim K, Kim SJ, Kim IJ, Kim YS, Pak K and
Kim H: Prognostic value of volumetric parameters measured by F-18
FDG PET/CT in surgically resected non-small-cell lung cancer. Nucl
Med Commun. 33:613–620. 2012. View Article : Google Scholar : PubMed/NCBI
|
|
38
|
Machtay M, Duan F, Siegel BA, Snyder BS,
Gorelick JJ, Reddin JS, Munden R, Johnson DW, Wilf LH, DeNittis A,
et al: Prediction of survival by [18F]fluorodeoxyglucose positron
emission tomography in patients with locally advanced
non-small-cell lung cancer undergoing definitive chemoradiation
therapy: Results of the ACRIN 6668/RTOG 0235 trial. J Clin Oncol.
31:3823–3830. 2013. View Article : Google Scholar : PubMed/NCBI
|