Introduction
Breast cancer is a common malignant disease in
women. Besides mammography and echography, MR imaging is of great
significant in breast cancer diagnosis since its higher sensitivity
and specificity (1). Depends on the
abundant imaging sequences, MR imaging provides a wealth of
morphological information for the diagnosis of breast disease.
Multiple MR sequences describe the breast tumors in different
aspects, dynamic contrast enhanced magnetic resonance imaging
(DCE-MRI) requires interpretation of four-dimensional DCE data and
relies on reader expertise, which could lead to a substantial
amount of false positive results.
GBCA is a commonly used intravenous contrast agent
for DCE-MRI, which induces an increment in the longitudinal
relaxation rate, exhibited as an enhancement in the signal
intensity of T1-weighted images. The pharmacokinetic parameters
(Ktrans, etc.) could be obtained by fitting an appropriate model to
the signal intensity time course of serial acquisition T1-weighted
images after an injected GBCA into a tissue of interest (2). Several researches have proven that these
parameters changes corresponded to the damage of microstructure in
tumor tissues (3–5).
Texture feature is a quite abstract concept for
medical imaging, it is an important surface characteristic used to
identify and recognize objects, for which it might qualified the
ability to describe the internal structures of lesion tissues
(6). Texture extracted from breast
DCE images enabled rich properties of region of interest (ROI)
areas which were also useful for diagnosing different types breast
lesions (7).
Texture feature represents the appearance of the
medical images and considers how its pixel intensity were
distributed (8), it also focuses on
the intensity distribution and the relationships of neighboring
pixels. Various texture analysis approaches tend to represent the
examined textures from different perspectives. Texture analysis was
also sensitivity to the subtle changes of the tissues that might
ambiguously for human. It has been successfully used in several
radiological studies, including subchondral bone, glioma tumor,
distinction analysis of invasive adenocarcinoma and pre-invasive or
minimally invasive adenocarcinoma (9–11).
Previously researches prefer to explore the
variances of texture parameters between different types of diseased
tissue. Loose et al (12)
evaluated the Haralick textures on DCE-MRI data for the
differentiation of Breast Tumor Lesions, Toshiaki et al
(13) adopted the histogram analysis
to the evaluation of vascular permeability in glioma. On the other
hand, chemometric methods such as principal components analysis
(PCA), support vector machine (SVM), linear discriminant analysis
(LDA), have been employed to the discriminant analysis of different
types of lesions (9,14,15), which
aims to access the overall changes in multi-texture parameters.
In the present study, pharmacokinetic parameters, as
well as the texture parameters that obtained from the DCE-MR
imaging and parameter maps were discussed, PCA and Fisher
discriminant analysis (FDA) were adopted to differentiate the
benign and malignant breast tumors based on the textures,
respectively. As to our best knowledge, this is the first try to
evaluate the diagnostic efficiency of FDA method on breast
tumors.
Materials and methods
Patients data
The present study was approved by the institutional
review board of The Wei Fang Traditional Chinese Hospital. From
December 2016 to June 2017, 56 patients with an average age of
45.3±11.1 years (25–69 years) were retrospectively enrolled.
Informed consent was signed before the patients underwent contrast
enhanced MR examination. Pathological examinations were performed
to confirm the MR examination results. All patients were sequenced
from 1 to 56 according to examination date. Fifty-six patients (23
cancer tumors, 33 benign tumors) were divided into malignant and
benign group, and the benign case including breast adenoma and
intraductal papilloma.
The patient selection criteria of the present study
were as follows: i) All lesions were histopathological confirmed by
breast surgery; ii) MR dynamic enhancement was performed no >30
days before surgery or biopsy.
MRI protocol
An MRI scan of the whole breast was performed using
a 3T whole-body scanner (GE Discovery MR 750; GE Healthcare,
Milwaukee, WI, USA) equipped with a dedicated 8-channel
double-breast phased-array coil in prone position. Breathe training
was given before MRI scan.
A series of unenhanced MRI scanning sequence were
performed first, multi-flip angle (5, 10 and 15°C) T1 Mapping was
collected firstly with only one phase, respectively. DCE MR imaging
was collected using vibrant sequence with the following parameters:
Repetition time/echo time=4.1/2.1 ms, flip angle=10°C, slice
thickness=4 mm, matrix size=256×256 pixels, number of slices=120,
and the field of view (FOV) was adjusted according to the breast
volume. For each patient, a total of 30 acquisitions were
obtained.
Thirty measurements with a temporal spacing of ~10
sec. At the beginning of DCE-MRI, a baseline acquisition was
collected with two unenhanced phase scans, a bolus of 0.1 mmol/kg
gadolinium contrast agent (Omniscan; GE Healthcare, Shanghai,
China) was injected intravenously at a rate of 4 ml/sec followed by
20 ml saline flush through antecubital vein at the third
acquisition. The scan duration after bolus injection was ~380
sec.
Pharmacokinetic parameters and texture
features
The DCE-MRI data were transferred into Omni-Kinetic
software (GE Healthcare) to obtain the perfusion and permeability
parameters of the lesion areas in breast, using the
dual-compartment pharmacokinetic model of Extended Tofts Linear
(16,17). This model evaluates Ktrans,
Ve, Vp and Kep values by analog
the EES space in tissues. Arterial input function (AIF) describes
the time-dependent contrast agent input to the ROI (18), Subsequently, the semi-quantitative
parameters, such as the slope, maximum enhancement, and area under
the curve (AUC) were computed based on the model in software.
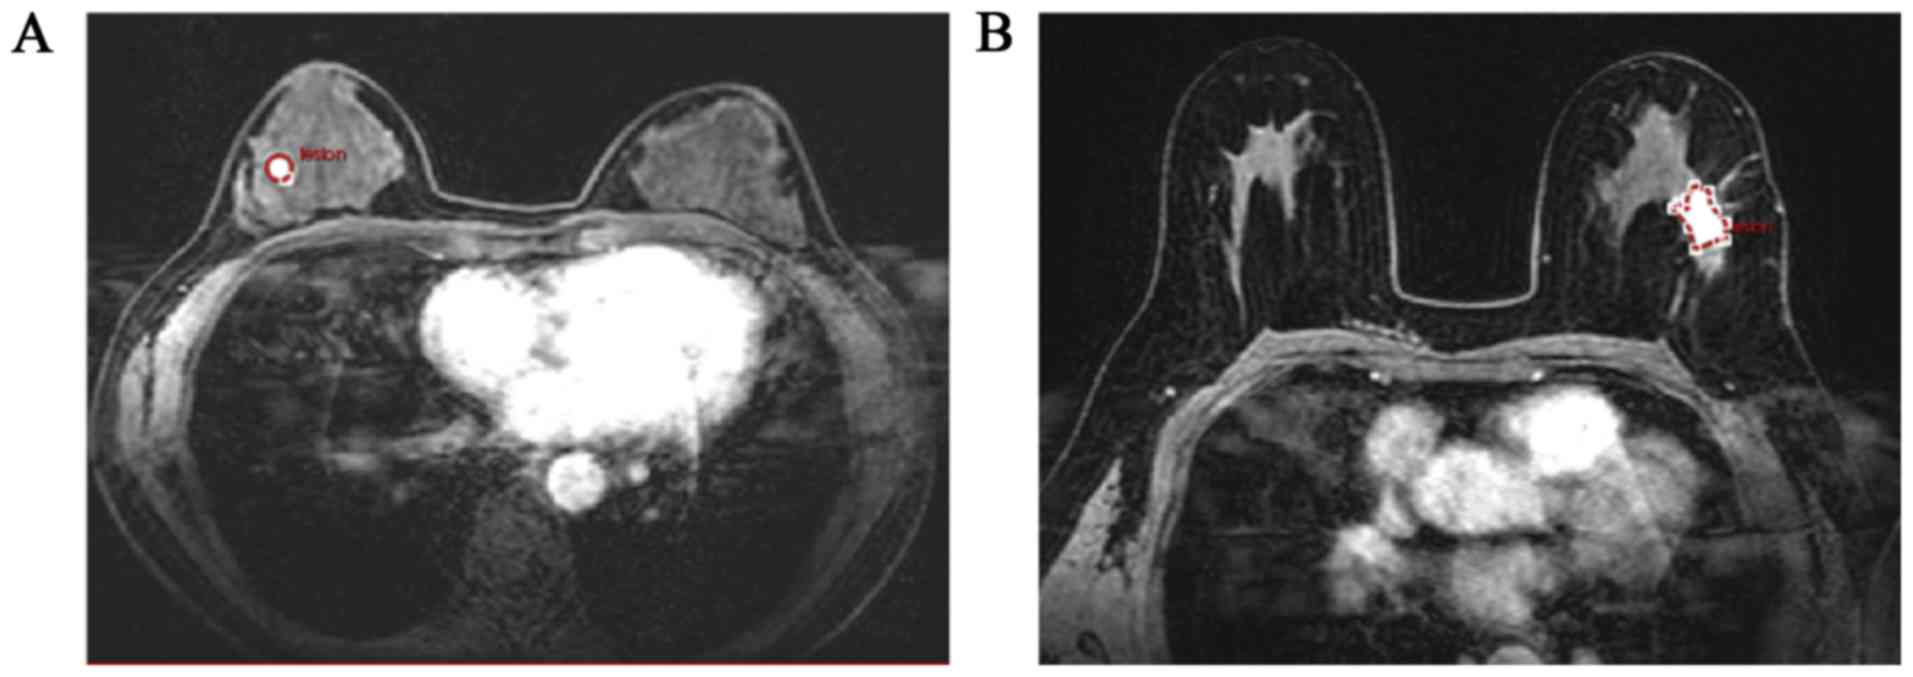
ROIs were selected based on enhanced T1-weighted
images and then responded to the pharmacokinetic maps. For each
breast lesions, 1–3 ROI with 10–30 mm2 size were
manually positioned on the T1WI imaging by an experienced
radiologist (Fig. 1). In Fig. 1, a benign and a malignant lesion was
clearly exhibited (Fig. 1A and B), a
circle or a polygon ROI would be drawn manually according to the
shapes of lesion.
The heterogeneity analysis (i.e. histogram,
Gray-level co-occurrence matrix, etc.) was automatically calculated
by the Omni-Kinetic software. For each patient, all the texture
features were obtained from DCE-MRI images, Ktrans and AUC maps,
respectively. Texture features from DCE-MRI images were generated
only using arterial phase images according to the AIF curves. All
ROIs used to the texture analysis were corresponded to the
pharmacokinetic calculation parts.
Different computing methods depicted the ROI pixel
distribution from different aspects. Histogram described the pixel
distribution, while the Gray-level co-occurrence matrix explained
the relationship of adjacent pixels (19). In this study, totally 67 texture
features from 4 different calculation methods, were achieved as
below: First Order (n=14), Histogram (n=15), Grey level
co-occurrence matrix (GLCM, n=13), Haralick matrix (n=9), and grey
level run length matrix (GLRLM, n=16).
Statistical analysis
PCA and FDA was carried out in IBM SPSS Statistics
software (version 19.0; BM SPSS, Chicago, IL, USA) which is a
multivariate data analysis software. PCA method extracted the
principal component information of the texture dataset, the first
principal component scores could reflect the type of each samples
in the patient dataset grossly. FDA is a classical analytical
technique for feature extraction and classification, a mapping was
first calculated to reduce the dimension of texture dataset, then a
linear discriminant analysis was built based on the variance
analysis so that several groups or classes could be discriminated
as clearly as possible (20–22). One-way analysis of variance (ANOVA)
test was performed for the Ktrans and AUC values using the software
of Origin 8.0 (OriginLab, Northampton, MA, USA) (23).
Results
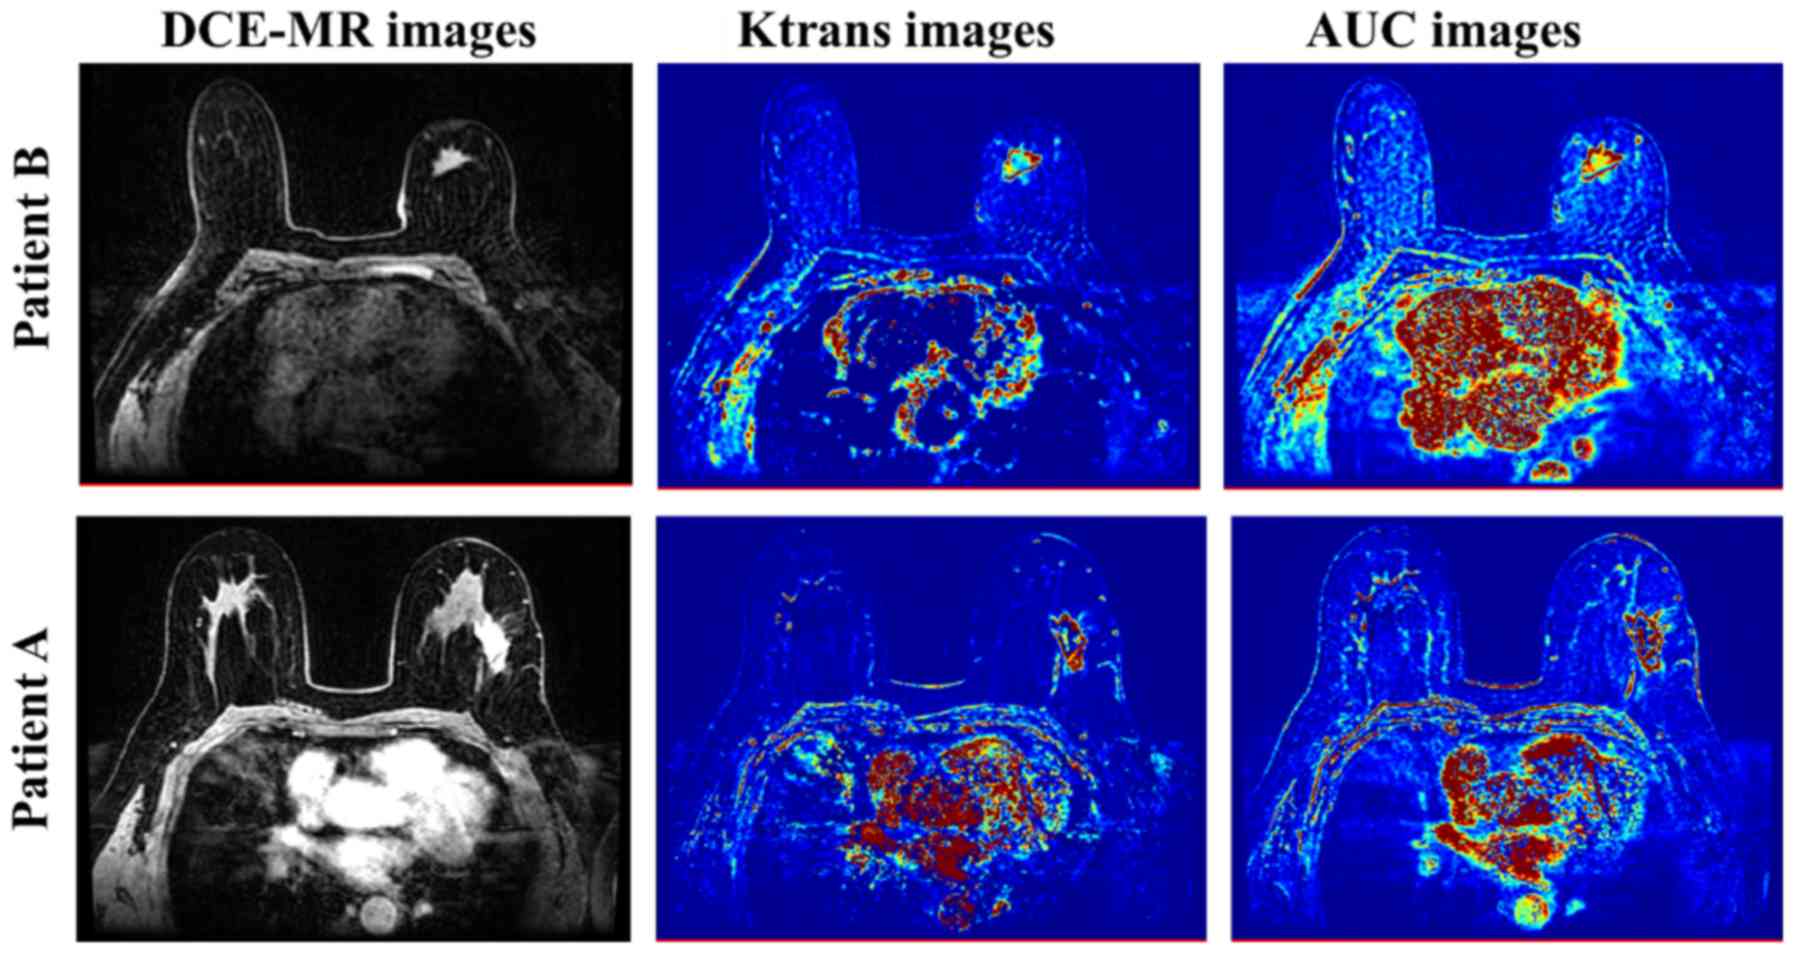
DCE-MR images of two patients with breast lesions
were shown in Fig. 2, the
corresponding pharmacokinetic parameter maps that calculated by the
Extended Tofts Linear model were also gave out, including Ktrans
images and AUC images. The lesion regions were obviously
highlighted in the parameter images, which indicated a more higher
permeability and perfusion when compared to the adjacent tissues
(24,25).
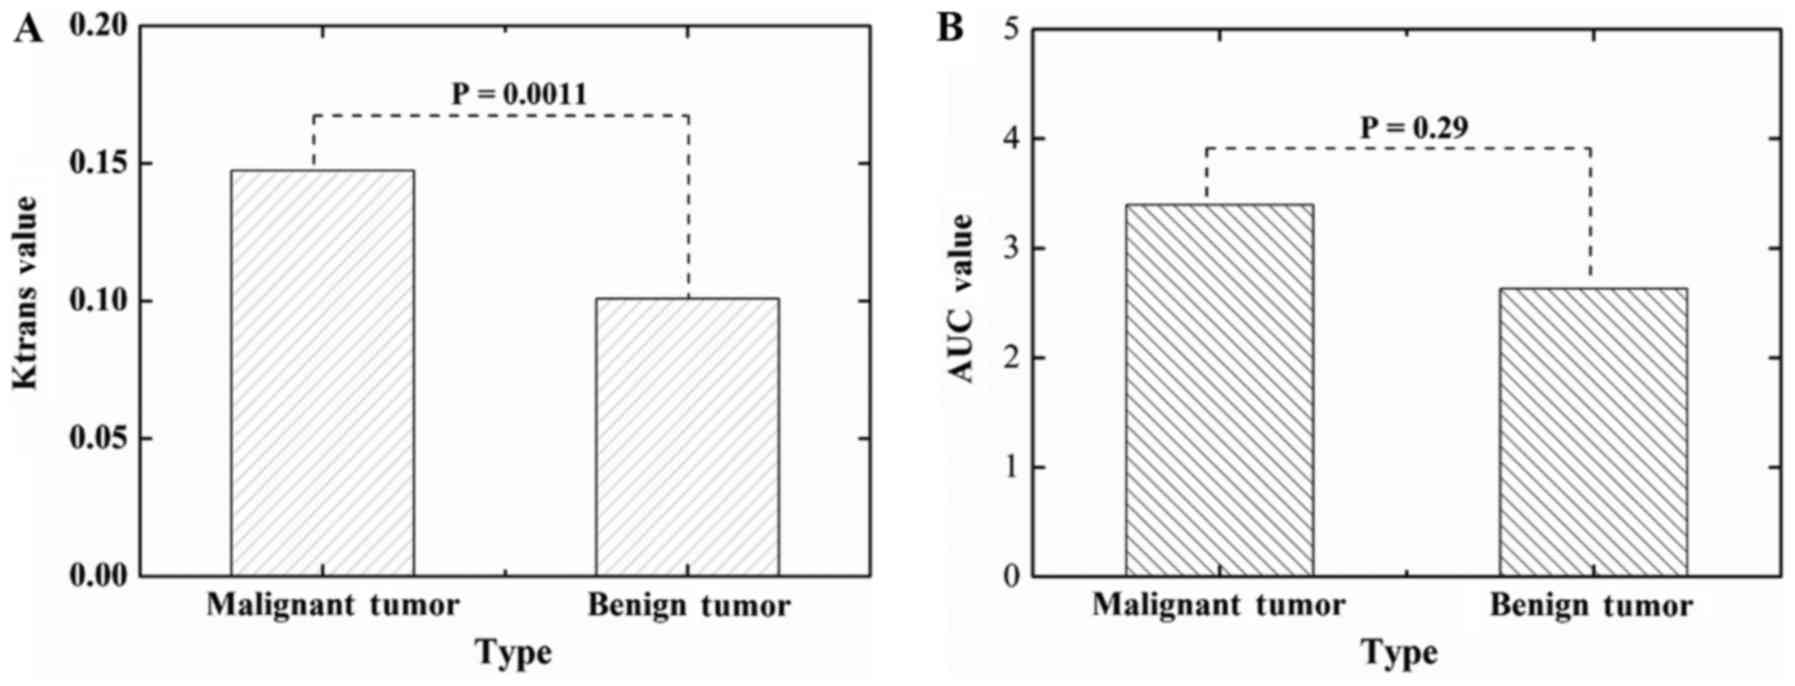
One-way analysis of variance (ANOVA) test was
performed for the Ktrans and AUC values using the software of
Origin 8.0. In this study, a significant difference on the Ktrans
values was found between the malignant breast tumors and benign
breast tumors (P=0.0011, Fig. 3A).
However, the ANOVA test on the AUC values showed no significant
differences (P=0.29), we could not characterize the benign and
malignant tumors only according the averaged AUC values of the two
groups samples.
Previously studies have revealed the potential
diagnostic ability of texture feature from medical images. In this
study, 67 texture features were extracted from the DCE-MRI images
and the pharmacokinetic parameter maps, including Ktrans and AUC
(as shown in Fig. 1),
respectively.
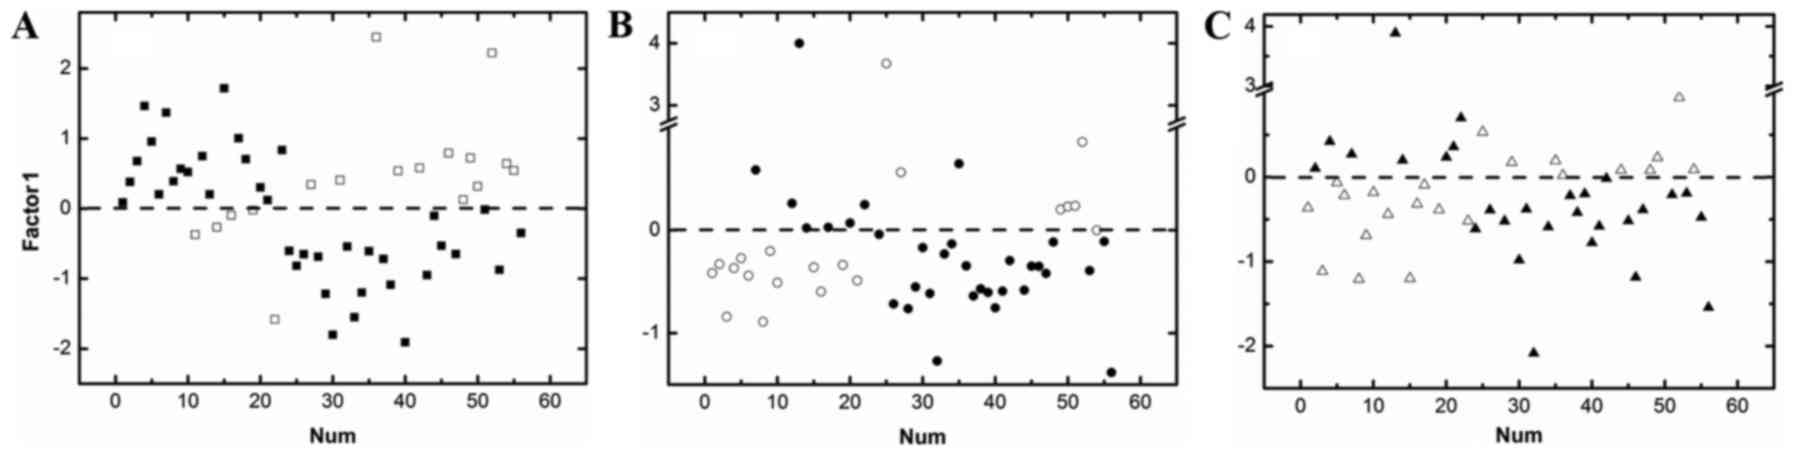
PCA was firstly applied to the texture features of
the DCE-MRI images, Ktrans and AUC maps, respectively, without any
pre-processing. Recently study has tried to use the PCA method
followed by adjusted model to analysis breast DCE-MRI images, and
an objective diagnostic tool was established (26). However, PCA could also be used as an
early attempt to classify unknown datasets, as shown in Fig. 4, the Factor-1 score values of PCA
could roughly divide the 56 patients into two groups, the hollow
squares (□), circles (○), and triangles (∆) were the misjudged
cases (Fig. 4).
To achieved the better discriminant accurate results
of texture features, further research was required. Spearman
correlation analysis was firstly performed to reduce the redundancy
of the texture feature on T1WI images, Ktrans and AUC maps. One
texture feature would be discard once the Spearman correlation
coefficient between two texture features was >0.9, the
correlation analysis was carried out for all texture features.
Totally seven common features were left in the three
texture feature datasets (Table I).
One-way ANOVA tests were calculated for the seven common features
on T1WI, Ktrans and AUC maps, respectively. Haralick matrix showed
a promising differentiation ability for the malignant and benign
tumors, both on the T1WI images and pharmacokinetic parameter maps
(P<0.05), on the other hand, the Long-Run-Low
Grey-Level-Emphasis of GLRLM exhibit the same ability (6,8).
 | Table I.ANOVA tests on the texture features
from T1WI image, AUC and Ktrans maps. |
Table I.
ANOVA tests on the texture features
from T1WI image, AUC and Ktrans maps.
| Method | Texture feature | T1WI image | Ktrans maps | AUC map |
|---|
| Haralick matrix | Difference
entropy | P<0.05 | P<0.05 | P<0.05 |
|
| Inverse difference
moment | P<0.05 | P<0.05 | P<0.05 |
| Grey level run-length
matrix | Min intensity | P>0.05 | P<0.05 | P<0.05 |
|
| Max intensity | P>0.05 | P>0.05 | P>0.05 |
|
| Max size | P>0.05 | P<0.05 | P>0.05 |
|
| Long run low grey
level emphasis | P<0.05 | P<0.05 | P<0.05 |
|
| Long run high grey
level emphasis | P>0.05 | P>0.05 | P>0.05 |
FDA method was also built based on the three texture
features datasets that have underwent the spearman correlation
analysis, the discriminant accuracies of FDA method on the DCE-MRI
images, Ktrans maps and AUC maps were 93, 98 and 98%, respectively
(Table II). Cross validation
analysis was performed on the FDA method for DCE-MRI images, Ktrans
and AUC maps with the discriminant accuracies of 82, 77 and 77%,
respectively. The promising results of FDA and cross validation
result indicated that FDA method could be a reliable tool to
diagnose the breast lesions.
| Table II.FDA method on DCE-MRI images, Ktrans
and AUC maps. |
Table II.
FDA method on DCE-MRI images, Ktrans
and AUC maps.
|
|
| Predicted |
|
|
|---|
|
|
|
|
|
|
|---|
| Imaging | Type | Malignant | Benign | Discriminant accuracy
(%) | Discriminant accuracy
(%) |
|---|
| DCE-MR images | Malignant | 21 | 2 | 91 | 93 |
|
| Benign | 2 | 31 | 94 |
|
| Ktrans maps | Malignant | 23 | 0 | 100 | 98 |
|
| Benign | 1 | 32 | 97 |
|
| AUC maps | Malignant | 23 | 0 | 100 | 98 |
|
| Benign | 1 | 32 | 97 |
|
Discussion
In this study, a comprehensive exploring, including
pharmacokinetic parameters, texture features, and the created FDA
method, was adopted to quantitatively evaluate the malignant and
benign breast tumors. All these three aspects showed a promising
result for the breast patients. This experiment provided a
preoperative clinical assessment of breast tumor.
In recent years, pharmacokinetic parameters have
been adopted to explore the penetration and perfusion changes
inside the tumors (27–29). In the present study, the
semi-quantitative parameters (e.g. AUC) and quantitative parameters
(e.g. Ktrans) were calculated, Ktrans values showed a better
diagnostic ability between the malignant and benign breast tumors
than AUC. This difference of Ktrans and AUC values has indicated
the increment of microvascular permeability in the malignant
tumors. Ktrans is a well-established permeability parameter of
tumors, which was obtained with DCE-MRI and has been applied to
many kinds of tumors. It reflects the diffusive transport of
contrast agent across the capillary endothelium (16,17). In
this particular circumstance, Ktrans might directly reveal the
microstructure changes inside tumors than AUC values. AUC described
the areas under the arterial input function (AIF) that obtained by
the Omni-Kinetic software. No significance differences were found
between the benign and malignant breast tumors. The AIF curves were
slightly different among the patients, which were easily affected
by the machine and scanning mode. The AUC values might be
unsteadily. The results in this study indicated that more
attentions should be gave to the Ktrans values rather than AUC,
pharmacokinetic parameters depict tumors based on the relationships
between the permeability changes and biological characteristics,
which might be have a better expression on the tumors.
Compared to pharmacokinetic parameters, texture
features are a quite abstract concept for medical images. It
considers the pixel distribution in ROIs through engineering
methods. Although lots of researches have refer to these areas,
some basic concepts were still ambiguous; texture parameters
exhibit excellent skills on the tumors assessment and grade,
survival prediction for cancer patients, evaluation of tumor
therapy and prediction distant metastasis (30–32).
However, how to define the texture features in medical images were
still questions that need to be explained urgently. In this study,
texture features on DCE-MRI images, Ktrans and AUC maps gave out
difference results, For the seven common texture features that
underwent spearman correlation analysis, five texture features from
Ktrans map exhibit significant difference. On the other hand,
difference entropy, inverse difference moment of Haralick matrix
and the long-run-low grey-level-emphasis of GLRLM showed a
promising ability on the three types of images. All the significant
texture features characteristic the breast tumors in different
aspects. The research is ongoing in our department to reveal its
clinical sense or to connect the texture feature to any related
clinical standards.
In addition to explore the diagnostic value of every
single texture feature, regression analysis was the common way to
find out the capacity of whole texture features (33,34). FDA
was adopted in this study, which was easily built without strictly
application restrictions. The discriminant accuracies of FDA on the
DCE-MRI images, Ktrans and AUC maps were 93, 98 and 98%. A
promising cross validation result on the DCE-MRI images, Ktrans and
AUC maps were also achieved. The results indicated the feasibility
of FDA method on breast tumors. However, some limitations should be
acknowledged in this mathematical regression analysis. Firstly,
Since the limitation of patient size, further investigation with
much larger patient sample sizes should be included to improve the
differentiation accuracies and model stability. Secondly, in this
study, the patients were only divided into benign and malignant
groups, more patients should be involved to specify the disease of
benign and malignant breast tumors, an overall analysis on the
breast tumors would be cleared once enough patients were given.
Thirdly, texture analysis and the regression were generated using
arterial phase images, some slight differences might be existed
between different phase images, which was not discussed in this
study.
The volume data of all breast tumors were obtained
on the AW workstation of GE Discovery MR 750, Specified
morphological data in tumors, such as surface area, were also
derived from the Omini-kinetic software. Since the limitation of
the patient amount, tumor morphological description was not
regarded as an influential factor in this study. It would be
essential and interesting to clarify the pharmacokinetic parameter
changes of tumors with different size. On the other hand,
metastatic lymph node plays as a significant role for tumors, the
prediction of lymph node metastasis has begun to be involved in
other fields with excellent results (35). Thus, the investigation of metastatic
lymph node in breast cancer could also be feasible by the methods
adopted in the research. Related researches were ongoing in our
department.
Compared to the previous study that either focused
on the analysis of each texture feature or emphasis the importance
and potential of regression model, this study explored the
pharmacokinetic parameters, texture features and the regression
model on breast tumors, a comprehensive analysis were carried out
in this study to improve understanding of quantitative parameters
on breast tumors.
In conclusion, pharmacokinetic parameters and
texture features provide quantitative measures of heterogeneity in
breast tumors at different aspect. In this study, all parameters
showed a valuable ability in breast lesion discrimination and
characterization. On the other hand, the combination of regression
model with quantitative parameter also exhibit promising capacity,
further exploration was needed to validate the diagnostic ability
of pharmacokinetic parameters, texture features and the
mathematical regression analysis.
Acknowledgements
Not applicable.
Funding
No funding was received.
Availability of data and materials
The datasets analysis methods used during the
current study are available from the corresponding author on
reasonable request.
Authors' contributions
QLN was responsible for designing the study and
drafting the manuscript. XMJ, QL, ZLZ performed the statistical
analysis and researched the literature. HWD and SSW were
responsible for the MRI scanning and XXZ contributed to DCE-MRI.
All authors read and approved the final version of the
manuscript.
Ethics approval and consent to
participate
This study was approved by the institutional review
board of The Wei Fang Traditional Chinese Hospital. Informed
consent was obtained from all patients.
Consent for publication
Not applicable.
Competing interests
The authors declare that they have no competing
interests.
References
|
1
|
Peters NH, Rinkes Borel IH, Zuithoff NP,
Mali WP, Moons KG and Peeters PH: Meta-analysis of MR imaging in
the diagnosis of breast lesions. Radiology. 246:116–124. 2008.
View Article : Google Scholar : PubMed/NCBI
|
|
2
|
Yankeelov TE and Gore JC: Dynamic contrast
enhanced magnetic resonance imaging in oncology: Theory, data
acquisition, analysis, and examples. Curr Med Imaging Rev.
3:91–107. 2009. View Article : Google Scholar : PubMed/NCBI
|
|
3
|
Walkersamuel S, Leach MO and Collins DJ:
Evaluation of response to treatment using DCE-MRI: The relationship
between initial area under the gadolinium curve (IAUGC) and
quantitative pharmacokinetic analysis. Phys Med Biol. 51:3593–3602.
2006. View Article : Google Scholar : PubMed/NCBI
|
|
4
|
Padhani AR, Gapinski CJ, Macvicar DA,
Parker GJ, Suckling J, Revell PB, Leach MO, Dearnaley DP and
Husband JE: Dynamic contrast enhanced MRI of prostate cancer:
Correlation with morphology and tumour stage, histological grade
and PSA. Clin Radiol. 55:99–109. 2000. View Article : Google Scholar : PubMed/NCBI
|
|
5
|
Yankeelov TE, Lepage M, Chakravarthy A,
Broome EE, Niermann KJ, Kelley MC, Meszoely I, Mayer IA, Herman CR,
McManus K, et al: Integration of quantitative DCE-MRI and ADC
mapping to monitor treatment response in human breast cancer:
Initial results. Magn Reson Imaging. 25:1–13. 2007. View Article : Google Scholar : PubMed/NCBI
|
|
6
|
Haralick RM, Shanmugam K and Dinstein I:
Textural features for image classification. Syst Man Cybern IEEE
Transact. SMC-3:610–621. 1973. View Article : Google Scholar
|
|
7
|
Holli K, Lääperi AL, Harrison L, Luukkaala
T, Toivonen T, Ryymin P, Dastidar P, Soimakallio S and Eskola H:
Characterization of breast cancer types by texture analysis of
magnetic resonance images. Acad Radiol. 17:135–141. 2010.
View Article : Google Scholar : PubMed/NCBI
|
|
8
|
Castellano G, Bonilha L, Li LM and Cendes
F: Texture analysis of medical images. Clin Radiol. 59:1061–1069.
2004. View Article : Google Scholar : PubMed/NCBI
|
|
9
|
MacKay JW, Murray PJ, Kasmai B, Johnson G,
Donell ST and Toms AP: MRI texture analysis of subchondral bone at
the tibial plateau. Eur Radiol. 26:3034–3045. 2016. View Article : Google Scholar : PubMed/NCBI
|
|
10
|
Son JY, Lee HY, Lee KS, Kim JH, Han J,
Jeong JY, Kwon OJ and Shim YM: Quantitative CT analysis of
pulmonary ground-glass opacity nodules for the distinction of
invasive adenocarcinoma from pre-invasive or minimally invasive
adenocarcinoma. PLoS One. 9:e1040662014. View Article : Google Scholar : PubMed/NCBI
|
|
11
|
Jain KK, Sahoo P, Tyagi R, Mehta A, Patir
R, Vaishya S, Prakash N, Vasudev N and Gupta RK: Prospective glioma
grading using single-dose dynamic contrast-enhanced perfusion MRI.
Clin Radiol. 70:1128–1135. 2015. View Article : Google Scholar : PubMed/NCBI
|
|
12
|
Loose J, Harz TM, Laue H, Twellmann T,
Bick U, Rominger M, Hahn HK and Peitgen HO: Assessment of texture
analysis on DCE-MRI data for the differentiation of breast tumor
lesions. Proceed SPIE-Int Soc Opt Eng. 7260:3113–3122. 2009.
|
|
13
|
Taoka T, Kawai H, Nakane T, Hori S, Ochi
T, Miyasaka T, Sakamoto M, Kichikawa K and Naganawa S: Application
of histogram analysis for the evaluation of vascular permeability
in glioma by the K2 parameter obtained with the dynamic
susceptibility contrast method: Comparisons with Ktrans obtained
with the dynamic contrast enhance method and cerebral blood volume.
Magn Reson Imaging. 34:896–901. 2016. View Article : Google Scholar : PubMed/NCBI
|
|
14
|
Chen X, Wei X, Yang R and Jiang X, Xu X
and Jiang X: Differentiation of glioblastomas and solitary
metastatic brain tumors using texture analysis of conventional MRI.
Chin Med Abs. 2016.doi:
10.3760/cma.j.issn.1005-1201.2016.03.006.
|
|
15
|
Kido S, Katamoto A, Xu R and Hirano Y:
Differential diagnosis of benign and malignant brain tumors by use
of texture analysis on FDG-PET images. Radiol Soc North Am 2013 Sci
Assem Meeting. 2013.
|
|
16
|
Tofts PS, Brix G, Buckley DL, Evelhoch JL,
Henderson E, Knopp MV, Larsson HB, Lee TY, Mayr NA, Parker GJ, et
al: Estimating kinetic parameters from dynamic contrast-enhanced
t1-weighted MRI of a diffusable tracer: Standardized
quantities and symbols. J Magn Reson Imaging. 10:223–232. 1999.
View Article : Google Scholar : PubMed/NCBI
|
|
17
|
Tofts PS: T1-weighted DCE
imaging concepts: Modelling, acquisition and analysis. Signal.
500:4002010.
|
|
18
|
Calamante F: Arterial input function in
perfusion MRI: A comprehensive review. Prog Nucl Magn Reson
Spectrosc. 74:1–32. 2013. View Article : Google Scholar : PubMed/NCBI
|
|
19
|
Bino SV, Unnikrishnan A and Balakrishnan
K: Gray level co-occurrence matrices: Generalisation and some new
features. Int J Com Sci Eng Informa. 2:151–157. 2012.
|
|
20
|
Leo HC, Evan LR and Richard DB: Fault
diagnosis in chemical processes using Fisher discriminant analysis,
discriminant partial least squares, and principal component
analysis. Chemometr Intell Lab. 50:243–252. 2000. View Article : Google Scholar
|
|
21
|
Ostrovsky E, Zelig U, Gusakova I, Ariad S,
Mordechai S, Nisky I and Kapilushnik J: Detection of cancer using
advanced computerized analysis of infrared spectra of peripheral
blood. IEEE Trans Biomed Eng. 60:343–353. 2013. View Article : Google Scholar : PubMed/NCBI
|
|
22
|
Dong L, Sun X, Chao Z, Zhang S, Zheng J,
Gurung R, Du J, Shi J, Xu Y, Zhang Y and Wu J: Evaluation of FTIR
spectroscopy as diagnostic tool for colorectal cancer using
spectral analysis. Spectrochim Acta A Mol Biomol Spectrosc.
122:288–294. 2014. View Article : Google Scholar : PubMed/NCBI
|
|
23
|
Villeda VA, Benakanakere I and Freter C:
The effect of cholesterol depletion in resistant breast cancer
cells. J Clin Oncol. 2012.
|
|
24
|
Yim H, Kang DK, Jung YS, Jeon GS and Kim
TH: Analysis of kinetic curve and model-based perfusion parameters
on dynamic contrast enhanced MRI in breast cancer patients:
Correlations with dominant stroma type. Magn Reson Imaging.
34:60–65. 2016. View Article : Google Scholar : PubMed/NCBI
|
|
25
|
Ryu JK, Sun JR, Song JY, Cho SH and Jahng
GH: Characteristics of quantitative perfusion parameters on dynamic
contrast-enhanced MRI in mammographically occult breast cancer. J
Appl Clin Med Phys. 17:377–390. 2016. View Article : Google Scholar : PubMed/NCBI
|
|
26
|
Eyal E, Badikhi D, Furman-Haran E, Kelcz
F, Kirshenbaum KJ and Degani H: Principal component analysis of
breast DCE-MRI adjusted with a model-based method. J Magn Reson
Imaging. 30:989–998. 2009. View Article : Google Scholar : PubMed/NCBI
|
|
27
|
Zheng X, Xiao L, Fan X, Huang N, Su Z and
Xu X: Free breathing DCE-MRI with motion correction and its values
for benign and malignant liver tumor differentiation. Radiol Infect
Dis. 2:65–71. 2015. View Article : Google Scholar
|
|
28
|
Yu X, Lin M, Ye F, Ouyang H, Chen Y, Zhou
C and Su Z: Comparison of contrast-enhanced isotropic 3D-GRE-T1WI
sequence versus conventional non-isotropic sequence on preoperative
staging of cervical cancer. PLoS One. 10:e01220532015. View Article : Google Scholar : PubMed/NCBI
|
|
29
|
Li X, Zhu Y, Kang H, Zhang Y, Liang H,
Wang S and Zhang W: Glioma grading by microvascular permeability
parameters derived from dynamic contrast-enhanced MRI and
intratumoral susceptibility signal on susceptibility weighted
imaging. Cancer Imaging. 15:42015. View Article : Google Scholar : PubMed/NCBI
|
|
30
|
Méndez CA, Ferrarese Pizzorni F, Summers
P, Petralia G and Menegaz G: DCE-MRI and DWI integration for breast
lesions assessment and heterogeneity quantification. Int J Biomed
Imaging. 2012:6768082012. View Article : Google Scholar : PubMed/NCBI
|
|
31
|
Coroller TP, Grossmann P, Hou Y, Velazquez
Rios E, Leijenaar RT, Hermann G, Lambin P, Haibe-Kains B, Mak RH
and Aerts HJ: CT-based radiomic signature predicts distant
metastasis in lung adenocarcinoma. Radiother Oncol. 114:345–350.
2015. View Article : Google Scholar : PubMed/NCBI
|
|
32
|
Kickingereder P, Burth S, Wick A, Götz M,
Eidel O, Schlemmer HP, Maier-Hein KH, Wick W, Bendszus M, Radbruch
A and Bonekamp D: Radiomic profiling of glioblastoma: Identifying
an imaging predictor of patient survival with improved performance
over established clinical and radiologic risk models. Radiology.
280:880–889. 2016. View Article : Google Scholar : PubMed/NCBI
|
|
33
|
Eyal E, Badikhi D, Furman-Haran E, Kelcz
F, Kirshenbaum KJ and Degani H: Principal component analysis of
breast DCE-MRI adjusted with a model-based method. J Magn Reson
Imaging. 30:989–998. 2009. View Article : Google Scholar : PubMed/NCBI
|
|
34
|
Raman SP, Schroeder JL, Huang P, Chen Y,
Coquia SF, Kawamoto S and Fishman EK: Preliminary data using
computed tomography texture analysis for the classification of
hypervascular liver lesions: Generation of a predictive model on
the basis of quantitative spatial frequency measurements-a work in
progress. J Comput Assist Tomogr. 39:383–395. 2015.PubMed/NCBI
|
|
35
|
Huang YQ, Liang CH, He L, Tian J, Liang
CS, Chen X, Ma ZL and Liu ZY: Development and validation of a
radiomics nomogram for preoperative prediction of lymph node
metastasis in colorectal cancer. J Clin Oncol. 34:2157–2164. 2016.
View Article : Google Scholar : PubMed/NCBI
|