Introduction
Prostate cancer (PC) is the most commonly diagnosed
non-skin cancer among men in Western countries, which carries a
high mortality (1–4). However, trends have revealed a
continuous decrease in the mortality of patients with prostate
cancer (2,4,5). This may
be a result of novel treatments for PC. In China, the incidence
rate of PC was low in 1960 (0.48/100,000 individuals), but
increased by 2013 (13.33/100,000 individuals), due to a combination
of factors, including ageing and dietary and lifestyle changes
(5,6).
The Gleason grading system was developed in the
1960s and was based on histopathological data obtained from radical
prostatectomy (RP) (7); however, this
system has remained unchanged for decades. The development of
immunohistochemical staining has led to the identification of
histological patterns that were misclassified in Gleason's original
drawings, which has resulted in a clearer distinction between
benign mimickers of PC (including adenosis and prostatic
intraepithelial neoplasia) and PC itself (8). Due to the reclassification of the
Gleason scoring system, in 2005, the International Society of
Urological Pathology (ISUP) Consensus Conference disregarded the
old numbers of the Gleason score (GS) of 5 or less as they were no
longer considered to be representative of adenocarcinoma and as
such had no prognostic value (9). GS
6 is now recommended as the lowest grade assigned to prostatic
biopsy (10). In addition, numerous
former GS 6 tumors have been reclassified as GS 7. Modern GS 6
tumors now exhibit a better prognosis than those described in older
literature (11). Although GS is
based on invasive and costly prostatic biopsies, it provides a
definitive diagnosis and remains one of the most powerful
prognostic predictors for patients with PC (12). This novel grading system was accepted
by the World Health Organization for the 2016 edition of Pathology
and Genetics: Tumors of the Urinary System and Male Genital Organs
(11).
However, there are many limitations of the GS system
that limit the effective determination of PC aggressiveness. These
include tumor heterogeneity, biopsy-sampling error and variations
in biopsy interpretation (13–15). The
resulting uncertainty in risk assessment leads to a significant
possibility of complication with associated pain (13,14). Thus,
the current evaluative methods of biopsy are often unable to stage
individual patients accurately (15).
Therefore, the GS system is much more complex than its original
version, which may be problematic for clinicians and patients.
However, we hypothesize that this may be overcome by combining the
assessment of non-invasive biomarkers with GS, which may improve
the prognostic/predictive testing system of PC.
The level of prostate-specific antigen (PSA) is the
most important prognostic PC serum marker (5,16).
However, a discrepancy has been reported between needle biopsies
and RP specimens (6,17). GS value allocation depends on various
clinical factors, including PSA cut-off values used (4 or 10
ng/ml), number of prostate needle biopsies taken and experience
level of the pathologist (18–20). The
biopsy GS value is a primary factor for the selection of
appropriate treatments, including RP, androgen deprivation therapy
or conservative therapy (21–24). Together with clinical factors,
pre-treatment PSA levels may improve the identification of patients
who are at higher risk of mortality following surgery. These are
primarily patients with a GS value of G3+3 following prostate
biopsy, with a pre-operative PSA value of ≥10 ng/ml (18). There is different opinion about the
PSA values of low-risk (4 ng/ml) or high-risk (10 ng/ml) patients
with PC. However, there is no significant association between PSA
expression and PC phenotype, and functional and tumorigenic
heterogeneity (19). The use of PSA
as a diagnostic marker is limited as it is also expressed in
healthy prostate tissue and elevated circulating levels may be
exhibited in patients with prostatitis, inflammation and BPH
(20). In addition, PSA screening
trials have demonstrated that many patients diagnosed with PC do
not develop life-threatening disease (25–27).
Clinical trials on PC screening demonstrated a limited benefit to
patient survival (25–27). A meta-analysis of five randomized
control trials indicated that PSA testing did not significantly
decrease PC-specific mortality (25).
Furthermore, PC can develop in patients whose PSA levels remain low
(26). There was also no evidence of
a reduction in PC mortality in the American Prostate, Lung,
Colorectal and Ovarian Cancer Screening Trial (27). Given that opportunistic PSA screening
practices in Canada are similar, it is unlikely that the
introduction of a formal PSA screening program would reduce PC
mortality (27). PSA is now commonly
used in combination with RP or needle biopsy to distinguish benign
from aggressive types of cancer, which may orient treatment
application (10). Despite its poor
specificity, PSA remains an integral component of statistical
models that combine assorted patient specific variables (10).
Cancer is a disease of abnormal proliferating cells.
Mutations in certain enzymes and proteins associated with cell
growth regulation leads to uncontrolled proliferation and thus
malignancy (11,28). Therefore, the identification of
proliferating biomarkers to improve the early detection of PC is
important. Aside from PSA (29),
serum thymidine kinase 1 (STK1) is a potential biomarker of
proliferation that has been used to determine patient prognosis and
treatment progress, either as STK activity (STKa) or STK1
concentration (STK1) (5,30,31). STKa
has become a more useful tool to assess patient prognosis, tumor
treatment progress, relapse, follow-up and survival, particularly
in solid tumors (5). However, there
are few reports that determine STK1 application in PC. A previous
study performed in 1996 was the first to assess STKa in relation to
PC (32). In this study (n=92), the
mean value of STKa was compared with PSA and it was determined that
there was a significant difference in mean STKa values between PC,
benign prostatic hyperplasia (BPH) and healthy individuals
(21). Li et al (33) demonstrated that STK1 was a reliable
biomarker as it was able to discriminate between patients with PC,
patients with BPH and healthy individuals [PC, n=70, 3.7±1.9 pM,
sensitivity 0.72 at a cut-off of 2.0 pM; BPH, n=40, 1.3±0.4 pM;
healthy individuals, n=40, 0.8±0.3 pM]. STK1 concentrations above
the level of 2.0 pM was also associated with clinical stage
[T1 62.9% (22/35), T2 73.7% (14/19),
T3 80.0% (8/10) and T4 100.0% (6/6)].
Jagarlamudi et al (34)
compared the STKa and concentration of STK1 in patients (n=47) with
PC to healthy blood donors. The results demonstrated that STKa and
STK1 concentration differed significantly between patients with PC
and healthy individuals (35).
Furthermore, the STKa of patients with well-differentiated (GS5+6)
PC tumors were at similar levels to healthy individuals, while the
corresponding values in patients with moderately/poorly
differentiated (GS7+8) tumors were significantly elevated (35). However, the STK1 concentration in
patients with well- and moderately/poorly-differentiated tumors was
significantly higher compared with healthy individuals (35). Additionally, while STKa and STK1
concentrations were similar (0.96), a difference in sensitivity
(STKa 0.15; STK1 concentration 0.64) and AUC-value (STKa 0.69; STK1
concentration 0.88) was identified (35). Thus, STK1 concentration may serve as a
prognostic biomarker for the early detection (GS5+6) of PC.
Additionally, TK1 immunohistochemical staining demonstrated that
TK1 expression in PC tissues was associated with time of recurrence
and development of metastasis, indicating that it may also serve as
a useful biomarker for patients with PC (35) [n=103, GS 6, mouse TK1 IgG clone 5;
SSTK, Ltd., Shenzhen, China).
The present study extended the previous research
into STK1 concentration in patients with PC by comparing STK1
concentration with total PSA in serum and assessing Gleason score
values of prostate tumor tissue. The aim of the current study was
to further explore the possibility that STK1 concentration could be
used as a prognostic biomarker in patients with BPH and PC.
Materials and methods
Patients
All procedures performed in the present study
involving human participants were in accordance with the ethical
standards of the institutional and/or national research committee
and with the 1984 Declaration of Helsinki with its later amendments
or comparable ethical standards. The present study was also
approved by the Ethics Committee of the Health Management Centre of
People's Liberation Army (PLA) 180 Hospital (Quanzhou, China;
approval no. LL2009003). Informed consent was obtained from all
participants of the present study.
The following criteria of the patients were
assessed: Age, Gleason score, TK1 levels and PSA levels, plus the
5-year follow-up of 1 patient, including detailed medical data. The
following criteria were excluded: ID, phone number, home address,
data when visiting the hospital, routine blood and urine test
results, ultrasound and advanced imaging results, and their
objective response to treatment.
Based on the Gleason scoring system of core needle
biopsies, as described by the ISUP guideline revision in 2005, the
diagnosis of the glandular dedifferentiation level was performed.
Certain patients (n=26) refused to undergo biopsies and thus the
Gleason score could not be determined. Next, the patients underwent
surgery by laparoscopic radical prostatectomy (RP) and further
routine treatment was provided individually, according to
previously described guidelines (36), at Daping Hospital, Third Military
Medical University (Chongqing, China) and at Shaanxi Provincial
People's Hospital (Xian, Shaanxi, China).
The effect of the treatment was evaluated by the
changes in the STK1 values. Since this is a study based on routine
clinical data, only 18 patients were available for monitoring of
the effect of the treatment.
Survival assessment was performed in 51 patients
only (51/123), due to limited access to the patients once they left
the hospitals. The patients or their families were contacted by
phone every year to determine if they remained alive. One of the
patients succumbed during the follow-up period of 5 years. The
clinical data of this patient during the 5-year follow-up are
provided in the Results section. In the first treatment cycle that
started in May 2010, the patient was treated with 250 mg flutamide
orally 3 times per day and with 0.1 mg diphereline intramuscular
once per month, with each treatment lasting for 3 years. In the
second treatment cycle that started in May 2013, the patient was
first treated by one infusion dose of 4 mg zoledronic acid to treat
possible metastasis, followed by 50 mg bicalutamide once orally and
then 250 mg flutamide 3 times per day until the patient succumbed
in February 2016. The patients were also investigated by ultrasound
B (DC-6E; Shenzhen Mindray Bio-Medical Electronics Co., Ltd. China)
and computed tomography (CT) (Brilliance 1 CT; Philips Medical
Systems B.V., Eindhoven, The Netherlands).
A summary of patient age and pathology/Gleason score
are presented in Table I. A total of
123 patients with PC pre-operative were investigated between March
2008 and December 2009. Tissue specimens and serum samples were
collected from 108 men (mean age, 72.9±9.6 years; age range, 34–93
years) with prostate adenocarcinoma who had not yet received
surgery at Daping Hospital and Research Institute of Surgery of the
Third Military Medical University (Chongqing China) between March
and December 2008. Tissue specimens and serum samples were also
collected from 15 men (mean age, 73.5±8.1 years; age range, 54–84
years) with prostate adenocarcinoma who had not received surgery at
Shaanxi Provincial People's Hospital (Xian, China) between January
and December 2009.
 | Table I.Gleason score, number and age of
participants involved in the present study.a |
Table I.
Gleason score, number and age of
participants involved in the present study.a
| Gleason score | Number of
patients | Age range
(years) |
|---|
| G2+G3 | 7 | 64–78 |
| G4+G5 | 15 | 66–93 |
| G6 | 10 | 56–81 |
| G7 | 49 | 34–85 |
| G8+G9 | 16 | 66–80 |
| Not available | 26 | 62–78 |
Pre-operative tissue and serum samples were
collected from patients with BPH tumors (n=205; mean age, 71.8±7.9
years; age range, 57–91 years) at Shaanxi Provincial People's
Hospital (Xian, China) between January and December 2009. Serum
samples from healthy individuals (n=266; mean age, 60.6±7.8 years;
age range, 51–87 years) who had no evidence of contagious or
cancerous disease were also collected at Shaanxi Provincial
People's Hospital (Xian, China) and at the Health Management Centre
of PLA 180 Hospital (Quanzhou, China) between January and December
2009.
The operative and biopsy specimens were processed
according to the Gleason system. Two experienced genitourinary
pathologists assessed and allocated primary and secondary GS. The
GS numbers utilized in the present study were the sum of the
primary and secondary scores (for example: GS2+GS3=GS5). Patients
were divided into five groups: GS2-3, GS4-5, GS6, GS7 and GS8-9.
Discrepancies were resolved by a joint review of the slides. Of the
patients included in the present study, ~65% exhibited a Gleason
score of GS7 or higher and were considered to be high risk.
The tissues of the biopsies were fixed prior to the
examination. The specimens (5-µm thick) were fixed with neutral
formaldehyde (4%) for >2 h, followed by dehydration in 70%
ethanol (10 min), 80% ethanol (20 min), 95% ethanol (30 min),
anhydrous ethanol (30 min), xylene (I) (5 min), xylene (II) (5 min)
and xylene (III) (5 min). The specimens were paraffin-embedded at
62°C (8 mins each, 3 times). Prior to examination, the tissues were
deparaffinized and examined at room temperature.
It is important to note that STK1 and PSA were not
determined in the same group of patients due to the routine
clinical nature, and thus the number of STK1 and PSA patients
investigated was not equal.
TK1 assay
STK1 concentrations were assessed using a commercial
kit (Thymidine Kinase 1 Cell Cycle assay kit; cat. no. 24/48T)
based on an enhanced chemiluminescent dot blot assay as described
by the manufacturer (Sino-Swed Tongkang Bio-Tech Inc., Shenzhen,
China). The collection of serum was performed after patients had
fasted for 12–14 h (7.30 am-10.00 am) and samples were analyzed
within 3 h of whole blood centrifugation (400 × g, 22–25°C, 8–10
min). If not analyzed immediately, samples were stored at −20°C for
a maximum of 4 weeks. Although the serum samples were analyzed
within 4 weeks, the serum may be stored for ≥1 year at −20°C and
still maintain TK1 in good condition. Samples comprising 3 µl serum
were directly applied to nitrocellulose membranes in duplicate.
Serum samples were then probed with chicken anti-human TK1 IgY
polyclonal antibody (dilution 1:500; Thymidine Kinase 1 Cell Cycle
assay kit, cat. no. 24/48T; Sino-Swed Tongkang Bio-Tech Inc.)
raised against a peptide (residue 195–225 of human TK1, amino acid
sequence: GQPAG PDNKE NCPVP GKPGE AVAAR KLFAPQ; Multiple Peptide
Systems, San Diego, CA, USA). The TK1 peptide was dotted onto
membranes at different concentrations (2.2, 6.6 and 20 pM) as an
extrapolated standard. The intensity of spots on the membrane was
determined using a CIS-l Imaging System (Sino-Swed Tongkang
Bio-Tech Inc.). From the intensities of the TK1 standard of known
concentrations, the STK1 concentration value was calculated and
expressed as pM. The present study selected a STK1 concentration
cut-off value of 1.0 pM, as it exhibited a higher sensitivity
compared with a concentration of 2.0 pM (0.84 vs. 0.61). All
hospitals utilized the same TK1 assay kit (cat. no. 24/48T
Sino-Swed Tongkang Bio-Tech Inc.) in accordance with the
manufacturer's protocol when determining the TK1 level from serum
samples of the membrane.
PSA assay
PSA levels were determined using an
electrochemiluminescence immunoassay. The electrochemiluminescence
automatic immunoassay analyzer functions using paramagnetic
particles as a solid phase, a biotin-streptavidin-detection system
and two-dimensional bar code technology. It is a highly sensitive
light detection system that provides excellent low-end sensitivity
and a broad dynamic measuring range. The reference cut-off value in
the present study was 4.0 ng/ml, which was recommended by the
PSA-kit supplier. The PSA values were considered positive or
negative when PSA levels were above or below the cut-off value,
respectively. The three hospitals involved in this study utilized
two different automatic machines for PSA determination [i) Beckman
Coulter UniCel®DxI 800; Chongqing Huanuo Medical
Biotechnology Co., Ltd., Chonqing, China; PSA kit, cat. no. 37200;
and Nanchang Qicheng Pharmaceutical, PSA kit, cat. no. 37200; ii)
Chemiluminescence Immunoanalyzer, Liason Type 2229; Beijing Zhong
Yi Kai Chuang Co., Ltd., Beijing, China; PSA kit, cat. no. 314381].
Each machine produced PSA values in the same range: Low (1±1
ng/ml), medium (12±14 ng/ml) and high (41±51 ng/ml) values
corresponded to healthy individuals, patients with BPH and patients
with PC, respectively.
Statistical analysis
Data are presented as the mean ± standard deviation.
For the comparison of STK1 concentration and PSA levels among the
different groups of patients investigated, one-way analysis of
variance followed by a post-hoc least significant difference test
was performed. SPSS version 19 was utilized for statistical
analysis (IBM Corp., Armonk, NY, USA). Regression analysis was
performed using Microsoft Excel (version 15.37; Microsoft
Corporation, Redmond, WA, USA). Receiver operating characteristic
(ROC) analysis was performed using the ROC program within the
Analyse-It statistical program version 2.2 (Analyse-It Software,
Ltd., Leeds, UK). The P-values presented in ROC analysis were
calculated using the ROC program. P≤0.05 was considered to indicate
a statistically significant result.
Results
STK1 concentration and total PSA of
healthy, BPH and malignant men
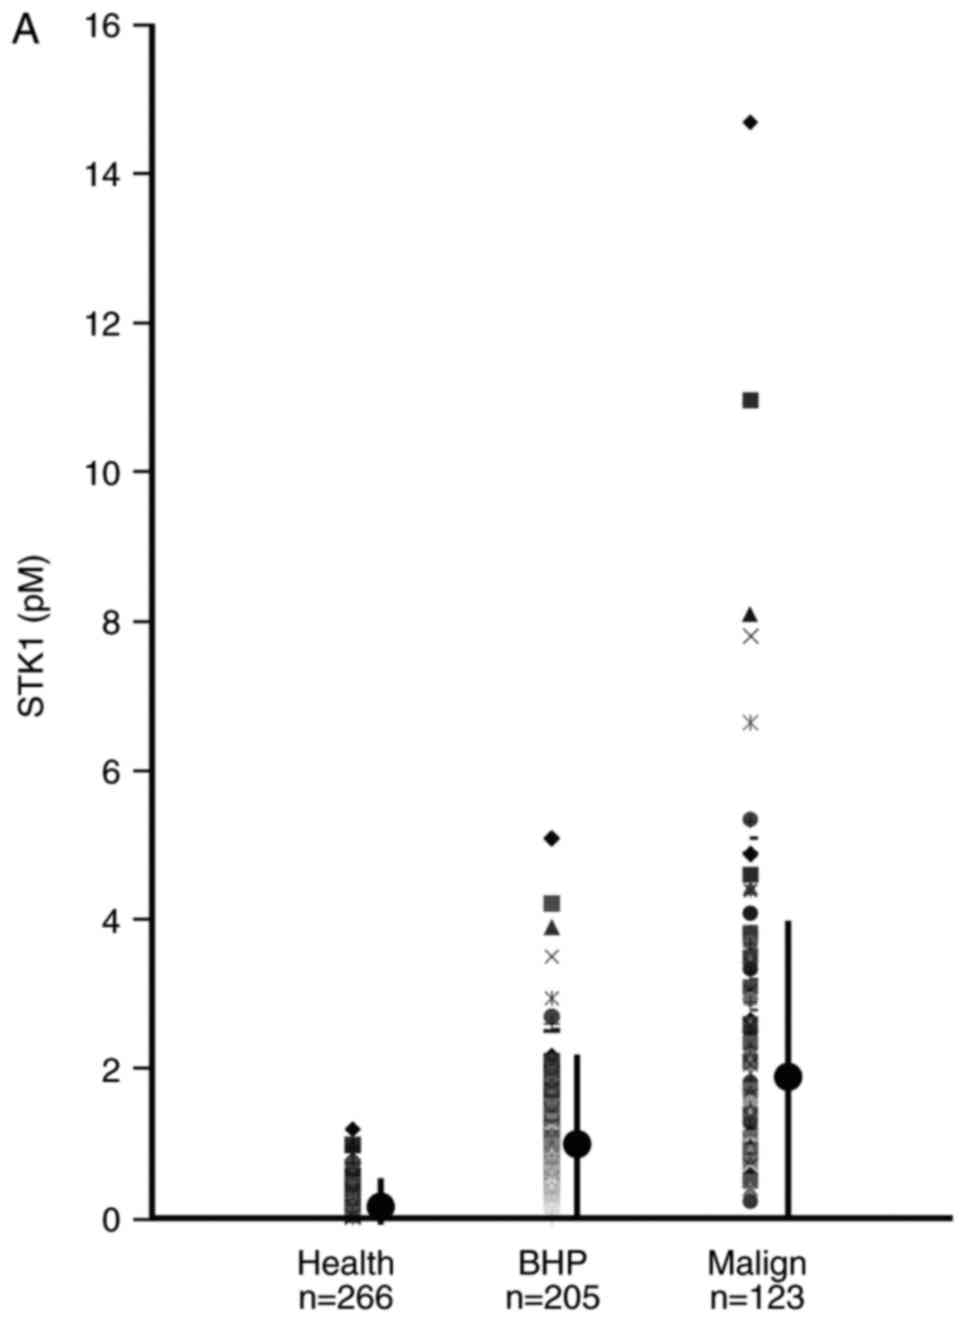
The mean values of STK1 concentration and total PSA
in patients with BPH and PC were significantly higher compared with
healthy individuals. The mean STK1 concentrations and total PSA in
patients with PC was also significantly higher compared with
patients with BPH (Tables II and
III; Fig.
1). Furthermore, 4% of patients with PC could be distinguished
from healthy individuals and those with BPH using STK1
concentrations. The corresponding value based on total PSA was 28%
(data not shown).
| Table II.STK1p (pM) mean value ± standard
deviation of healthy individuals and patients with benign prostatic
hyperplasia or prostate malignancy. |
Table II.
STK1p (pM) mean value ± standard
deviation of healthy individuals and patients with benign prostatic
hyperplasia or prostate malignancy.
| Type | Healthy |
Benign/hyperplasia | Malignant |
|---|
| Mean | 0.4a,b | 1.3b | 2.5 |
| Standard
deviation | 0.3 | 0.7 | 2.0 |
| Count | 356 | 205 | 123 |
| Max | 2.1 | 5.1 | 14.7 |
| Min | 0.0 | 0.1 | 0.2 |
| Table III.PSA (ng/ml) mean value ± standard
deviation of healthy individuals and patients with benign prostatic
hyperplasia or prostate malignancy. |
Table III.
PSA (ng/ml) mean value ± standard
deviation of healthy individuals and patients with benign prostatic
hyperplasia or prostate malignancy.
| Type | Healthy |
Benign/hyperplasia | Malignant |
|---|
| Mean | 1.3a,b | 11.8c | 41.2 |
| Standard
deviation | 0.9 | 14.1 | 51.3 |
| Count | 76 | 56 | 97 |
| Max | 4.0 | 66.6 | 153.0 |
| Min | 0.2 | 0.5 | 0.1 |
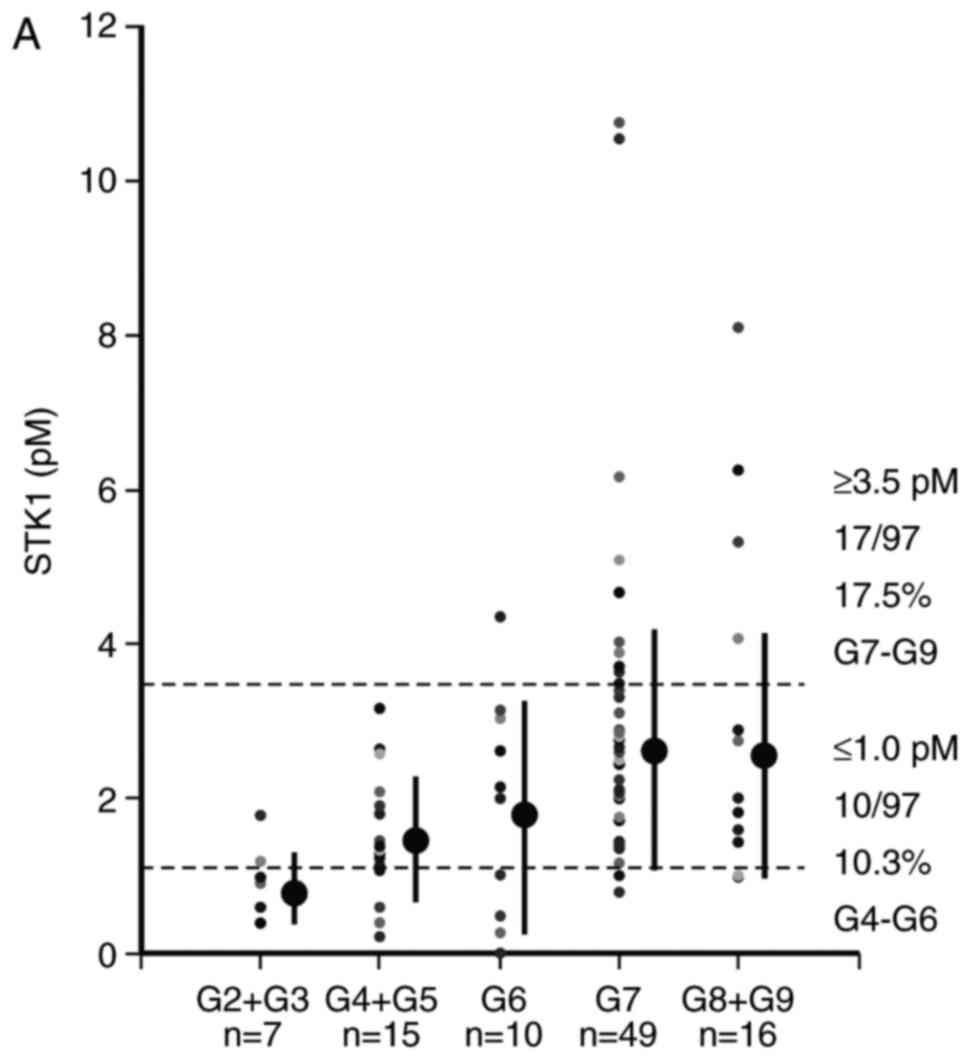
STK1 concentration, total PSA and
Gleason score
STK1 concentration was associated with GS value;
however, the association of total PSA with GS value was unclear
(Tables IV and V, Fig. 2). Of
patients with PC, 17.5% of those staged at GS7-GS9 exhibited STK1
concentrations >3.5 pM and 10.3% <1.0 pM (Fig. 2A). Furthermore, 14.3% of patients
staged at GS7-GS9 exhibited PSA values above the cut-off value (4.0
ng/ml). However, there was no significant difference in PSA value
among patients with low GS scores (Table
V and Fig. 2B). Thus, STK1
concentration is able to identify patients with high (GS7-GS9) and
low (GS3-GS4) GS scores, while PSA only identifies patients with a
high GS score (G7-G9).
| Table IV.STK1p (pM) values in relation to
Gleason score. |
Table IV.
STK1p (pM) values in relation to
Gleason score.
| Type | G2+3 | G4+5 | G6 | G7 | G8+9 |
|---|
| Mean |
1.0a,b |
1.5a,b | 2.1 | 3.0 | 2.9 |
| Std | 0.5 | 0.8 | 1.3 | 1.9 | 2.9 |
| Count | 7 | 16 | 10 | 49 | 16 |
| Max | 1.8 | 3.2 | 4.4 | 10.8 | 8.1 |
| Min | 0.4 | 0.4 | 0.5 | 0.8 | 1.0 |
| Table V.PSA (ng/ml) values in relation to
Gleason score. |
Table V.
PSA (ng/ml) values in relation to
Gleason score.
| Type | G2+G3 | G4+G5 | G6 | G7 | G8+G9 |
|---|
| Mean | 42.8 |
18.6a,b |
11.5c | 47.5 | 72.0 |
| Std | 44.5 | 28.8 | 39.1 | 53.5 | 63.1 |
| Count | 4 | 18 | 8 | 48 | 9 |
| Max | 98.2 | 100.0 | 79.6 | 153.0 | 151.0 |
| Min |
1.5 |
0.1 |
0.1 | 0.1 |
1.8 |
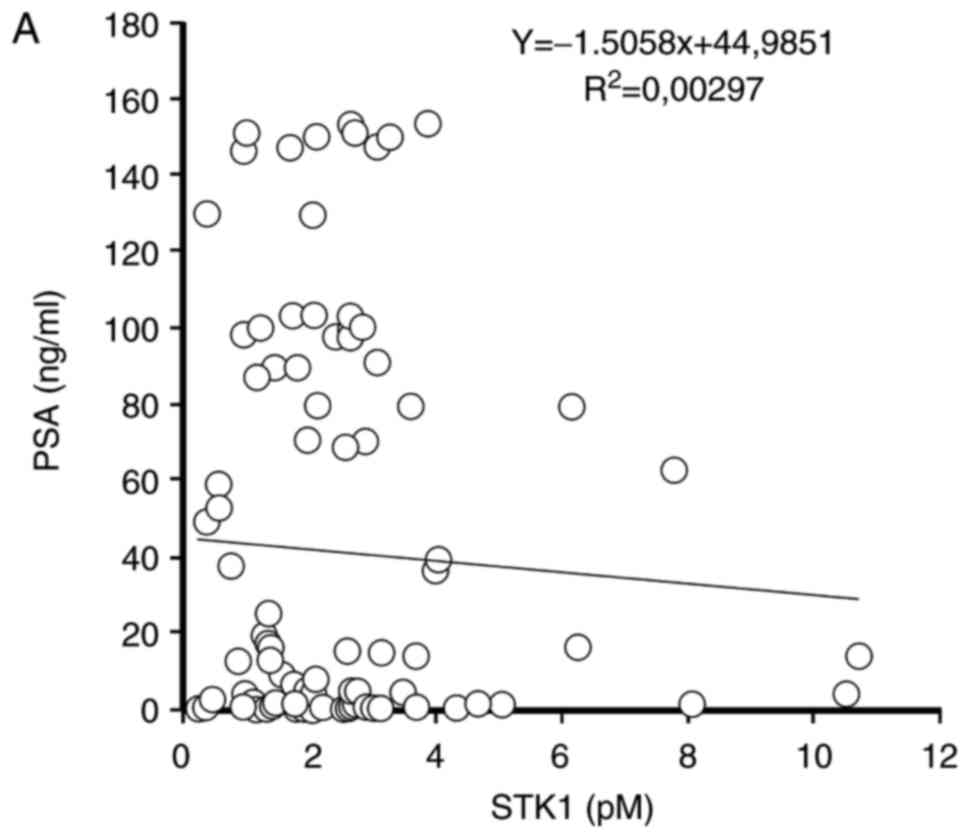
Association between STK1 concentration
and total PSA in serum
No significant association between STK1
concentration and total PSA in the serum of patients with BPH or PC
was identified (Fig. 3).
Monitoring and survival
Of the 123 patients with PC, 18 cases were monitored
for up to 10 months following prostate biopsy and radical
prostectomy (Table VI). STK1
concentration decreased significantly at 3, 6 and 10 months
compared with the STK1 values prior to surgery. No PSA values were
obtained.
| Table VI.Mean ± standard deviation of STK1
(pM) prior to and 3, 6 and 10 months following radical
prostatectomy. |
Table VI.
Mean ± standard deviation of STK1
(pM) prior to and 3, 6 and 10 months following radical
prostatectomy.
|
|
| Months |
|---|
|
|
|
|
|---|
| Type | Prior to
procedure | 3 | 6 | 10 |
|---|
| Mean | 2.9 |
1.4a |
1.0a |
1.0a |
| Std | 1.8 | 0.9 | 0.4 | 0.4 |
| Count | 12 | 16 | 9 | 4 |
| Max | 6.3 | 3.7 | 1.8 | 1.5 |
| Min | 0.9 | 0.4 | 0.5 | 0.5 |
Of the 123 men with prostate malignancy, 51 were
followed up for 5 years. A total of 98% (50/51) of patients
survived following these 5 years.
To confirm that STK1 and PSA values were associated
with the effect of treatment, the data of one individual are
presented. The individual that succumbed was found to have stage II
BPH at the age of 85 and exhibited frequent urination, with an STK1
concentration of 1.5 pM and a PSA value of 140 ng/ml. The
ultrasound (Philips iU22) scan exhibited calcification and a
retention cyst (5.8×4.8×5.8 cm). Furthermore, CT results revealed
prostate hyperplasia. Following 3 months, BPH progressed into PC. A
biopsy was performed and a GS of GS4+3 was determined. STK1
concentration was increased to 4.5 pM. The individual was treated
with successful intermittent androgen therapy (flutamide +
diphereline). Following 3 months, STK1 was decreased to 2.6 pM and
following a further 3 months, STK1 concentration reached a value of
0.6 pM, which is a result that corresponds to that of healthy
individuals. PSA was also decreased to normal values (<4 ng/ml).
However, 48 months following the start of treatment, the PSA value
increased to 5.5 ng/ml. As a result, the individual received an
additional cycle of treatment (bicalutamide + flutamide +
diphereline) and following a further 12 months, PSA continued to
increase (11.75 ng/ml). STK1 concentration was not assessed during
the treatment period. A total of 62 months after the start of
treatment, the individual succumbed at the age of 91 as a result of
type III hypertension, chronic bronchitis, diabetes, coronary heart
disease, fatty liver and multiple cerebral infarctions (data not
shown)
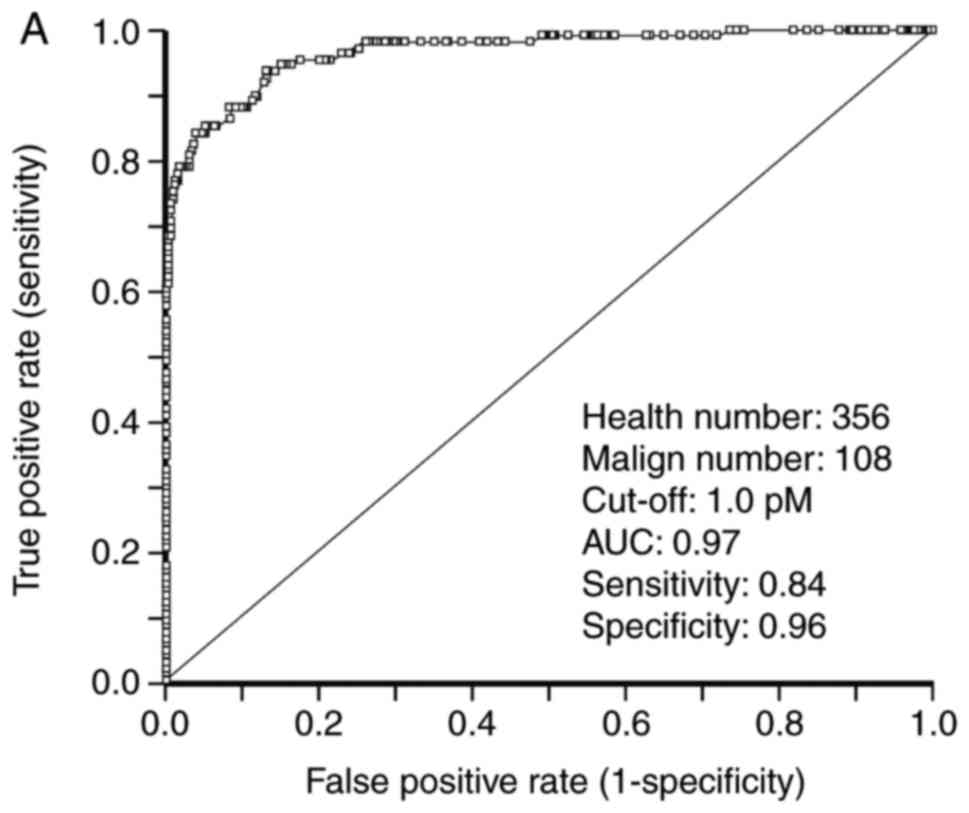
ROC analysis of STK1 and total
PSA
To investigate the use of STK1 concentration and PSA
in the screening of PC, an ROC statistical analysis was performed,
the results of which are presented in Table VII and Fig. 4. For patients with PC, the AUC value
of STK1 was 0.97. At a cut-off concentration of 1.00 pM, the
sensitivity and specificity of STK1 concentration were at 0.84 and
0.96, respectively, and exhibited a likelihood of (+) 124.6 (data
not shown). At a cut-off concentration of 2.00 pM, the sensitivity
and specificity values of STK1 were 0.60 and 0.99, respectively and
exhibited a likelihood value of (+) 214.26. Similar values were
obtained for patients with BPH tumors (Table VII). This indicates that the
concentration of STK1 may be used in the screening of patients with
BPH or PC. The sensitivity and specificity of total PSA in patients
with PC were 0.62 and 0.93, respectively. Furthermore, the
likelihood value was (+) 9.40 and the AUC value was 0.74 (Table VII). Similar values were identified
in patients with BPH. Although the specificity and likelihood
values were high, the AUC was relatively low (0.74) in patients
with PC, indicating that total PSA is a less reliable method of
prostate screening compared with STK1.
| Table VII.ROC analysis of STK1p and PSA. |
Table VII.
ROC analysis of STK1p and PSA.
| Type | Sensitivity | Specificity | Likelihood(+) | AUC | P-value |
|---|
| STK1, cut-off 2.0
pM |
|
|
|
|
|
| Healthy
vs. malignant | 0.60 | 0.99 | 124.61 | 0.97 | <0.0001 |
| Healthy
vs. benign | 0.09 | 0.99 | 30.85 | 0.89 | <0.0001 |
| Benign
vs. malignant | 0.65 | 0.95 | 11.10 | 0.74 | <0.0001 |
| PSA, cut-off 4.0
ng/ml |
|
|
|
|
|
| Healthy
vs. malignant | 0.62 | 0.93 | 9.40 | 0.74 | <0.0001 |
| Healthy
vs. benign | 0.71 | 0.99 | 54.30 | 0.92 | <0.0001 |
| Benign
vs. malignant | 0.62 | 0.29 | 0.87 | 0.54 | 0.18 |
Discussion
Although the Gleason grading system has undergone
significant revisions, it still has problems that may potentially
impact patient care. Herein the current state of PC grading, with
focus on the current guidelines for the Gleason grading system and
recent changes from the 2014 ISUP Consensus Conference on Gleason
Grading of Prostatic Carcinoma (11)
will be discussed.
It is important to note that the present study was
not a clinical trial following specific criteria, but was based on
data collected during routine clinical work. This may limit the
reliability of the conclusions drawn. However, the current study
may indicate if STK1 and/or PSA can be used for the diagnosis of
PC. The current study was also limited by the number of cases
included (PC, n=123; BPH, n=205; healthy controls, n=266). Further
studies are thus required to confirm the conclusions drawn.
TK1 expression in tumor tissues and STK1
concentration in patients with PC have been demonstrated to be
reliable biomarkers for tumor recurrence and patient survival, as
well as for cancer treatment monitoring for complete remission,
partial remission, stable disease and progressive disease, and in
leukemia, lymphoma and solid tumors of different types (28,31). TK1
is a kinase enzyme involved in the synthesis of DNA and is a part
of the thymidine salvage pathway, functioning to phosphorylate
thymidine to thymidine monophosphate (28,31). STK1
was originally measured by its activity (STKa). However, the STKa
test was primarily used for patients with leukemia and lymphoma, as
its use in solid tumors was limited. However, the updated STKa
assay is now used in certain solid tumors, including breast and
lung carcinoma. The development of chicken immunoglobulin (Ig) Y
anti-TK1 antibodies made it possible to determine TK1 expression
levels in various solid human tumors and TK1 concentrations in
patient serum. In addition, IgY anti-TK1 antibodies exhibit no
cross-reactivity in human serum and thus could be used in the
screening of healthy individuals. IgG anti-TK1 antibodies currently
on the market exhibit high levels of un-specific binding in human
serum when utilized for the screening of healthy individuals. Thus
far, we have investigated 20 different types of solid tumor using
IgY anti-TK1 antibodies with convincing results (31) Using the IgY anti-TK1 antibody, TK1
expression in prostate tumor tissue determined by
immunohistochemistry was demonstrated to be associated with relapse
following RP (35).
The results of the present study were consistent
with those from Jagarlamudi et al (34), who demonstrated that STK1 correlated
to Gleason score. The study utilized the TK1 IgY antibody, which
indicated that they were reliable. The close correlation between
STK1 concentration and GS scores may potentially reduce the use of
biopsy when screening for PC risk. The present study demonstrated
that 10% of patients with low Gleason scores (GS3-GS4) and ~17% of
patients with high Gleason scores (GS7-GS9) could be identified via
STK1 concentrations. Biopsies of any tissue, particularly that of
the prostate, is unpleasant for patients and the reduction of its
use would be advantageous. In a previous study based on the
clinical trial Stockholm3 model (37)
using a cohort of 145,905 individuals, a combination of PSA,
clinical variables, established biomarkers and novel plasma protein
biomarkers were utilized. The aim of this study was to determine a
method by which to reduce the number of biopsies, since a biopsy is
a painful process for a patient to endure. It was determined that
the number of biopsies among individuals with a high risk of
prostate carcinoma (GS7 or higher) was reduced by 32% and reduced
by 44% among men with BPH (37). This
is a promising improvement and may avoid unpleasant biopsies in men
at risk of PC. To further improve these results, STK1 concentration
could be utilized as an additional serum biomarker in the STHLM3
model.
The present study identified that no healthy men
exhibited high total PSA values; however, a number of patients with
BPH and PC exhibited low and high total PSA values, respectively,
making it of limited use in prostate screening. The results also
revealed that 28% of patients with PC exhibited higher total PSA
values compared with those with BPH. Thus, although total PSA did
not correlate to Gleason score, the individual value of total PSA
may be used to identify certain individuals with a high risk of PC.
Since the corresponding value of STK1 concentration was 4%, it
appears that total PSA is more reliable. However, it should be
noted that STK1 concentration is associated with the growth rate of
tumors, which is an important prognostic factor, while PSA is not
(20). This indicates that the 4% of
patients with PC identified by STK1 concentration possess a high
risk, while the 28% identified by total PSA exhibit prostate tumors
with a low proliferation rate and thus a better prognosis.
Therefore, STK1 concentration may be a more reliable biomarker than
total PSA. However, the present study recommends that PSA (total
PSA or free-PSA) and STK1 concentration should be used in
combination as they represent different properties of prostate
tumors that are important for the assessment of risk.
In the current study, STK1 concentration was
compared with total PSA in serum. However, the results did not
identify any association between these two biomarkers. Furthermore,
unlike STK1, total PSA was not associated with GS. However, certain
cases exhibited high total PSA (>120 ng/ml) with a GS of G7-G9.
These results confirm that total PSA has a limited use, as
aforementioned. However, it should be noted that total PSA was
measured in the present study, which meant that free-PSA was not
excluded and thus may have produced different results. In a health
screening of 486,085 people conducted at the 180 PLA Hospital
(Quanzhou, China), 12,530 men were assessed for STK1 concentration
and free-PSA. It was determined that no correlation existed between
STK1 and free-PSA (unpublished data).
Although STK1 concentration was associated with GS,
the question still remains as to whether STK1 concentration is
sensitive and specific enough to be utilized in the screening of PC
risk. To address this, the current study performed ROC statistical
analysis. The sensitivity, specificity and likelihood (+) of STK1
were high and the AUC value was 0.97, which indicated that the
determination of STK1 concentration may be a useful test for the
screening of individuals for PC risk. The corresponding AUC value
of PSA was 0.74. Although the ROC analysis of STK1 concentration
presented a high AUC value, with a significantly higher mean value
in patients with STK1 compared with patients with BPH, only 4% of
individuals with PC exhibited an STK1 concentration value above
those with BPH. This limits the use of the STK1 assay when
attempting to distinguish those with BPH from those with PC.
However, STK1 concentrations were significantly higher in patients
with PC compared with healthy individuals, in mean and individual
values. In addition, in a previous health screening meta-analysis
on 35,365 patients, it was demonstrated that those with
moderate/severe hyperplasia, including prostate BPH, who exhibited
high STK1 concentrations, had a 3–5 times higher risk of
progression to malignancy (38).
Thus, although there is a limited possibility to distinguish
between patients with BPH and patients with PC, those diagnosed
with BPH that exhibit high STK1 concentrations should be associated
with a high risk of PC development later in life.
In conclusion, the results indicated that STK1
concentrations are significantly higher in patients with BPH and PC
compared with healthy individuals, indicating that the
determination of STK1 concentration may be used for the screening
of prostate complications. However, due to the overlapping of
individual STK1 values between patients with BPH and those with PC,
distinguishing between these two groups via the assessment of STK1
concentration alone may be inefficient. It is likely that patients
with BPH that exhibit high STK1 concentrations have an increased
risk of progression to malignancy. Since STK1 concentration is
associated with GS, it may be possible to reduce the number of
biopsies obtained from men with suspected prostate BPH/malignancy
by determining STK1 concentration.
Acknowledgements
This study was supported by the Southwest Hospital,
Third Military Medical University (Chongqing, China), the Shaanxi
Provincial People's Hospital, the PLA 180 Hospital and Daping
Hospital, Third Military Medical University, which provided
facilities for running the tests, and by Sino-Swed Molecular
Bio-Medicine Research Institute for development of the TK1 IgY
antibody.
Funding
This study was supported by the Southwest Hospital,
Third Military Medical University (Chongqing, China), the Shaanxi
Provincial People's Hospital, the PLA 180 Hospital and Daping
Hospital, Third Military Medical University, which covered the
costs of the different reagents for the serum tests.
Availability of data and materials
All data generated or analyzed during this study are
included in this published article.
Authors' contributions
KQZ was responsible for all aspects of the study.
SJL, JPZ and KQZ designed the study and cooperated with pathologist
and clinical laboratories to analyze the results. YW collect the
serum from the healthy individuals, and analyzed the STK1 and PSA
of those individuals. JJY, XLZ and CMW were responsible for the
collection of tissues and serum samples. HBM, EH and SS analyzed
the data and cooperated in the writing of the manuscript. Beside
the responsibility for the development, testing and production of
the TK1 antibody, JZ also participated in the planning of the
project. All authors provided final approval for publication.
Ethics approval and consent to
participate
All procedures performed in studies involving human
participants were in accordance with the ethical standards of the
institutional and/or national research committee and with the 1964
Declaration of Helsinki and its later amendments or comparable
ethical standards. (Health Management Centre of PLA 180 Hospital,
Quanzhou, China, No. LL2009003). Informed consent was obtained from
all individual participants included in the study.
Patient consent for publication
All patients provided consent for the use of their
clinical data in this study.
Competing interests
The authors SJL, JPZ, YW, KQZ, JJY, XLZ, CMW, HBM,
EH and SS declare no conflict of interest. JZ is the owner of
Sino-Swed Tongkang Bio-Tech Inc., the company that produced the TK1
antibody.
Glossary
Abbreviations
Abbreviations:
|
TK1
|
thymidine kinase 1
|
|
STK1
|
serum thymidine kinase 1
|
|
STKa
|
serum thymidine kinase activity
|
|
PSA
|
prostate specific antigen
|
|
PC
|
prostate cancer
|
|
BPH
|
benign prostatic hyperplasia
|
|
GS
|
Gleason score
|
|
AUC
|
area under the curve
|
|
ROC
|
receiver operation characteristic
|
|
RP
|
radical prostatectomy
|
|
ISUP
|
International Society of Urological
Pathology
|
References
|
1
|
Global Burden of Disease Cancer
Collaboration, ; Fitzmaurice C, Dicker D, Pain A, Hamavid H,
Moradi-Lakeh M, MacIntyre MF, Allen C, Hansen G, Woodbrook R, Wolfe
C, et al: The global burden of cancer 2013. JAMA Oncol. 1:505–527.
2015. View Article : Google Scholar : PubMed/NCBI
|
|
2
|
Hoffman RM, Meisner AL, Arap W, Barry M,
Shah SK, Zeliadt SB and Wiggins CL: Trends in United States
prostate cancer incidence rates by age and stage, 1995–2012. Cancer
Epidemiol Biomarkers Prev. 25:259–263. 2016. View Article : Google Scholar : PubMed/NCBI
|
|
3
|
Schröder FH, Hugosson J, Roobol MJ,
Tammela TL, Zappa M, Nelen V, Kwiatkowski M, Lujan M, Määttönen L,
Lilja H, et al: Screening and prostate cancer mortality: Results of
the European randomised study of screening for prostate cancer
(ERSPC) at 13 years of follow-up. Lancet. 384:2027–2035. 2014.
View Article : Google Scholar : PubMed/NCBI
|
|
4
|
Siegel RL, Miller KD and Jemal A: Cancer
statistics, 2017. CA Cancer J Clin. 67:7–30. 2017. View Article : Google Scholar : PubMed/NCBI
|
|
5
|
Siegel R, Naishadham D and Jemal A: Cancer
statistics, 2013. CA Cancer J Clin. 63:11–30. 2013. View Article : Google Scholar : PubMed/NCBI
|
|
6
|
Chen W, Zheng R, Baade PD, Zhang S, Zeng
H, Bray F, Jemal A, Yu XQ and He J: Cancer statistics in China
2015. CA Cancer J Clin. 66:115–132. 2016. View Article : Google Scholar : PubMed/NCBI
|
|
7
|
Gleason DF: Classification of prostatic
carcinomas. Cancer Chemother Rep. 50:125–128. 1966.PubMed/NCBI
|
|
8
|
Amin MB, Schultz DS and Zarbo RJ: Analysis
of cribriform morphology in prostatic neoplasia using antibody to
high-molecular-weight cytokeratins. Arch Pathol Lab Med.
118:260–264. 1994.PubMed/NCBI
|
|
9
|
Epstein JI, Allsbrook WC Jr, Amin MB and
Egevad LL: The 2005 International Society of Urological Pathology
(ISUP) consensus conference on gleason grading of prostatic
carcinoma. Am J Surg Pathol. 29:1228–1242. 2005. View Article : Google Scholar : PubMed/NCBI
|
|
10
|
Eggener SE, Badani K, Barocas DA,
Barrisford GW, Cheng JS, Chin AI, Corcoran A, Epstein JI, George
AK, Gupta GN, et al: Gleason 6 prostate cancer: Translating biology
into population health. J Urol. 194:626–634. 2015. View Article : Google Scholar : PubMed/NCBI
|
|
11
|
Epstein JI, Egevad L, Amin MB, Delahunt B,
Srigley JR and Humphrey PA; Grading Committee, : The 2014
International Society of Urological Pathology (ISUP) consensus
conference on gleason grading of prostatic carcinoma: Definition of
grading patterns and proposal for a new grading system. Am J Surg
Pathol. 40:244–252. 2016.PubMed/NCBI
|
|
12
|
Gordetsky J and Epstein J: Grading of
prostatic adenocarcinoma: Current state and prognostic
implications. Diagn Pathol. 11:252016. View Article : Google Scholar : PubMed/NCBI
|
|
13
|
Suzuki H, Komiya A, Kamiya N, Imamoto T,
Kawamura K, Miura J, Suzuki N, Nakatsu H, Hata A and Ichikawa T:
Development of a nomogram to predict probability of positive
initial prostate biopsy among Japanese patients. Urology.
67:131–136. 2006. View Article : Google Scholar : PubMed/NCBI
|
|
14
|
Shipitsin M, Small C, Choudhury S, Giladi
E, Friedlander S, Nardone J, Hussain S, Hurley AD, Ernst C, Huang
YE, et al: Identification of proteomic biomarkers predicting
prostate cancer aggressiveness and lethality despite
biopsy-sampling error. Br J Cancer. 111:1201–1212. 2014. View Article : Google Scholar : PubMed/NCBI
|
|
15
|
Epstein JI, Feng Z, Trock BJ and
Pierorazio PM: Upgrading and downgrading of prostate cancer from
biopsy to radical prostatectomy: Incidence and predictive factors
using the modified Gleason grading system and factoring in tertiary
grades. Eur Urol. 61:1019–1024. 2012. View Article : Google Scholar : PubMed/NCBI
|
|
16
|
Pezaro CJ, Omlin A, Lorente D, Nava RD,
Ferraldeschi R, Bianchini D, Mukherji D, Riisnaes R, Altavilla A,
Crespo M, et al: Visceral disease in castration-resistant prostate
cancer. Eur Urol. 65:270–273. 2014. View Article : Google Scholar : PubMed/NCBI
|
|
17
|
Ramakrishnan VM, Bossert K, Singer G,
Lehmann K and Hefermehl LJ: The impact of the 2005 International
Society of Urological Pathology Gleason grading consensus on active
surveillance for prostate cancer. Cent European J Urol. 70:344–348.
2017.PubMed/NCBI
|
|
18
|
Lima NG, Soares Dde F and Rhoden EL:
Importance of prostate-specific antigen (PSA) as a predictive
factor for concordance between the Gleason scores of prostate
biopsies and RADICAL prostatectomy specimens. Clinics (Sao Paulo).
68:820–824. 2013. View Article : Google Scholar : PubMed/NCBI
|
|
19
|
Liu X, Chen X, Rycaj K, Chao HP, Deng Q,
Jeter C, Liu C, Honorio S, Li H, Davis T, et al: Systematic
dissection of phenotypic, functional, and tumorigenic heterogeneity
of human prostate cancer cells. Oncotarget. 6:23959–23986.
2015.PubMed/NCBI
|
|
20
|
Sfanos KS and De Marzo AM: Prostate cancer
and inflammation: The evidence. Histopathology. 60:199–215. 2012.
View Article : Google Scholar : PubMed/NCBI
|
|
21
|
Grimm P, Billiet I, Bostwick D, Dicker AP,
Frank S, Immerzeel J, Keyes M, Kupelian P, Lee WR, Machtens S, et
al: Comparative analysis of prostatespecific antigen free survival
outcomes for patients with low, intermediate and high risk prostate
cancer treatment by radical therapy. Results from the Prostate
Cancer Results Study Group. BJU Int. 109 Suppl 1:S22–S29. 2012.
View Article : Google Scholar
|
|
22
|
Thompson I, Thrasher JB, Aus G, Burnett
AL, Canby-Hagino ED, Cookson MS, D'Amico AV, Dmochowski RR, Eton
DT, Forman JD, et al: Guideline for the management of clinically
localized prostate cancer: 2007 update. J Urol. 177:2106–2131.
2007. View Article : Google Scholar : PubMed/NCBI
|
|
23
|
Wilt TJ, MacDonald R, Rutks I, Shamliyan
TA, Taylor BC and Kane RL: Systematic review: Comparative
effectiveness and harms of treatments for clinically localized
prostate cancer. Ann Int Med. 148:435–448. 2008. View Article : Google Scholar : PubMed/NCBI
|
|
24
|
Mitchell JM: Urologists' use of
intensity-modulated radiation therapy for prostate cancer. N Engl J
Med. 369:1629–1637. 2013. View Article : Google Scholar : PubMed/NCBI
|
|
25
|
Ilic D, Neuberger MM, Djulbegovic M and
Dahm P: Screening for prostate cancer. Cochrane Database Syst Rev.
31:CD0047202013.
|
|
26
|
Herschman JD, Smith DS and Catalona WJ:
Effect of ejaculation on serum total and free prostate-specific
antigen concentrations. Urology. 50:239–243. 1997. View Article : Google Scholar : PubMed/NCBI
|
|
27
|
Pron G: Prostate-specific antigen
(PSA)-based population screening for prostate cancer: An
evidence-based analysis. Ont Health Technol Assess Ser. 15:1–64.
2015.
|
|
28
|
Skog S, He E and Haghdoost S: Prevention
and early detection of human tumor. LAP Lambert Academic
Publishing; pp. 742017
|
|
29
|
Wu JT: Circulating tumor markers of the
new millennium. AACC Press; New York, NY: pp. 115–117. 2002
|
|
30
|
Bouchardy C, Fioretta G, Rapiti E,
Verkooijen HM, Rapin CH, Schmidlin F, Miralbell R and Zanetti R:
Recent trends in prostate cancer mortality show a continuous
decrease in several countries. Int J Cancer. 123:421–429. 2008.
View Article : Google Scholar : PubMed/NCBI
|
|
31
|
Zhou J, He E and Skog S: The proliferation
marker thymidine kinase 1 in clinical use (Review). Mol Clin Oncol.
1:18–28. 2013. View Article : Google Scholar : PubMed/NCBI
|
|
32
|
Letocha H, Eklöv S, Gronowitz S, Norlen BJ
and Nilsson S: Deoxythymidine in staging of prostatic carcinoma.
Prostate. 29:15–19. 1996. View Article : Google Scholar : PubMed/NCBI
|
|
33
|
Li SJ, Wu G, Ye J, Zhang X, Cheng F, Zhang
KQ and Yan-Feng J: The purpose of blood serum thymidine kinase
level in early screening of prostatic carcinoma. Immun J.
27:459–461. 2011.
|
|
34
|
Jagarlamudi KK, Hansson LO and Eriksson S:
Breast and prostate cancer patients differ significantly in their
serum thymidine kinase 1 (TK1) specific activities compared with
those hematological malignancies and blood donors: Implications of
using serum TK1 as a biomarker. BMC Cancer. 15:662015. View Article : Google Scholar : PubMed/NCBI
|
|
35
|
Aufderklamm S, Hennenlotter J, Todenhoefer
T, Gakis G, Schilling D, Vogel U, Kuehs U, Dlugosch J, Knapp J,
Merseburger A, et al: XPA-210: A new proliferation marker
determines locally advanced prostate cancer and is a predictor of
biochemical recurrence. World J Urol. 30:547–552. 2012. View Article : Google Scholar : PubMed/NCBI
|
|
36
|
Na Y, Sun Z, Ye Z and Sun Y: Guidelines
for the diagnosis and treatment of Urology Surgery in ChinaIII
Guidelines for the diagnosis and treatment of prostate cancer. Ming
L, Su G and He D: People's Health Press; Beijing: pp. 32–84.
2007
|
|
37
|
Grönberg H, Adolfsson J, Aly M, Nordström
T, Wiklund P, Brandberg Y, Thompson J, Wiklund F, Lindberg J,
Clements M, et al: Prostate cancer screening in men aged 50–69
years (STHLM3): A prospective population-based diagnostic study.
Lancet Oncol. 16:1667–1676. 2015. View Article : Google Scholar : PubMed/NCBI
|
|
38
|
Chen ZH, Huang SQ, Wang Y, Yang AZ, Wen J,
Xu XH, Chen Y, Chen QB, Wang YH, He E, et al: Serological thymidine
kinase 1 is a biomarker for early detection of tumours-a health
screening study on 35,365 people using a sensitive chemiluminescent
dot blot assay. Sensor (Basel). 11:11064–11080. 2011. View Article : Google Scholar
|