Introduction
Pancreatic cancer is the eighth-leading cause of
cancer-associated mortality worldwide. The high frequency of
pancreatic cancer invasion and metastasis results in an extremely
poor prognosis, and is one of the most defining characteristics of
pancreatic cancer. The majority of patients are incurable at the
time of diagnosis, with a median survival time of <1 year, and a
5-year survival rate of 6% for all stages (1,2).
To date, the cellular and molecular mechanisms of
invasion and metastasis in pancreatic cancer are incompletely
characterized. The identification of the factors associated with
differences in the potential for tumor invasion and metastasis may
provide useful information for the development of novel therapeutic
methods to prevent these outcomes. A number of functional studies
have demonstrated that microRNAs (miRNAs/miRs) serve important
roles in biological processes that affect tumor progression,
including cell differentiation, migration, invasion, metastasis and
epithelial-to-mesenchymal transition (EMT) (3–5). miRNA
expression profiling experiments have been performed regarding a
number of different types of cancer and have identified a large
number of aberrantly regulated miRNAs that may contribute to
carcinogenesis by promoting the expression of proto-oncogenes or
inhibiting the expression of tumor suppressor genes, including in
pancreatic cancer (6–8).
To investigate the mechanisms of invasion and
metastasis in pancreatic cancer, two hamster pancreatic cancer cell
lines with different potentials for invasion and metastasis
following intrapancreatic transplantation, i.e., PC-1, with a low
potential, and PC-1.0, with a high potential, were previously
established by Egami et al (9), from a pancreatic ductal carcinoma
induced by N-nitrosobis (2-oxopropyl) amine (BOP) in a golden
Syrian hamster (10).
In the present study, the differential expression of
miRNA in the hamster pancreatic cancer cell lines was analyzed
utilizing miRNA microarray technology, and verified via RT-qPCR. In
addition, Gene Ontology (GO) and Kyoto Encyclopedia of Genes and
Genomes (KEGG) term enrichment analysis were applied to provide
further evidence that the differentially expressed miRNAs were
markers for invasion and metastasis in pancreatic cancer.
Materials and methods
Cell lines and cell culture
Two hamster pancreatic cancer cell lines were used,
including the weakly invasive, rarely metastatic cell line PC-1,
and the highly invasive and metastatic cell line PC-1.0. The PC-1
cell line was established from pancreatic ductal adenocarcinomas
induced by BOP in a golden Syrian hamster (9). The PC-1.0 cell line was established from
a subcutaneous tumor produced after the inoculation of PC-1 cells
into hamsters (10). These two cell
lines exhibit different growth rates and morphology in
vitro: PC-1 cells form island-like cell colonies, whereas
PC-1.0 cells primarily grow as single cells (11). The human pancreatic cancer cell lines
AsPC-1 (highly invasive) and CAPAN-2 (less invasive) were also
used. CAPAN-2 cells grow primarily as island-like colonies, similar
to PC-1 cells, whereas AsPC-1 cells exhibit a growth pattern of
single cells, similar to PC-1.0 cells. The PC-1.0 and PC-1 cells
were given as a gift from Professor Baba H. The AsPC-1 and CAPAN-2
cell lines were purchased from the Institute of Biochemistry and
Cell Biology (Chinese Academy of Sciences, Shanghai, China).
All cell lines were grown in RPMI-1640 (Gibco;
Thermo Fisher Scientific, Inc., Waltham, MA, USA) supplemented with
10% fetal bovine serum (Gibco; Thermo Fisher Scientific, Inc.,
Waltham, MA, USA), 100 U/ml penicillin G, and 100 µg/ml
streptomycin at 37°C in a humidified atmosphere of 5%
CO2 and 95% air.
Preparation of total RNA
Total RNA was extracted using TRIzol reagent
(Invitrogen; Thermo Fisher Scientific, Inc.) according to the
manufacturer's protocol. After TRIzol extraction, RNA was further
purified using an RNeasy mini spin column kit (Qiagen, Inc.,
Valencia, CA, USA). The concentration and quality of the RNA were
assessed via spectrophotometry and agarose gel electrophoresis.
miRNA microarray
The miRNA microarray chip version 3.0 (CapitalBio
Technology, Inc., Beijing, China) contained 1,965 mature miRNA
probes; as the hamster gene sequence was not complete at the time
of the study, the microarray chip used in the present study was
designed as a mixed gene chip, including 988 human, 350 rat and 627
mouse miRNA genes. A total of 1,965 probes were designed on the
basis of the sequences present in the miRBase version 12.0 miRNA
database (12). These probes were
labeled onto a 75×25 mm chemically-modified plate using the
SmartArray™ microarray system (CapitalBio Technology,
Inc.). The samples also contained two endogenous controls (U6,
tRNA), eight exogenous controls (Zip5, Zip13, Zip15, Zip21, Zip23,
Zip25, Y2 and Y3; Ambion; Thermo Fisher Scientific, Inc.), a
positive control (HEX), and a hybridization negative control (50%
dimethyl sulfoxide). The control sequences are listed in Table I.
 | Table I.Control and normalization sequences
for the microRNA microarray. |
Table I.
Control and normalization sequences
for the microRNA microarray.
| Identity | Sequence
(5′-3′) |
|---|
| U6 |
ATTTGCGTGTCATCCTTGCG |
| tRNA |
GGGTTATGGGCCCAGCACGCTTCCGCTGCGCCACTCTGCT |
| Zip23 |
CAGCATCGGACCGGTAATCGGACC |
| Zip5 |
GACCACCTTGCGATCGGGTACAGC |
| Zip15 |
GACCGGTATGCGACCTGGTATGCG |
| Zip13 |
CAGCGGTAGACCACCTATCGTGCG |
| Zip21 |
TGCGATCGCAGCGGTAACCTGACC |
| Zip25 |
GACCATAGTGCGGGTAGGTAGACC |
| Y2 |
AGGTACGAAACGCTAAGAAT |
| Y3 |
CATTCCTAAACGGGCTGAT |
| HEX |
GTCACATGCGATGGATCGAGCTCCTTTATCATCGTTCCCACCTTAATGCA |
To isolate miRNA, total RNA (40.0 µg) was prepared
using the polyethylene glycol (PEG) method; high molecular weight
RNAs were removed by precipitation with 12.5% PEG-8000 and 1.25 M
NaCl. The remaining RNA molecules were fractionated on a 15%
acrylamide gel containing 8 M urea and extracted in water.
Subsequently, the isolated miRNAs were dephosphorylated with calf
intestinal alkaline phosphatase and labeled with CU-cy3 (green) and
CU-cy5 (red; GE Healthcare Dharmacon, Inc., Lafayette, CO, USA),
respectively, utilizing T4 RNA ligase to couple the 3′ end of the
RNAs. The labeled products were isolated, purified and hybridized
using a hybridization solution (15% formamide, 0.2% SDS, 3X SSC, 5X
Denhardt's solution) at 42°C overnight. The plate was washed
separately with solution I (0.2% SDS and 2X SSC) and solution II
(0.2X SSC) for 4 min, dried, and scanned using a LuxScan 10K/A dual
pathways laser scanner (CapitalBio Technology, Inc.).
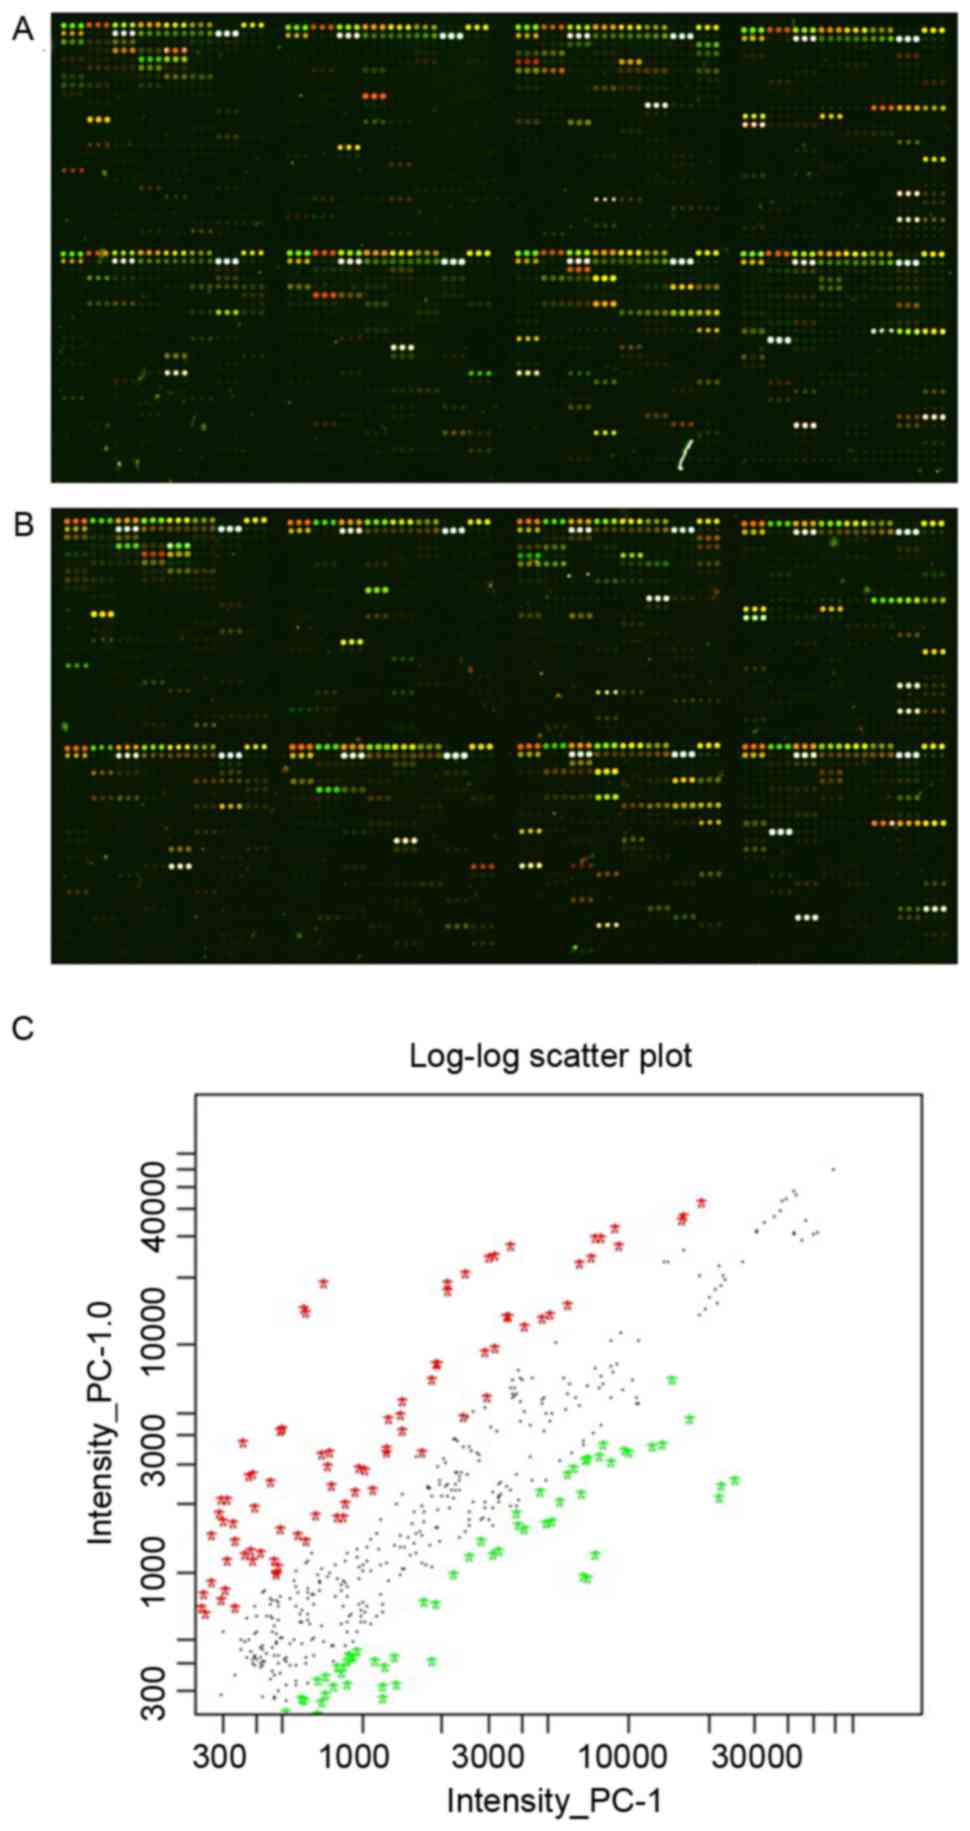
Microarray analysis
miRNA profiles were adjusted with the global mean
values to establish uniformity according to the total signal
intensity of Cy5 and Cy3. The data were normalized and summarized
using the LOWESS method, as previously described (13). The miRNAs were labeled according to
the intensity of the signal and the quality of the image. Signal
values >400 and <1,500 or >1,500 were selected. The two
iterations of the microarray with different fluorescence labels
were integrated as ratio=(ratio 1 × ratio 2)0.5
(Fig. 1). The most significant
differentially expressed miRNAs (ratio ≥2 or ≤0.5, and q-value
<1%) were identified following the integration. The miRNA probes
tested the mature miRNA* and miRNA simultaneously, which originated
from the same hairpin miR-precursors. The miRNA labeled with “*”
represented a lower expression of miRNA when the miRNA* and miRNA
were detected in the same cell line (Table II and III). Each miRNA gene was in the microarray
in triplicate. The data were analyzed using Significance Analysis
of Microarrays software (version 3.02) (14).
| Table II.miRNAs upregulated in the highly
invasive and metastatic cells (PC-1.0) compared with the weakly
invasive and metastatic cells (PC-1). |
Table II.
miRNAs upregulated in the highly
invasive and metastatic cells (PC-1.0) compared with the weakly
invasive and metastatic cells (PC-1).
| miRNA | Score (d) | q-value (%) |
|---|
| hsa-miR-181a | 20.95824611 | 0 |
| hsa-miR-486-3p | 5.0196028 | 0 |
| hsa-miR-31* | 13.35982897 | 0 |
| hsa-miR-181b | 12.89899491 | 0 |
| hsa-miR-31 | 23.80535775 | 0 |
| mmu-miR-193b | 39.5763408 | 0 |
|
PREDICTED_miR229 | 9.955537815 | 0 |
|
hsa-miR-193a-3p | 22.46659934 | 0 |
| hsa-miR-487b | 7.75232753 | 0 |
| hsa-miR-193b | 11.55311539 | 0 |
| hsa-miR-34a | 9.876005705 | 0 |
| hsa-miR-1538 | 5.385994942 | 0 |
|
PREDICTED_miR145 | 4.44252184 | 0 |
| hsa-miR-708 | 23.71513905 | 0 |
| hsa-miR-146a | 8.050169358 | 0 |
| hsa-miR-128 | 5.398905767 | 0 |
| hsa-miR-1273 | 6.631137944 | 0 |
| hsa-miR-205 | 10.03459558 | 0 |
| hsa-miR-141 | 5.271252768 | 0 |
| hsa-miR-629* | 10.52079077 | 0 |
| hsa-miR-410 | 9.782045622 | 0 |
| hsa-miR-200a | 29.2232436 | 0 |
| rno-miR-25* | 9.273404082 | 0 |
| hsa-miR-1308 | 8.86116404 | 0 |
| hsa-let-7i* | 20.19289615 | 0 |
| hsa-miR-615-5p | 5.219655733 | 0 |
| hsa-miR-125b | 11.47936434 | 0 |
| hsa-miR-29b | 24.23706017 | 0 |
| hsa-miR-101 | 9.76085076 | 0 |
| hsa-miR-27a | 11.34655117 | 0 |
| mmu-miR-433* | 7.455889793 | 0 |
| hsa-miR-181c | 9.99770499 | 0 |
| hsa-let-7i | 18.34707892 | 0 |
| Table III.miRNAs downregulated in highly
invasive and metastatic cells (PC-1.0) compared with weakly
invasive and metastatic cells (PC-1). |
Table III.
miRNAs downregulated in highly
invasive and metastatic cells (PC-1.0) compared with weakly
invasive and metastatic cells (PC-1).
| miRNA | Score (d) | q-value (%) |
|---|
| hsa-miR-324-3p | −7.617631275 | 0 |
| hsa-let-7d | −12.61068994 | 0 |
| hsa-miR-7 | −10.69123677 | 0 |
| mmu-miR-324-3p | −4.965056712 | 0 |
| hsa-let-7c | −8.811013746 | 0 |
| hsa-let-7a | −13.24229019 | 0 |
| hsa-miR-320b | −10.34928534 | 0 |
| rno-miR-204* | −6.090373954 | 0 |
| hsa-miR-107 | −5.951571765 | 0 |
| hsa-miR-500* | −5.384135129 | 0 |
| hsa-miR-378 | −19.88076516 | 0 |
| hsa-miR-30c | −21.64210903 | 0 |
| hsa-miR-378* | −6.871730972 | 0 |
| hsa-miR-186 | −5.551907546 | 0 |
| hsa-miR-221 | −28.19576008 | 0 |
| hsa-miR-484 | −13.78058027 | 0 |
| hsa-miR-502-3p | −11.19826264 | 0 |
| mmu-miR-298 | −8.830289897 | 0 |
| mmu-miR-500 | −4.229250653 | 0 |
| mmu-miR-706 | −22.3542206 | 0 |
| hsa-miR-222 | −40.14461092 | 0 |
Reverse transcription
quantitative-polymerase chain reaction (RT-qPCR)
The miRNAs were extracted using the
mirVana™ microRNA isolation kit (Ambion; Thermo Fisher
Scientific, Inc.). The miRNA levels were determined using the
TaqMan® MicroRNA Assay kit (Applied Biosystems; Thermo
Fisher Scientific, Inc.) according to the manufacturer's protocol.
The cDNA was amplified using mature miRNA-specific RT primers and
TaqMan® MiRNA Reverse Transcription kit (Applied
Biosystems; Thermo Fisher Scientific, Inc.) following the
manufacturer's protocol.
qPCR was performed on an ABI 7500 Real-Time PCR
system using TaqMan 2X Universal PCR Master Mix II and the 20X
Small RNA Assay (Applied Biosystems; Thermo Fisher Scientific,
Inc.) with a total volume of 20 µl. The amplification reactions
were performed in triplicate in a 96-well plate using the following
cycle: 10 min at 95°C, followed by 40 cycles of 15 sec at 95°C and
1 min at 60°C. The Cq values were calculated using the ABI Sequence
Detection System software version 2.1. The noncoding small nuclear
RNA U6 primer (Applied Biosystems; Thermo Fisher Scientific, Inc.)
was used as the endogenous control. The relative fold change for
each miRNA was calculated using the comparative Cq
(2−ΔΔCq) method (15). The
primer sequences are listed in Table
IV.
| Table IV.Sequences used in reverse
transcription-quantitative polymerase chain reaction. |
Table IV.
Sequences used in reverse
transcription-quantitative polymerase chain reaction.
| miRNA | Probe sequence
(5′-3′) |
|---|
| hsa-miR-31 |
CAGCTATGCCAGCATCTTGCCT |
| hsa-miR-34a |
AACAACCAGCTAAGACACTGCCA |
| hsa-miR-181a |
ACTCACCGACAGCGTTGAATGTT |
| hsa-miR-181b |
CCCACCGACAGCAATGAATGTT |
|
hsa-miR-193a-3p |
CTGGGACTTTGTAGGCCAGTT |
| mmu-miR-193b |
AGCGGGACTTTGTGGGCCAGTT |
| hsa-miR-221 |
GAAACCCAGCAGACAATGTAGCT |
| hsa-miR-222 |
ACCCAGTAGCCAGATGTAGCT |
| hsa-miR-502-3p |
TGAATCCTTGCCCAGGTGCATT |
| hsa-miR-484 |
ATCGGGAGGGGACTGAGCCTGA |
| U6 |
GTGCTCGCTTCGGCAGCACATATACTAAAATTGGAACGATACAGAGAAGATTAGCATGGCCCCTGCGCAAGGATGACACGCAAATTCGTGAAGCGTTCCATATTTT |
Prediction of the target genes of the
miRNAs
The target genes of the miRNAs were predicted using
miRWalk database v2.0 which integrated several softwares, including
DIANAmT (http://diana.pcbi.upenn.edu/cgi-bin/micro_t.cgi/),
miRanda (http://www.microrna.org/microrna/home.do), miRDB
(http://mirdb.org/miRDB/), miRWalk (http://www.umm.uni-heidelberg.de/apps/zmf/mirwalk/),
RNAhydrid (http://bibiserv.techfak.uni-bielefeld.de/rnahydrid/),
PICTAR (http://pictar.mdc-berlin.de/), PITA
(http://genie.weizmann.ac.il/pubs/mir07/mir07_prediction.html),
RNA22 (http://cbcsrv.watson.ibm.com/rna22_targets.html), and
Targetscan (http://www.targetscan.org). The
target genes were designated as predicted downstream mRNAs by >6
softwares. Cytoscape software (version 3.0.0; www.cytoscape.org) was used to illustrate the
relationships between miRNAs and predicted downstream genes
(16).
GO analysis
GO analysis was performed to determine the main
functions of the putative target genes of the differentially
expressed miRNAs using the GO database (http://www.geneontology.org/). The analysis was
carried out using the Database for Annotation, Visualization, and
Integrated Discovery (DAVID; http://david.abcc.ncifcrf.gov/) with a Q-value
statistical test for identifying significantly enriched terms; a
final output of P≤0.05 was considered to indicate a statistically
significant difference.
Pathway analysis
The putative target genes were analyzed using the
KEGG pathway database (17) using
DAVID software. Q≤0.05 was considered to represent a statistically
significant difference. Cytoscape was used to illustrate the
relationship between the miRNAs and KEGG terms.
Statistical analysis
The RT-qPCR data were assessed using an unpaired
t-test in SPSS software version 13.0 (SPSS, Inc., Chicago, IL,
USA). P<0.05 was considered to indicate a significant
difference. The Benjamini-Hochberg method was used to adjust the
P-values from the GO and KEGG enrichment analyses.
Results
Differentially expressed miRNAs
identified by miRNA microarray between PC-1.0 and PC-1 cells
Of the 1,965 mature miRNAs analyzed in the
microarray experiments, 54 were determined to be differentially
expressed. Of these, 33 (61.1%) were upregulated in the highly
invasive and metastatic cells (PC-1.0) compared with the weakly
invasive and metastatic cells (PC-1; Table II), whereas 21 (38.9%) were
significantly downregulated (Table
III).
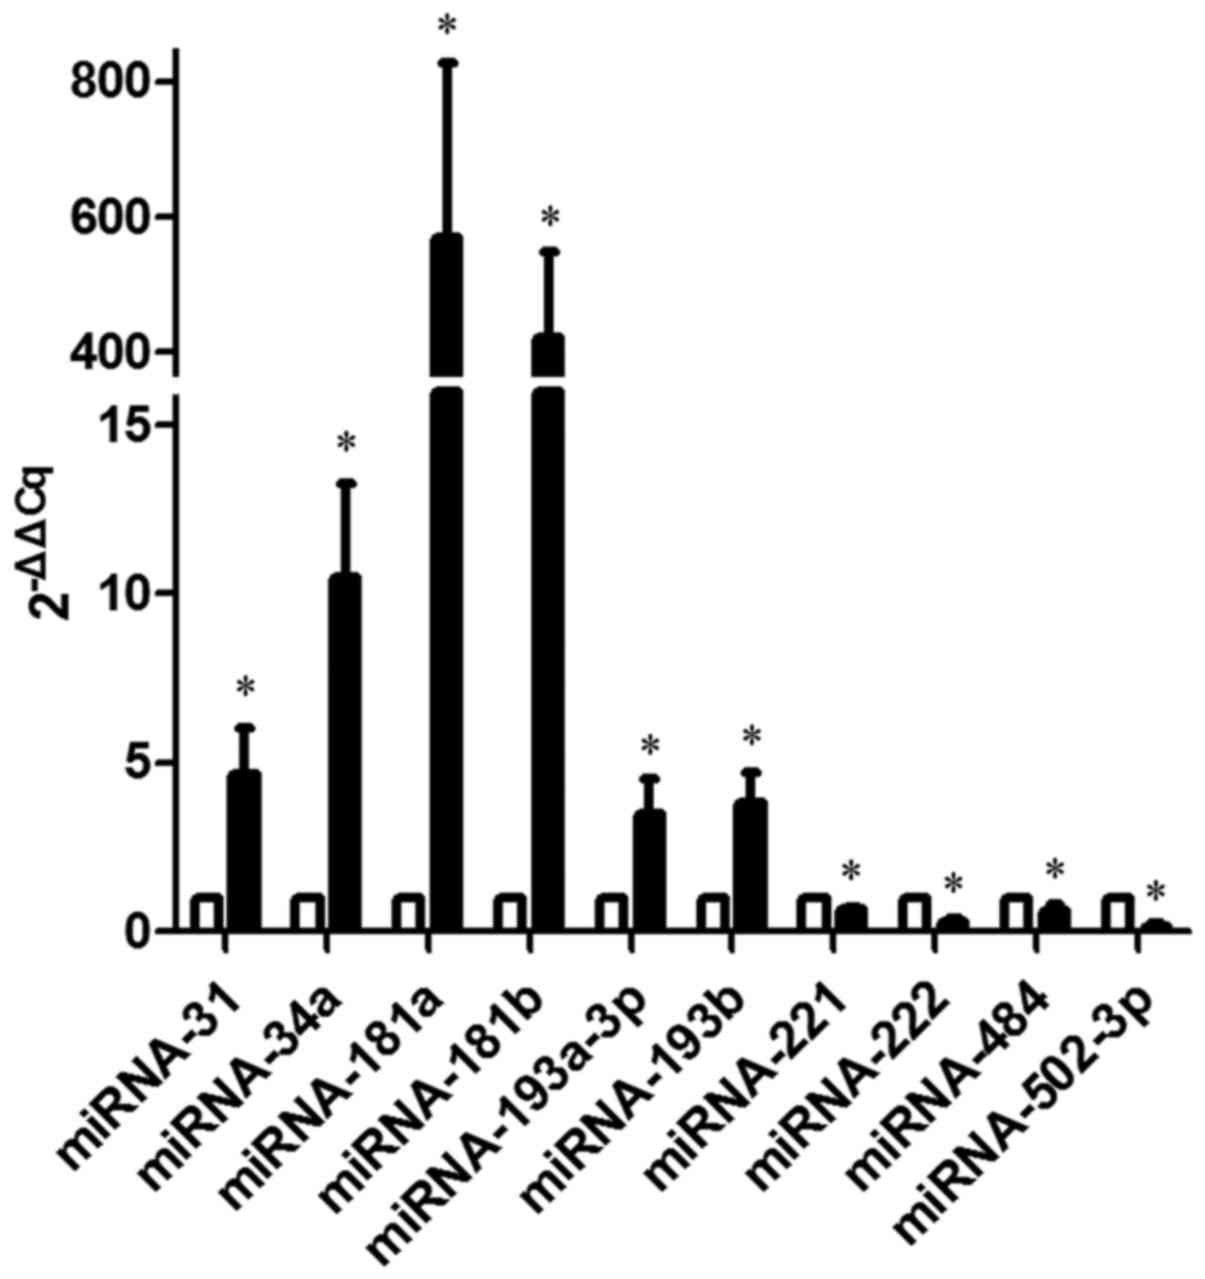
Validation of miRNA expression in the
PC-1.0 and PC-1 hamster pancreatic cancer cells using RT-qPCR
To determine the reliability of the miRNA microarray
data, 6 up-regulated miRNAs (miR-31, −34a, −181a, −181b, −193a-3p
and −193b) and 4 down-regulated miRNAs (miR-221, −222, −484 and
−502-3p), which varied significantly between the PC-1.0 and PC-1
cell lines in the microarray, were selected to be verified by
RT-qPCR. The results were similar to those obtained using the miRNA
microarray data, supporting the reliability of the expression data
(Fig. 2).
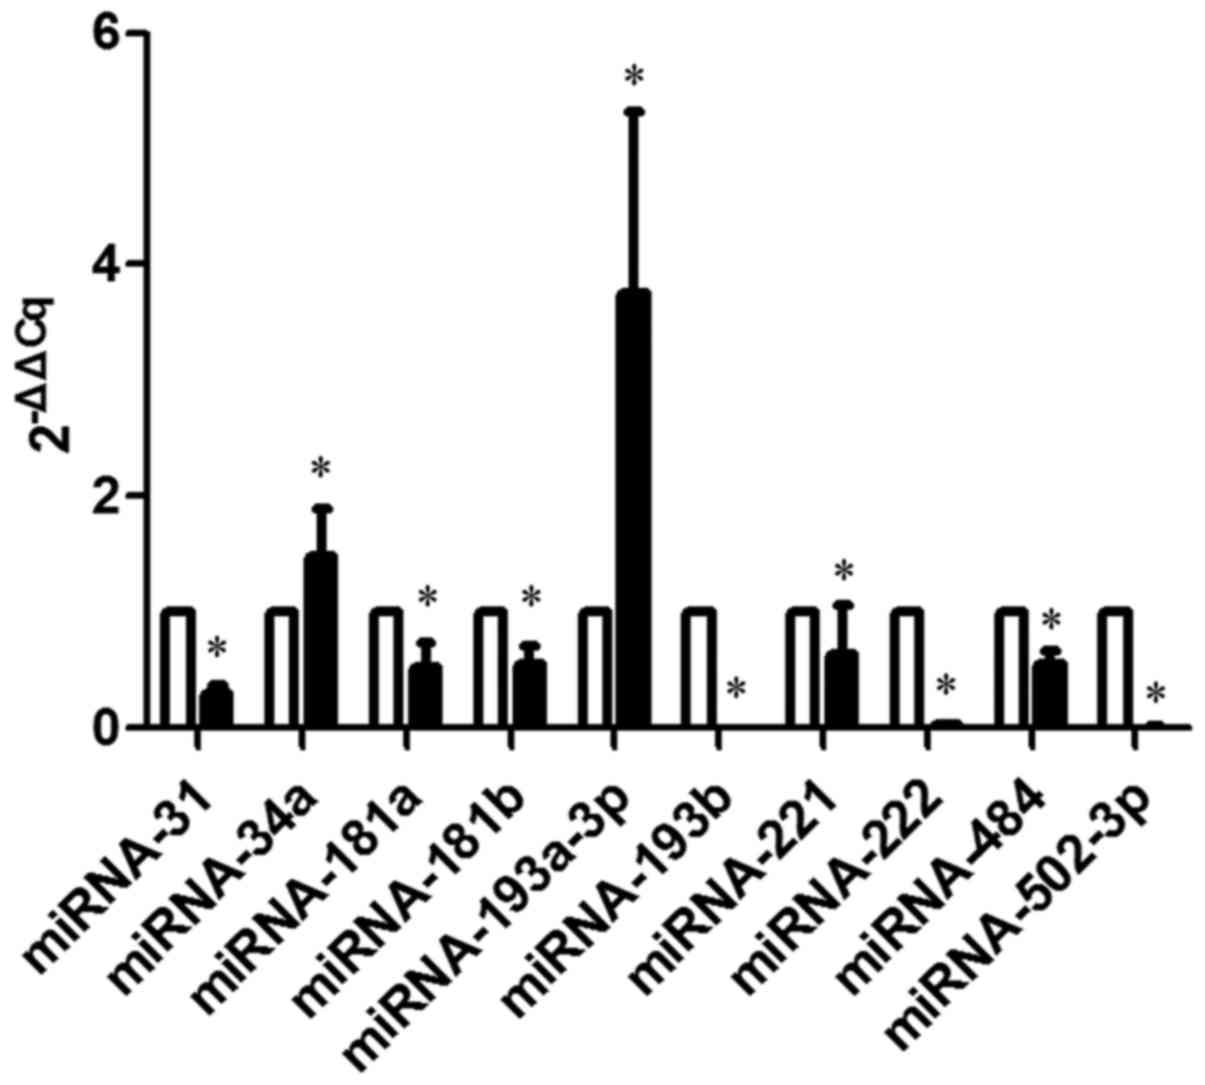
Validation miRNA expression in the
AsPC-1 and CAPAN-2 human pancreatic cancer cells using RT-qPCR
The results from the hamster pancreatic cancer cells
were different from those in human cancer cells. A total of 6 of
the 10 miRNAs had the same expression tendency in the PC-1.0/PC-1
and AsPC-1/CAPAN-2 pancreatic cancer cell lines, including miR-34a,
−193a (upregulated), −221, −222, −484 and −502-3p (downregulated;
Fig. 3).
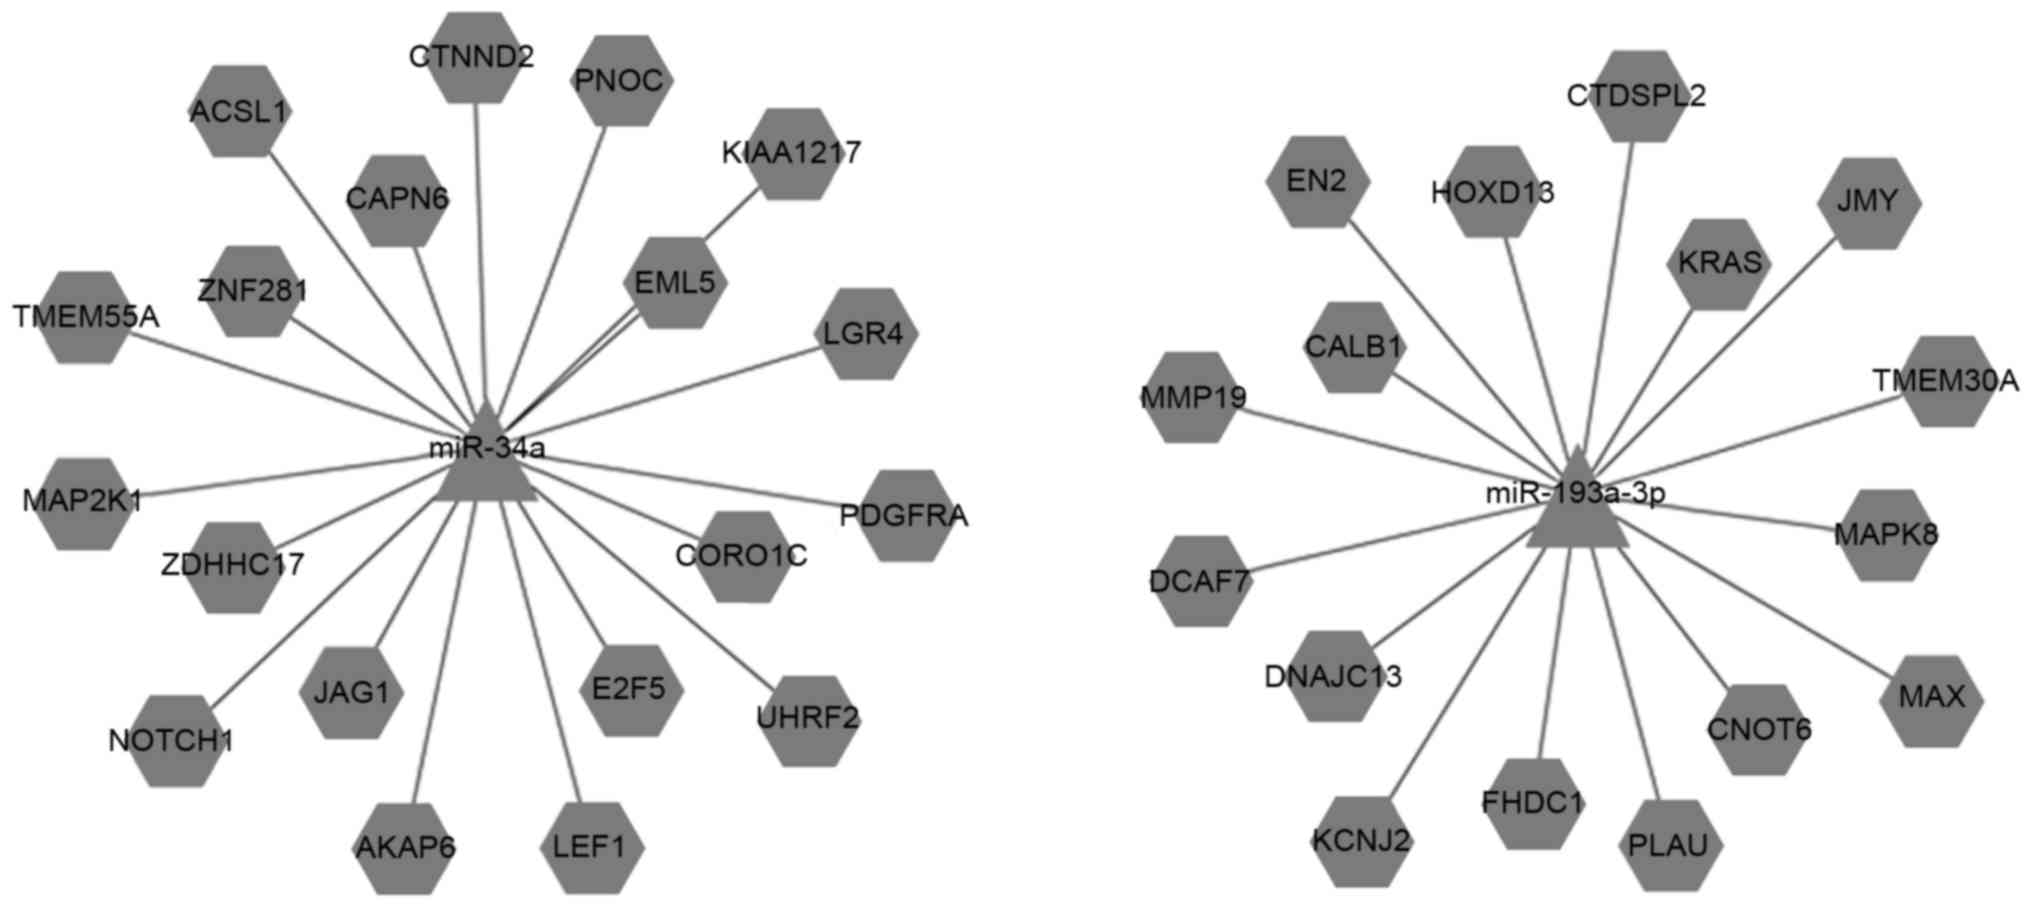
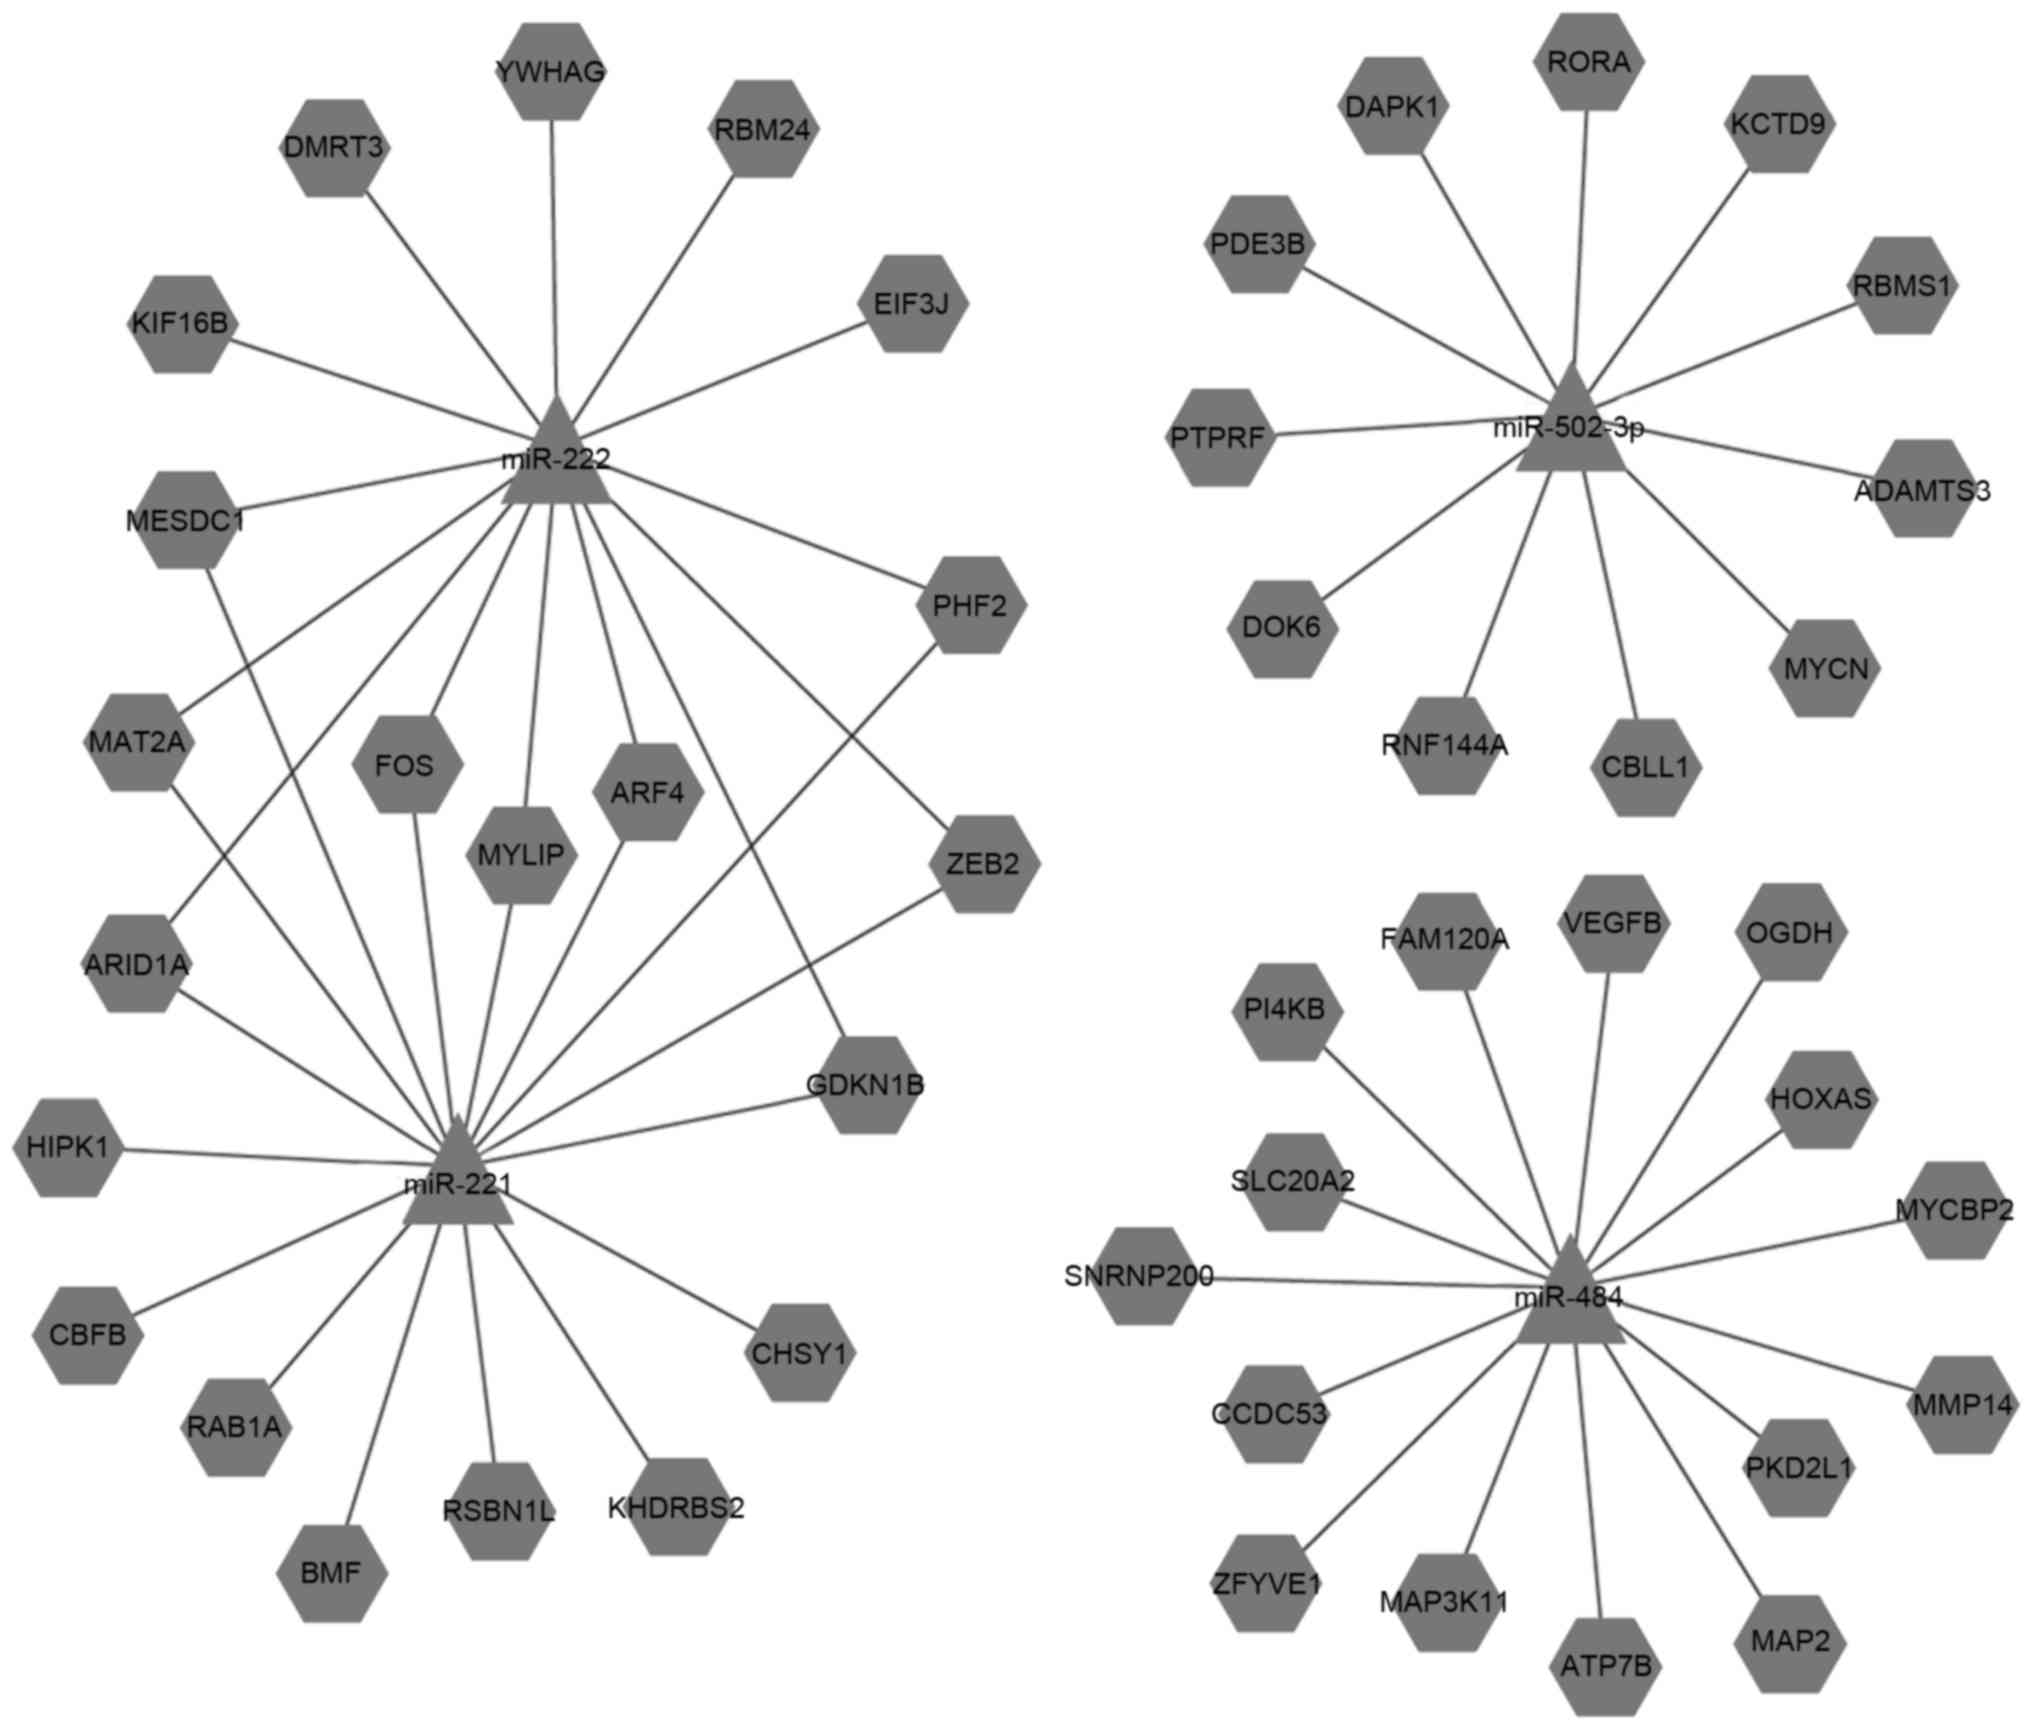
Prediction of the target genes of the
miRNAs
Various bioinformatic, experimental and combined
approaches have been used to identify putative target genes for
miRNAs; several databases that used these approaches applied in
this study. There were 8,279 intersected target genes for miR-34a,
5,206 intersected target genes for miR-193a-3p, 5,990 intersected
target genes for miR-221, 5,942 intersected target genes for
miR-222, 8,722 intersected target genes for miR-484 and 4,582
intersected target genes for miR-502-3p. Selected important target
genes (including upregulated and downregulated) are listed in
Tables V and VI. Cytoscape software was used to
illustrate the connections between the miRNAs and target genes
(Figs. 4 and 5).
| Table V.Predicted target genes of upregulated
miRNAs. |
Table V.
Predicted target genes of upregulated
miRNAs.
| miRNA | Target gene | Representative
transcript | Gene name |
|---|
| miR-34a | NAV3 | NM_014903 | Neuron navigator
3 |
|
| ACSL1 | NM_001286711 | Acyl-CoA synthetase
long-chain family member 1 |
|
| AKAP6 | NM_004274 | A kinase (PRKA)
anchor protein 6 |
|
| CAPN6 | NM_014289 | Calpain 6 |
|
| CORO1C | NM_014325 | Coronin, actin
binding protein, 1C |
|
| CTNND2 | NM_001288717 | Catenin
(cadherin-associated protein), delta 2 |
|
| E2F5 | NM_001951 | E2F transcription
factor 5, p130-binding |
|
| EML5 | NM_183387 | Echinoderm
microtubule associated protein like 5 |
|
| JAG1 | NM_000214 | Jagged 1 |
|
| KIAA1217 | NM_001098500 | KIAA1217 |
|
| LEF1 | NM_001130714 | Lymphoid
enhancer-binding factor 1 |
|
| LGR4 | NM_018490 | Leucine-rich repeat
containing G protein-coupled receptor 4 |
|
| MAP2K1 | NM_002755 | Mitogen-activated
protein kinase kinase 1 |
|
| NOTCH1 | NM_017617 | Notch 1 |
|
| PDGFRA | NM_006206 | Platelet-derived
growth factor receptor, alpha polypeptide |
|
| PNOC | NM_006228 |
Prepronociceptin |
|
| TMEM55A | NM_018710 | Transmembrane
protein 55A |
|
| UHRF2 | NM_152896 | Ubiquitin-like with
PHD and ring finger domains 2, E3 ubiquitin protein ligase |
|
| ZDHHC17 | NM_015336 | Zinc finger,
DHHC-type containing 17 |
|
| ZNF281 | NM_012482 | Zinc finger protein
281 |
| miR-193a-3p | DCAF7 | NM_001003725 | DDB1 and CUL4
associated factor 7 |
|
| TMEM30A | NM_001143958 | Transmembrane
protein 30A |
|
| KCNJ2 | NM_000891 | Potassium channel,
inwardly rectifying subfamily J, member 2 |
|
| HOXD13 | NM_000523 | Homeobox D13 |
|
| FHDC1 | NM_033393 | FH2 domain
containing 1 |
|
| EN2 | NM_001427 | Engrailed homeobox
2 |
|
| DNAJC13 | NM_015268 | DnaJ (Hsp40)
homolog, subfamily C, member 13 |
|
| CTDSPL2 | NM_016396 | CTD
(carboxy-terminal domain, RNA polymerase II, polypeptide A) small
phosphatase like 2 |
|
| CNOT6 | NM_015455 | CCR4-NOT
transcription complex, subunit 6 |
|
| CALB1 | NM_001740 | Calbindin 1, 28
kDa |
|
| KRAS | NM_004985 | v-Ki-ras2 Kirsten
rat sarcoma viral oncogene homolog |
|
| PLAU | NM_001145031 | Plasminogen
activator, urokinase |
|
| MMP19 | NM_002429 | Matrix
metallopeptidase 19 |
|
| JMY | NM_152405 | Junction mediating
and regulatory protein, p53 cofactor |
|
| MAPK8 | NM_001278547 | Mitogen-activated
protein kinase 8 |
|
| MAX | NM_002382 | MYC associated
factor X |
| Table VI.Predicted target genes of
downregulated miRNAs. |
Table VI.
Predicted target genes of
downregulated miRNAs.
| miRNA | Target gene | Representative
transcript | Gene name |
|---|
| miR-221 | KHDRBS2 | NM_152688 | KH domain
containing, RNA binding, signal transduction associated 2 |
|
| FOS | NM_005252 | FBJ murine
osteosarcoma viral oncogene homolog |
|
| ARID1A | NM_006015 | AT rich interactive
domain 1A (SWI-like) |
|
| BMF | NM_001003943 | Bcl2 modifying
factor |
|
| HIPK1 | NM_181358 | Homeodomain
interacting protein kinase 1 |
|
| MESDC1 | NM_022566 | Mesoderm
development candidate 1 |
|
| MAT2A | NM_005911 | Methionine
adenosyltransferase II, alpha |
|
| ZEB2 | NM_001171653 | Zinc finger E-box
binding homeobox 2 |
|
| MYLIP | NM_013262 | Myosin regulatory
light chain interacting protein |
|
| PHF2 | NM_005392 | PHD finger protein
2 |
|
| RSBN1L | NM_198467 | Round spermatid
basic protein 1-like |
|
| ARF4 | NM_001660 | ADP-ribosylation
factor 4 |
|
| CBFB | NM_001755 | Core-binding
factor, beta subunit |
|
| CDKN1B | NM_004064 | Cyclin-dependent
kinase inhibitor 1B (p27, Kip1) |
|
| CHSY1 | NM_014918 | Chondroitin sulfate
synthase 1 |
|
| RAB1A | NM_004161 | RAB1A, member RAS
oncogene family |
| miR-222 | ARF4 | NM_001660 | ADP-ribosylation
factor 4 |
|
| ARID1A | NM_006015 | AT rich interactive
domain 1A (SWI-like) |
|
| CDKN1B | NM_004064 | Cyclin-dependent
kinase inhibitor 1B (p27, Kip1) |
|
| DMRT3 | NM_021240 | Doublesex and mab-3
related transcription factor 3 |
|
| EIF3J | NM_001284335 | Eukaryotic
translation initiation factor 3, subunit J |
|
| FOS | NM_005252 | FBJ murine
osteosarcoma viral oncogene homolog |
|
| KIF16B | NM_001199865 | Kinesin family
member 16B |
|
| MAT2A | NM_005911 | Methionine
adenosyltransferase II, alpha |
|
| MESDC1 | NM_022566 | Mesoderm
development candidate 1 |
|
| MYLIP | NM_013262 | Myosin regulatory
light chain interacting protein |
|
| PHF2 | NM_005392 | PHD finger protein
2 |
|
| RBM24 | NM_001143941 | RNA binding motif
protein 24 |
|
| YWHAG | NM_012479 | Tyrosine
3-monooxygenase/tryptophan 5-monooxygenase activation protein,
gamma |
|
| ZEB2 | NM_001171653 | Zinc finger E-box
binding homeobox 2 |
| miR-484 | SNRNP200 | NM_014014 | Small nuclear
ribonucleoprotein 200 kDa (U5) |
|
| CCDC53 | NM_001301107 | Coiled-coil domain
containing 53 |
|
| FAM120A | NM_001286722 | Family with
sequence similarity 120A |
|
| HOXA5 | NM_019102 | Homeobox A5 |
|
| MAP2 | NM_002374 |
Microtubule-associated protein 2 |
|
| OGDH | NM_002541 | Oxoglutarate
(alpha-ketoglutarate) dehydrogenase (lipoamide) |
|
| PKD2L1 | NM_016112 | Polycystic kidney
disease 2-like 1 |
|
| SLC20A2 | NM_006749 | Solute carrier
family 20 (phosphate transporter), member 2 |
|
| VEGFB | NM_003377 | Vascular
endothelial growth factor B |
|
| ZFYVE1 | NM_021260 | Zinc finger, FYVE
domain containing 1 |
|
| MAP3K11 | NM_002419 | Mitogen-activated
protein kinase kinase kinase 11 |
|
| PI4KB | NM_001198773 |
Phosphatidylinositol 4-kinase, catalytic,
beta |
|
| ATP7B | NM_000053 | ATPase, Cu++
transporting, beta polypeptide |
|
| MYCBP2 | NM_015057 | MYC binding protein
2 |
|
| MMP14 | NM_004995 | Matrix
metallopeptidase 14 (membrane-inserted) |
| miR-502-3p | KCTD9 | NM_017634 | Potassium channel
tetramerisation domain containing 9 |
|
| RNF144A | NM_014746 | Ring finger protein
144A |
|
| DOK6 | NM_152721 | Docking protein
6 |
|
| PTPRF | NM_002840 | Protein tyrosine
phosphatase, receptor type, F |
|
| PDE3B | NM_000922 | Phosphodiesterase
3B, cGMP-inhibited |
|
| RORA | NM_002943 | RAR-related orphan
receptor A |
|
| MYCN | NM_005378 | V-myc avian
myelocytomatosis viral oncogene neuroblastoma derived homolog |
|
| DAPK1 | NM_004938 | Death-associated
protein kinase 1 |
|
| ADAMTS3 | NM_014243 | ADAM
metallopeptidase with thrombospondin type 1 motif, 3 |
|
| CBLL1 | NM_024814 | Cbl
proto-oncogene-like 1, E3 ubiquitin protein ligase |
|
| RBMS1 | NM_002897 | RNA binding motif,
single stranded interacting protein 1 |
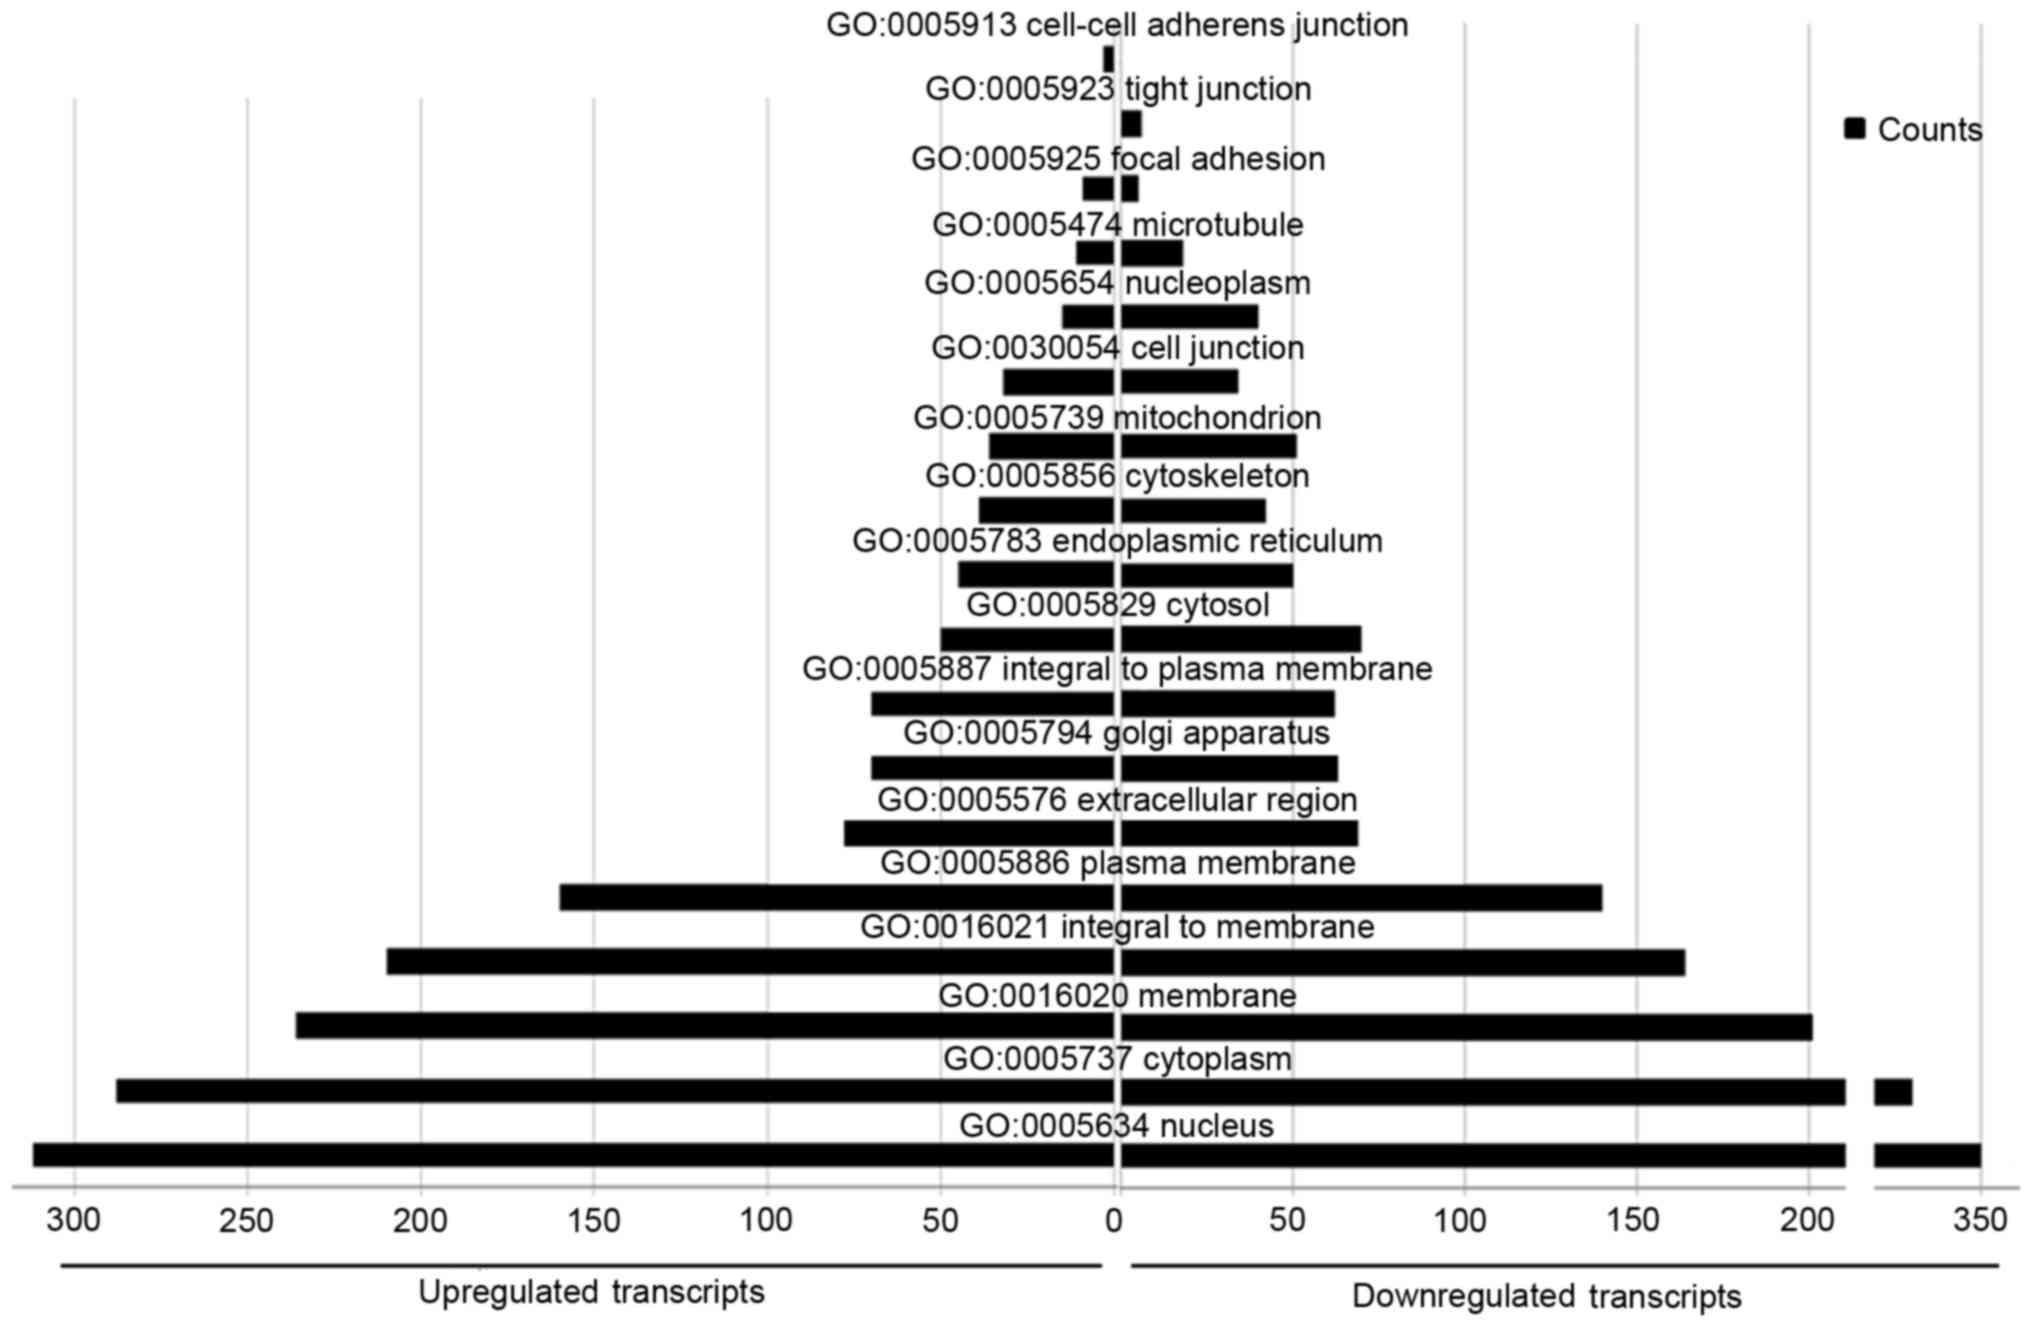
Gene ontology enrichment analysis
To understand the biological functions of the
differently expressed miRNAs in different cellular processes, a GO
enrichment analysis was performed using DAVID software, including
the cellular component, molecular function and biological process
categories. The upregulated and downregulated miRNAs were analyzed
separately.
A total of 254 cellular component terms were
enriched in the upregulated miRNAs and 273 in the downregulated
miRNAs. Several of the terms were common between upregulated and
downregulated miRNAs, including ‘nucleus’, ‘cytoplasm’, ‘membrane’,
‘extracellular region’, ‘Golgi apparatus’, ‘cytosol’, ‘endoplasmic
reticulum’, ‘cytoskeleton’, ‘cell junction’, and ‘mitochondria’.
‘Nucleoplasm’ and ‘microtubules’ were more enriched in the
upregulated miRNAs than the downregulated miRNAs. ‘Cell-cell
adherens junctions’ was particularly associated with the
upregulated miRNAs, whereas ‘tight junctions’ was associated with
the downregulated miRNAs (Fig.
6).
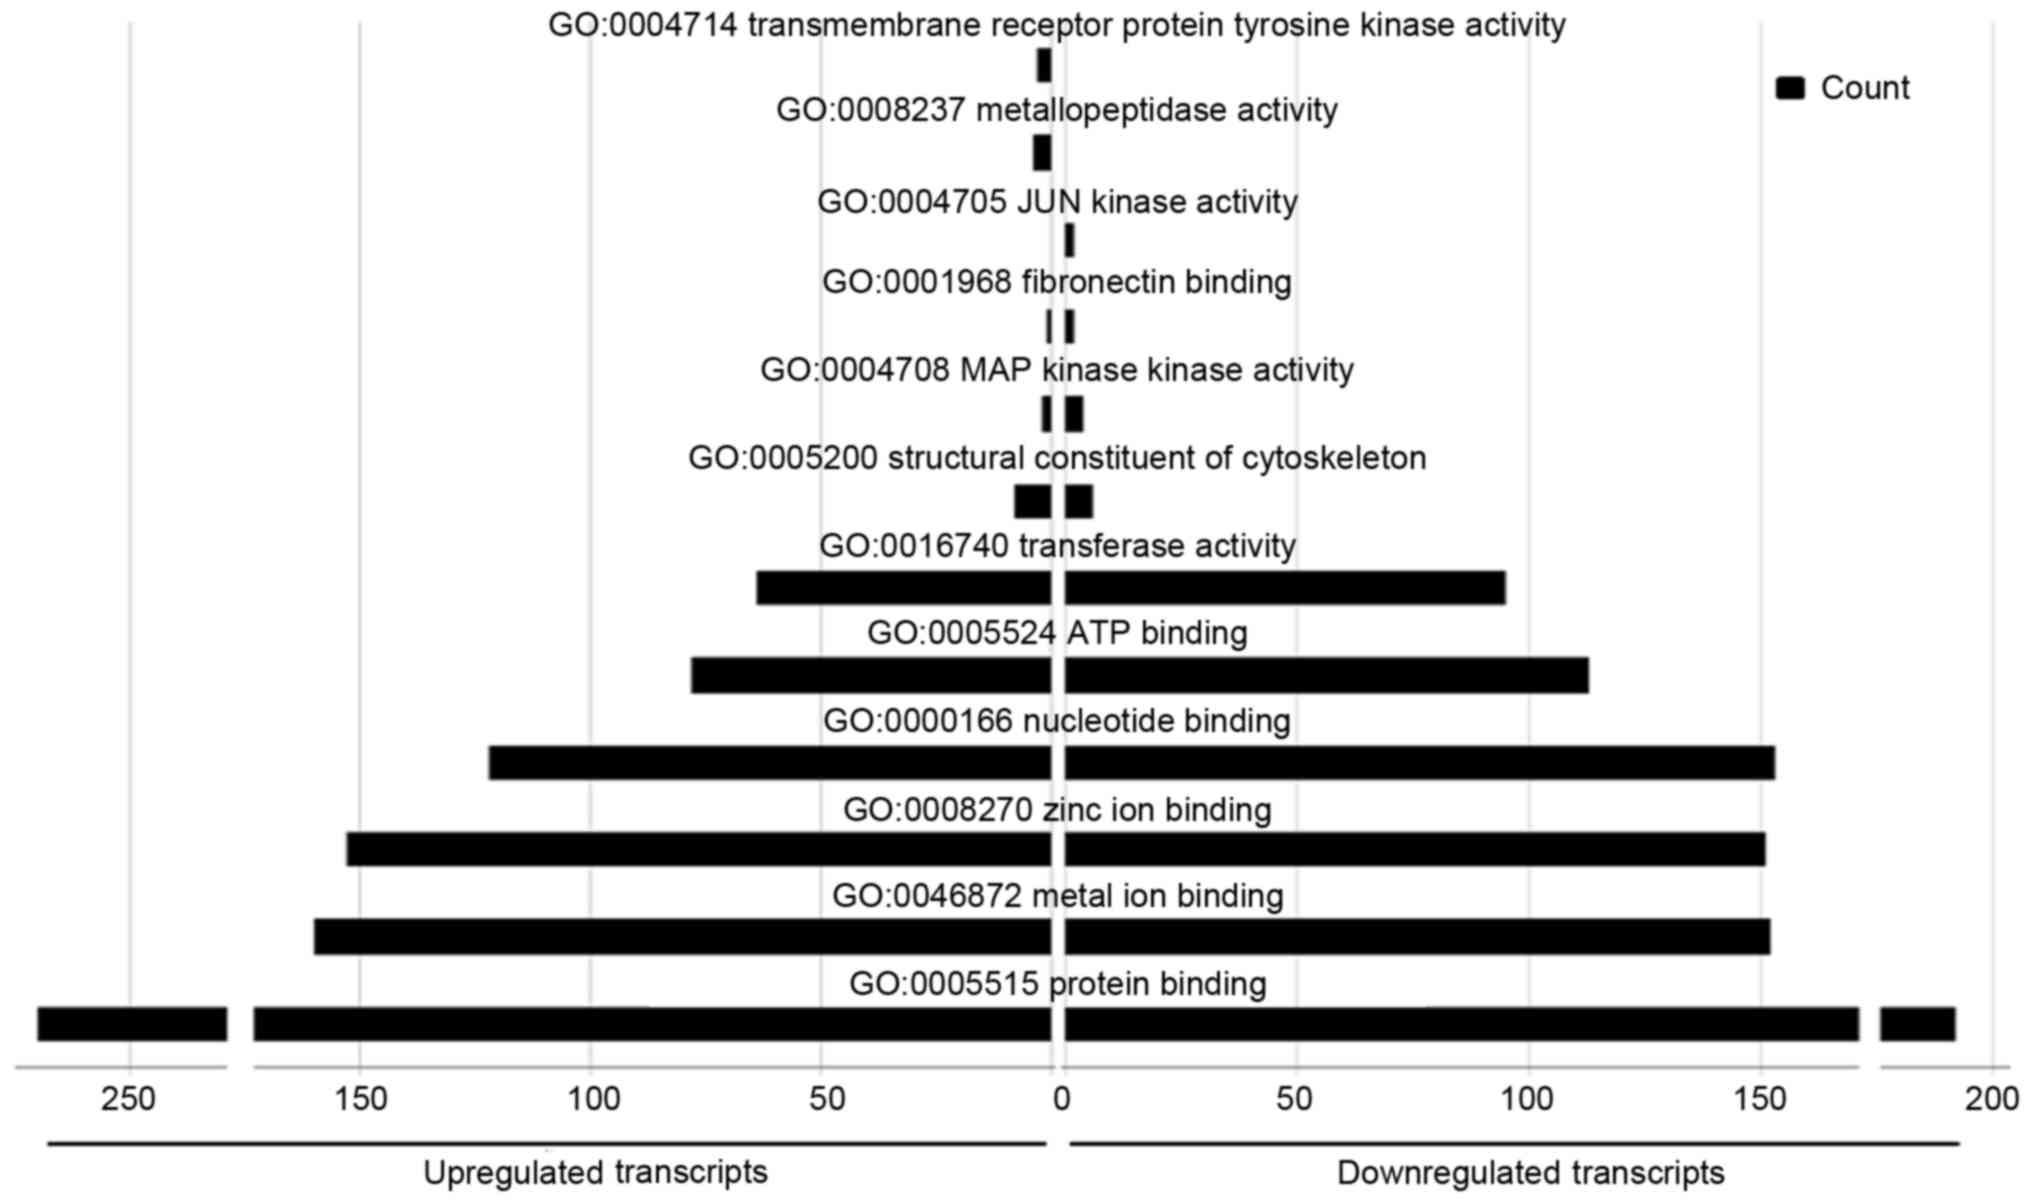
A total of 528 GO molecular function terms were
enriched in the upregulated miRNAs, and 583 in the downregulated
miRNAs. Several of the terms were common between sets, including
‘protein binding’, ‘metal ion binding’, ‘zinc ion binding’,
‘nucleotide binding’, ‘ATP binding’ and ‘transferase activity’.
Several functions were particularly enriched in the upregulated
miRNA set, including ‘structural constituents of the cytoskeleton’,
whereas ‘MAP kinase kinase activity’ and ‘fibronectin-binding
activity’ were more representative of the downregulated miRNAs.
‘Tyrosine kinase activity’ and ‘metallopeptidase activity in
transmembrane receptor proteins’ were particularly represented in
the upregulated miRNAs, and ‘JUN kinase activity’ was particularly
represented in the downregulated miRNAs (Fig. 7).
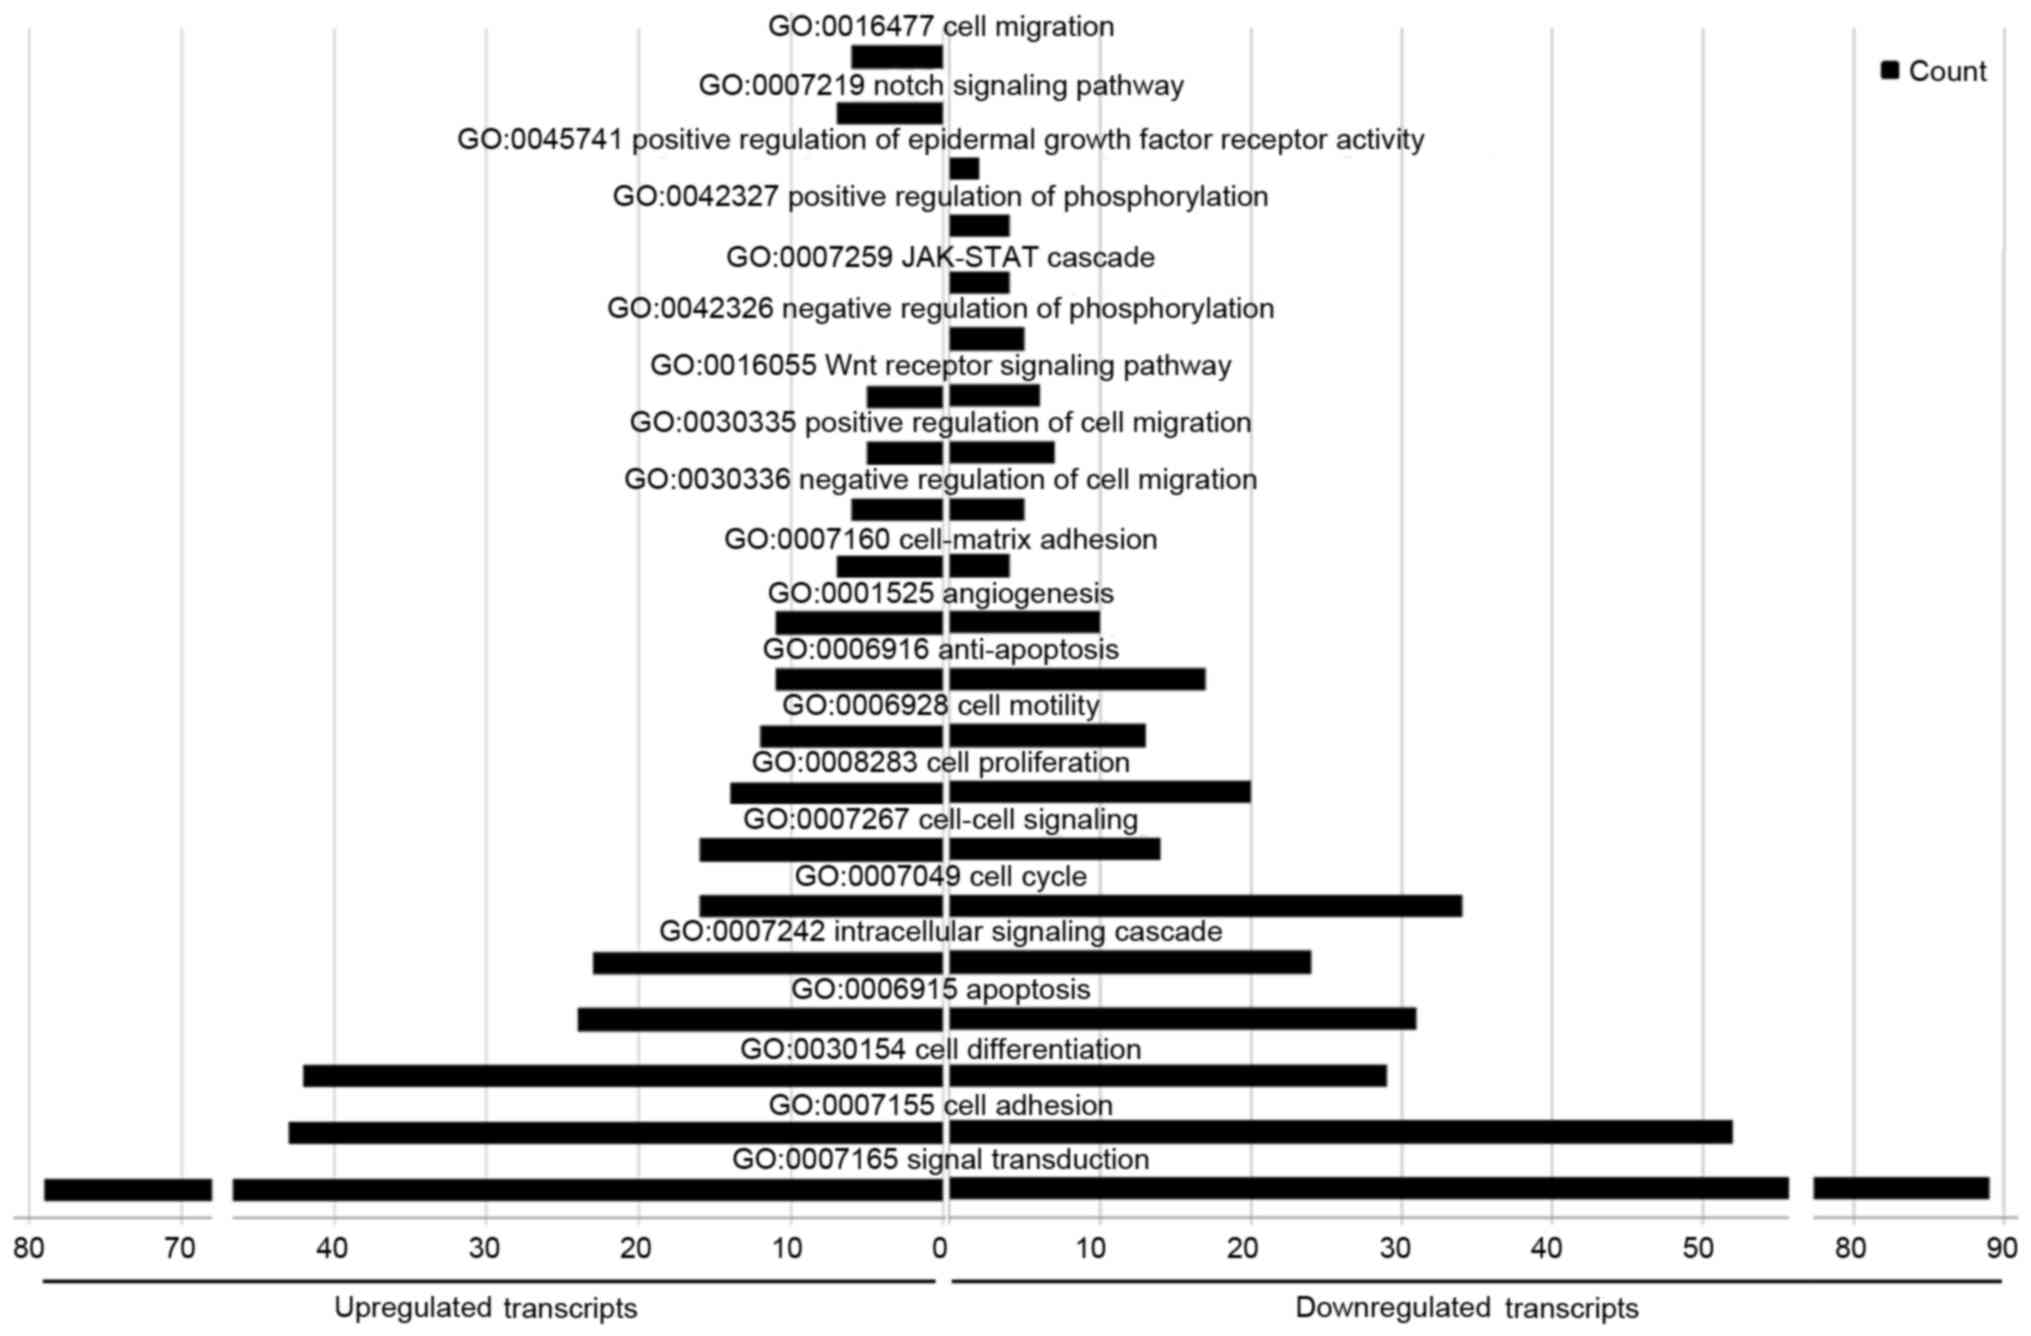
With regard to GO biological processes, 1,021 terms
were enriched in the upregulated miRNAs and 1,280 in the
downregulated miRNAs. As for the cellular component and molecular
function categories, several biological processes were in common
between the groups, including ‘signal transduction’, ‘cell
adhesion’, ‘apoptosis’, ‘cell proliferation’, ‘cell motility’,
‘anti-apoptosis’, ‘angiogenesis’, ‘positive regulation of cell
migration’ and ‘Wnt receptor signaling’. However, ‘cell-matrix
adhesion’, ‘cell-cell signaling’, and ‘cell differentiation’ were
more enriched in the up-regulated miRNAs than the downregulated
miRNAs, whereas ‘cell cycle processes’ was more enriched in the
downregulated miRNAs. In particular, ‘cell migration’ and ‘Notch
signaling pathways’ were only represented in the upregulated
miRNAs, whereas ‘positive regulation of epidermal growth factor
receptor activity’, ‘positive regulation of phosphorylation’,
‘JAK-STAT pathway’ and ‘negative regulation of phosphorylation’
were only represented in the downregulated miRNAs (Fig. 8).
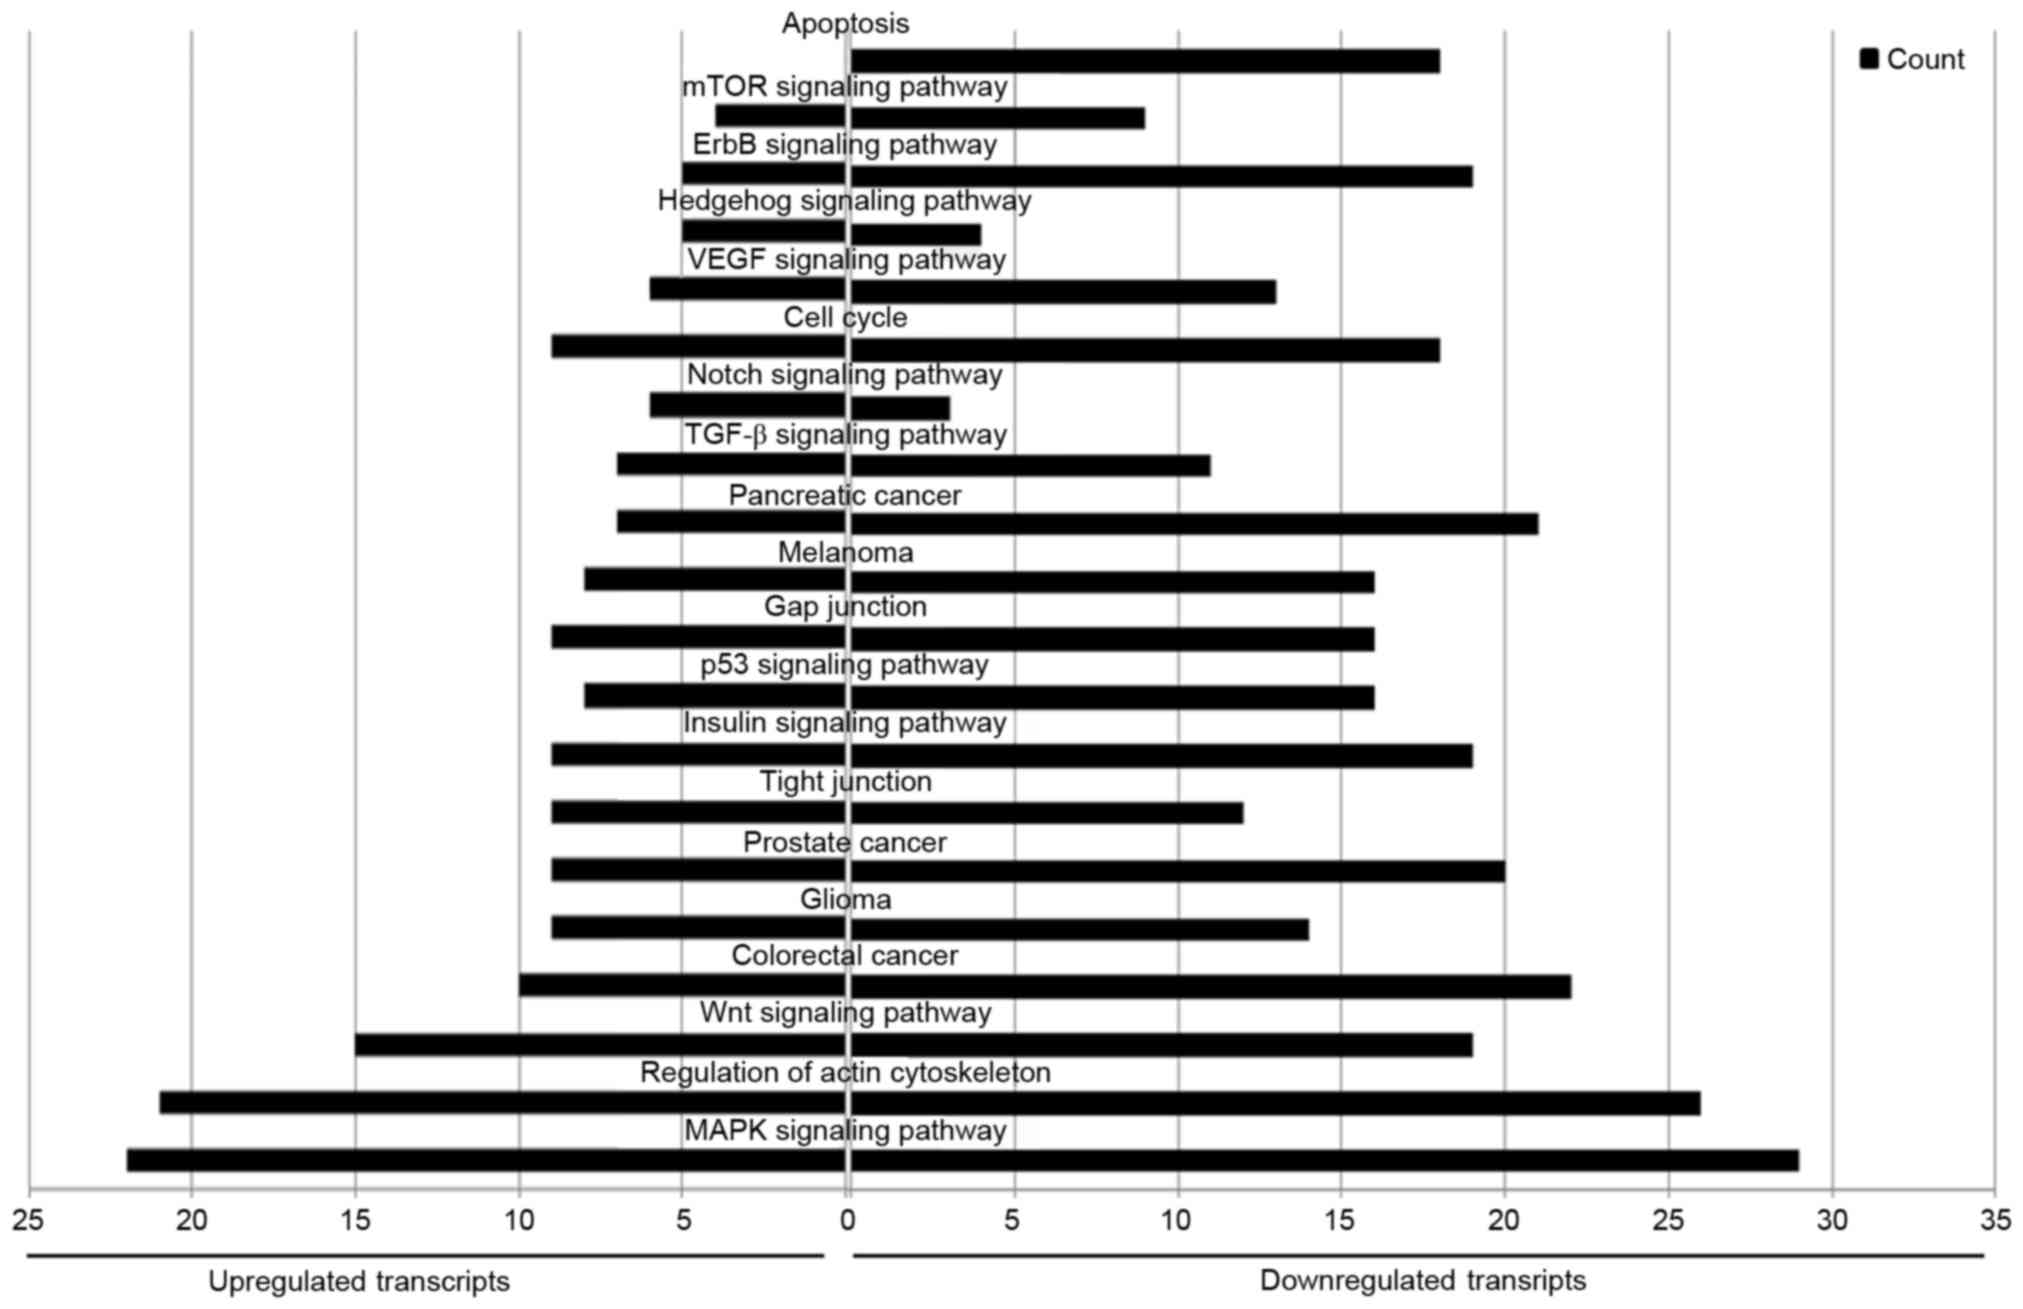
KEGG enrichment analysis
KEGG is a database of genetic and molecular
networks. A total of 91 pathways were associated with the
upregulated miRNAs, and 112 with the downregulated miRNAs. There
were 74 pathways in common between the upregulated and
downregulated miRNAs, including the ‘MAPK signaling pathway’,
‘regulation of actin cytoskeleton’, ‘Wnt signaling pathway’,
‘pancreatic cancer’, ‘colorectal cancer’, ‘tight junctions’, ‘p53
signaling pathway’, ‘gap junctions’, ‘TGF-beta signaling pathway’,
‘Notch signaling pathway’, ‘cell cycle’ and ‘mTOR signaling
pathway’. Furthermore, 16 pathways were associated with only the
upregulated miRNAs, and 36 with only the downregulated miRNAs.
‘Apoptosis pathway’ was particularly enriched in the downregulated
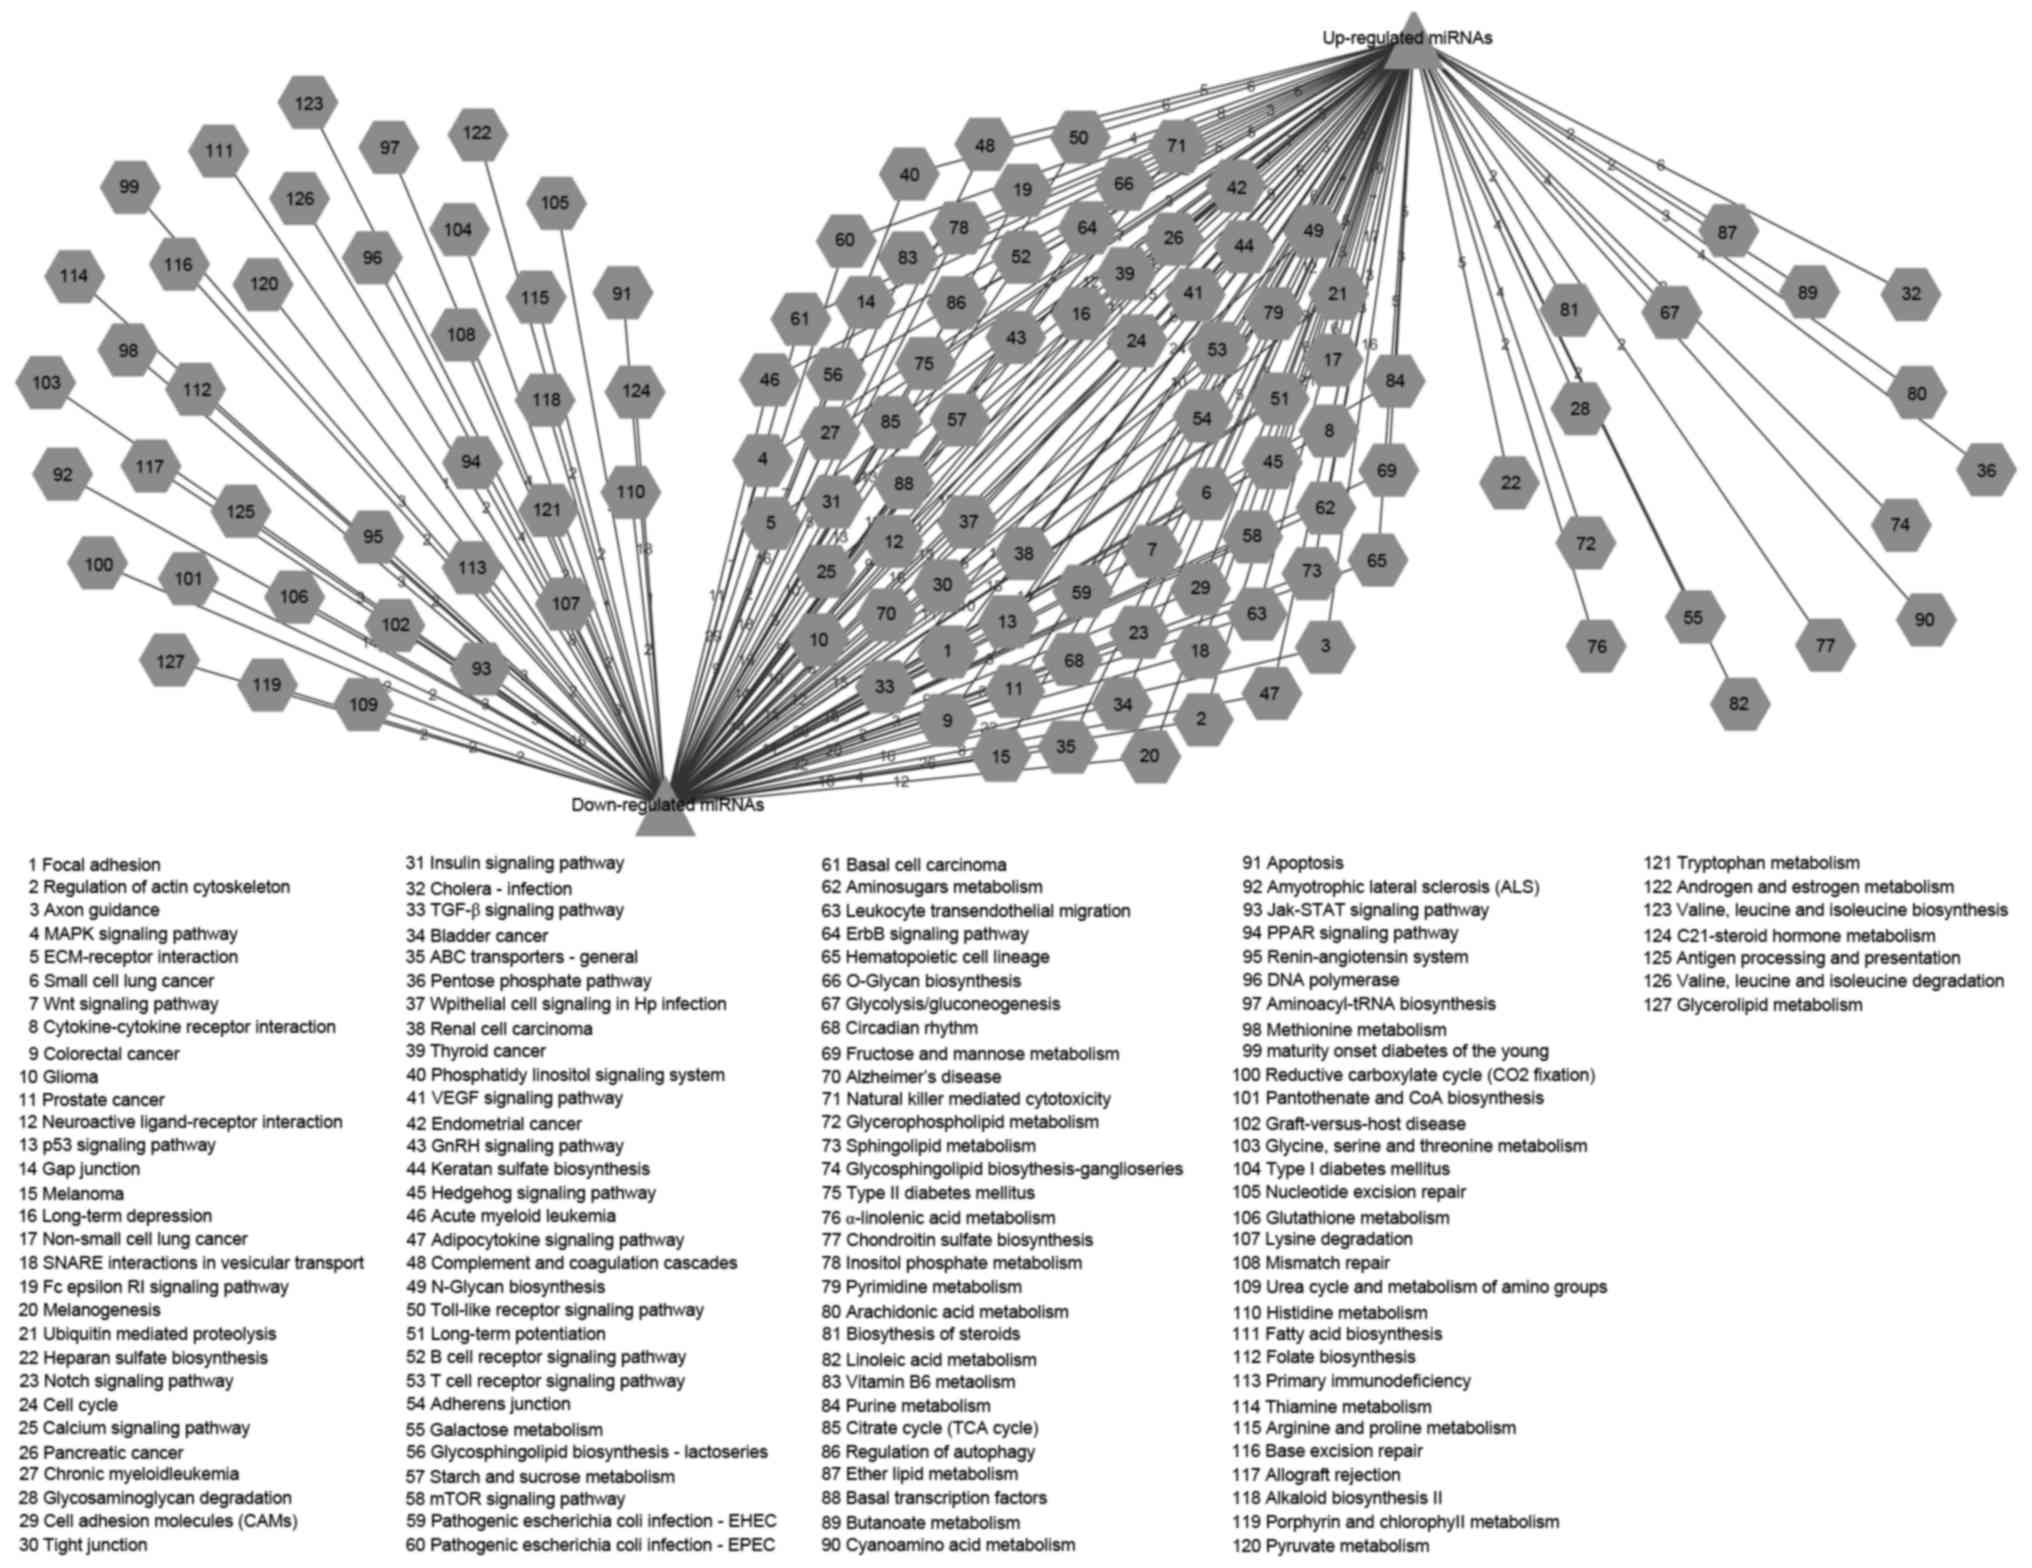
miRNAs (Fig. 9). Cytoscape was used
to illustrate the connections between the miRNAs and pathways
(Fig. 10).
Discussion
The highly (PC-1.0) and weakly (PC-1) invasive and
metastatic pancreatic cancer cell lines, which were established
from an experimental pancreatic cancer model a previous study by
Egami et al (9,10), exhibit clearly different potentials
for invasion and metastasis (11). To
further investigate the mechanisms of the invasion and metastasis
of pancreatic cancer in the present study, highly (AsPC-1) and
weakly (CAPAN-2) invasive and metastatic cell lines were selected,
as they possess similar biological characteristics to the
PC-1.0/PC-1 cell lines when compared with other human pancreatic
cancer cell lines such as CAPAN-1 or MiaPACA-2. Many factors have
been identified that are involved in the mechanisms of invasion and
metastasis in both hamster and human pancreatic cancer cell lines,
including the tight junction factors [claudin-1 (18), ZO-1 (19) and occludin (20)], MMP-7 (21,22) and
mitogen-activated protein kinase (MAPK) signaling pathway factors
[ERK1/2 (23), MEK2 (24) and EGFR (25)]. We hypothesize that the mechanisms and
key factors of PC-1.0/PC-1 cells are similarly expressed and serve
a vital role in human pancreatic cancer cells, with the same
biological functions.
The Syrian hamster has been verified as a unique
model for investigating pancreatic cancer by Pour et al
(26). Hamster and human genes have a
high similarity (27), which may
explain why the RT-qPCR results in human cells were similar to
those of the hamster cells. Since the hamster genome sequence was
not complete at the time of the study, the microarray chip in the
present study was designed as a mixed gene chip, including human,
rat and mouse genes. miRNAs with high similarity scores were
selected for use in the array experiments, with a focus on human
miRNAs, as the ultimate goal was to investigate the mechanisms in
humans. To verify the results, RT-qPCR was used to analyze the
hamster and human pancreatic cancer cells, with similar results
being identified. The PC-1.0 and PC-1 cells were more homologous
than the AsPC-1 and CAPAN-2 cell lines, hence why they were
selected for microarray analysis instead of the human cell lines.
The differentially expressed miRNAs obtained from the PC-1.0 and
PC-1 cell lines were validated by RT-qPCR using AsPC-1 and CAPAN-2.
It is hoped that the final results of this analysis will contribute
to developing novel approaches for clinical therapy.
A total of 2 upregulated miRNAs (miR-34a and
−193a-3p) and 4 downregulated miRNAs (miR-221, −222, −484, and
−502-3p) were selected and examined between the PC-1.0/PC-1 and
AsPC-1/CAPAN-2 cell lines in the present study. The results
indicated that miR-34a and −193a-3p may promote the progression of
invasion and metastasis in pancreatic cancer, whereas miR-221,
−222, −484 and −502-3p may prevent this. To date, several studies
have evaluated invasion and metastasis in pancreatic cancers
(28–31); however, only a few studies reported
data regarding the miRNAs identified in the present study. miR-34a
is a highly conserved miRNA that is known to be a downstream target
of p53, and a tumor suppressor (32).
Yang et al (33) observed that
miR-34a was significantly upregulated in uveal melanoma via a miRNA
microarray. Lee et al (34)
reported that miR-222 was upregulated in pancreatic cancer tissue
compared with adjacent normal tissue, and was associated with cell
proliferation. In addition, miR-221 was reported to be upregulated
in pancreatic cancer tissues, cell lines and pre-operative patient
blood plasma, and downregulated following surgery (35). This result was in contrast with the
present study. Therefore, more study will be required to evaluate
the potential of differentially expressed miRNAs as markers of
invasion and metastasis in pancreatic cancer.
The mechanisms associated with invasion and
metastasis in pancreatic cancer are complex and incompletely
elucidated. In the present study, GO term and KEGG pathway
enrichment analyses were used to investigate the differences in the
biological functions of highly and weakly invasive and metastatic
pancreatic cancer cell lines. The upregulated miRNAs were primarily
associated with ‘cell-cell adherens junctions’, ‘metallopeptidase
activity’, ‘cell migration’ and ‘Notch signaling pathway’, whereas
the downregulated miRNAs were associated primarily with ‘tight
junctions’, ‘JAK-STAT pathway’ and ‘apoptosis’. The overlap between
the up- and downregulated miRNAs may indicate the presence of
intricate cross-talk in the regulation of pancreatic cancer. ‘MAP
kinase kinase activity’, for example, was enriched in both up- and
downregulated miRNAs. In a previous study, Tan et al
(20) demonstrated that MMP-7 was
associated with cell dissociation, forming a positive feedback loop
with the activation of the epidermal growth factor
receptor-mediated MAPK signaling pathway. In the present study,
KEGG analysis indicated that ‘apoptosis’ was predominantly enriched
in the downregulated miRNAs. Therefore, we hypothesize that the
upregulated miRNAs miR-34a and −193a-3p may be primarily involved
in cell-cell adherens junctions, metallopeptidase activity and cell
migration, whereas the downregulated miRNAs miR-221, −222, −484 and
−502-3p may be primarily associated with tight junctions and
apoptosis in pancreatic cancer cell lines.
In conclusion, these results suggest that distinct
miRNA expression profiles occur between highly and weakly invasive
and metastatic pancreatic cancer cell lines. In addition,
differentially expressed miRNAs may be involved in a variety of
biological functions and mechanisms in pancreatic cancer. In this
context, the identification of invasive and metastatic-specific
miRNAs may allow the development of novel therapeutic and
diagnostic strategies to target invasion and metastasis in
pancreatic cancer.
Acknowledgements
Not applicable.
Funding
The present study was supported by a grant-in-aid
from the National Nature Science Foundation of China (grant no.,
30973501).
Availability of data and materials
The analyzed data sets generated during the study
are available from the corresponding author, on reasonable
request.
Authors' contributions
XT designed the experiments and was responsible for
the quality control of the data. LZ performed the miRNA microarray,
interpreted the data and was the main contributor in writing the
manuscript. YS and YY maintained the cell lines and prepared the
total RNA. HL and HW performed the RT-qPCR. ZW predicted the target
genes of the miRNAs. XZ and FG performed GO and KEGG analysis. All
authors have read and approved the manuscript.
Ethics approval and consent to
participate
Not applicable.
Patient consent for publication
Not applicable.
Competing interests
The authors declare that they have no competing
interests.
References
|
1
|
Siegel R, Naishadham D and Jemal A: Cancer
statistics, 2013. CA Cancer J Clin. 63:11–30. 2013. View Article : Google Scholar : PubMed/NCBI
|
|
2
|
Parkin DM, Bray F, Ferlay J and Pisani P:
Global cancer statistics, 2002. CA Cancer J Clin. 55:74–108. 2005.
View Article : Google Scholar : PubMed/NCBI
|
|
3
|
Bandres E, Agirre X, Ramirez N, Zarate R
and Garcia-Foncillas J: MicroRNAs as cancer players: Potential
clinical and biological effects. DNA Cell Biol. 26:273–282. 2007.
View Article : Google Scholar : PubMed/NCBI
|
|
4
|
Baranwal S and Alahari SK: miRNA control
of tumor cell invasion and metastasis. Int J Cancer. 126:1283–1290.
2010.PubMed/NCBI
|
|
5
|
Nicoloso MS, Spizzo R, Shimizu M, Rossi S
and Calin GA: MicroRNAs-the micro steering wheel of tumour
metastases. Nat Rev Cancer. 9:293–302. 2009. View Article : Google Scholar : PubMed/NCBI
|
|
6
|
Iorio MV, Ferracin M, Liu CG, Veronese A,
Spizzo R, Sabbioni S, Magri E, Pedriali M, Fabbri M, Campiglio M,
et al: MicroRNA gene expression deregulation in human breast
cancer. Cancer Res. 65:7065–7070. 2005. View Article : Google Scholar : PubMed/NCBI
|
|
7
|
Volinia S, Calin GA, Liu CG, Ambs S,
Cimmino A, Petrocca F, Visone R, Iorio M, Roldo C, Ferracin M, et
al: A microRNA expression signature of human solid tumors defines
cancer gene targets. Proc Natl Acad Sci USA. 103:pp. 2257–2261.
2006; View Article : Google Scholar : PubMed/NCBI
|
|
8
|
Esquela-Kerscher A and Slack FJ:
Oncomirs-microRNAs with a role in cancer. Nat Rev Cancer.
6:259–269. 2006. View
Article : Google Scholar : PubMed/NCBI
|
|
9
|
Egami H, Takiyama Y, Cano M, Houser WH and
Pour PM: Establishment of hamster pancreatic ductal carcinoma cell
line (PC-1) producing blood group-related antigens. Carcinogenesis.
10:861–869. 1989. View Article : Google Scholar : PubMed/NCBI
|
|
10
|
Egami H, Tomioka T, Tempero M, Kay D and
Pour PM: Development of intrapancreatic transplantable model of
pancreatic duct adenocarcinoma in Syrian golden hamsters. Am J
Pathol. 138:557–561. 1991.PubMed/NCBI
|
|
11
|
Pour PM, Egami H and Takiyama Y: Patterns
of growth and metastases of induced pancreatic cancer in relation
to the prognosis and its clinical implications. Gastroenterology.
100:529–536. 1991. View Article : Google Scholar : PubMed/NCBI
|
|
12
|
Kozomara A and Griffiths-Jones S: miRBase:
Annotating high confidence microRNAs using deep sequencing data.
Nucleic Acids Res. 42(Database Issue): D68–D73. 2014. View Article : Google Scholar : PubMed/NCBI
|
|
13
|
Yang YH, Dudoit S, Luu P, Lin DM, Peng V,
Ngai J and Speed TP: Normalization for cDNA microarray data: A
robust composite method addressing single and multiple slide
systematic variation. Nucleic Acids Res. 30:e152002. View Article : Google Scholar : PubMed/NCBI
|
|
14
|
Tusher VG, Tibshirani R and Chu G:
Significance analysis of microarrays applied to the ionizing
radiation response. Proc Natl Acad Sci USA. 98:pp. 5116–5121. 2001;
View Article : Google Scholar : PubMed/NCBI
|
|
15
|
Yuan JS, Reed A, Chen F and Stewart CN Jr:
Statistical analysis of real-time PCR data. BMC Bioinformatics.
7:852006. View Article : Google Scholar : PubMed/NCBI
|
|
16
|
Kohl M, Wiese S and Warscheid B:
Cytoscape: Software for visualization and analysis of biological
networks. Methods Mol Biol. 696:291–303. 2011. View Article : Google Scholar : PubMed/NCBI
|
|
17
|
Kanehisa M and Goto S: KEGG: Kyoto
encyclopedia of genes and genomes. Nucleic Acids Res. 28:27–30.
2000. View Article : Google Scholar : PubMed/NCBI
|
|
18
|
Tan X, Egami H, Ishikawa S, Kurizaki T,
Nakagawa M, Hirota M and Ogawa M: Arrangement of expression and
distribution of tight junction protein claudin-1 in cell
dissociation of pancreatic cancer cells. Int J Oncol. 25:1567–1574.
2004.PubMed/NCBI
|
|
19
|
Tan X, Egami H, Ishikawa S, Kurizaki T,
Hirota M and Ogawa M: Zonula occludens-1 (ZO-1) redistribution is
involved in the regulation of cell dissociation in pancreatic
cancer cells. Dig Dis Sci. 50:1402–1409. 2005. View Article : Google Scholar : PubMed/NCBI
|
|
20
|
Tan X, Tamori Y, Egami H, Ishikawa S,
Kurizaki T, Takai E, Hirota M and Ogawa M: Analysis of
invasion-metastasis mechanism in pancreatic cancer: Involvement of
tight junction transmembrane protein occludin and MEK/ERK signal
transduction pathway in cancer cell dissociation. Oncol Rep.
11:993–998. 2004.PubMed/NCBI
|
|
21
|
Tan X, Egami H, Abe M, Nozawa F, Hirota M
and Ogawa M: Involvement of MMP-7 in invasion of pancreatic cancer
cells through activation of the EGFR mediated MEK-ERK signal
transduction pathway. J Clin Pathol. 58:1242–1248. 2005. View Article : Google Scholar : PubMed/NCBI
|
|
22
|
Tan X, Egami H, Ishikawa S, Sugita H,
Kamohara H, Nakagawa M, Nozawa F, Abe M and Ogawa M: Involvement of
matrix metalloproteinase-7 in invasion-metastasis through induction
of cell dissociation in pancreatic cancer. Int J Oncol.
26:1283–1289. 2005.PubMed/NCBI
|
|
23
|
Tan X, Egami H, Ishikawa S, Kurizaki T,
Tamori Y, Takai E, Hirota M and Ogawa M: Relationship between the
expression of extracellular signal-regulated kinase 1/2 and the
dissociation of pancreatic cancer cells: Involvement of ERK1/2 in
the dissociation status of cancer cells. Int J Oncol. 24:815–820.
2004.PubMed/NCBI
|
|
24
|
Tan X, Egami H, Kamohara H, Ishikawa S,
Kurizaki T, Yoshida N, Tamori Y, Takai E, Hirota M and Ogawa M:
Involvement of the mitogen-activated protein kinase kinase 2 in the
induction of cell dissociation in pancreatic cancer. Int J Oncol.
24:65–73. 2004.PubMed/NCBI
|
|
25
|
Tan X, Egami H, Ishikawa S, Nakagawa M,
Ishiko T, Kamohara H, Hirota M and Ogawa M: Relationship between
activation of epidermal growth factor receptor and cell
dissociation in pancreatic cancer. Int J Oncol. 25:1303–1309.
2004.PubMed/NCBI
|
|
26
|
Pour PM, Runge RG, Birt D, Gingell R,
Lawson T, Nagel D, Wallcave L and Salmasi SZ: Current knowledge of
pancreatic carcinogenesis in the hamster and its relevance to the
human disease. Cancer. 47 6 Suppl:S1573–S1589. 1981. View Article : Google Scholar
|
|
27
|
Ishikawa S, Egami H, Kurizaki T, Akagi J,
Tamori Y, Yoshida N, Tan X, Hayashi N and Ogawa M: Identification
of genes related to invasion and metastasis in pancreatic cancer by
cDNA representational difference analysis. J Exp Clin Cancer Res.
22:299–306. 2003.PubMed/NCBI
|
|
28
|
Zhao G, Wang B, Liu Y, Zhang JG, Deng SC,
Qin Q, Tian K, Li X, Zhu S, Niu Y, et al: miRNA-141, downregulated
in pancreatic cancer, inhibits cell proliferation and invasion by
directly targeting MAP4K4. Mol Cancer Ther. 12:2569–2580. 2013.
View Article : Google Scholar : PubMed/NCBI
|
|
29
|
Kadera BE, Li L, Toste PA, Wu N, Adams C,
Dawson DW and Donahue TR: MicroRNA-21 in pancreatic ductal
adenocarcinoma tumor-associated fibroblasts promotes metastasis.
PLoS One. 8:e719782013. View Article : Google Scholar : PubMed/NCBI
|
|
30
|
Yang TS, Yang XH, Wang XD, Wang YL, Zhou B
and Song ZS: MiR-214 regulate gastric cancer cell proliferation,
migration and invasion by targeting PTEN. Cancer Cell Int.
13:682013. View Article : Google Scholar : PubMed/NCBI
|
|
31
|
Zhao G, Zhang JG, Shi Y, Qin Q, Liu Y,
Wang B, Tian K, Deng SC, Li X, Zhu S, et al: MiR-130b is a
prognostic marker and inhibits cell proliferation and invasion in
pancreatic cancer through targeting STAT3. PLoS One. 8:e738032013.
View Article : Google Scholar : PubMed/NCBI
|
|
32
|
Chang TC, Wentzel EA, Kent OA,
Ramachandran K, Mullendore M, Lee KH, Feldmann G, Yamakuchi M,
Ferlito M, Lowenstein CJ, et al: Transactivation of miR-34a by p53
broadly influences gene expression and promotes apoptosis. Mol
Cell. 26:745–752. 2007. View Article : Google Scholar : PubMed/NCBI
|
|
33
|
Yang C and Wei W: The miRNA expression
profile of the uveal melanoma. Sci China Life Sci. 54:351–358.
2011. View Article : Google Scholar : PubMed/NCBI
|
|
34
|
Lee C, He H, Jiang Y, Di Y, Yang F, Li J,
Jin C and Fu D: Elevated expression of tumor miR-222 in pancreatic
cancer is associated with Ki67 and poor prognosis. Med Oncol.
30:7002013. View Article : Google Scholar : PubMed/NCBI
|
|
35
|
Kawaguchi T, Komatsu S, Ichikawa D,
Morimura R, Tsujiura M, Konishi H, Takeshita H, Nagata H, Arita T,
Hirajima S, et al: Clinical impact of circulating miR-221 in plasma
of patients with pancreatic cancer. Br J Cancer. 108:361–369. 2013.
View Article : Google Scholar : PubMed/NCBI
|