Introduction
Trichostatin A (TSA) is a histone deacetylase (HDAC)
inhibitor of class I and II HDACs. TSA influences gene expression
by interfering with the removal of acetyl groups from histones,
thereby altering the balance between DNA transcription factors and
chromatin (1). Based on the known
medicinal properties of HDAC inhibitors, TSA has been tested as a
treatment against various cancer cells with highly expressed HDACs,
including colon (2), breast (3) and lung (4)
cancer cells. TSA is known to affect the growth, apoptosis,
autophagy and/or differentiation processes of these cancer cells.
Previous studies have identified a potential association between
TSA and endoplasmic reticulum (ER) function (5); however, to the best of our knowledge, an
anticancer mechanism involving TSA and ER stress is unknown.
To investigate ER stress, dysfunction of the ER and
the unfolded protein response was induced under adverse conditions,
including metabolic and anaerobic stress, which disrupts the
protein-folding function of the ER. Altered ER homeostasis results
in an accumulation of unfolded or misfolded proteins, which
ultimately leads to ER stress (6,7). The ER
stress response activates cytotoxic mechanisms involving a number
of regulatory cytokines associated with the onset of programmed
cell death, suggesting this is a possible target in the development
of chemotherapeutic agents for inducing cancer cell toxicity
(8). As an essential tumor
suppressor, the TP53 gene regulates the processes of ER stress,
apoptosis, DNA repair, cell cycle and nuclear vesicular
trafficking, in the presence of cellular stressors, including
hypoxia, DNA damage and oncogene activation (9,10).
Previous studies have revealed that p53 is upregulated in response
to ER stress and participates in ER stress-induced apoptosis
(11). However, to the best of our
knowledge, the role of p53 in cancer cells exposed to TSA and ER
stress is not understood.
In the current study, the anticancer effect of TSA
on ER function was investigated in the HCT116 cell line. It was
identified that ER stress was induced by TSA. Additionally, the
inositol-requiring enzyme 1 α (IRE1α)/X-box binding protein 1
(XBP1) pathway was implicated in wild type (WT) HCT116 cells.
Mutation or silencing of TP53 attenuated ER stress. Cell viability
increased and the apoptosis rate decreased in HCT116 TP53(−/-)
cells compared with WT HCT116 cells undergoing TSA treatment.
Therefore, the induction of ER stress by TSA in colon cancer cells
likely involves a p53-dependent mechanism.
Materials and methods
Materials
TSA and 4-phenylbutyrate were purchased from Merck
KGaA (Darmstadt, Germany). Tunicamycin (TM; cat. no. 654380) were
obtained from Sigma-Aldrich; Merck KGaA). Primary antibodies for
GRP78 (cat. no. 3183), GRP94 (cat. no. 2104), p53 (cat. no. 2524)
and IRE1α (cat. no. 3294) were obtained from Cell Signaling
Technology, Inc. (Danvers, MA, USA). Primary antibodies for XBP1
(cat. no. ab37151 and cat. no. ab220783) were purchased from Abcam
(Cambridge, UK). A primary phosphospecific antibody for
phosphorylated IRE1α (p-IRE1α) was purchased from Abcam (cat. no.
ab124945). Small interfering RNA (siRNA) of p53 was obtained from
Shanghai GenePharma Co., Ltd (Shanghai, China). Transfection
reagent Lipofectamine 2000 was obtained from Invitrogen (Thermo
Fisher Scientific, Inc., Waltham, MA, USA). The Cell Counting kit-8
(CCK-8 kit) and the Annexin V-fluorescein isothiocyanate (FITC)
Detection kit were obtained from Beyotime Institute of
Biotechnology (Haimen, China).
Cell culture and TSA treatment
WT HCT116, HCT116 TP53(−/-) and HT29 human colon
cancer cell lines were purchased from Shanghai Cell Bank (Shanghai,
China; http://www.cellbank.org.cn). All three
cell lines were cultured in Dulbecco's modified Eagle's medium
(Hyclone, Logan, UT, USA) with 10% fetal bovine serum (Gibco;
Thermo Fisher Scientific, Inc.) at 37°C in a humidified incubator
containing 5% CO2. For the TSA treatment, specific
amounts of TSA were added to the medium to generate a mixed medium
gradient with different concentrations of TSA (0, 0.04, 0.2 and 1
µM).
Cell viability
Cells were seeded in 96-well plates with
5×10³ cells per well. Following 24 h of cultivation, the
negative control siRNAs were transfected with Lipofectamine 2000
according to the manufacturer's protocol. Next, the cells were
treated with different concentrations of TSA (0, 0.04, 0.2 and 1
µM) and cultured at 37°C for 24 h. Cell viability was determined
using the CCK-8 assay according to the manufacturer's protocol,
with a 2 h incubation. The number of viable cells was quantified by
measuring the absorbance at 450 nm using a microplate reader. Three
replicates were performed for each group.
Apoptosis analysis
Apoptosis was analyzed using the Annexin V-FITC
Apoptosis Detection kit according to the manufacturer's protocol.
Trypsin was used to collect 1×10⁶ cells with or without
TSA treatment at a concentration of 1 µM for 24 h. These collected
cells were washed twice with cold PBS and resuspended with Annexin
V-FITC binding solution. Propidium iodide was used to stain the
cells for 20 min at 25°C. Cells were detected using a FACSCalibur
flow cytometer and analyzed by BD CellQuest Pro 5.1 software (both
BD Biosciences, Franklin Lakes, NJ, USA).
Reporter assay
Luciferase reporter pCAX-F-XBP1delDBD- Luc (provided
by Dr Takao Iwawaki, Gunma University, Japan) was used to detect
XBP1 splicing events (12). The
luciferase is expressed only when XBP1 splicing occurs and its
activity reflects the number of splicing events. TM treatment was
used as positive control. The vectors were transfected using
Lipofectamine 2000 (Invitrogen; Thermo Fisher Scientific, Inc.).
Cell lysate with or without drug treatment was collected 24 h
following transfection. Luciferase activity was evaluated using the
Luciferase Assay system (Promega Corporation, Madison, WI, USA)
according to the manufacturer's protocol.
RNA extraction and reverse
transcription-quantitative polymerase chain reaction (RT-qPCR)
Total RNA from the cultured cells was extracted
using RNAiso Plus reagent (Takara Bio, Inc., Otsu, Japan) and
quantified with a NanoDrop spectrophotometer (Thermo Fisher
Scientific, Inc.). The purified RNA (0.5 µg) was reverse
transcribed to cDNA using PrimeScript RT reagent kit (Takara
Biotechnology Co., Ltd., Dalian, China), according to the
manufacturer's protocols. Then qPCR was performed using a Bio-Rad
CFX Connect detection system (Bio-Rad Laboratories, Inc., Hercules,
CA, USA) with SYBR Premix Ex Taq II (Takara Bio, Inc.; cat. no.
RR820L). A two-step PCR protocol was used with the following
conditions: 95°C for 30 sec, followed by 40 cycles of 95°C for 5
sec and 60°C for 30 sec. All reactions were carried out in
triplicate. The mRNA expression levels of target genes were
normalized to the mRNA expression of GAPDH using the
2−ΔΔCq method (13). The
sequences of the forward and reverse primers are presented in
Table I.
 | Table I.Primers for reverse
transcription-quantitative PCR and semi-quantitative PCR. |
Table I.
Primers for reverse
transcription-quantitative PCR and semi-quantitative PCR.
| Target | Target sequence | Products, bp |
|---|
| GRP78 mRNA | F:
CGTCCTATGTCGCCTTCACT | 230 |
|
| R:
TGTCTTTGTTTGCCCACCTC |
|
| GRP94 mRNA | F:
CAGTTTGGTGTCGGTTTCTA | 141 |
|
| R:
AGTGTTTCCTCTTGGGTCAG |
|
| GAPDH mRNA | F:
GGGAAGGTGAAGGTCGGAGTC | 232 |
|
| R:
CCTGGAAGATGGTGATGGGAT |
|
| XBP1 mRNA | F:
GAACCAGGAGTTAAGACAGCG | 212 |
|
| R:
CCAGAATGCCCAACAGGATA |
|
| p21 promoter | F:
GAGGGACTGGGGGAGGAGGGAA | 267 |
|
| R:
CCACAAGGAACTGACTTCGGCA |
|
| GRP78 promoter | F:
GAAATTGCGCTGTGCTCCTGTG | 149 |
|
| R:
CGTCCTCCTTCTTGTCCTCCTCC |
|
| GRP94 promoter | F:
CCTCACGAATCCTCATTGGGT | 158 |
|
| R:
TCGGATCCTCACACCTCCAGC |
|
| GAPDH promoter | F:
CGGCTCCAATTCCCCATCTC | 132 |
|
| R:
GAGGTGATCGGTGCTGGTTC |
|
Western blot analysis
Cells were suspended in ice-cold
radioimmunoprecipitation assay buffer, which contained protease
inhibitors (Beyotime Institute of Biotechnology). The extraction
mixture was collected and centrifuged at 10,000 × g at 4°C for 15
min. The supernatant was obtained and the protein concentration was
analyzed using a Bradford assay. Equal amounts of protein
extractions (40 µg) were separated on 10% SDS-polyacrylamide gels
and electrophoretically transferred onto polyvinylidene difluoride
membranes (EMD Millipore, Billerica, MA, USA). Subsequent to being
blocked with 5% skimmed milk for 2 h at room temperature, membranes
were incubated with a primary antibody at 4°C overnight. The
following antibodies were used for western blotting: Anti-GRP78
(dilution, 1:1,000), anti-GRP94 (dilution, 1:1,000), anti-p53
(dilution, 1:1,000), anti-IRE1α (dilution, 1:1,000), anti-p-IRE1α
(dilution, 1:1,000), anti-XBP1-U (dilution,1:1,000; cat. no.
ab37151), anti-XBP1-S (dilution, 1:1,000; cat. no. ab220783) and
anti-GAPDH (dilution, 1:5,000). The blots were then incubated with
anti-mouse (cat. no. zb2305) or anti-rabbit (cat. no. zb2301)
secondary antibodies at a dilution of 1:5,000) coupled to
horseradish peroxidase (Zhongshan Golden Bridge Biotechnology,
Beijing, China) at 4°C for 2 h. The immunoreactive proteins were
detected using the ECL Detection system (Thermo Fisher Scientific,
Inc.). Densitometric analysis of the protein bands was conducted
using ImageJ 1.42 software (National Institutes of Health,
Bethesda, MD, USA). Analysis of each sample was repeated three
times.
Chromatin immunoprecipitation (ChIP)
and semi-quantitative PCR
A total of 1×10⁷ cells, with or without 1
µM TSA treatment at 37°C with 5% CO2 for 24 h, were
harvested and washed with cold PBS. A ChIP assay was performed
using an EZ-ChIP kit from EMD Millipore according to the
manufacturer's protocol. The cross-linked chromatins were sonicated
(300 W, Pulse 1s/3s) for 2 min at 0°C and immunoprecipitated
overnight using acetylated histone H3 antibody (dilution, 1:300;
cat. no. 17-615) or anti-IgG (dilution, 1:1,000; cat. no. 17-371;
both Upstate Biotechnology, Inc., Lake Placid, NY, USA) antibody.
The precipitated DNA was detected by semi-quantitative PCR using
GoTaq® Master Mix (Promega Corporation, Madison, WI,
USA), according to the manufacturer's protocols, using the
following conditions: 95°C for 30 sec, followed by 15 cycles of
95°C for 5 sec, 60°C for 30 sec and 72°C for 30 sec. A total of 5
µl PCR products were stained with 1 µl 4S Green Plus (Sangon
Biotech Co. Ltd., Shanghai, China) for 10 sec at room temperature,
according to the manufacturer's protocols, and detected by 5%
agarose gel electrophoresis For histone hyperacetylation analysis,
the p21 promoter was used as a positive control (14) and the GAPDH promoter was used as a
reference region. Quantitative values obtained for the PCR products
(GRP78, GRP94 and p21) were normalized relative to the GAPDH
promoter and adjusted by the amount of normal control group.
Analysis of the bands of PCR products was conducted using ImageJ
1.42 software (National Institutes of Health, Bethesda, MD, USA).
Analysis of each sample was repeated three times. Relevant primers
are listed in Table I.
Knockdown of TP53 expression by
siRNA
Cells were transfected with TP53 siRNA, while the
control was transfected with negative control siRNA (GenePharma
Co., Ltd) using Lipofectamine 2000, according to the manufacturer's
protocol. Cells were harvested 24 h post-transfection and used for
subsequent assays. The interference effect of p53 was assessed by
western blotting. The siRNA sequences are presented in Table II.
| Table II.Sequences of siRNA against TP53 and
NC. |
Table II.
Sequences of siRNA against TP53 and
NC.
| Name | Target sequence |
|---|
| TP53 siRNA |
5′-CUACUUCCUGAAAACAACGTT-3′ |
|
|
5′-CGUUGUUUUCAGGAAGUAGTT-3′ |
| NC siRNA |
5′-UUCUCCGAACGUGUCACGUTT-3′ |
|
|
5′-ACGUGACACGUUCGGAGAATT-3′ |
Statistical analysis
All data were presented as the mean ± standard error
and each experiment was performed independently at least three
times. Student's t-test and analysis of variance (ANOVA) were used
for detecting differences between experimental groups. Multiple
group comparisons were carried out by ANOVA with a post hoc
Student-Newman-Keuls test. P<0.05 was considered to indicate a
statistically significant difference. Statistical analysis was
carried out using SPSS 16.0 software (SPSS Inc., Chicago, IL,
USA).
Results
TSA induces p53-dependent ER
stress
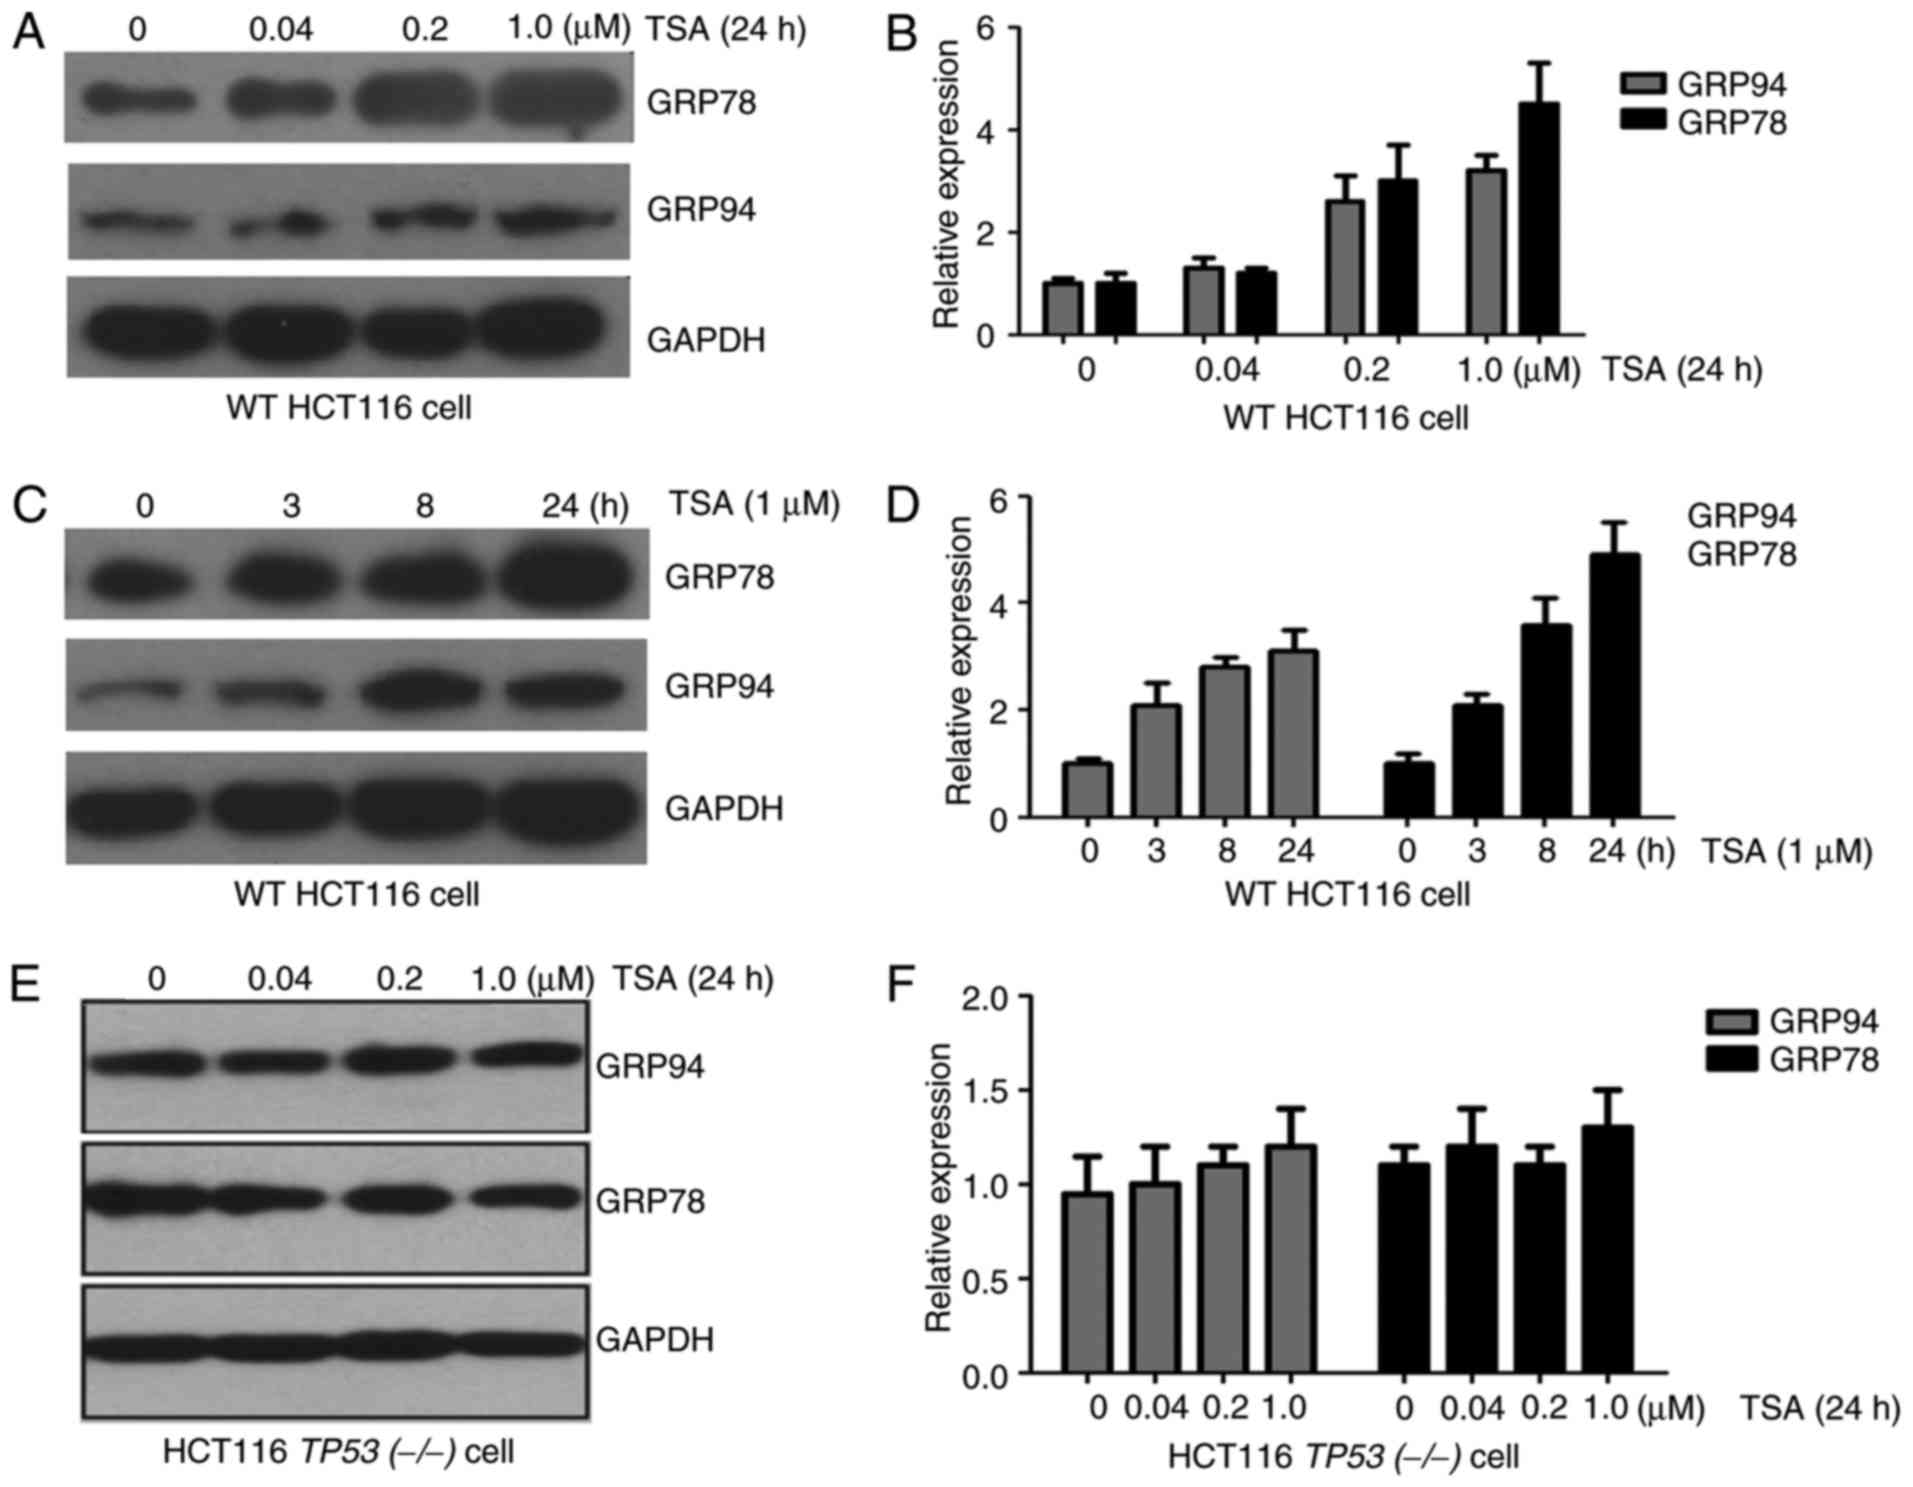
To determine the effect of TSA on ER stress, HCT116
cells were treated with TSA at increasing concentrations for
specific time intervals, after which the expression of GRP78 and
GRP94 was analyzed. As demonstrated in Fig. 1A-D, the expression of ER stress
markers GRP78 and GRP94 increased at the mRNA and protein level, in
a dose- and time-dependent manner with TSA treatment.
Since HCT116 cells contained the WT TP53 gene, the
response to TP53 was investigated in another colon cancer cell
line, HT29, in which the TP53 gene was mutated. Increased
expression of GRP78 and GRP94 was not observed in HT29 cells
treated with TSA compared with untreated cells (data not
presented). In addition, HCT116 TP53(−/-) cells were treated with
TSA. As observed in HT29 cells, expression of GRP78 and GRP94 in
HCT116 TP53(−/-) cells was not associated with TSA treatment
(Fig. 1E and F). These results
suggested that TSA-induced expression of ER stress marker proteins
depends on p53.
Hyperacetylation of ER stress marker
genes is not induced by TSA
TSA, a classic HDAC inhibitor, disrupts the balance
between histone acetylation, deacetylation and induced
hyperacetylation, which alters chromatin structure and gene
expression (1). Since TSA was
identified to increase gene expression of ER stress markers at the
transcriptional level (Fig. 1B and
D), the current study investigated if this increased gene
expression was associated with hyperacetylation of ER stress
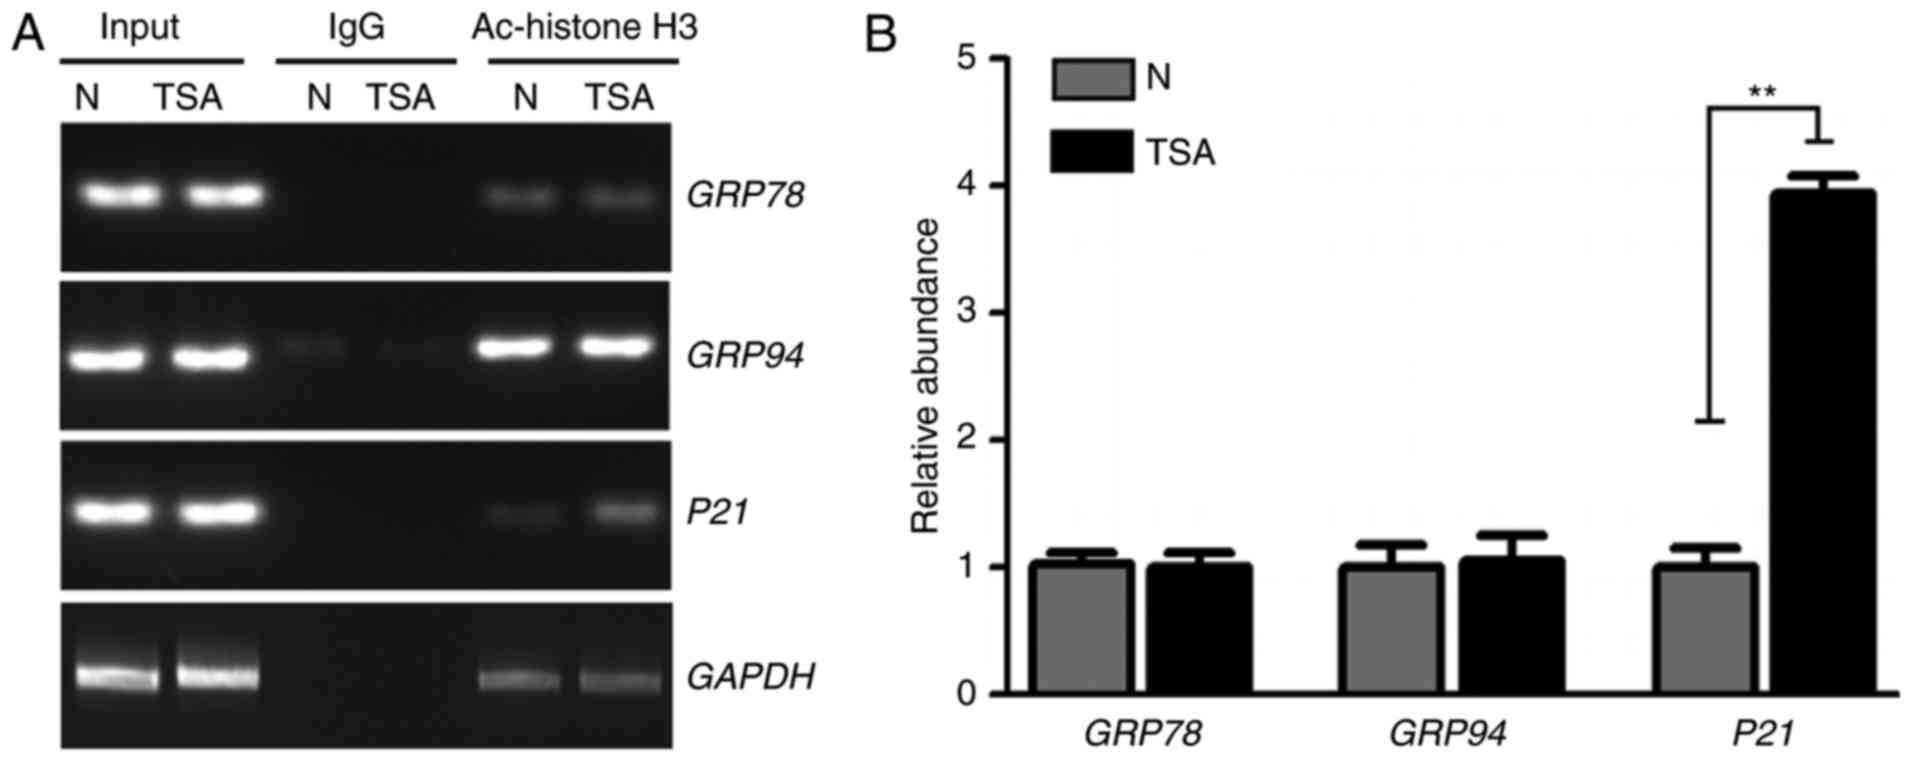
markers. Following TSA treatment, the acetylation of histone H3K9
in the promoter regions of GRP78 and GRP94 genes was analyzed. ChIP
and a semi-quantitative PCR assay were performed to measure the
acetylation level of histone H3K9 in the GRP78 and GRP94 promoter
regions. As demonstrated in Fig. 2,
no significant differences were identified in the acetylation
levels of the promoter regions of GRP78, GRP94 and GAPDH in
TSA-treated cells. However, hyperacetylation was significantly
increased in the positive control p21 gene promoter region
following TSA treatment. Therefore, other mechanisms likely
contribute to the increase of ER stress-marker expression following
TSA treatment.
p53 is associated with the viability
and apoptosis of HCT116 cells following TSA treatment
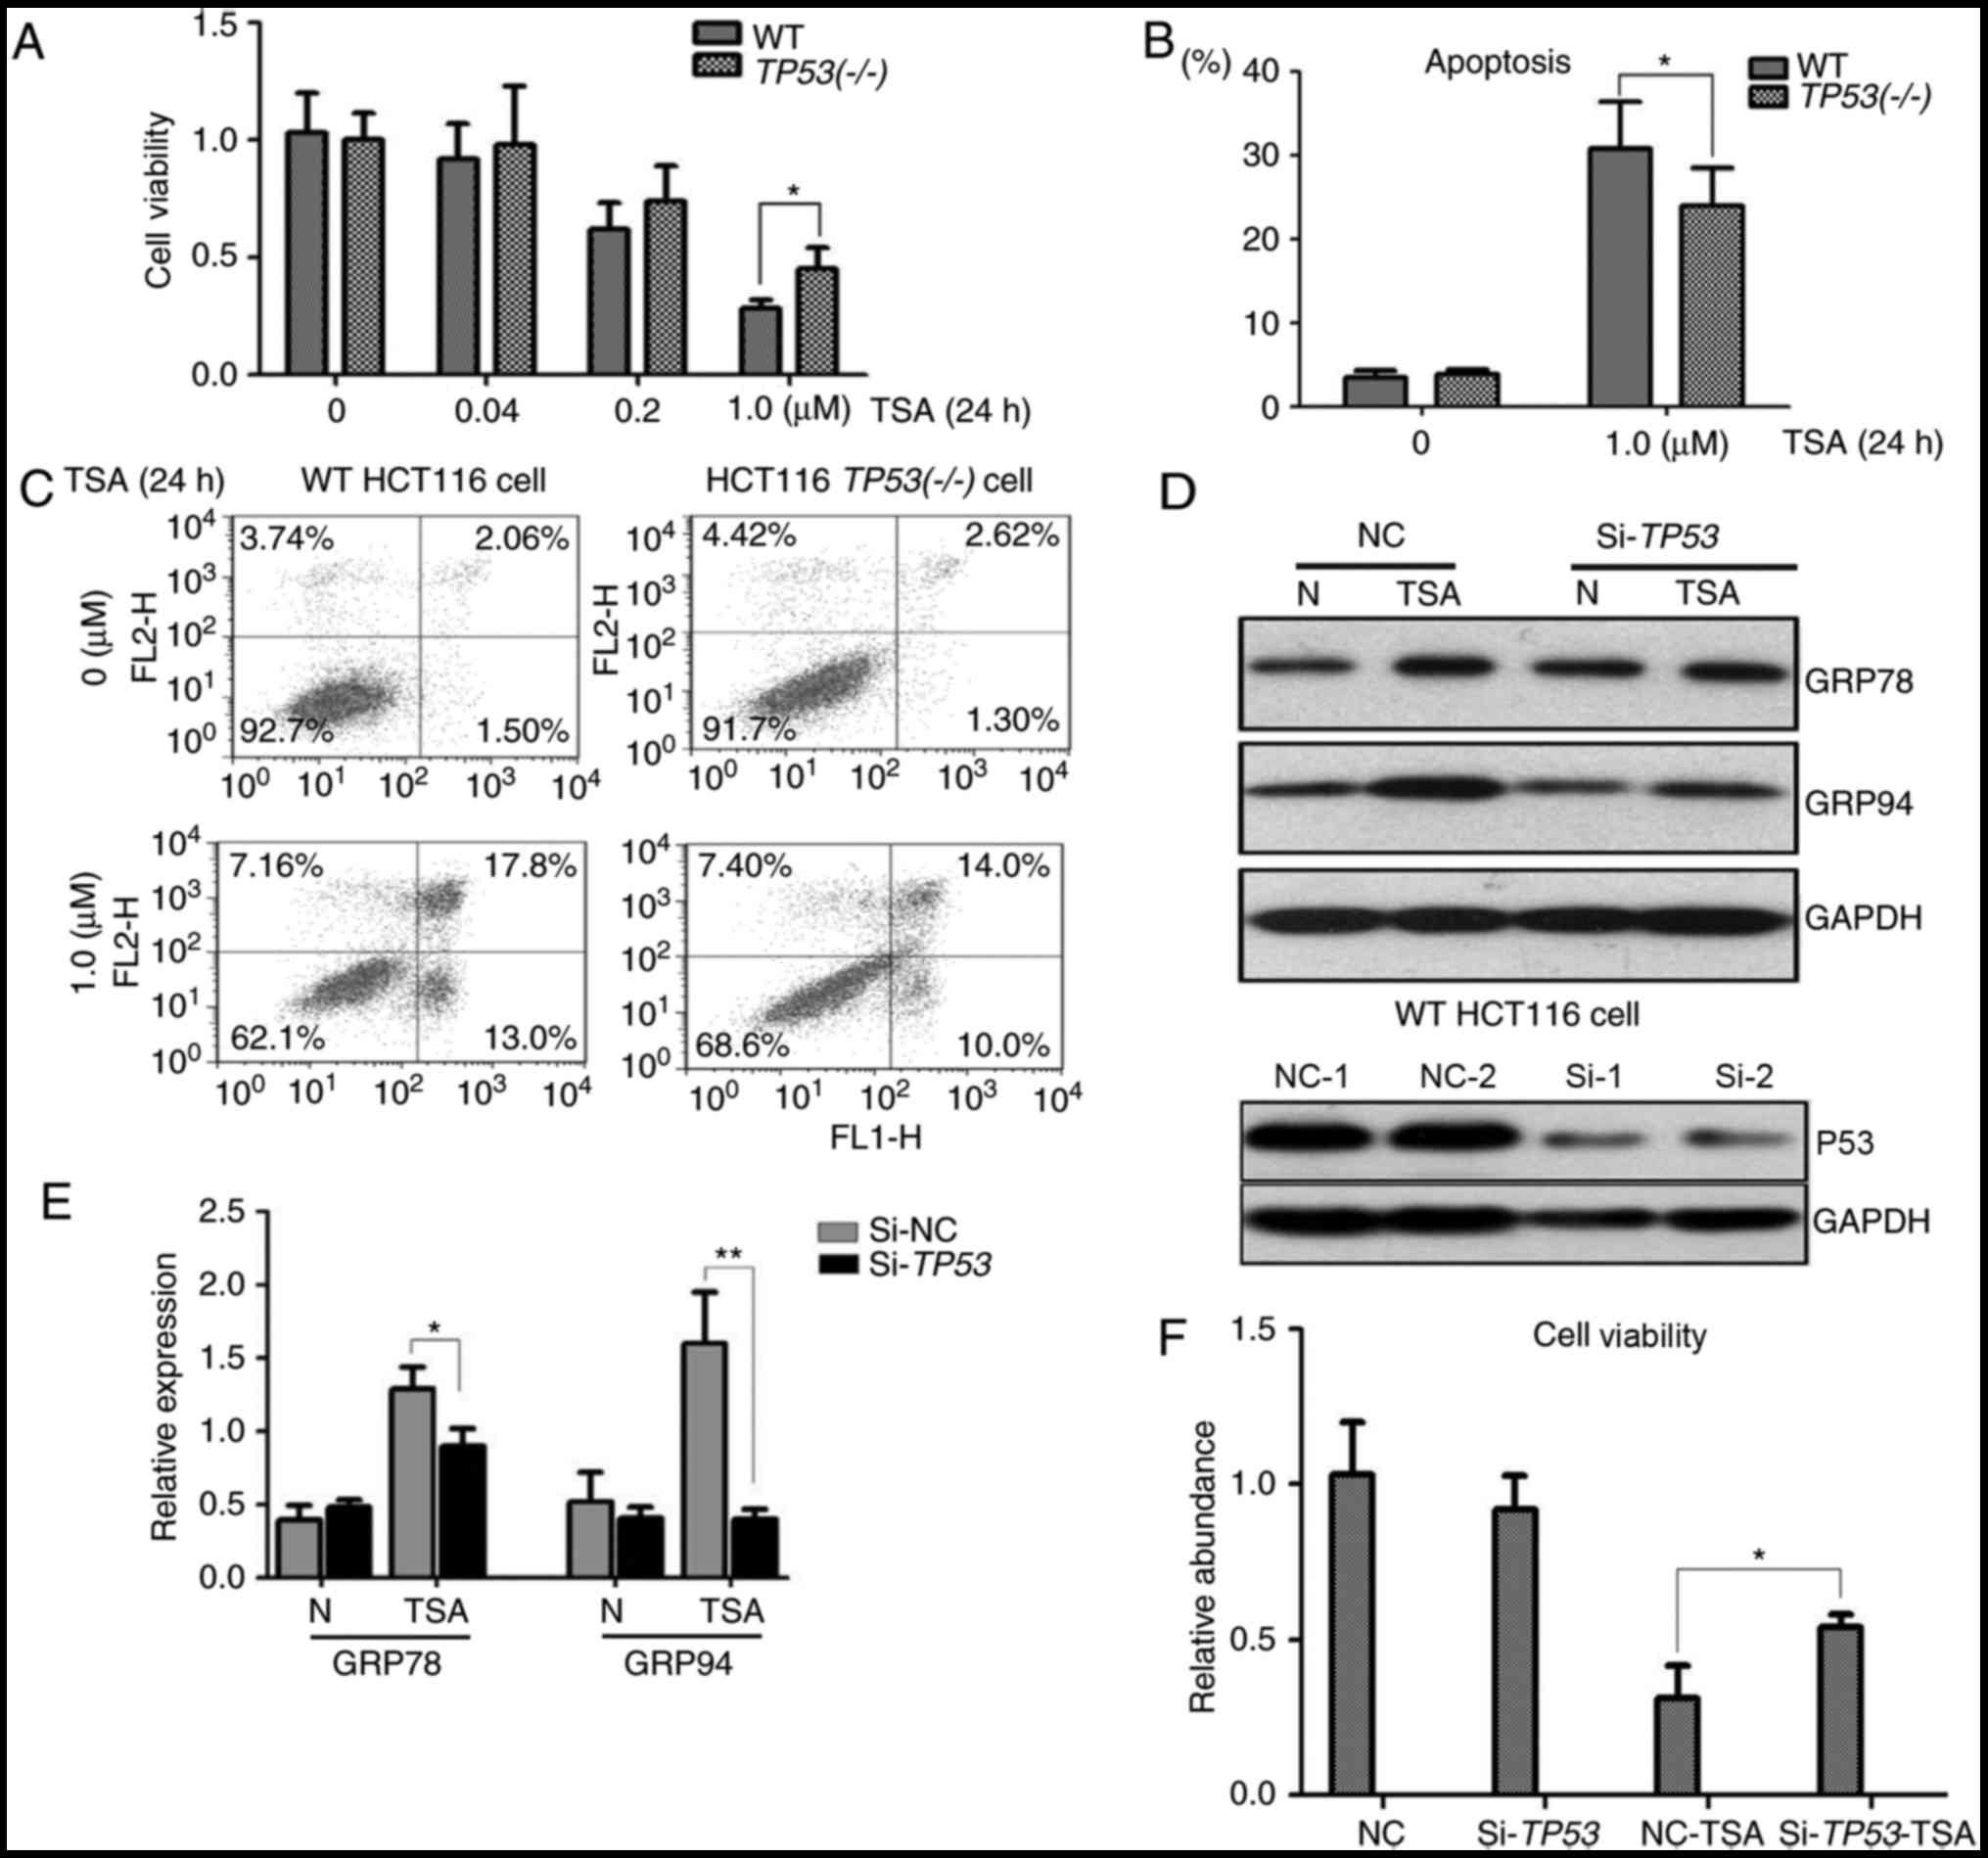
To assess the association of p53 with the
cytotoxicity of TSA, cell viability and apoptosis assays were
performed with WT HCT116 and HCT116 TP53(−/-) cells. A CCK-8 assay
revealed that an increase in the concentration of TSA was
associated with a decrease in the viability of WT HCT116 and HCT116
TP53(−/-) cells. A significant difference was identified in the
viability of WT HCT116 and HCT116 TP53(−/-) cells treated with 1 µM
TSA (Fig. 3A). Additionally, the
apoptosis rate of WT HCT116 cells was identified to be
significantly higher compared with the apoptosis rate of HCT116
TP53(−/-) cells following treatment with 1 µM TSA (Fig. 3B and C). These results suggested that
p53 expression was associated with the cell viability and apoptosis
rate of colon cancer cells treated with 1 µM TSA.
Silencing of p53 attenuates ER stress
in WT HCT116 cells
ER stress induced by TSA was detected in WT HCT116
cells but not in HCT116 TP53(−/-) cells. To further investigate the
role of p53 in TSA treatment, TP53 was knocked down by RNA
interference in WT HCT116 cells. As expected, siRNA efficiently
inhibited p53 expression in WT HCT116 cells (Fig. 3D). The molecular response following
treatment with TSA was detected by immunoblotting; following TSA
treatment the protein levels of GRP78 and GRP94 were significantly
higher in WT HCT116 cells compared with HCT116 cells in which
TP53-knockdown had been achieved by siRNA (Fig. 3D and E). A cell viability assay
demonstrated that in comparison with the negative control group,
cell viability was significantly higher in TP53-knockdown WT HCT116
cells following TSA treatment (Fig.
3F).
Involvement of the IRE1 pathway with
TSA treatment
A previous study has suggested that the IRE1 pathway
is involved in the ER stress response (15). The RNase activity of IRE1α is
activated following ER stress and its spliced form may reflect the
activation of IRE1α (16).
To identify whether the IRE1 pathway is associated
with TSA-induced ER stress, a luciferase reporter
pCAX-F-XBP1delDBD-Luc was used to detect XBP1 splicing events. The
luciferase was only expressed when XBP1 splicing occurred and its
expression level was associated with the number of splicing events.
As demonstrated in Fig. 4A, an
increase in luciferase activity was associated with TSA treatment.
The increase in luciferase activity was markedly higher in
TSA-treated WT HCT116 cells compared with the positive control WT
HCT116 cells treated with 1 µM TM for 24 h. However, this increase
in luciferase activity was significantly smaller in TSA-treated
HCT116 TP53(−/-) cells.
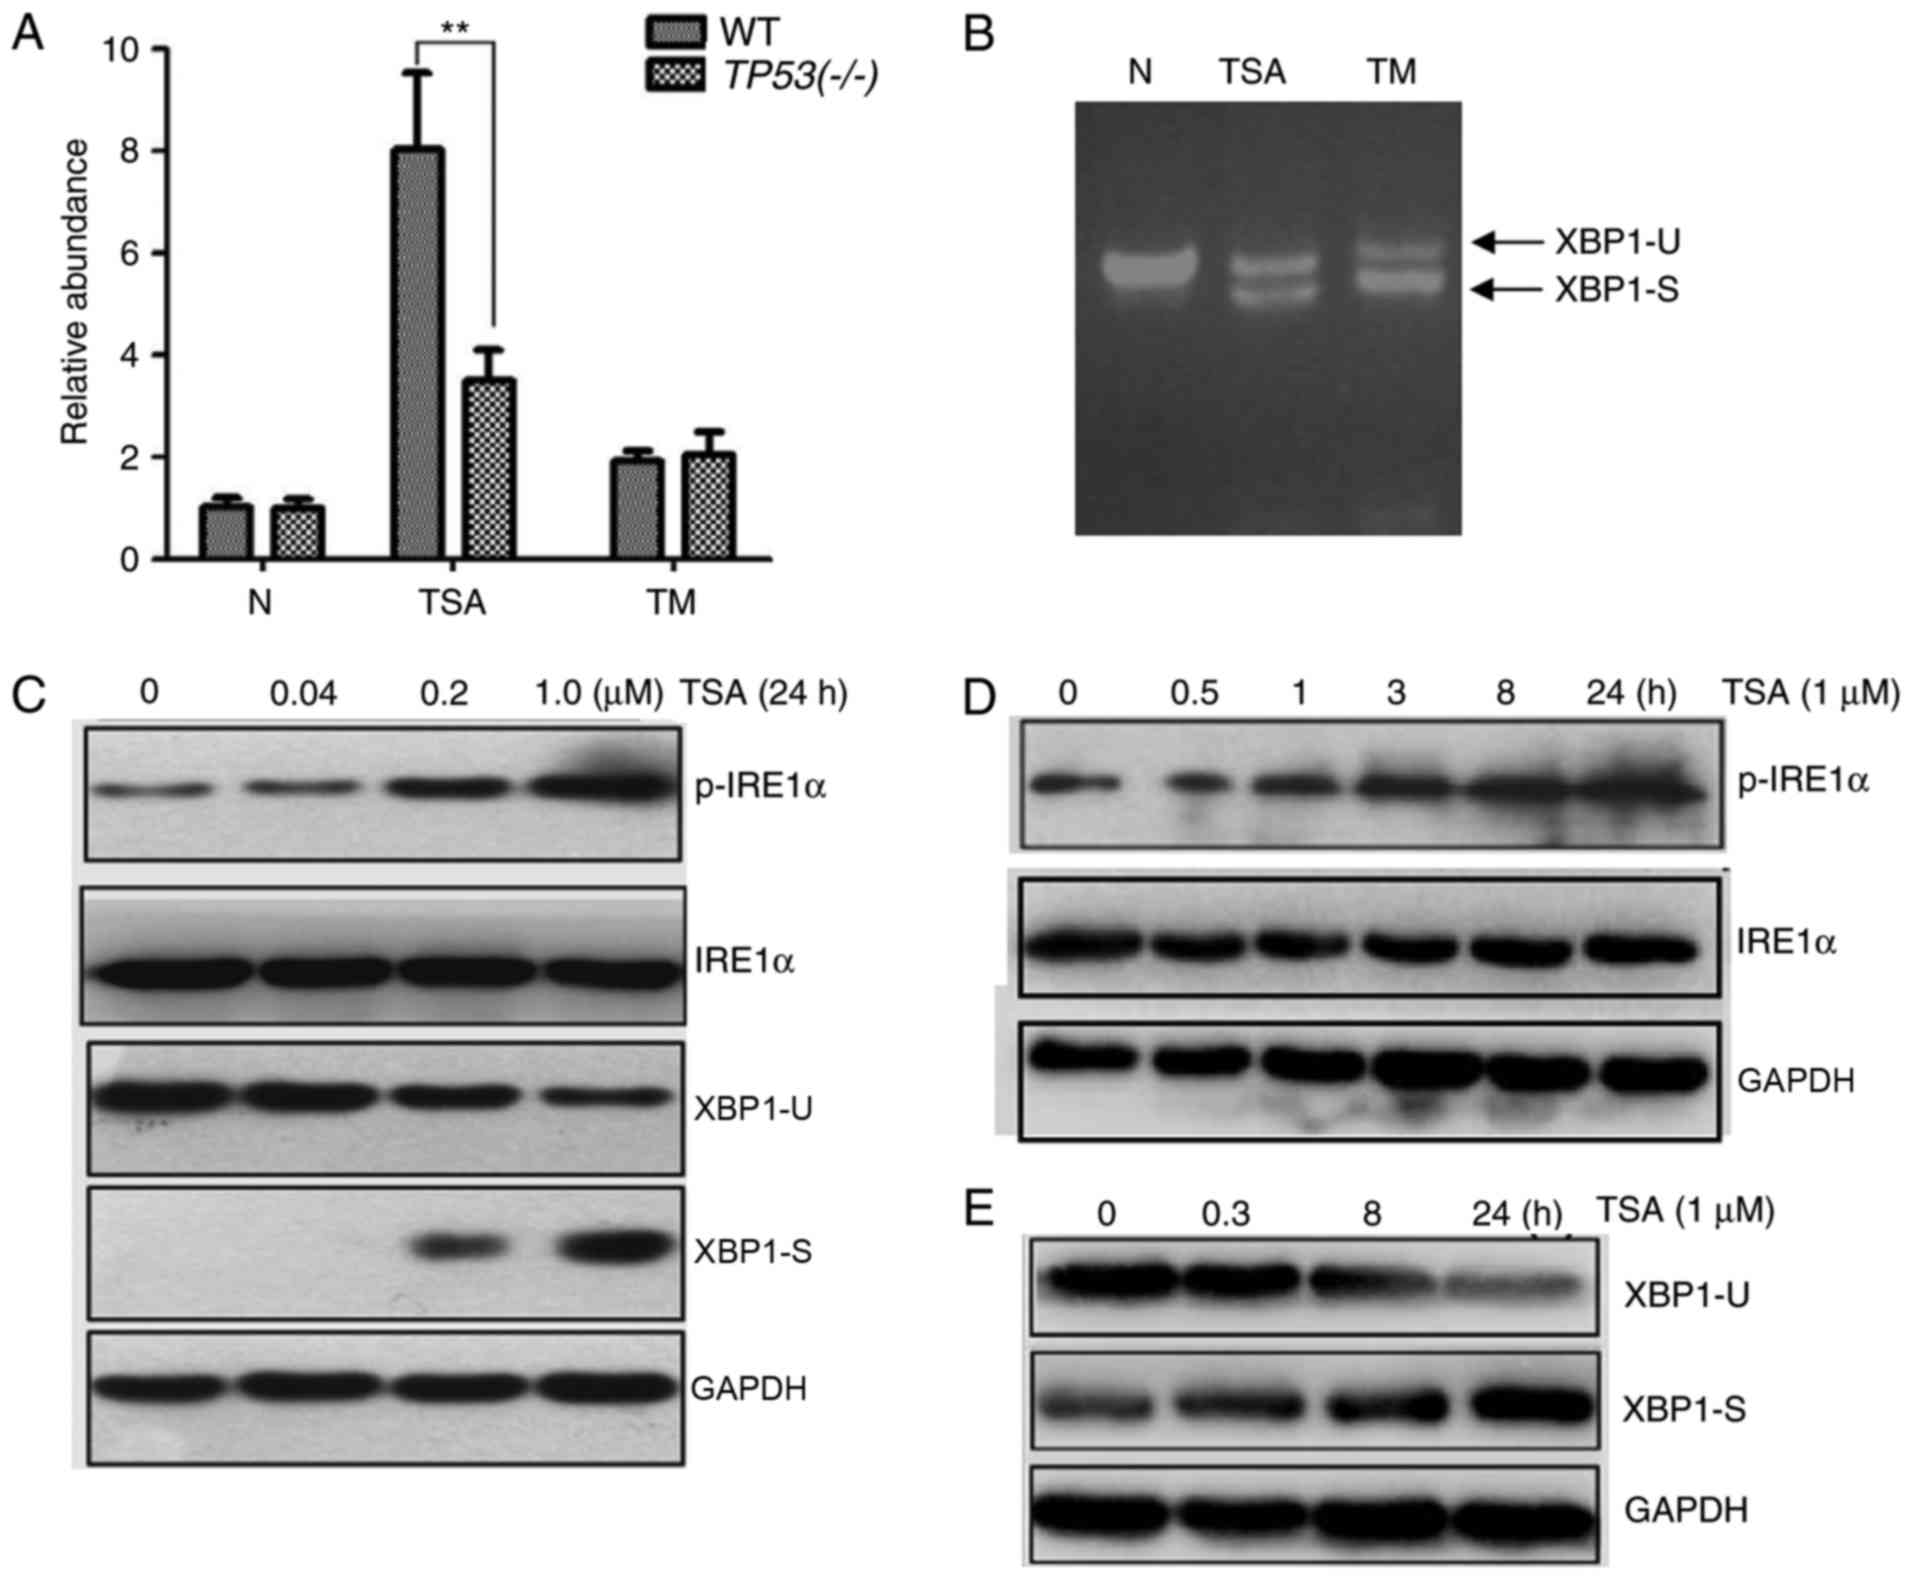 | Figure 4.Effect of TSA treatment on the
IRE1α/XBP1 pathway. In the luciferase reporter assay, cells were
transfected with pCAX-F-XBP1delDBD-Luc. (A) An increase in
luciferase activity was associated with TSA and TM treatment at a
concentration of 1 µM for 24 h. When treated with TSA the
luciferase activity was significantly higher in WT HCT116 cells
compared with HCT116 TP53(−/-) cells. (B) The spliced form of XBP1
was detected by reverse transcription-quantitative polymerase chain
reaction. (C) A decrease of XBP1-U and an increase of XBP1-S were
associated with an increasing concentration of TSA. Similarly, an
increase of p-IRE1α was associated with an increasing concentration
of TSA. (D) An increase of p-IRE1α was associated with the
treatment time of 1 µM TSA. (E) An increase of XBP1-S and a
decrease of XBP1-U was associated with the treatment time of 1 µM
TSA. **P<0.01. TSA, trichostatin A; IRE1α, inositol-requiring
enzyme 1 α; XBP1, X-box binding protein 1; TM, tunicamycin; WT,
wild type; XBP1-U, unspliced XBP1; XBP1-S, spliced XBP1; p-IRE1α,
phosphorylated IRE1α. |
Next, the spliced form of XBP1 was detected by
semi-quantitative PCR. As demonstrated in Fig. 4B, unspliced XBP1 and spliced XBP1 were
detected in TSA- and TM-treated WT HCT116 cells. Additionally, the
protein levels of p-IRE1α were measured. As expected, the protein
level of unspliced XBP1 decreased and spliced XBP1 increased
following TSA treatment, in a dose-dependent manner (Fig. 4C). Similarly, the protein levels of
p-IRE1α increased following TSA treatment, in a dose-dependent
manner (Fig. 4C). Furthermore, levels
of p-IRE1α and spliced XBP1 increased in a time-dependent manner
with TSA treatment (Fig. 4D and E).
Taken together, these data suggested that the IRE1 pathway may be
involved in TSA-induced ER stress.
Discussion
In the current study, the expression of ER stress
markers, GRP78 and GRP94, was revealed to be increased following
TSA treatment of WT HCT116. Furthermore, this TSA-induced ER stress
was identified to be associated with the expression of p53.
Previously, a study identified that HDAC inhibitors specifically
induce the expression of GRP78 and this effect is amplified by ER
stress (17). In the current study,
GRP78 and GRP94 were upregulated in a p53-dependent manner.
However, GRP78 and GRP94 promoter regions were not hyperacetylated
following TSA treatment. Previous studies have identified that
there are HDAC1 response elements in the promoter region of GRP78
that function as negative regulation factors (17,18). This
suggests that TSA may inhibit HDAC1 and induce GRP78 expression. In
addition, TSA may activate the gene promoter through the Sp1 and
Sp3 sites, including ethanolamine kinase 1 gene (19). These results suggest that the increase
in ER stress markers may involve transcription factors or
regulatory elements, including HDAC1 response elements, Sp1 and Sp3
sites, and factors within the p53 network. However, these
suggestions require verification in future studies.
To further investigate the effect of increased ER
stress markers following TSA treatment, the associated pathways
were analyzed. Previous studies have identified that the ER
transmembrane proteins, IRE1α, protein kinase R-like ER kinase
(PERK), eukaryotic initiation factor 2 (eIF2) and activating
transcription factor 6 (ATF6), mediate the unfolded protein
response and ER stress response in mammalian cells (20). ER stress, a highly conserved cellular
defense mechanism, responds to perturbations of ER function
(20). When ER stress occurs, the
GRP78 and GRP94 proteins dissociate from ER membrane receptors,
followed by activation of the unfolded protein response. Previous
studies have revealed that the IRE1α/XBP1 pathway is important for
oncogenesis, as it helps tumor cells adapt to ER stress and
associated growth factors (21). In
the current study, the IRE1α/XBP1 pathway was identified to be
associated with TSA treatment. Levels of p-IRE1α and spliced XBP1
increased following TSA-induced ER stress in cancer cells. However,
no association was identified between TSA and ER stress when p53
was silenced. Silencing of p53 in WT HCT116 cells attenuated ER
stress marker expression induced by TSA and decreased XBP1 splicing
events. A previous study identified p53 as a crucial regulator of
ER function; loss of p53 function induced an upregulation of IRE1α
expression, which increased ER function. In p53 deficient cells,
the IRE1α/XBP1 pathway was upregulated but the ER stress-dependent
activation of ATF6 and the PERK/eIF2α pathway was suppressed
(22). In the current study, TSA
induced ER stress in a p53-dependent manner; the expression of ER
stress markers did not increase following TSA treatment when p53
function was lost. These data indicate that activation of the
IRE1α/XBP1 pathway is associated with the upregulation of ER stress
markers following TSA treatment. However, other pathways associated
with ER stress were not analyzed in the current study. Therefore,
the results primarily revealed the association between TSA and the
IRE1α/XBP1 pathway.
TSA-induced apoptosis is an important function for
cancer therapy; p53 has been identified to influence the antitumor
effect of TSA (4). Tumor cells
experience constant ER stress and are exposed to various stress
stimuli in their microenvironment, including the accumulation of
misfolded proteins, hypoxia, acidic pH levels, reactive oxygen
species, calcium imbalance, viral proteins and hypoglycemia
(23). Therefore, substantial ER
stress may easily be induced in tumor cells, which may lead to
tumor cell death. There are three pathways involved in ER stress
mediated apoptosis: The C/EBP homologous protein (CHOP) associated
pathway, the tumor necrosis factor receptor-associated
factor-2/c-Jun N-terminal kinase (JNK) pathway and caspase-12
activation (24). The current study
revealed that the IRE1α/XBP1 pathway may initiate downstream
reactions. IRE1α activation can induce JNK phosphorylation and
phosphorylated JNK can exert proapoptotic effects by activating
caspase-12/4 and caspase-8 (7).
Additionally, XBP1 is known to activate the transcription of CHOP
(25), therefore XBP1 contributes to
the induction of apoptosis.
A mutation in the TP53 gene is often identified in
human cancer cells (26). Activation
of p53 has been revealed to suppress the activity of the
mechanistic target of rapamycin and inhibit the translation of
certain proteins (26). The
elimination of p53 may provide an opportunity for cancer cells to
promote unregulated proliferation due to increased protein
synthesis and a subsequent increase in ER function (9). In the current study, the expression of
p53 affected the extent of TSA-induced ER stress. p53 was
associated with cell viability and apoptosis following TSA
treatment; the rate of apoptosis was significantly higher in WT
HCT116 cells compared with HCT116 TP53(−/-) cells following TSA
treatment. A previous study has identified that ER stress may
activate proapoptotic p53-target genes, including NOXA and p53
upregulated modulator of apoptosis; these genes are associated with
the induction of cell death during ER stress (27). Therefore, p53 inactivation may be a
driving factor for chemoresistance to TSA in HCT116 cells.
Furthermore, a previous study has reported a combined effect of TSA
with other factors, including iron chelators (18). Iron chelators promote binding between
HDAC-1 and the GRP78 promoter region, which reduces GRP78
expression and promotes the chemotherapeutic effect of TSA.
Knockdown of GRP78 also promotes desensitization to TSA in cancer
cells, which reduces apoptosis (17).
The observation made by the current study that the status of p53
influences the association between ER stress and TSA may provide
insight into the development of an anticancer function of TSA.
In summary, the current study has identified that ER
stress is induced by TSA and the IRE1α/XBP1 pathway in WT HCT116
cells. Mutation or silencing of TP53 has been revealed to attenuate
ER stress. Furthermore, the current study identified that cell
viability increased and the apoptosis rate decreased in HCT116
TP53(−/-) cells compared with WT HCT116 cells following TSA
treatment. Overall the data reveal that TSA-induced ER stress may
occur via a p53-dependent mechanism in colon cancer cells.
Acknowledgements
Not applicable.
Funding
The current study was supported by the National
Natural Science Foundation of China (grant nos. 31671331 and
81700222) and the Natural Science Foundation Project of CQ CSTC
(grant no. cstc2017jcyjAX0442).
Availability of data and materials
All data generated or analyzed during the present
study are included in this published article.
Authors' contributions
BZ and LD conceived the study. BZ and LD designed
the study. LD, GH, KZ and XG performed the experiment. LD and YW
analyzed the data. LD and BZ wrote the manuscript.
Ethics approval and consent to
participate
Not applicable.
Patient consent for publication
Not applicable.
Competing interests
The authors declare that they have no competing
interests.
References
|
1
|
Vanhaecke T, Papeleu P, Elaut G and
Rogiers V: Trichostatin A-like hydroxamate histone deacetylase
inhibitors as therapeutic agents: Toxicological point of view. Curr
Med Chem. 11:1629–1643. 2004. View Article : Google Scholar : PubMed/NCBI
|
|
2
|
Liu Y, He G, Wang Y, Guan X, Pang X and
Zhang B: MCM-2 is a therapeutic target of Trichostatin A in colon
cancer cells. Toxicol Lett. 221:23–30. 2013. View Article : Google Scholar : PubMed/NCBI
|
|
3
|
Liu J and Li Y: Trichostatin A and
Tamoxifen inhibit breast cancer cell growth by miR-204 and ERα
reducing AKT/mTOR pathway. Biochem Biophys Res Commun. 467:242–247.
2015. View Article : Google Scholar : PubMed/NCBI
|
|
4
|
Wu TC, Lin YC, Chen HL, Huang PR, Liu SY
and Yeh SL: The enhancing effect of genistein on apoptosis induced
by trichostatin A in lung cancer cells with wild type p53 genes is
associated with upregulation of histone acetyltransferase. Toxicol
Appl Pharmacol. 292:94–102. 2016. View Article : Google Scholar : PubMed/NCBI
|
|
5
|
Yu L, Lu M, Wang P and Chen X:
Trichostatin A ameliorates myocardial ischemia/reperfusion injury
through inhibition of endoplasmic reticulum stress-induced
apoptosis. Arch Med Res. 43:190–196. 2012. View Article : Google Scholar : PubMed/NCBI
|
|
6
|
Ron D and Walter P: Signal integration in
the endoplasmic reticulum unfolded protein response. Nat Rev Mol
Cell Biol. 8:519–529. 2007. View
Article : Google Scholar : PubMed/NCBI
|
|
7
|
Montalbano R, Waldegger P, Quint K, Jabari
S, Neureiter D, Illig R, Ocker M and Di Fazio P: Endoplasmic
reticulum stress plays a pivotal role in cell death mediated by the
pan-deacetylase inhibitor panobinostat in human hepatocellular
cancer cells. Transl Oncol. 6:143–157. 2013. View Article : Google Scholar : PubMed/NCBI
|
|
8
|
Johnson GG, White MC and Grimaldi M:
Stressed to death: Targeting endoplasmic reticulum stress response
induced apoptosis in gliomas. Curr Pharm Des. 17:284–292. 2011.
View Article : Google Scholar : PubMed/NCBI
|
|
9
|
Byun S, Namba T and Lee SW: Losing p53
loosens up ER-stress. Aging (Albany NY). 7:895–896. 2015.
View Article : Google Scholar : PubMed/NCBI
|
|
10
|
Jiang P, Du W, Mancuso A, Wellen KE and
Yang X: Reciprocal regulation of p53 and malic enzymes modulates
metabolism and senescence. Nature. 493:689–693. 2013. View Article : Google Scholar : PubMed/NCBI
|
|
11
|
Jeong K, Kim SJ, Oh Y, Kim H, Lee YS, Kwon
BS, Park S, Park KC, Yoon KS, Kim SS, et al: p53 negatively
regulates Pin1 expression under ER stress. Biochem Biophys Res
Commun. 454:518–523. 2014. View Article : Google Scholar : PubMed/NCBI
|
|
12
|
Iwawaki T and Akai R: Analysis of the XBP1
splicing mechanism using endoplasmic reticulum stress-indicators.
Biochem Biophys Res Commun. 350:709–715. 2006. View Article : Google Scholar : PubMed/NCBI
|
|
13
|
Livak KJ and Schmittgen TD: Analysis of
relative gene expression data using real-time quantitative PCR and
the 2(-Delta Delta C(T)) method. Methods. 25:402–408. 2001.
View Article : Google Scholar : PubMed/NCBI
|
|
14
|
Sowa Y, Orita T, Hiranabe-Minamikawa S,
Nakano K, Mizuno T, Nomura H and Sakai T: Histone deacetylase
inhibitor activates the p21/WAF1/Cip1 gene promoter through the Sp1
sites. Ann N Y Acad Sci. 886:195–199. 1999. View Article : Google Scholar : PubMed/NCBI
|
|
15
|
Yoshida H, Matsui T, Yamamoto A, Okada T
and Mori K: XBP1 mRNA is induced by ATF6 and spliced by IRE1 in
response to ER stress to produce a highly active transcription
factor. Cell. 107:881–891. 2001. View Article : Google Scholar : PubMed/NCBI
|
|
16
|
Kennedy D, Samali A and Jäger R: Methods
for studying ER stress and UPR markers in human cells. Methods Mol
Biol. 1292:3–18. 2015. View Article : Google Scholar : PubMed/NCBI
|
|
17
|
Baumeister P, Dong D, Fu Y and Lee AS:
Transcriptional induction of GRP78/BiP by histone deacetylase
inhibitors and resistance to histone deacetylase inhibitor-induced
apoptosis. Mol Cancer Ther. 8:1086–1094. 2009. View Article : Google Scholar : PubMed/NCBI
|
|
18
|
Kilinc V, Bedir A, Okuyucu A, Salis O,
Alacam H and Gulten S: Do iron chelators increase the
antiproliferative effect of trichostatin A through a
glucose-regulated protein 78 mediated mechanism? Tumour Biol.
35:5945–5951. 2014. View Article : Google Scholar : PubMed/NCBI
|
|
19
|
Kuan CS, See Too WC and Few LL: Sp1 and
Sp3 Are the transcription activators of human ek1 promoter in
TSA-Treated human colon carcinoma cells. PLoS One. 11:e01478862016.
View Article : Google Scholar : PubMed/NCBI
|
|
20
|
Walter P and Ron D: The unfolded protein
response: From stress pathway to homeostatic regulation. Science.
334:1081–1086. 2011. View Article : Google Scholar : PubMed/NCBI
|
|
21
|
Wang M and Kaufman RJ: The impact of the
endoplasmic reticulum protein-folding environment on cancer
development. Nat Rev Cancer. 14:581–597. 2014. View Article : Google Scholar : PubMed/NCBI
|
|
22
|
Namba T, Chu K, Kodama R, Byun S, Yoon KW,
Hiraki M, Mandinova A and Lee SW: Loss of p53 enhances the function
of the endoplasmic reticulum through activation of the IRE1α/XBP1
pathway. Oncotarget. 6:19990–20001. 2015. View Article : Google Scholar : PubMed/NCBI
|
|
23
|
He J, Du L, Bao M, Zhang B, Qian H, Zhou Q
and Cao Z: Oroxin A inhibits breast cancer cell growth by inducing
robust endoplasmic reticulum stress and senescence. Anticancer
Drugs. 27:204–215. 2016. View Article : Google Scholar : PubMed/NCBI
|
|
24
|
Tabas I and Ron D: Integrating the
mechanisms of apoptosis induced by endoplasmic reticulum stress.
Nat Cell Biol. 13:184–190. 2011. View Article : Google Scholar : PubMed/NCBI
|
|
25
|
Oyadomari S and Mori M: Roles of
CHOP/GADD153 in endoplasmic reticulum stress. Cell Death Differ.
11:381–389. 2004. View Article : Google Scholar : PubMed/NCBI
|
|
26
|
Levine AJ and Oren M: The first 30 years
of p53: Growing ever more complex. Nat Rev Cancer. 9:749–758. 2009.
View Article : Google Scholar : PubMed/NCBI
|
|
27
|
Li J, Lee B and Lee AS: Endoplasmic
reticulum stress-induced apoptosis: Multiple pathways and
activation of p53-up-regulated modulator of apoptosis (PUMA) and
NOXA by p53. J Biol Chem. 281:7260–7270. 2006. View Article : Google Scholar : PubMed/NCBI
|