Introduction
In Japan, the mortality rate of patients with
colorectal cancer (CRC) has been increasing. According to the vital
statistics of Japan, in 2015, CRC was the leading cause of
cancer-associated mortality in females and the third leading cause
of cancer-associated mortality in males (1). The 5-year survival rate of patients with
CRC following curative resection is ~80%, but 10–20% of cases are
unresectable (2). In the last two
decades, the mean survival time of patients with advanced CRC has
increased from 1 year to ~2 years due to the introduction of
chemotherapy drugs, including irinotecan and oxaliplatin. These
therapeutic agents are used in combination with fluorouracil and
leucovorin as standard regimens, FOLFILI and FOLFOX4, for advanced
CRC (3–5). Recently, targeted biological therapeutic
agents have proved to be useful for treating CRC (6,7).
Cetuximab, a targeted biological therapeutic agent, has
significantly improved the survival times of patients with CRC with
metastatic lesions, particularly when the cancer is refractory to
the aforementioned anticancer drugs (8). According to the BOND-1 study (9), combination therapy with cetuximab and
irinotecan produced a higher response rate compared with cetuximab
alone. In addition, cetuximab has the capacity to reverse drug
resistance by abrogating drug efflux, restoring apoptosis and
impairing DNA repair activity when administered in combination with
irinotecan (8,9).
A number of randomized trials have suggested that
mutations in the Kirsten rat sarcoma viral oncogene homolog (KRAS)
and v-Raf murine sarcoma viral oncogene homolog B (BRAF) genes are
negative prognostic predictors among patients with metastatic CRC
who are treated with anti-epidermal growth factor receptor (EGFR)
antibodies (10–13). The efficacy of KRAS mutations as
predictive biomarkers is well established, but the effects of BRAF
mutations remain unknown (14).
Further investigation is required on the effective pretreatment
methods for identifying patients with CRC that would respond to
particular treatments. The ability to predict the efficacy of
particular treatments in each patient during the pretreatment
period would allow doctors to provide a customized treatment for
each patient, which may improve the quality of life and prognosis
of the patient. Therefore, it is necessary to identify biomarkers
that could be used to predict the efficacy of treatments for
CRC.
Metabolomics is the comprehensive study of low
molecular weight molecules, known as metabolites, in a particular
organism or tissue. Metabolomics is a useful approach to
understanding the state of a patient's body, as metabolites and
their concentrations directly reflect the underlying biochemical
activity and state of cells/tissues. In addition, metabolites
represent the endpoint of the omics cascade and therefore can be
directly linked to molecular phenotypes (15). Therefore, metabolomics is employed as
a tool for discovering candidate biomarkers that may aid disease
diagnosis, toxicological testing, prognosis and risk assessment
(16–18). We have previously demonstrated the
usefulness of metabolomics for facilitating the diagnosis and
evaluation of pancreatic cancer and CRC (19–22).
However, to the best of our knowledge, a limited number of studies
have investigated whether metabolite biomarkers could be used to
predict the response to cancer treatment. A previous study
involving high-resolution magic angle spinning magnetic resonance
spectroscopy indicated that a high concentration of glycine was
correlated with poor progression-free survival time in patients
with locally advanced rectal cancer (23). The aim of the present study was to use
gas chromatography/mass spectrometry (GC/MS) and liquid
chromatography/MS (LC/MS) to identify biomarkers that could be used
to predict the response to chemotherapy (cetuximab plus irinotecan
or cetuximab alone) for CRC. First, biomarker candidates were
searched for among serum metabolites by performing a
semi-quantitative analysis without the corresponding stable
isotopes. A quantitative analysis was subsequently conducted using
the corresponding stable isotopes for the selected biomarker
candidates and their efficacy was validated.
Materials and methods
Patients and treatment
The present study was conducted as part of a phase
II trial of chemotherapy for CRC, a clinical trial of third-line or
later treatment for CRC (24),
involving cetuximab plus irinotecan or cetuximab alone, performed
at the National Cancer Center Hospital (Tokyo, Japan). The present
study was approved by the Ethics Committees of the National Cancer
Center Hospital and Kobe University Graduate School of Medicine
(Kobe, Japan). Written informed consent was obtained from all
patients prior to participation in the present study. The patients
were recruited from the National Cancer Center Hospital between
December 2008 and March 2015. The inclusion criteria were as
follows: A histologically confirmed diagnosis of metastatic CRC
that was surgically unresectable or had recurred; having received
ineffective irinotecan, oxaliplatin or fluoropyrimidine-based
chemotherapy; an age of >20 years; an Eastern Cooperative
Oncology Group performance status score of 0–2 (25); a life expectancy of at least 2 months;
possessing the wild-type KRAS gene; and having at least one
radiologically measurable lesion according to the Response
Evaluation Criteria in Solid Tumors (RECIST) version 1.0 (26). The present study, as aforementioned,
was conducted as an accompaniment to a phase II clinical trial of
third-line or later treatment for CRC, and in the event that
irinotecan alone was not able to produce sufficient therapeutic
effects, cetuximab + irinotecan or cetuximab alone was expected to
be effective as a third-line treatment. Therefore, ‘having received
ineffective irinotecan’ was included in the inclusion criteria. In
addition, the minimum treatment-free period between the end of the
previous therapy and the day of registration was 4, 2 and 4 weeks
for patients who had received prior chemotherapy, radiotherapy and
major surgery, respectively. The exclusion criteria were as
follows: Having received EGFR signal transduction inhibitors or
anti-EGFR antibodies; having suffered double cancer within the past
5 years; and were suffering from active inflammation or severe
complications, including heart disease, diabetes, and ileus or
interstitial lung disease.
A total of 31 patients with CRC, including 21 males
and 10 females, participated in the present study (median age, 65;
range, 48–79 years). The subjects were allocated to groups A and B.
Patients who satisfy the following conditions are regarded as
‘Irinotecan unreliable’ and were allocated in group B; having
advanced peritoneal metastasis, having ascites in the pelvic cavity
and upper abdomen within 14 days prior to registration, drainage of
ascites is done within 14 days prior to registration. However,
patients who did not satisfy the aforementioned conditions were
allocated in group A. The patients in group A (n=27), consisting of
19 males and 8 females, were treated with cetuximab and irinotecan,
and the patients in group B (n=4), consisting of 2 males and 2
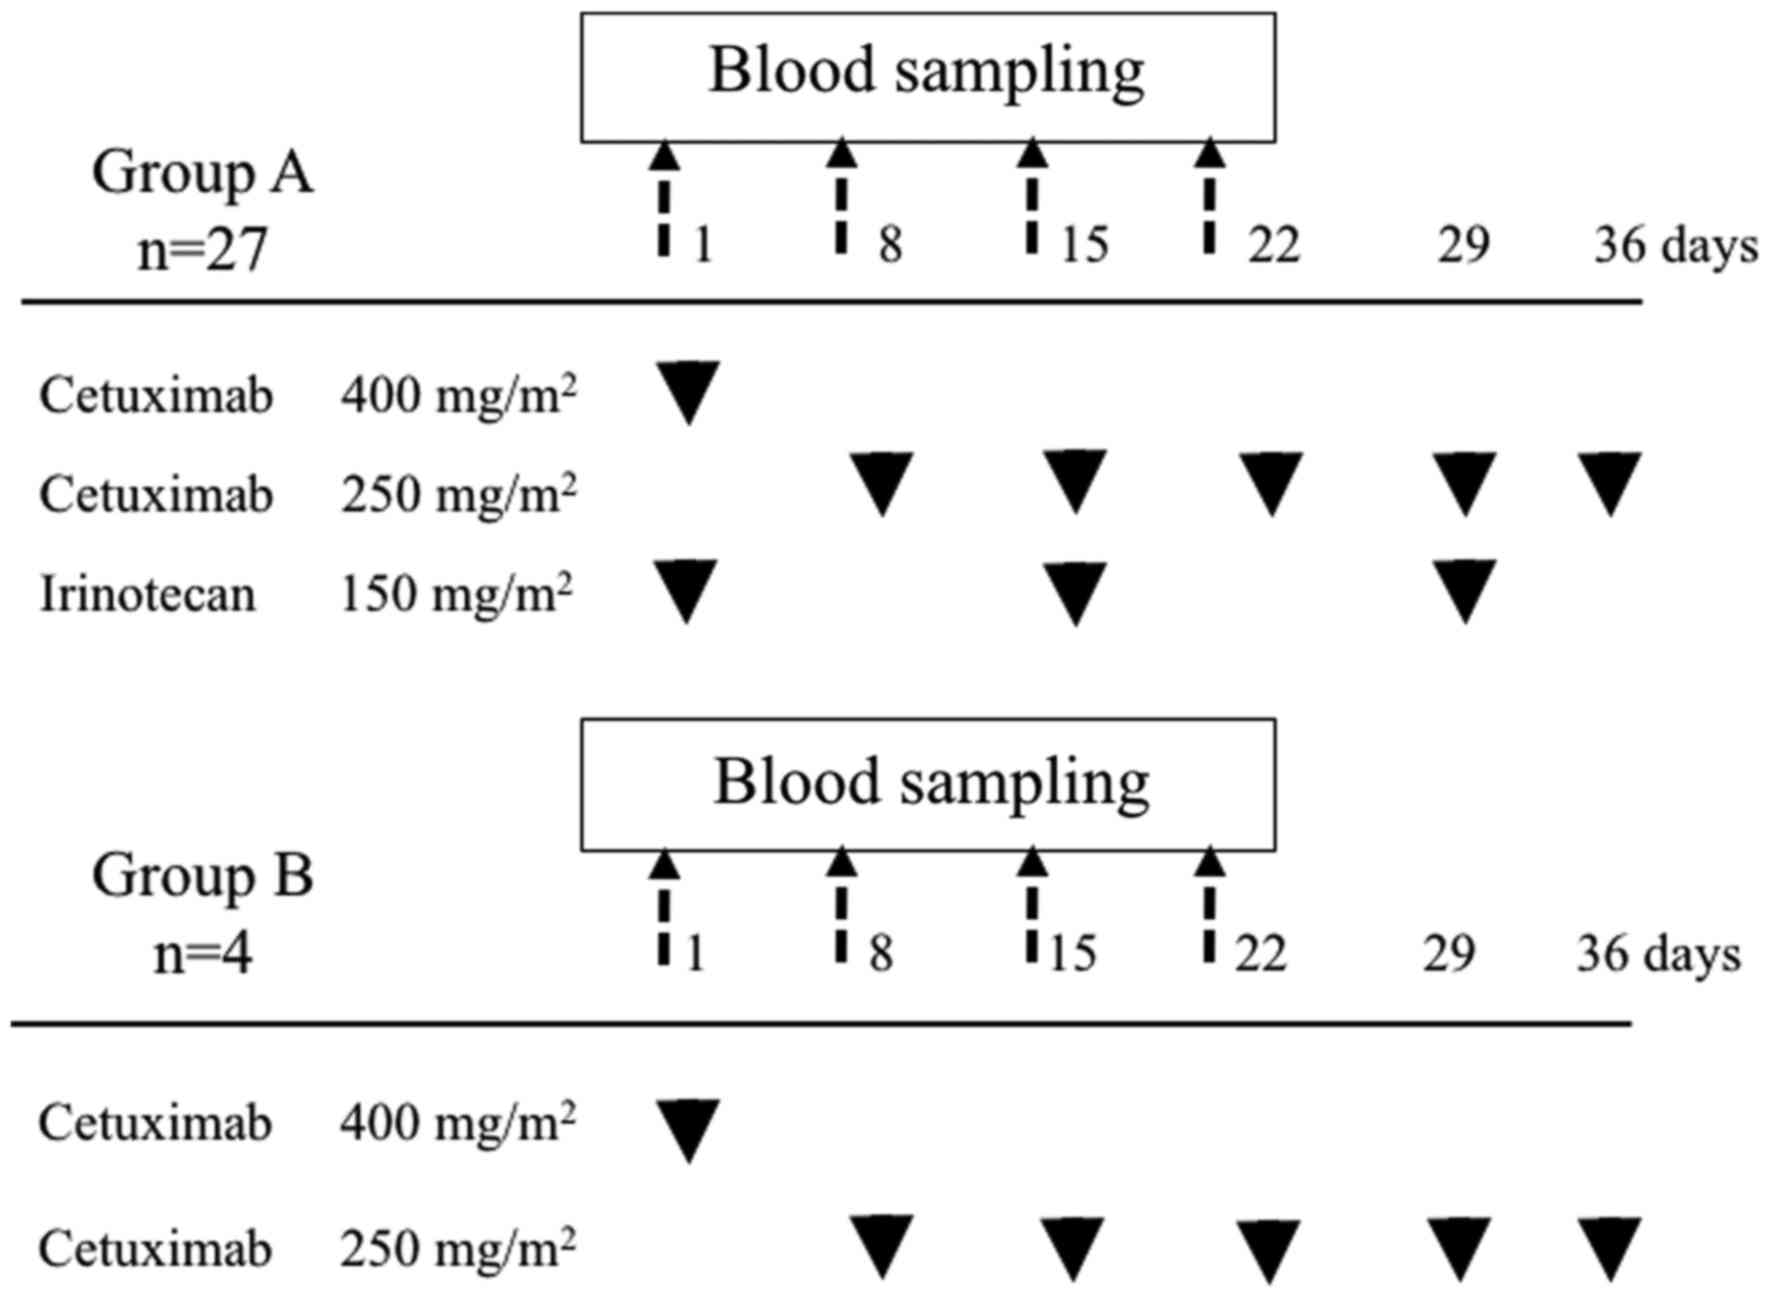
females, were treated with cetuximab alone. The patients received
cetuximab on day 1 of a 7-day treatment cycle. Cetuximab was
initially administered at a dose of 400 mg/m2 as a 2-h
infusion and was subsequently administered at a weekly dose of 250
mg/m2 as a 1-h infusion. Irinotecan was administered
once every 2 weeks, starting on day 1, at a dose of 150
mg/m2 as a 90 min infusion. Irinotecan administered
consecutively with cetuximab (Fig.
1). The aforementioned treatments were continued until disease
progression or unacceptable toxicities occurred. Responses were
evaluated using computed tomography (CT) scans obtained every 8
weeks for each patient and measuring the lesions using the RECIST
version 1.0 criteria.
Serum samples
Serum samples were collected from all patients prior
to each of the first four rounds of chemotherapy (days 1, 8, 15 and
22) at the National Cancer Center Hospital (Fig. 1) and were used for the metabolome
analysis. At 30 min post-blood sampling, the samples were
centrifuged at 1,500 × g for 10 min at 4°C. Next, the obtained
serum was immediately transferred to a clean tube and stored at
−80°C until it was used. The serum samples were subjected to
analysis by GC/MS and LC/MS.
Chemicals and isotopes
[U-13C6 (98%)]-labeled
1,5-Anhydro-D-glucitol, ([U-13C6
(98%)]-labeled 1,5-AG) and [1-13C]- labeled Octanoic
acid were obtained from Cambridge Isotope Laboratories, Inc.
(Tewksbury, MA, USA). Octanoic acid-1-13C,
2-isopropylmalic acid (as an internal standard),
2-bromohypoxanthine (as an internal standard) and
10-camphorsulfonic acid (as an internal standard) were purchased
from Sigma-Aldrich; Merck KGaA (Darmstadt, Germany). 1,5-AG and
octanoic acid were acquired from Wako Pure Chemical Industries,
Ltd. (Osaka, Japan). Dilauroylphosphatidylcholine (PC12:0/12:0) (as
an internal standard) was obtained from Avanti Polar Lipids, Inc.
(Alabaster, AL, USA).
GC/MS procedures
The GC/MS extraction and derivatization procedures
were performed according to the methods described in our previous
studies (20–22,27). A
total of 20 µl of each sample was dispensed into a 1.5-ml Eppendorf
tube. The samples were then extracted with 250 µl methanol with or
without the corresponding stable isotopes, prior to being shaken in
a vortex mixer. A total of 10 µl 2-isopropylmalic acid (0.5 mg/ml)
was added as an internal standard. The mixture was incubated at
1,200 rpm for 30 min at 37°C. The mixture was centrifuged at 19,300
× g for 5 min at 4°C and 200 µl supernatant was transferred to a
new Eppendorf tube capped with a pierced cap. Subsequent to being
centrifuged for 30 min in a vacuum concentrator (Thermo SpeedVac;
Thermo Fisher Scientific, Inc., Waltham, MA, USA), the mixture was
freeze-dried overnight. For the derivatization, 80 µl methoxamine
hydrochloride in pyrimidine (20 mg/ml) were added as the first
derivatizing agent. The mixture was subsequently incubated at 1,200
rpm for 90 min at 30°C. The second derivatizing agent, 40 µl
N-methyl-N-(trimethylsilyl)trifluoroacetamide, was added and the
mixture was incubated at 1,200 rpm for 30 min at 37°C. The mixture
was centrifuged at 19,300 × g for 5 min at 25°C, and the
supernatant was transferred to a vial for analysis by GC/MS. The
GC/MS analysis was performed on a GCMS-TQ8040 GC-MS/MS system
(Shimadzu Corporation, Kyoto, Japan) with a fused silica capillary
column (BPX5; inner diameter: 30 m × 0.25 mm; film thickness, 0.25
µm; SGE Analytical Science, Melbourne, Australia). The data
processing was performed according to previously described methods
(21,22,27). The
MS data were exported to a personal computer, on which the GCMS
solution software ver. 4.30 (Shimadzu Corporation) had been
installed, and the peaks of the targeted metabolites and the
corresponding stable isotopes were detected by the software and
subsequently checked manually. According to the methods described
in our previous study (22), quality
control plasma samples were prepared to ensure the reproducibility
of the acquired metabolomic data. In the analysis of the quality
control plasma samples, coefficients of variation (CV) for the
ratio of the peak area value for each metabolite to that for the
internal standard were calculated, following the exclusion of
metabolites with a CV >30%. In the semi-quantitative analysis,
the peak intensity of each metabolite was normalized to that of the
internal standard. In the GC/MS-based quantitative analysis of the
targeted metabolites (octanoic acid and 1,5-AG), the peak area of
each metabolite was corrected using the data for the corresponding
stable isotope ([U-13C6 (98%)]-labeled 1,5-AG
and [1-13C]-labeled Octanoic acid), and quantitation was
conducted based on multi-point calibration curves.
LC/MS procedures
For the LC/MS-based hydrophilic metabolite analysis,
20 µl of each sample was mixed with 900 µl of a solvent mixture
(H2O:CHCl3:methanol, 1:1:2.5) containing 1 mM
2-bromohypoxanthine and 1 mM 10-camphorsulfonic acid as internal
standards. The mixture was agitated at 1,400 rpm for 30 min at
37°C. Subsequently, 630 µl of the supernatant was transferred to a
new Eppendorf tube, and 280 µl distilled water was added to the
tube. Subsequent to being mixed, the mixture was centrifuged at
16,000 × g for 5 min at 4°C, and 500 µl of the resultant
supernatant was passed through an ultrafiltration filter, prior to
being centrifuged at 14,000 × g for 60 min at 4°C. The collected
solution was dried via centrifugal concentration and
lyophilization, and reconstituted with 100 µl water. The resultant
supernatant was subjected to analysis. For the LC/MS-based lipid
analysis, 10 µl of each sample was mixed with 80 µl methanol and 10
µl 500 ppb PC12:0/12:0 dissolved in methanol as an internal
standard. The mixture was put on ice for 10 min. Following
centrifugation at 16,000 × g for 5 min at 4°C, 60 µl of the
supernatant was transferred to a new Eppendorf tube and subjected
to analysis.
According to the method described in our previous
studies (20,27), the LC/MS analysis was performed using
a Nexera LC system (Shimadzu Corporation) equipped with two LC-30AD
autosamplers, a CTO-20AC column oven and a CBM-20A control module,
coupled with an LCMS-8040 triple quadruple mass spectrometer
(Shimadzu Corporation). The analytical conditions of LC/MS were as
follows: Electrospray voltage: 3.5 kV, −3.5 kV; Curve desolvation
line (CDL): 250°C; Heat block temperature: 400°C; Nebulizing gas
(N2): 3.0 l/min; Drying gas pressure: 15 l/min; CID gas
(Argon) pressure: 0.23 MPa. The cationic hydrophilic metabolites
were separated using a pentafluorophenyl column (Discovery HS F5;
150×2.1 µm; 3 µm; Supelco, Inc., Bellefonte, PA, USA) with a guard
column (20×2.1 µm; 3 µm; GL Sciences, Inc., Tokyo, Japan), while
the anionic hydrophilic metabolites were separated using an
octadecylsilylated silica column (InertSustain C18; 150×2.1 µm; 3
µm; GL Sciences, Inc., Tokyo, Japan). The mobile phase used for the
analysis of the cationic metabolites was composed of A: 0.1% formic
acid in water and B: 100% Acetonitrile. The flow rate was 0.3
ml/min, and the column oven temperature was set at 40°C. The
gradient program for mobile phase B was as follows: 0 min, 0%; 7
min, 0%; 20 min, 40%; 20.1 min, 100%; 25 min, 100%; 25.1 min, 0%;
and 35 min, 0%. The mobile phase used for the analysis of the
anionic metabolites was composed of A: Water containing 15 mM
acetic acid and 10 mM tributylamine, and B: 100% Methanol. The flow
rate was 0.3 ml/min, and the column oven temperature was set at
35°C. The gradient program for mobile phase B was as follows: 0
min, 0%; 0.5 min, 0%; 20 min, 75%; 20.1 min, 98%; 24 min, 98%; 24.1
min, 0%; and 30 min, 0% (28). The
m/z value and retention time for each metabolite are listed in our
previous studies (28). Lipids were
separated using an octadecylsilylated silica column (InertSustain
C18, 100×2.1 µm; 3 µm; GL Sciences, Inc.) with a guard column (10×3
µm; 5 µm; GL Sciences). The mobile phase used for the lipid
analysis consisted of A: 20 mM ammonium acetate in water and B:
100% Methanol. The flow rate was 0.4 ml/min, and the column oven
temperature was set at 40°C. The gradient program for mobile phase
B was as follows: 0 min, 80%; 13 min, 98%; 30 min, 98%; 30.1 min,
80%; and 35 min, 80%. The aforementioned metabolites were mainly
analyzed based on their physicochemical properties and/or spectral
similarity with the molecules included in public/commercial
spectral libraries (putative annotation), which are shown in our
previous studies (28), as chemical
reference standards could not be obtained.
Statistical analysis
Data are presented as mean ± standard deviation.
Univariate analyses were performed by conducting comparisons of
treatment efficacy using the Mann-Whitney U test. Pearson's
χ2 test was used to evaluate the differences between
groups for categorized variables. The unpaired Student's t-test was
used to measure the means and relationships of continuous
variables. Receiver operating characteristic (ROC) curve analysis
was used to evaluate the diagnostic performance of the targeted
metabolites based on their area under the curve (AUC), sensitivity
and specificity values. The optimal cut-off values for the selected
serum metabolites were determined from their ROC curves. The Youden
index was used to determine the optimal cut-off values for each
serum metabolite (29). In univariate
analysis of the selected serum metabolites, the likelihood ratio
test was used to evaluate P-values. The time to progression (TTP)
was analyzed using Cox proportional hazards regression analysis and
the Kaplan-Meier method. TTP estimates were compared using the
log-rank test. The patients who were lost to follow-up were
evaluated using the data at the date of the last follow-up.
P<0.05 was considered to indicate a statistically significant
difference. Kaplan-Meier curves were produced using the package
‘survival’ for R. The log-rank test was performed using the
statistical software R ver. 1.37 (http://www.jichi.ac.jp/saitama-sct/SaitamaHP.files/statmedOSX.html)
(27,30). The other analyses were performed using
the default conditions of JMP 11 (SAS Institute, Inc., Cary, NC,
USA).
Results
Patient characteristics and serum
samples
A total of 31 patients with CRC participated in the
present study, and all were treated with chemotherapy, namely
cetuximab plus irinotecan or cetuximab alone. The median duration
of the follow-up period was 781.5 days, and the median survival
time was 390 days. The median TTP was 152 days. In total, 123 serum
samples were collected from the patients prior to the first to
fourth rounds of treatment (days 1, 8, 15 and 22) (Fig. 1). One patient succumbed prior to
providing a fourth sample.
Evaluation of treatment responses
GC/MS
The therapeutic responses of the subjects are
summarized in Table I. The overall
survival period, progression-free survival and time to progression
differed significantly between the partial response (PR) and
non-partial response (non-PR) groups (P=0.028, P=0.043 and P=0.047,
respectively), whereas there were no significant differences
observed with regard to gender, age and body mass index. None of
the patients achieved a complete response. A total of 7 patients
(22.6%) achieved a PR, while 14 patients (45.2%) experienced stable
disease and 9 patients (29.0%) experienced progressive disease.
Only 1 patient (3.2%) could not be evaluated due to mortality prior
to the first CT scan. The aim of the present study was to compare
the serum levels of metabolites between the PR and non-PR groups.
Therefore, the patient that could not be evaluated was included in
the non-PR group, and overall, a total of 24 patients (77.4%) were
classed as non-PR.
 | Table I.Patient characteristics and
evaluation of the response to chemotherapy. |
Table I.
Patient characteristics and
evaluation of the response to chemotherapy.
| Variables | PR | Non-PR | P-value |
|---|
| Total, n | 7 | 24 |
|
| Sex, n |
|
| 0.784a |
|
Male | 5 | 16 |
|
|
Female | 2 | 8 |
|
| Median age (range),
years | 67.0 (48–77) | 64.5 (51–79) | 0.607b |
| PS, n |
|
| 0.664a |
| 0 | 2 | 9 |
|
| 1 | 5 | 15 |
|
| BMI | 21.2 | 21.6 | 0.499 b |
| Group,
nc |
|
| 0.247a |
| A | 7 | 20 |
|
| B | 0 | 4 |
|
| OS, days | 433 | 336 | 0.028d |
| PFS, days | 253 | 165.5 | 0.043d |
| TTP, days | 162 | 102.5 | 0.047d |
In the GC/MS-based semi-quantitative analysis, a
total of 111 metabolites were detected in the serum samples. The
serum levels of each metabolite were compared between the PR and
non-PR groups using the Mann-Whitney U test to determine their
associations with the therapeutic response. The serum levels of two
metabolites, including octanoic acid and 1,5-AG, exhibited
significant intergroup differences [octanoic acid; P=0.030, 1,5-AG;
P=0.006, data not shown] prior to the first round of treatment.
To obtain quantitative data, a targeted metabolome
analysis was performed using the corresponding stable isotopes.
Stable isotope labeling can be used to achieve a more accurate
quantification (31). The serum
levels of octanoic acid and 1,5-AG, which were analyzed, along with
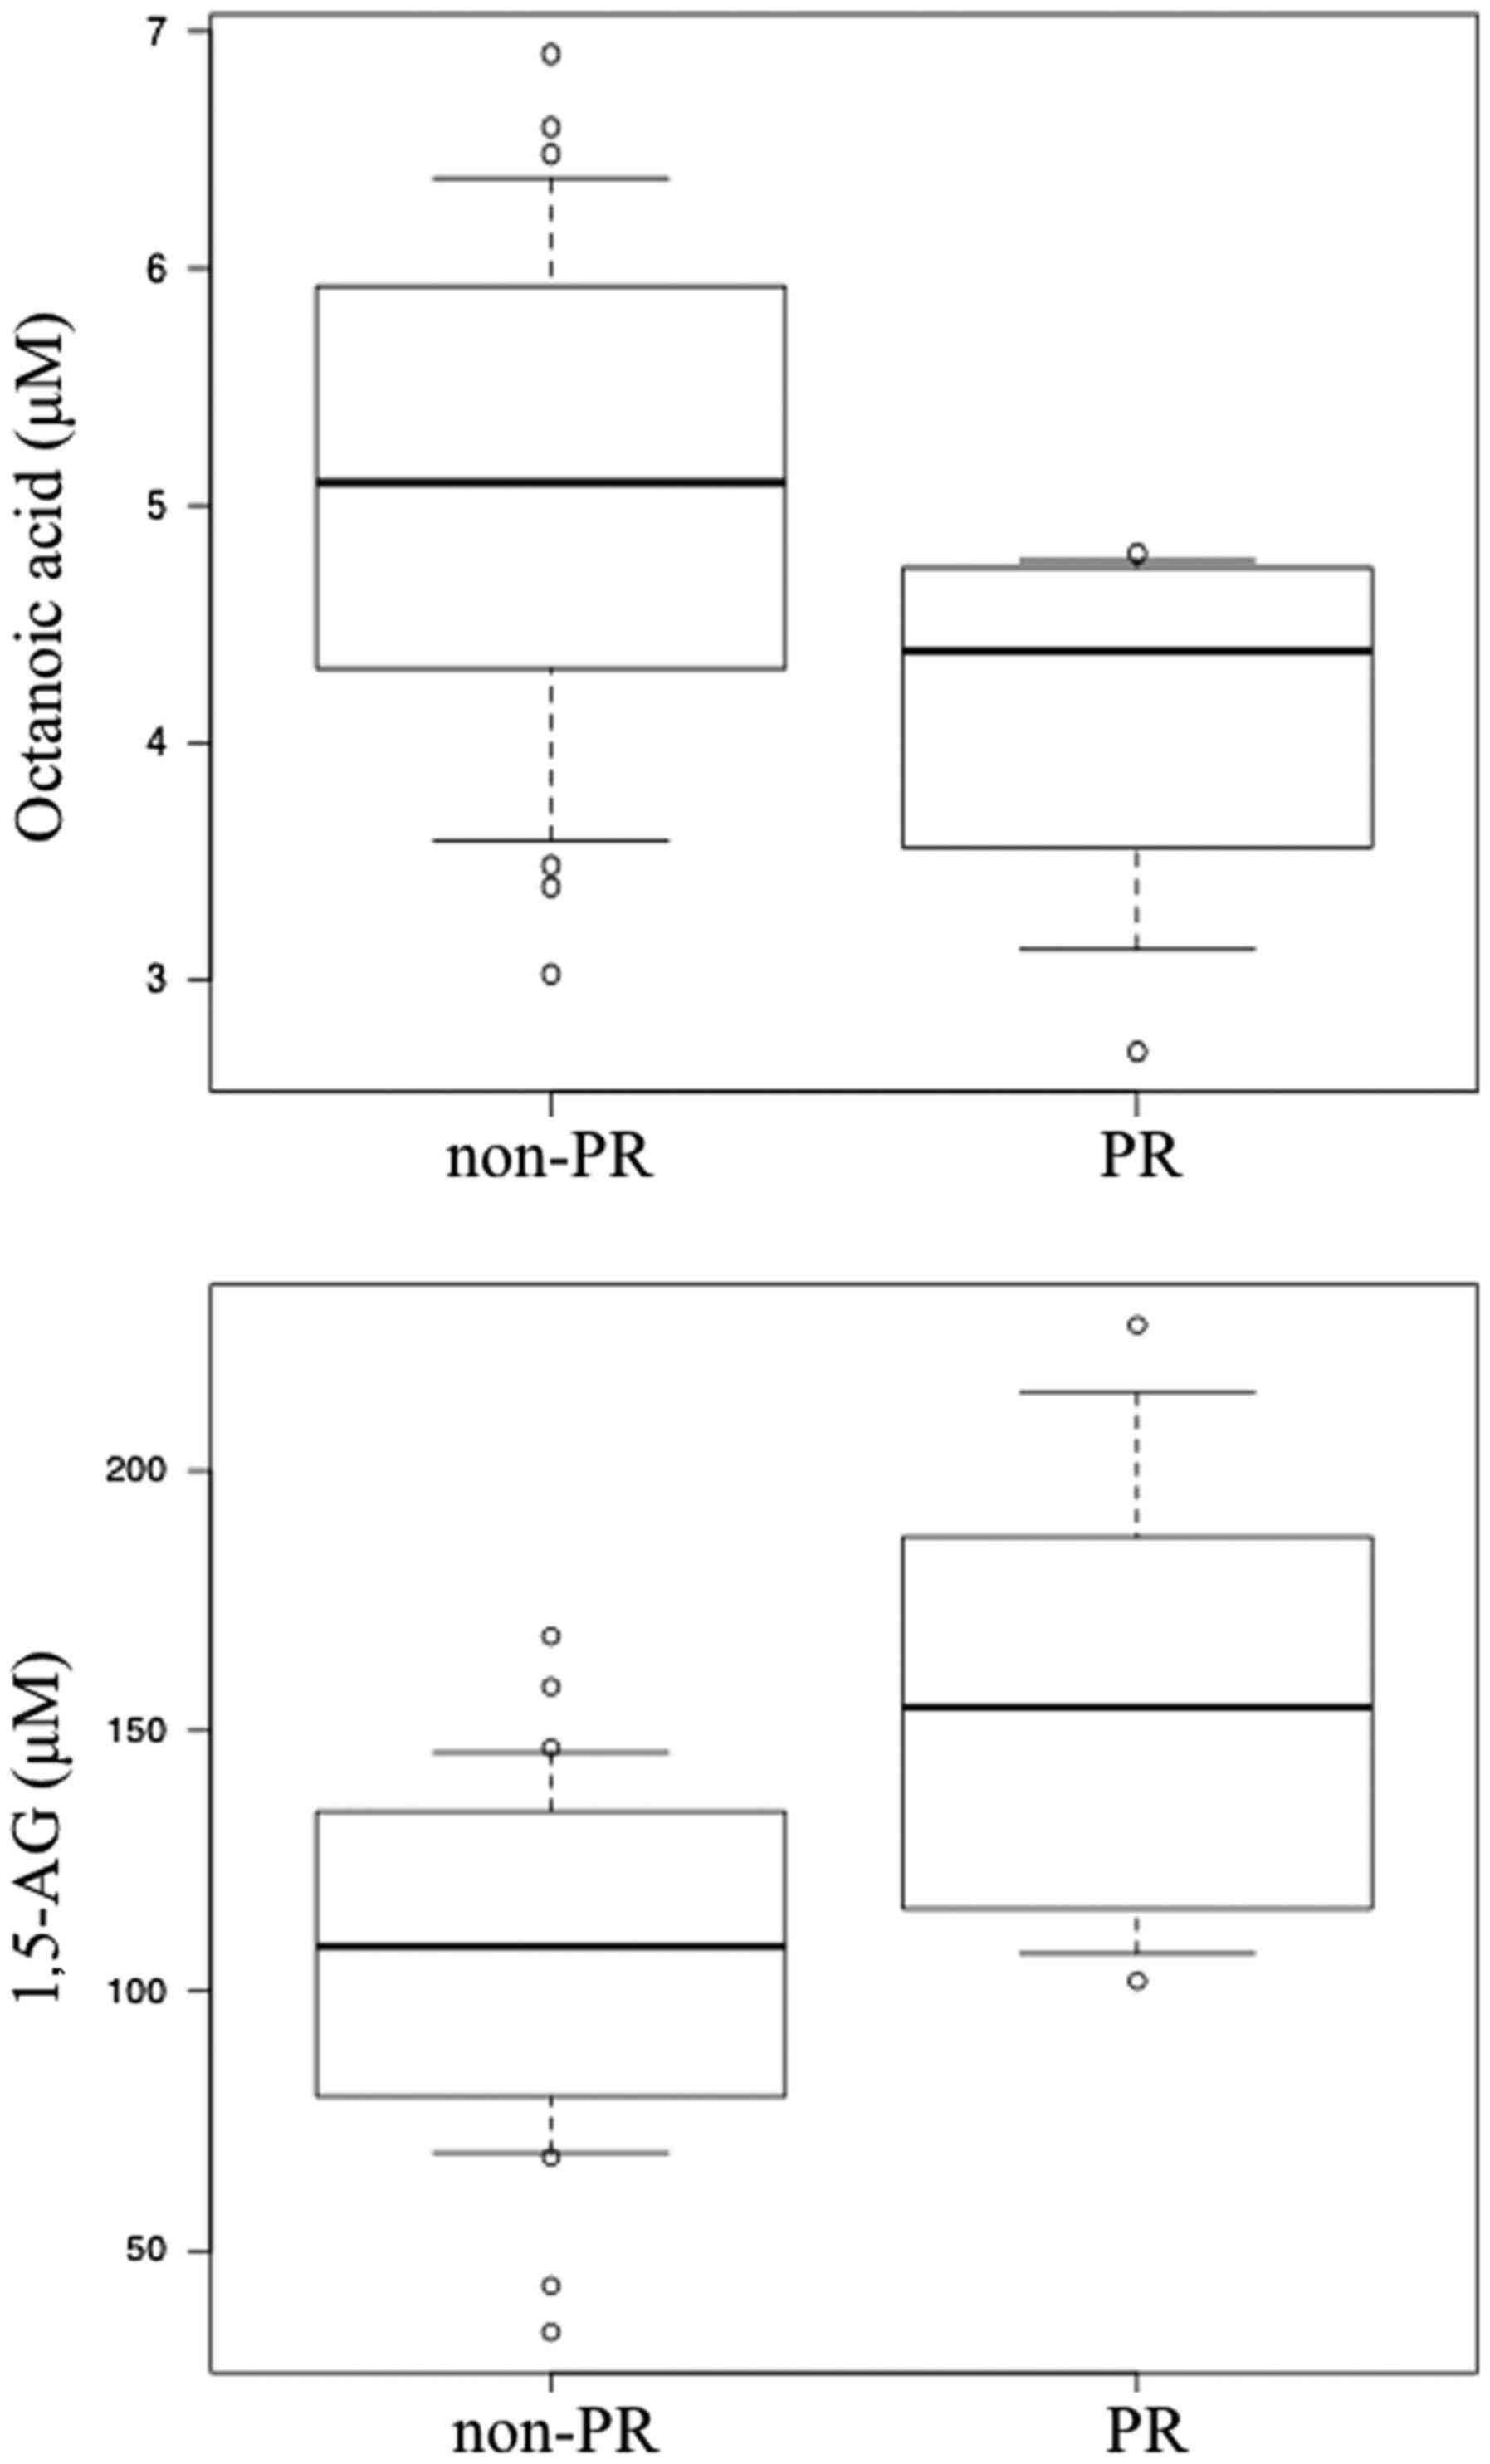
their respective results are indicated in Table II. Box plots of the serum levels of
these two metabolites in the PR and non-PR groups are presented in
Fig. 2. In the quantitative analysis,
it was indicated that the PR group exhibited significantly lower
serum levels of octanoic acid compared with the non-PR group
(P=0.043). By contrast, the serum level of 1,5-AG was significantly
higher in the PR group compared with the non-PR group (P=0.026;
Table II).
| Table II.Quantitative analysis of the targeted
metabolites using gas chromatography/mass spectrometry. |
Table II.
Quantitative analysis of the targeted
metabolites using gas chromatography/mass spectrometry.
|
| PR (n=7) | Non-PR (n=24) |
|
|
|---|
|
|
|
|
|
|
|---|
| Metabolite | Mean, µM | SD | Mean, µM | SD |
Fold-changea |
P-valueb |
|---|
| Octanoic acid |
4.09 |
0.82 |
5.06 |
1.07 | 0.81 | 0.043 |
| 1,5-AG | 155.78 | 48.42 | 106.78 | 34.25 | 1.46 | 0.026 |
To evaluate the predictive accuracy of serum
metabolite levels for predicting the efficacy of treatment for CRC,
the AUC, sensitivity and specificity values were calculated for
octanoic acid and 1,5-AG via ROC analysis. The optimal cut-off
values for each serum metabolite were determined using the Youden
index. The sensitivity, specificity and AUC of octanoic acid were
100%, 62.5%, and 0.77 µM, respectively. The sensitivity,
specificity and AUC of 1,5-AG were 57.1%, 91.7%, and 0.78 µM,
respectively. Therefore, octanoic acid and 1,5-AG exhibited
moderate predictive accuracy (Table
III). TTP was subsequently analyzed to evaluate the prognosis
of the subjects. Disease progression was observed in 14 of the 31
patients during the observation period, and the median TTP was 162
days in the PR group and 102.5 days in the non-PR group (Table I).
| Table III.Predictive accuracy of the targeted
metabolites. |
Table III.
Predictive accuracy of the targeted
metabolites.
| Metabolite | AUC (95% CI) | Sensitivity, % | Specificity, % | Cut-off value,
µMa |
|---|
| Octanoic acid | 0.77
(0.59–0.95) | 100.0 | 62.5 |
4.8 |
| 1,5-AG | 0.78
(0.57–0.99) |
57.1 | 91.7 | 154.5 |
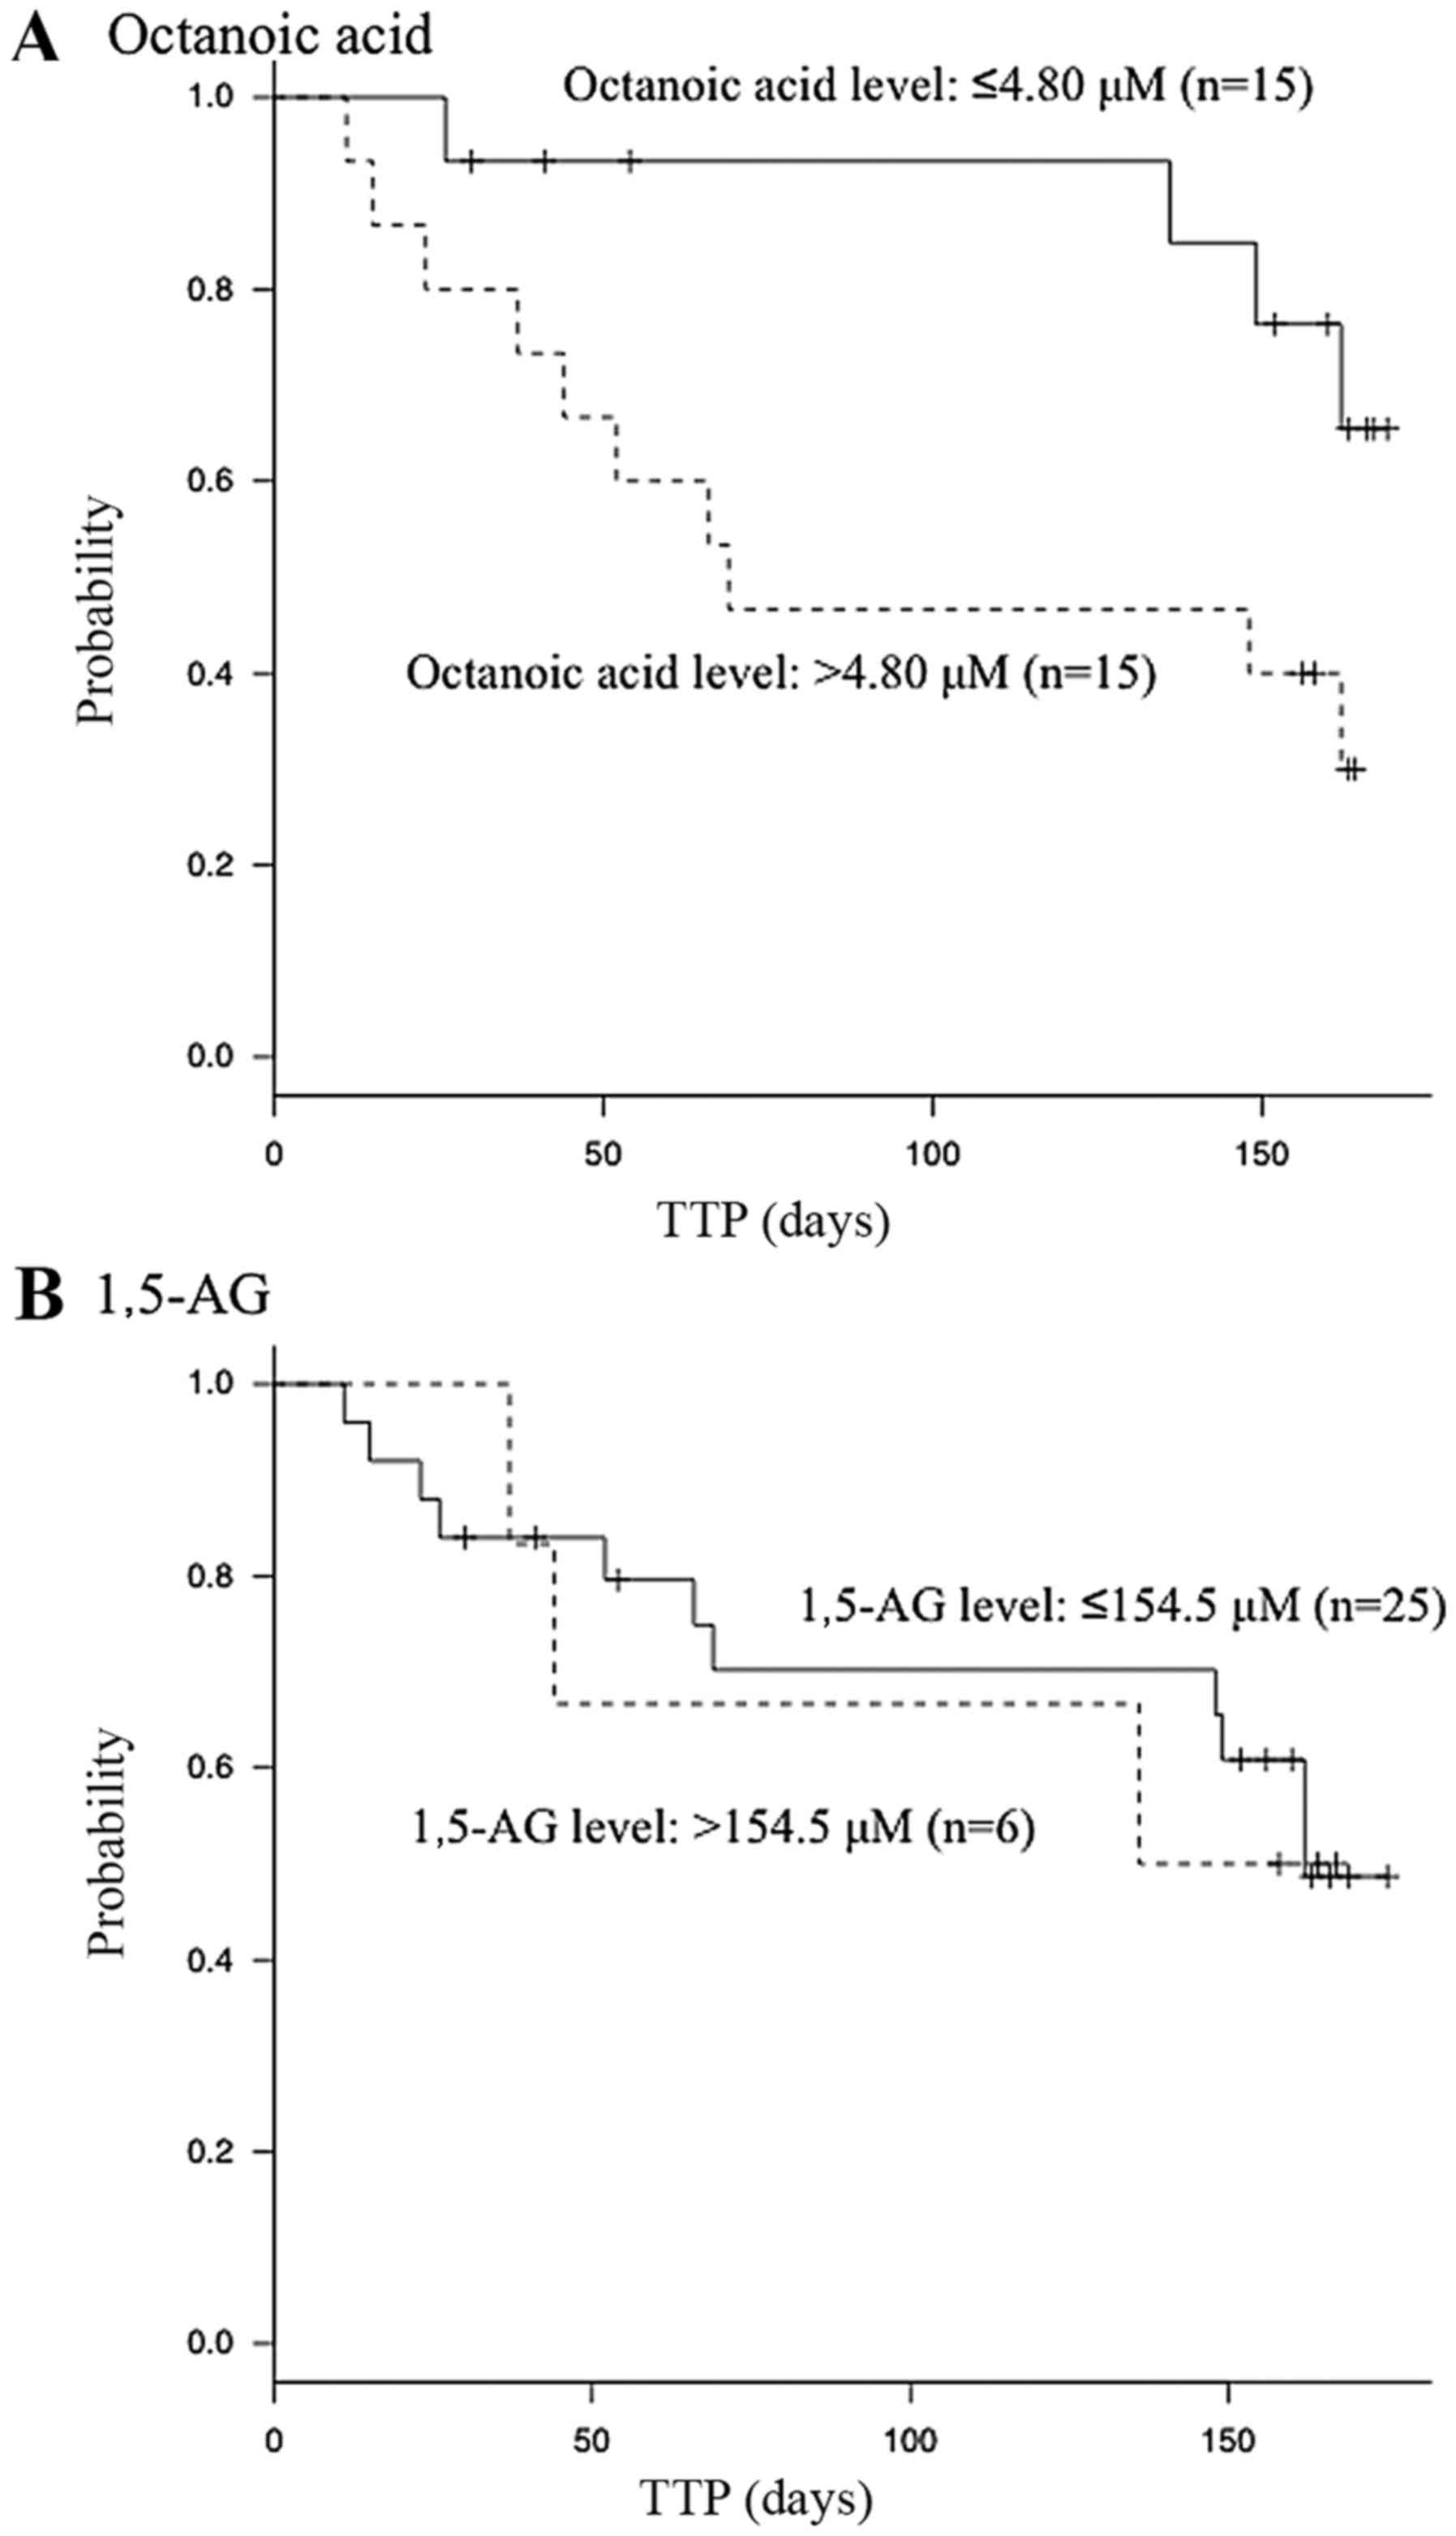
Cox proportional hazards regression analysis was
performed using the serum levels of octanoic acid and 1,5-AG, whose
optimal cut-off values were determined from their ROC curves. Only
the serum level of octanoic acid was indicated to be significantly
associated with the TTP in the univariate analyses [≤4.80/>4.80
µM; hazard ratio, 3.3; 95% confidence interval (CI), 1.1–12;
P=0.033; Table IV). Kaplan-Meier
analysis indicated that the patients with lower serum octanoic acid
levels achieved better prognoses compared with those with higher
serum octanoic acid levels (Fig. 3).
By contrast, the serum level of 1,5-AG was not indicated to be
significantly associated with the TTP in the univariate analyses
(≤154.5/>154.5 µM; hazard ratio, 1.1; 95% CI, 0.35–4.92; P=0.87;
Table IV).
| Table IV.Cox proportional hazards regression
analysis of the associations between serum metabolite
concentrations and the time to progression. |
Table IV.
Cox proportional hazards regression
analysis of the associations between serum metabolite
concentrations and the time to progression.
|
|
| Univariate
analysis |
|---|
|
|
|
|
|---|
| Metabolite | Cut-off value,
µM | Hazard ratio | 95% CI |
P-valuea |
|---|
| Octanoic acid | ≤4.80/>4.80 | 3.3 |
1.10–11.84 |
0.0325 |
| 1,5-AG |
≤154.5/>154.5 | 1.1 | 0.35–4.92 | 0.869 |
Furthermore, the changes in the levels of the
targeted metabolites in the serum samples that were obtained from
the first to the fourth round of treatment are indicated in
Table V. The concentration of
octanoic acid remained almost the same from prior to the first
round of treatment to the fourth round of treatment in the PR and
non-PR groups. By contrast, the concentration of 1,5-AG was higher
in the PR group compared with that in the non-PR group throughout
the treatment period, although its concentration in the PR group
gradually decreased. Although the serum levels of the metabolites
differed significantly between the groups prior to treatment, none
of the metabolites exhibited significant intergroup differences in
their serum levels following treatment.
| Table V.Concentrations of the targeted
metabolites according to quantitative analysis. |
Table V.
Concentrations of the targeted
metabolites according to quantitative analysis.
| A, Octanoic
acid |
|---|
|
|---|
| Groups | 1st
rounda | 2nd round | 3rd round | 4th round |
|---|
| PR | 4.09
(1.00) | 4.79
(1.03) | 4.44
(0.96) | 5.27
(1.14) |
| Non-PR | 5.06
(1.00) | 5.23
(1.03) | 5.22
(1.03) | 4.92
(0.97) |
|
P-valueb | 0.043 | 0.391 | 0.189 | 0.901 |
|
| B,
1,5-AG |
|
| Groups | 1st
rounda | 2nd
round | 3rd
round | 4th
round |
|
| PR | 155.78 (1.00) | 145.09 (0.93) | 116.24 (0.75) | 117.05 (0.75) |
| Non-PR | 106.78 (1.00) | 106.44 (1.00) | 108.81 (1.02) | 101.58 (0.95) |
|
P-valueb | 0.026 | 0.084 | 0.678 | 0.469 |
Evaluation of treatment responses:
LC/MS
A total of 200, 28 and 21 metabolites were detected
in the serum samples during the LC/MS-based semi-quantitative
lipid, anion and cation analyses, respectively. There were a number
of metabolites whose serum levels differed significantly between
the PR and non-PR groups prior to the first round of therapy; 18 of
these metabolites were detected in the LC/MS-based lipid analysis,
and 1 metabolite, glutaconic acid, was detected in the LC/MS-based
anion analysis (Table VI). By
contrast, none of the metabolites detected during the LC/MS-based
cation analysis exhibited significant pretreatment intergroup
differences in their serum levels. A quantitative analysis of the
serum levels of the 18 metabolites detected in the LC/MS-based
lipid analysis or the metabolite (glutaconic acid) detected in the
LC/MS-based anion analysis could not be performed, as it was
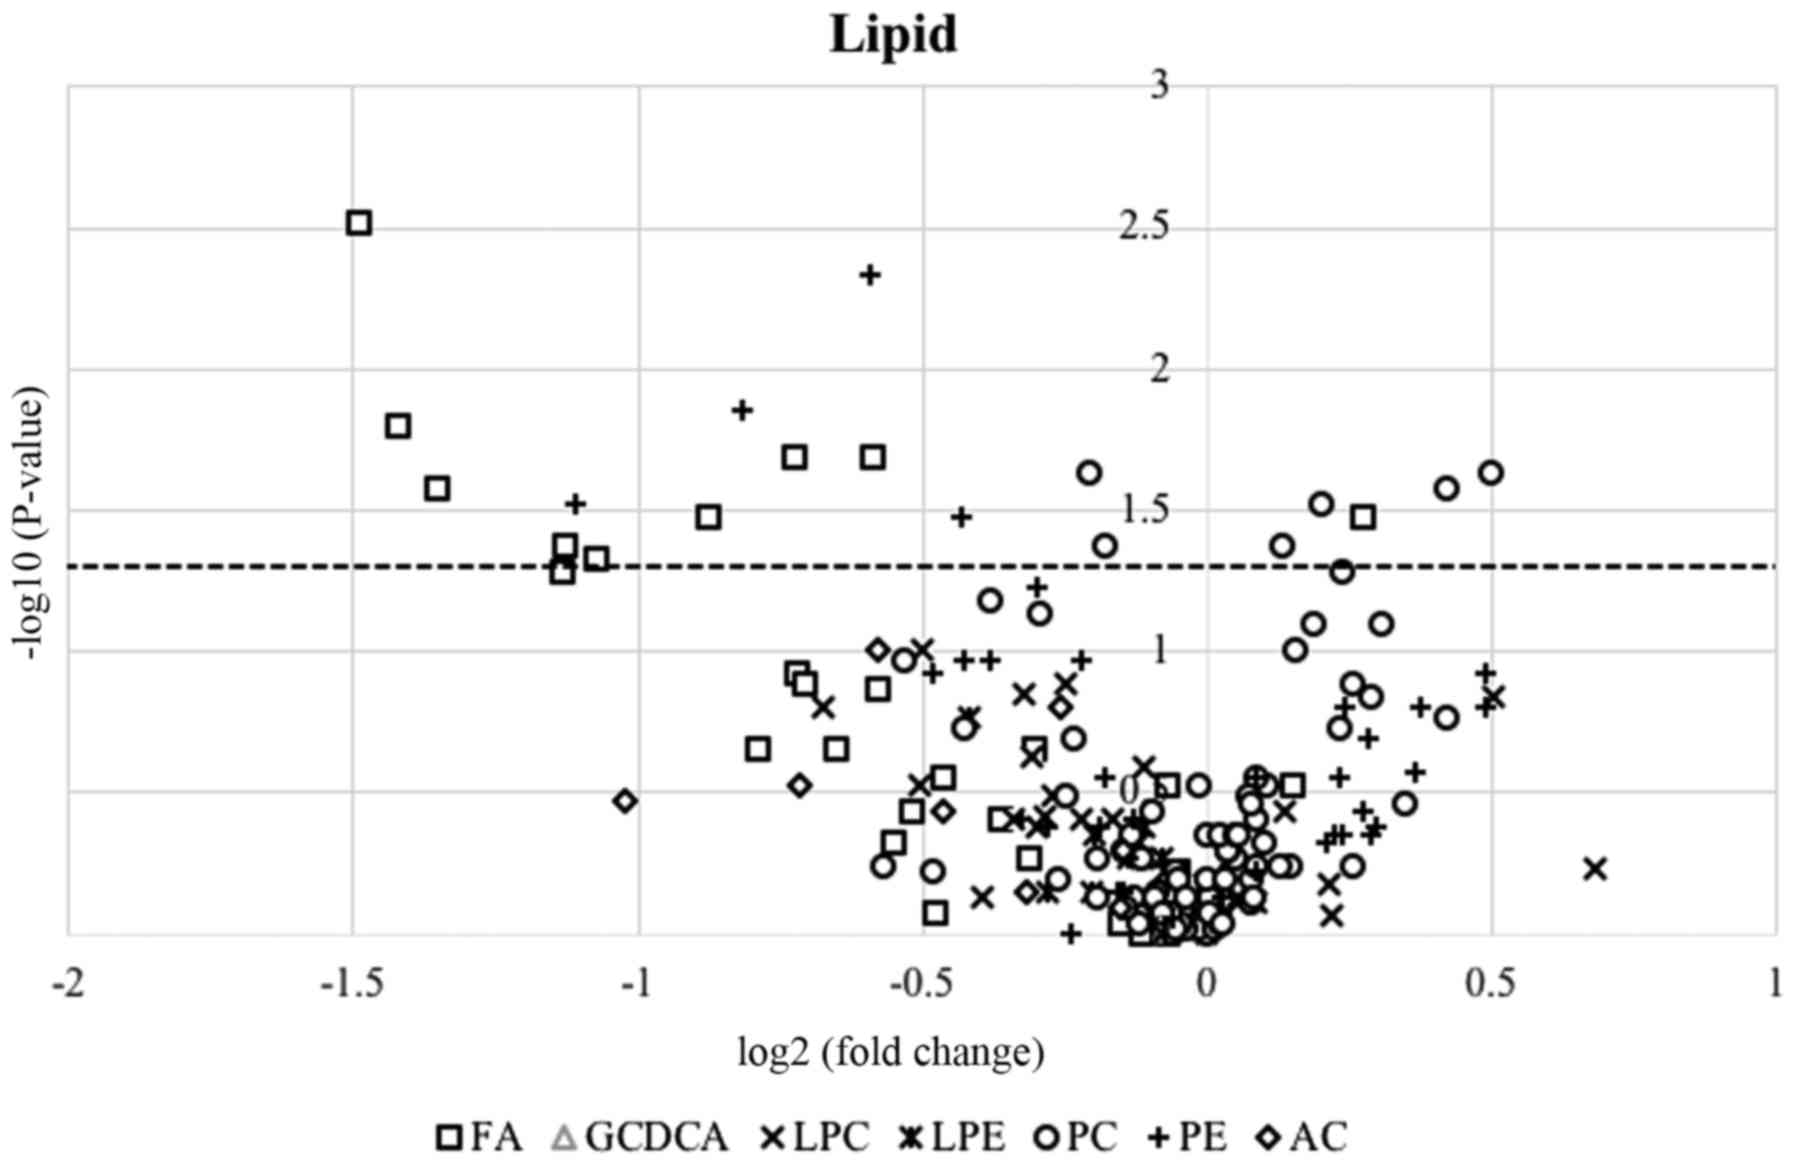
difficult to obtain corresponding stable isotopes. The association
between the therapeutic response and the serum levels of lipid
species was examined. The resultant volcano plot of all of the
lipid species detected in the present study indicated that the
serum levels of fatty acids tended to be downregulated following
treatment (Fig. 4), although the
serum levels of a number of the other aforementioned lipid
metabolites did not change significantly. This tendency was
particularly pronounced for unsaturated fatty acids,
polyunsaturated fatty acids (PUFAs) and monounsaturated fatty acids
(Table VII). In the LC/MS-based
lipid analysis conducted in the present study, free PUFAs were
detected in the sera, and the serum levels of unsaturated fatty
acids, in particular PUFAs, were higher in the non-PR group
compared with those in the PR group. In fact, greater therapeutic
effects tended to be observed in the patients with lower serum PUFA
levels.
| Table VI.The significantly-altered metabolites
in LC/MS-based semi-quantitative lipid and anion analysis. |
Table VI.
The significantly-altered metabolites
in LC/MS-based semi-quantitative lipid and anion analysis.
|
| PR (n=7) | Non-PR (n=24) |
|
|
|---|
|
|
|
|
|
|
|---|
| Metabolomics | Mean | SD | Mean | SD |
Fold-changea |
P-valueb |
|---|
| Lipid analysis |
| Fatty
acids |
|
18:1
(n-9)_trans-elaidic acid and (n-7)_trans-vaccenic acid | 0.1611 | 0.0354 | 0.1334 | 0.0991 | 1.208 | 0.042 |
|
18:2
(n-6)_linoleic acid | 39.2849 | 3.5305 | 44.5618 | 6.6877 | 0.882 | 0.047 |
|
20:2
(n-6)_cis-11-14-eicosadienoic acid | 0.8759 | 0.4409 | 1.8429 | 1.3528 | 0.475 | 0.026 |
|
20:4
(n-6)_arachidonic acid | 0.0097 | 0.0031 | 0.0271 | 0.0206 | 0.356 | 0.021 |
|
22:4
(n-6)_docosatetraenoic acid | 0.0331 | 0.0106 | 0.0846 | 0.0647 | 0.391 | 0.003 |
|
20:1
(n-9)_cis-11-eicosenoic acid | 3.1298 | 1.4758 | 6.8503 | 5.5053 | 0.457 | 0.016 |
|
24:1
(n-9)_nervonic acid | 0.1312 | 0.0615 | 0.2411 | 0.1377 | 0.544 | 0.034 |
|
26:0_cerotic
acid | 0.0815 | 0.0198 | 0.1228 | 0.0408 | 0.663 | 0.034 |
|
Phosphatidylcholines |
|
PC
(16:0e/18:2) | 0.0074 | 0.0058 | 0.0159 | 0.0112 | 0.465 | 0.023 |
|
PC (16:0/20:4)
& PC (16:1/20:3) | 7.1136 | 0.9062 | 6.4849 | 2.4726 | 1.097 | 0.023 |
|
PC (17:0/16:0)
& PC (18:0/15:0) | 3.6935 | 1.0740 | 2.6142 | 0.9398 | 1.413 | 0.030 |
|
PC
(18:0/20:4) | 0.6628 | 0.0808 | 0.5768 | 0.2268 | 1.149 | 0.042 |
|
PC
(18:1e/18:2) | 0.2680 | 0.0849 | 0.3612 | 0.1006 | 0.742 | 0.026 |
|
PC (18:1e/16:0)
& PC (18:0e/16:1) | 2.8203 | 0.7449 | 2.1057 | 0.7165 | 1.339 | 0.042 |
|
Phosphatidylethanolamines |
|
PE
(16:0/20:4) | 0.1779 | 0.0691 | 0.2674 | 0.0946 | 0.665 | 0.005 |
|
PE
(18:0/20:4) | 0.1160 | 0.0456 | 0.3105 | 0.2602 | 0.374 | 0.034 |
|
PE
(20:0/18:2) | 51.0289 | 5.6977 | 58.8697 | 8.3221 | 0.867 | 0.030 |
|
PE
(20:1/18:2) | 0.0185 | 0.0041 | 0.0327 | 0.0155 | 0.567 | 0.014 |
| Anion analysis |
|
Glutaconic acid | 0.1467 | 0.0618 | 0.0941 | 0.0460 | 1.559 | 0.047 |
| Table VII.Detailed results of the LC/MS-based
semi-quantitative analysis of serum fatty acids. |
Table VII.
Detailed results of the LC/MS-based
semi-quantitative analysis of serum fatty acids.
|
| PR (n=7) | Non-PR (n=24) |
|
|
|---|
|
|
|
|
|
|
|---|
| Serum fatty
acids | Mean | SD | Mean | SD |
Fold-changea |
P-valueb |
|---|
| Saturated fatty
acids |
|
12:0_lauric acid | 0.085 | 0.035 | 0.088 | 0.037 | 0.97 | 0.60 |
|
14:0_myristic acid | 0.223 | 0.084 | 0.277 | 0.148 | 0.81 | 0.54 |
|
15:0_pentadecylic acid | 0.024 | 0.010 | 0.034 | 0.023 | 0.70 | 0.37 |
|
16:0_palmitic acid | 3.736 | 1.627 | 5.473 | 4.126 | 0.68 | 0.48 |
|
17:0_margaric acid | 0.047 | 0.015 | 0.052 | 0.031 | 0.90 | 0.92 |
|
18:0_stearic acid | 3.294 | 0.816 | 4.238 | 2.306 | 0.78 | 0.39 |
|
20:0_arachidic acid | 0.076 | 0.026 | 0.080 | 0.033 | 0.95 | 1.00 |
|
21:0_heneicosanoic acid | 0.026 | 0.015 | 0.027 | 0.012 | 0.96 | 0.92 |
|
22:0_behenic acid | 0.098 | 0.020 | 0.106 | 0.050 | 0.92 | 1.00 |
|
23:0_tricosanoic acid | 0.061 | 0.023 | 0.055 | 0.038 | 1.11 | 0.30 |
|
24:0_lignoceric acid | 0.209 | 0.037 | 0.219 | 0.140 | 0.95 | 0.30 |
|
25:0_pentacosanoic acid | 0.072 | 0.048 | 0.100 | 0.182 | 0.72 | 0.85 |
|
26:0_cerotic acid | 0.161 | 0.035 | 0.133 | 0.099 | 1.21 | 0.03 |
|
27:0_heptacosanoic acid | 0.024 | 0.016 | 0.024 | 0.019 | 0.98 | 0.92 |
| Polyunsaturated
fatty acids |
| 18:2
(n-6)_linoleic acid | 0.876 | 0.441 | 1.843 | 1.353 | 0.48 | 0.05 |
| 20:2
(n-6)_cis-11-14-eicosadienoic acid | 0.033 | 0.011 | 0.085 | 0.065 | 0.39 | 0.03 |
| 20:3
(n-6)_dihomo-γ-linolenic acid and (n-9)_mead acid | 0.036 | 0.016 | 0.054 | 0.030 | 0.67 | 0.13 |
| 20:4
(n-6)_arachidonic acid | 0.178 | 0.069 | 0.267 | 0.095 | 0.67 | 0.02 |
| 22:4
(n-6)_docosatetraenoic acid | 0.010 | 0.003 | 0.027 | 0.021 | 0.36 | 0.00 |
| 22:5
(n-6)_docosapentaenoic acid | 0.099 | 0.074 | 0.162 | 0.128 | 0.61 | 0.13 |
| 18:3
(n-3)_α-linolenic acid and (n-6)_γ-linolenic acid | 0.125 | 0.093 | 0.173 | 0.096 | 0.73 | 0.28 |
| 20:5
(n-3)_eicosapentaenoic acid | 0.051 | 0.033 | 0.063 | 0.027 | 0.81 | 0.22 |
| 22:6
(n-3)_docosahexaenoic acid | 0.122 | 0.066 | 0.203 | 0.093 | 0.60 | 0.02 |
| Monounsaturated
fatty acids |
| 14:1
(n-5)_myristoleic acid | 0.032 | 0.020 | 0.054 | 0.036 | 0.61 | 0.12 |
| 16:1
(n-7)_palmitoleic acid | 0.344 | 0.171 | 0.595 | 0.466 | 0.58 | 0.22 |
| 17:1
(n-7)_cis-10-heptadecanoic acid | 0.085 | 0.045 | 0.134 | 0.096 | 0.64 | 0.22 |
| 18:1
(n-9)_cis-oleic acid and (n-7)_cis-vaccenic acid | 1.305 | 0.603 | 2.867 | 2.314 | 0.46 | 0.05 |
| 18:1
(n-9)_trans-elaidic acid and (n-7)_trans-vaccenic acid | 3.130 | 1.476 | 6.850 | 5.505 | 0.46 | 0.04 |
| 20:1
(n-9)_cis-11-eicosenoic acid | 0.116 | 0.046 | 0.311 | 0.260 | 0.37 | 0.02 |
| 24:1
(n-9)_nervonic acid | 0.131 | 0.061 | 0.241 | 0.138 | 0.54 | 0.03 |
Discussion
Using metabolomics, the present study aimed to
identify serum biomarkers that could be used to predict the
therapeutic efficacy of chemotherapy for CRC during the
pretreatment period. Metabolomics is a useful technique for
identifying metabolites that are directly linked to certain
molecular phenotypes. Therefore, the serum levels of metabolites
were analyzed using GC/MS and LC/MS. In the semi-quantitative
analysis, two metabolites, octanoic acid and 1,5-AG, were
identified as biomarker candidates that could be useful for
predicting the therapeutic efficacy of chemotherapy for CRC. In the
quantitative analysis using the corresponding stable isotopes, it
was indicated that the pretreatment serum levels of these
metabolites differed significantly between the PR and non-PR
groups. However, only the serum level of octanoic acid was
significantly associated with the TTP, and the patients with lower
serum octanoic acid levels exhibited good prognoses.
Narayanan et al (32) indicated that caprylic acid had
inhibitory effects on the viability of colorectal, skin and breast
cancer cells in vitro. In addition, the study reported that
caprylic acid downregulated the expression of genes that are
important for cell cycle division and progression in colon cancer
cells, including cyclin-dependent kinase 2 (CDK2), CDK4, cyclin A2
(CCNA2) and CCND1. In another study, cetuximab increased the
expression levels of the CDK inhibitors p21 and p27, and decreased
the expression level of cyclin D1 by arresting the cell cycle in
the G1/G0 phase (33). Based on the aforementioned findings,
octanoic acid may have synergistic effects when administered in
combination with cetuximab. The present study demonstrated that
patients with lower serum levels of octanoic acid exhibited better
prognoses compared with patients with higher serum octanoic acid
levels. Yamasaki et al (34)
indicated that 3 mM octanoic acid reduced bladder cancer cell
proliferation, but did not inhibit cell migration and invasion.
There have been numerous studies on biomarkers of CRC involving
metabolomic analysis (35,36); however, to the best of our knowledge,
there is a limited number of studies on octanoic acid as a
biomarker candidate or on the association between the levels of
octanoic acid and the prognosis of CRC. Uchiyama et al
(37) performed serum metabolomic
analysis using capillary electrophoresis-time of-flight MS in order
to identify biomarkers that may be used for the early detection of
CRC. As a result, it was indicated that the serum level of octanoic
acid increased with the clinical stage of CRC, but the diagnostic
power of octanoic acid alone for detecting cancer did not suffice.
Conversely, it was demonstrated that the serum level of octanoic
acid was higher in patients with colorectal adenoma compared with
that in the controls, so octanoic acid may be a useful biomarker
for diagnosing adenoma. Octanoic acid is a dietary metabolite.
Jansen et al (38) reported
that the intake of full fat products, which contain saturated fatty
acids, including octanoic acid, increases the risk of pancreatic
cancer in a dose-dependent manner. However, to the best of our
knowledge, no studies examining the influence of full fat products
or octanoic acid on the risk of CRC have been reported, and
therefore, further investigation is required.
1,5-AG is a non-metabolizable glucose analogue that
is found in plasma (39). The plasma
1,5-AG level has been proposed as a marker of glycemic control in
patients with diabetes. In addition, hyperinsulinemia and insulin
resistance have been reported as risk factors for cancer, including
CRC (40). In the present study, the
patients with lower serum levels of 1,5-AG exhibited worse
prognoses compared with the patients with higher serum 1,5-AG
levels. It is unlikely that this result was affected by the
frequency of pretreatment diabetes, as only 1 of the 31 patients
had a medical history of diabetes. By contrast, Meyerhardt et
al (41) suggested that a higher
dietary glycemic load and a greater total carbohydrate intake had
significant associations with an increased risk of recurrence and
mortality in patients with stage III CRC, based on investigations
of the dietary habits of patients and the calculation of glycemic
index values. These results are consistent with the findings of the
present study indicating that patients with lower serum levels of
1,5-AG exhibited worse prognoses. However, further studies are
required in order to fully elucidate these associations.
It has been reported that n-3 PUFAs have
anti-inflammatory and anticancer effects, the latter of which
involve the enhancement of oxidative stress in cancer cells
(42,43). In addition, n-3 PUFAs enhance the
efficacy of treatment in a dose-dependent manner when combined with
chemotherapy and radiotherapy (44,45). By
contrast, n-6 PUFAs promote colorectal carcinogenesis via
inflammation and peroxidation (46,47). In
the LC/MS-based lipid analysis conducted in the present study,
greater therapeutic effects were observed in the patients with
lower serum PUFA levels. One possible explanation for these
findings is that n-6 PUFAs, which are linked with carcinogenesis,
make a greater contribution to therapeutic responses compared with
n-3 PUFAs. Furthermore, Hardy et al (48) confirmed that the effects of free fatty
acids on breast cancer (e.g., on proliferation and apoptosis)
depended on the types of fatty acids and the relative frequencies
of oleic acid and palmitic acid. According to the aforementioned
findings, not only the concentration of each fatty acid, but also
the proportions of each type of fatty acid, including saturated,
monounsaturated and polyunsaturated, may influence carcinogenesis
and proliferation in CRC, and hence, could affect therapeutic
efficacy.
The present study presented with a number of
limitations. First, the serum levels of the targeted metabolites
may have been changed not only by the chemotherapy, but also by the
decline in the general condition of the patients due to their
underlying diseases. In the present study, the serum samples were
obtained from patients with CRC for which second-line chemotherapy
had failed and who therefore may have had subclinical organ
disorders. Therefore, the serum levels of the targeted metabolites
may have exhibited a more distinct change in the event that serum
samples were used from patients who had been treated with cetuximab
plus irinotecan, or cetuximab alone as a first-line chemotherapy.
Secondly, it is unclear whether the aforementioned biomarkers are
specific to cetuximab therapy or whether they are applicable to all
chemotherapies for CRC. Thirdly, it was difficult to evaluate why
the aforementioned serum metabolites appeared to be useful as
biomarkers for predicting the efficacy of chemotherapy in patients
with CRC due to the limited number of existing studies. Fourthly,
the number of samples was low as the study was attached to a phase
II trial of chemotherapy. Fifth, the diagnostic power of these
metabolites was not validated using other cohorts. Therefore, a
further large-scale study is required to evaluate the results of
the present study.
The aim of the present study was to establish
biomarkers for predicting the efficacy of chemotherapy for CRC. The
serum metabolite levels were analyzed in patients with CRC who were
treated with chemotherapy consisting of cetuximab plus irinotecan
or cetuximab alone. In such patient cases, changes in metabolite
concentrations can be induced by treatment and/or disease
progression. Therefore, it may be difficult to identify such
biomarkers following treatment, and therefore the study focused on
serum metabolites that could be used as predictive biomarkers prior
to treatment. As a result, octanoic acid and 1,5-AG were identified
as biomarker candidates for predicting the efficacy of chemotherapy
for CRC. In the quantitative analysis, the serum concentrations of
octanoic acid and 1,5-AG differed significantly between the PR and
the non-PR groups. In addition, the present study suggests that the
serum concentration of octanoic acid is useful for predicting the
prognosis of patients with CRC. Therefore, the findings of the
present study may aid in improving the quality of life and
prognosis of patients with CRC who are treated with
chemotherapy.
Acknowledgements
Not applicable.
Funding
The present study was supported in part by a
Grant-in-Aid for Scientific Research from the Japan Society for the
Promotion of Science (grant no. 16H05227) and the AMED-CREST
program of the Japan Agency for Medical Research and Development
(grant no. 17gm0710013h0004).
Availability of data and materials
The datasets used and/or analyzed during the current
study are available from the corresponding author on reasonable
request.
Authors' contributions
SN, TK, TH, KK, HS, YM, KH and MY conceived the idea
for the present study, designed the study and assisted in drafting
the manuscript. TI and SF analyzed and interpreted the data. TH,
KK, HS, YM and KH collected the specimens and patient information.
TI wrote the manuscript. All of the authors read and approved the
final manuscript.
Ethics approval and consent to
participate
The present study was approved by the Ethics
Committees of the National Cancer Center Hospital (Tokyo, Japan;
approval no. G2008-005) and Kobe University Graduate School of
Medicine (Kobe, Japan; approval no. 1833) and was performed in
accordance to the principles outlined in the Declaration of
Helsinki for all human and animal experiments. In addition, in the
investigations involving human subjects, written informed consent
was obtained from all subjects.
Patient consent for publication
Informed consent for the publication of any
data/associated images was obtained in from all participants.
Competing interests
The authors declare that they have no competing
interests.
References
|
1
|
Watanabe T, Muro K, Ajioka Y, Hashiguchi
Y, Ito Y, Saito Y, Hamaguchi T, Ishida H, Ishiguro M, Ishihara S,
et al: Japanese Society for Cancer of the Colon and Rectum:
Japanese Society for Cancer of the Colon and Rectum (JSCCR)
guidelines 2016 for the treatment of colorectal cancer. Int J Clin
Oncol. 23:1–34. 2018. View Article : Google Scholar : PubMed/NCBI
|
|
2
|
Moertel CG: Chemotherapy for colorectal
cancer. N Engl J Med. 330:1136–1142. 1994. View Article : Google Scholar : PubMed/NCBI
|
|
3
|
Saltz LB, Cox JV, Blanke C, Rosen LS,
Fehrenbacher L, Moore MJ, Maroun JA, Ackland SP, Locker PK, Pirotta
N, et al: Irinotecan Study Group: Irinotecan plus fluorouracil and
leucovorin for metastatic colorectal cancer. N Engl J Med.
343:905–914. 2000. View Article : Google Scholar : PubMed/NCBI
|
|
4
|
Colucci G, Gebbia V, Paoletti G, Giuliani
F, Caruso M, Gebbia N, Cartenì G, Agostara B, Pezzella G, Manzione
L, et al: Gruppo Oncologico Dell'Italia Meridionale: Phase III
randomized trial of FOLFIRI versus FOLFOX4 in the treatment of
advanced colorectal cancer: A multicenter study of the Gruppo
Oncologico Dell'Italia Meridionale. J Clin Oncol. 23:4866–4875.
2005. View Article : Google Scholar : PubMed/NCBI
|
|
5
|
Goldberg RM, Sargent DJ, Morton RF, Fuchs
CS, Ramanathan RK, Williamson SK, Findlay BP, Pitot HC and Alberts
SR: A randomized controlled trial of fluorouracil plus leucovorin,
irinotecan, and oxaliplatin combinations in patients with
previously untreated metastatic colorectal cancer. J Clin Oncol.
22:23–30. 2004. View Article : Google Scholar : PubMed/NCBI
|
|
6
|
Hurwitz H, Fehrenbacher L, Novotny W,
Cartwright T, Hainsworth J, Heim W, Berlin J, Baron A, Griffing S,
Holmgren E, et al: Bevacizumab plus irinotecan, fluorouracil, and
leucovorin for metastatic colorectal cancer. N Engl J Med.
350:2335–2342. 2004. View Article : Google Scholar : PubMed/NCBI
|
|
7
|
Hochster HS, Hart LL, Ramanathan RK,
Childs BH, Hainsworth JD, Cohn AL, Wong L, Fehrenbacher L, Abubakr
Y, Saif MW, et al: Safety and efficacy of oxaliplatin and
fluoropyrimidine regimens with or without bevacizumab as first-line
treatment of metastatic colorectal cancer: Results of the TREE
Study. J Clin Oncol. 26:3523–3529. 2008. View Article : Google Scholar : PubMed/NCBI
|
|
8
|
Jonker DJ, O'Callaghan CJ, Karapetis CS,
Zalcberg JR, Tu D, Au HJ, Berry SR, Krahn M, Price T, Simes RJ, et
al: Cetuximab for the treatment of colorectal cancer. N Engl J Med.
357:2040–2048. 2007. View Article : Google Scholar : PubMed/NCBI
|
|
9
|
Cunningham D, Humblet Y, Siena S, Khayat
D, Bleiberg H, Santoro A, Bets D, Mueser M, Harstrick A, Verslype
C, et al: Cetuximab monotherapy and cetuximab plus irinotecan in
irinotecan-refractory metastatic colorectal cancer. N Engl J Med.
351:337–345. 2004. View Article : Google Scholar : PubMed/NCBI
|
|
10
|
De Roock W, Piessevaux H, De Schutter J,
Janssens M, De Hertogh G, Personeni N, Biesmans B, Van Laethem JL,
Peeters M, Humblet Y, et al: KRAS wild-type state predicts survival
and is associated to early radiological response in metastatic
colorectal cancer treated with cetuximab. Ann Oncol. 19:508–515.
2008. View Article : Google Scholar : PubMed/NCBI
|
|
11
|
Lièvre A, Bachet JB, Le Corre D, Boige V,
Landi B, Emile JF, Côté JF, Tomasic G, Penna C, Ducreux M, et al:
KRAS mutation status is predictive of response to cetuximab therapy
in colorectal cancer. Cancer Res. 66:3992–3995. 2006. View Article : Google Scholar : PubMed/NCBI
|
|
12
|
Di Nicolantonio F, Martini M, Molinari F,
Sartore-Bianchi A, Arena S, Saletti P, De Dosso S, Mazzucchelli L,
Frattini M, Siena S, et al: Wild-type BRAF is required for response
to panitumumab or cetuximab in metastatic colorectal cancer. J Clin
Oncol. 26:5705–5712. 2008. View Article : Google Scholar : PubMed/NCBI
|
|
13
|
Kasper S, Reis H, Ziegler S, Nothdurft S,
Mueller A, Goetz M, Wiesweg M, Phasue J, Ting S, Wieczorek S, et
al: Molecular dissection of effector mechanisms of RAS-mediated
resistance to anti-EGFR antibody therapy. Oncotarget.
8:45898–45917. 2017. View Article : Google Scholar : PubMed/NCBI
|
|
14
|
Van Cutsem E, Köhne CH, Láng I, Folprecht
G, Nowacki MP, Cascinu S, Shchepotin I, Maurel J, Cunningham D,
Tejpar S, et al: Cetuximab plus irinotecan, fluorouracil, and
leucovorin as first-line treatment for metastatic colorectal
cancer: Updated analysis of overall survival according to tumor
KRAS and BRAF mutation status. J Clin Oncol. 29:2011–2019. 2011.
View Article : Google Scholar : PubMed/NCBI
|
|
15
|
Yoshida M, Hatano N, Nishiumi S, Irino Y,
Izumi Y, Takenawa T and Azuma T: Diagnosis of gastroenterological
diseases by metabolome analysis using gas chromatography-mass
spectrometry. J Gastroenterol. 47:9–20. 2012. View Article : Google Scholar : PubMed/NCBI
|
|
16
|
Spratlin JL, Serkova NJ and Eckhardt SG:
Clinical applications of metabolomics in oncology: a review. Clin
Cancer Res. 15:431–440. 2009. View Article : Google Scholar : PubMed/NCBI
|
|
17
|
Fernández-Ochoa Á, Quirantes-Piné R,
Borrás-Linares I, Gemperline D, Riquelme Alarcón ME, Beretta L and
Segura-Carretero A: PRECISESADS Clinical Consortium: Urinary and
plasma metabolite differences detected by HPLC-ESI-QTOF-MS in
systemic sclerosis patients. J Pharm Biomed Anal. 162:82–90. 2018.
View Article : Google Scholar : PubMed/NCBI
|
|
18
|
Jeong A, Fiorito G, Keski-Rahkonen P,
Imboden M, Kiss A, Robinot N, Gmuender H, Vlaanderen J, Vermeulen
R, Kyrtopoulos S, et al: EXPOsOMICS Consortium: Perturbation of
metabolic pathways mediates the association of air pollutants with
asthma and cardiovascular diseases. Environ Int. 119:334–345. 2018.
View Article : Google Scholar : PubMed/NCBI
|
|
19
|
Kobayashi T, Nishiumi S, Ikeda A, Yoshie
T, Sakai A, Matsubara A, Izumi Y, Tsumura H, Tsuda M, Nishisaki H,
et al: A novel serum metabolomics-based diagnostic approach to
pancreatic cancer. Cancer Epidemiol Biomarkers Prev. 22:571–579.
2013. View Article : Google Scholar : PubMed/NCBI
|
|
20
|
Sakai A, Suzuki M, Kobayashi T, Nishiumi
S, Yamanaka K, Hirata Y, Nakagawa T, Azuma T and Yoshida M:
Pancreatic cancer screening using a multiplatform human serum
metabolomics system. Biomark Med. 10:577–586. 2016. View Article : Google Scholar : PubMed/NCBI
|
|
21
|
Hirata Y, Kobayashi T, Nishiumi S,
Yamanaka K, Nakagawa T, Fujigaki S, Iemoto T, Kobayashi M, Okusaka
T, Nakamori S, et al: Identification of highly sensitive biomarkers
that can aid the early detection of pancreatic cancer using
GC/MS/MS-based targeted metabolomics. Clin Chim Acta. 468:98–104.
2017. View Article : Google Scholar : PubMed/NCBI
|
|
22
|
Nishiumi S, Kobayashi T, Kawana S, Unno Y,
Sakai T, Okamoto K, Yamada Y, Sudo K, Yamaji T, Saito Y, et al:
Investigations in the possibility of early detection of colorectal
cancer by gas chromatography/triple-quadrupole mass spectrometry.
Oncotarget. 8:17115–17126. 2017. View Article : Google Scholar : PubMed/NCBI
|
|
23
|
Redalen KR, Sitter B, Bathen TF, Grøholt
KK, Hole KH, Dueland S, Flatmark K, Ree AH and Seierstad T: High
tumor glycine concentration is an adverse prognostic factor in
locally advanced rectal cancer. Radiother Oncol. 118:393–398. 2016.
View Article : Google Scholar : PubMed/NCBI
|
|
24
|
Terazawa T, Nishitani H, Kato K, Hashimoto
H, Akiyoshi K, Ito Y, Nakamoto A, Iwasa S, Nakajima TE, Hamaguchi
T, et al: Phase II study of cetuximab with irinotecan for KRAS
wild-type colorectal cancer in Japanese patients. Asia Pac J Clin
Oncol. 13:e132–e137. 2017. View Article : Google Scholar : PubMed/NCBI
|
|
25
|
Oken MM, Creech RH, Tormey DC, Horton J,
Davis TE, McFadden ET and Carbone PP: Toxicity and response
criteria of the Eastern Cooperative Oncology Group. Am J Clin
Oncol. 5:649–655. 1982. View Article : Google Scholar : PubMed/NCBI
|
|
26
|
Therasse P, Arbuck SG, Eisenhauer EA,
Wanders J, Kaplan RS, Rubinstein L, Verweij J, Van Glabbeke M, van
Oosterom AT, Christian MC and Gwyther SG: New guidelines to
evaluate the response to treatment in solid tumors. European
Organization for Research and Treatment of Cancer, National Cancer
Institute of the United States, National Cancer Institute of
Canada. J Natl Cancer Inst. 92:205–216. 2000. View Article : Google Scholar : PubMed/NCBI
|
|
27
|
Fujigaki S, Nishiumi S, Kobayashi T,
Suzuki M, Iemoto T, Kojima T, Ito Y, Daiko H, Kato K, Shouji H, et
al: Identification of serum biomarkers of chemoradiosensitivity in
esophageal cancer via the targeted metabolomics approach.
Biomarkers Med. 12:827–840. 2018. View Article : Google Scholar
|
|
28
|
Yamashita Y, Nishiumi S, Kono S, Takao S,
Azuma T and Yoshida M: Differences in elongation of very long chain
fatty acids and fatty acid metabolism between triple-negative and
hormone receptor-positive breast cancer. BMC Cancer. 17:5892017.
View Article : Google Scholar : PubMed/NCBI
|
|
29
|
Youden WJ: Index for rating diagnostic
tests. Cancer. 3:32–35. 1950. View Article : Google Scholar : PubMed/NCBI
|
|
30
|
Kanda Y: Investigation of the freely
available easy-to-use software ‘EZR’ for medical statistics. Bone
Marrow Transplant. 48:452–458. 2013. View Article : Google Scholar : PubMed/NCBI
|
|
31
|
Birkemeyer C, Luedemann A, Wagner C, Erban
A and Kopka J: Metabolome analysis: The potential of in vivo
labeling with stable isotopes for metabolite profiling. Trends
Biotechnol. 23:28–33. 2005. View Article : Google Scholar : PubMed/NCBI
|
|
32
|
Narayanan A, Baskaran SA, Amalaradjou MAR
and Venkitanarayanan K: Anticarcinogenic properties of medium chain
fatty acids on human colorectal, skin and breast cancer cells in
vitro. Int J Mol Sci. 16:5014–5027. 2015. View Article : Google Scholar : PubMed/NCBI
|
|
33
|
Huether A, Höpfner M, Baradari V, Schuppan
D and Scherübl H: EGFR blockade by cetuximab alone or as
combination therapy for growth control of hepatocellular cancer.
Biochem Pharmacol. 70:1568–1578. 2005. View Article : Google Scholar : PubMed/NCBI
|
|
34
|
Yamasaki M, Soda S, Sakakibara Y, Suiko M
and Nishiyama K: The importance of 1,2-dithiolane structure in
α-lipoic acid for the downregulation of cell surface β1-integrin
expression of human bladder cancer cells. Biosci Biotechnol
Biochem. 78:1939–1942. 2014. View Article : Google Scholar : PubMed/NCBI
|
|
35
|
Djukovic D, Zhang J and Raftery D:
Colorectal cancer detection using targeted LC-MS metabolic
profiling. Methods Mol Biol. 1765:229–240. 2018. View Article : Google Scholar : PubMed/NCBI
|
|
36
|
Delphan M, Lin T, Liesenfeld DB,
Nattenmüller J, Böhm JT, Gigic B, Habermann N, Zielske L,
Schrotz-King P, Schneider M, et al: Associations of branched-chain
amino acids with parameters of energy balance and survival in
colorectal cancer patients: Results from the ColoCare Study.
Metabolomics. 2018:222018. View Article : Google Scholar : PubMed/NCBI
|
|
37
|
Uchiyama K, Yagi N, Mizushima K,
Higashimura Y, Hirai Y, Okayama T, Yoshida N, Katada K, Kamada K,
Handa O, et al: Serum metabolomics analysis for early detection of
colorectal cancer. J Gastroenterol. 52:677–694. 2017. View Article : Google Scholar : PubMed/NCBI
|
|
38
|
Jansen RJ, Robinson DP, Frank RD, Anderson
KE, Bamlet WR, Oberg AL, Rabe KG, Olson JE, Sinha R, Petersen GM,
et al: Fatty acids found in dairy, protein and unsaturated fatty
acids are associated with risk of pancreatic cancer in a
case-control study. Int J Cancer. 134:1935–1946. 2014. View Article : Google Scholar : PubMed/NCBI
|
|
39
|
Sato T, Kameyama T and Inoue H:
Association of reduced levels of serum 1,5-Anhydro-d-glucitol with
carotid atherosclerosis in patients with type 2 diabetes. J
Diabetes Complications. 28:348–352. 2014. View Article : Google Scholar : PubMed/NCBI
|
|
40
|
Wang X, Häring M-F, Rathjen T, Lockhart
SM, Sørensen D, Ussar S, Rasmussen LM, Bertagnolli MM, Kahn CR and
Rask-Madsen C: Insulin resistance in vascular endothelial cells
promotes intestinal tumour formation. Oncogene. 36:4987–4996. 2017.
View Article : Google Scholar : PubMed/NCBI
|
|
41
|
Meyerhardt JA, Sato K, Niedzwiecki D, Ye
C, Saltz LB, Mayer RJ, Mowat RB, Whittom R, Hantel A, Benson A, et
al: Dietary glycemic load and cancer recurrence and survival in
patients with stage III colon cancer: Findings from CALGB 89803. J
Natl Cancer Inst. 104:1702–1711. 2012. View Article : Google Scholar : PubMed/NCBI
|
|
42
|
Larsson SC, Kumlin M, Ingelman-Sundberg M
and Wolk A: Dietary long-chain n-3 fatty acids for the prevention
of cancer: A review of potential mechanisms. Am J Clin Nutr.
79:935–945. 2004. View Article : Google Scholar : PubMed/NCBI
|
|
43
|
Hall MN, Chavarro JE, Lee IM, Willett WC
and Ma J: A 22-year prospective study of fish, n-3 fatty acid
intake, and colorectal cancer risk in men. Cancer Epidemiol
Biomarkers Prev. 17:1136–1143. 2008. View Article : Google Scholar : PubMed/NCBI
|
|
44
|
Siena L, Cipollina C, Di Vincenzo S,
Ferraro M, Bruno A, Gjomarkaj M and Pace E: Electrophilic
derivatives of omega-3 fatty acids counteract lung cancer cell
growth. Cancer Chemother Pharmacol. 81:705–716. 2018. View Article : Google Scholar : PubMed/NCBI
|
|
45
|
Benais-Pont G, Dupertuis YM, Kossovsky MP,
Nouet P, Allal AS, Buchegger F and Pichard C: Omega-3
polyunsaturated fatty acids and ionizing radiation: Combined
cytotoxicity on human colorectal adenocarcinoma cells. Nutrition.
22:931–939. 2006. View Article : Google Scholar : PubMed/NCBI
|
|
46
|
Cai F, Dupertuis YM and Pichard C: Role of
polyunsaturated fatty acids and lipid peroxidation on colorectal
cancer risk and treatments. Curr Opin Clin Nutr Metab Care.
15:99–106. 2012. View Article : Google Scholar : PubMed/NCBI
|
|
47
|
Yang K, Li H, Dong J, Dong Y and Wang CZ:
Expression profile of polyunsaturated fatty acids in colorectal
cancer. World J Gastroenterol. 21:2405–2412. 2015. View Article : Google Scholar : PubMed/NCBI
|
|
48
|
Hardy S, Langelier Y and Prentki M: Oleate
activates phosphatidylinositol 3-kinase and promotes proliferation
and reduces apoptosis of MDA-MB-231 breast cancer cells, whereas
palmitate has opposite effects. Cancer Res. 60:6353–6358.
2000.PubMed/NCBI
|