Introduction
Gallbladder cancer is a common malignant tumor of
the digestive tract. The onset of gallbladder cancer is insidious,
and the symptoms are difficult to detect at the early stages.
Indeed, at the time that gallbladder tumors are clinically
diagnosed, the cancer cells have mostly invaded the adjacent organs
and metastasized via the lymph nodes. Compounding this challenge,
gallbladder tumors are unresponsive to chemotherapy; therefore,
early diagnosis and initiation of appropriate treatment are crucial
for improving disease prognosis. In addition to the difficulty in
the early detection and diagnosis of gallbladder cancer, recurrence
and metastasis are important factors leading to the rapid
progression of this disease, largely contributing to high mortality
rates (0.45 cases per 100,000 individuals) (1). Several genes have been identified to be
involved in the development of malignant tumors (2), indicating that further genetic studies
may provide novel targets for the treatment of gallbladder cancer.
Rapid cell proliferation and unregulated differentiation caused by
abnormal tight junctions and damage to cell adhesion structures are
important processes involved in tumorigenesis. Therefore, the loss
or rearrangements of genes that encode tight junction proteins,
including claudin or E-cadherin, are considered to be important
triggers in the development of malignant tumors (3). Claudin-1 is an isoform of the tight
junction protein family, and preliminary studies have demonstrated
that claudin-1 expression is significantly increased in gallbladder
cancer tissues, and is associated with cancer progression (4). However, these preliminary results were
inconsistent with those from another previous study, which
demonstrated that the expression of claudin-1 was significantly
lower in gallbladder adenocarcinoma (5). Therefore, the present study was designed
to evaluate the effects of downregulating claudin-1 on the
physiological processes of the gallbladder cancer SGC996 cell line,
including cell proliferation, apoptosis and invasion. The data from
the present study are expected to provide potential novel
strategies and approaches for the clinical development of targeted
therapies for patients with gallbladder cancer.
Materials and methods
Cell lines and culture
The gallbladder cancer SGC996 and GBC-SD cell lines,
and the cholangiocarcinoma QBC939 cell line were purchased from
Shanghai GeneChem Co., Ltd. (Shanghai, China). SGC996 cells in the
logarithmic growth phase were transfected with claudin-1-RNA
interference lentivirus (LV-CLDN1-RNAi) (Shanghai GeneChem Co.,
Ltd.) using Lipofectamine 2000 (Invitrogen; Thermo Fisher
Scientific, Inc., Waltham, MA, USA) to suppress claudin-1
expression. The negative-control cells were transfected with the
virus CON077 synthesized by Shanghai GeneChem Co., Ltd. Restriction
enzymes Agel and EcoRI (cat. nos. R3552L and R3101L,
respectively) and T4 DNA ligase used for plasmid construction were
purchased from New England BioLabs, Inc. (Ipswich, MA, USA).
Following trypsin digestion (Sangon Biotech Co., Ltd., Shanghai,
China), all cells were cultured in RPMI-1640 medium, supplemented
with 10% fetal bovine serum (FBS; Invitrogen; Thermo Fisher
Scientific, Inc.), 100 U/ml penicillin G and 100 µg/ml
streptomycin. The cells were stored in an incubator at 5%
CO2 in a humidified atmosphere at 37°C. The
corresponding concentrations of the three cell lines were
re-inoculated into culture plates to ensure the plated amounts were
maintained at 15–30% during transfection.
Transfection of SGC996 cells with
LV-CLDN1-RNAi
The cells were randomly divided into the
experimental group transfected with LVpFU-GW-007PSC40161-1
(5′-GCAAAGTCTTTGACTCCTTGC-3′; KD1 group), LVpFU-GW-007PSC40162-1
(5′-GCCACAAGACCTAGCCTAAT-3′; KD2 group), LVpFU-GW-007PSC40163-1
(5′-GCATCGTTATTAAGCCCTTAT-3′; KD3 group), the negative control (NC)
transfected with CON077 (5′-TTCTCCGAACGTGTCACGT-3′), and the blank
control (mock) group. Cells were transfected using Lipofectamine
2000 transfection reagent (Invitrogen; Thermo Fisher Scientific,
Inc.), according to the manufacturer's protocols, and the
concentration of lentivirus used in each well was 50 nM. An optimal
amount of virus was used to initiate transfection, and culture
medium was replaced at the optimal time, 8–12 h post-transfection.
The cells were used for further experimentation 48 h after
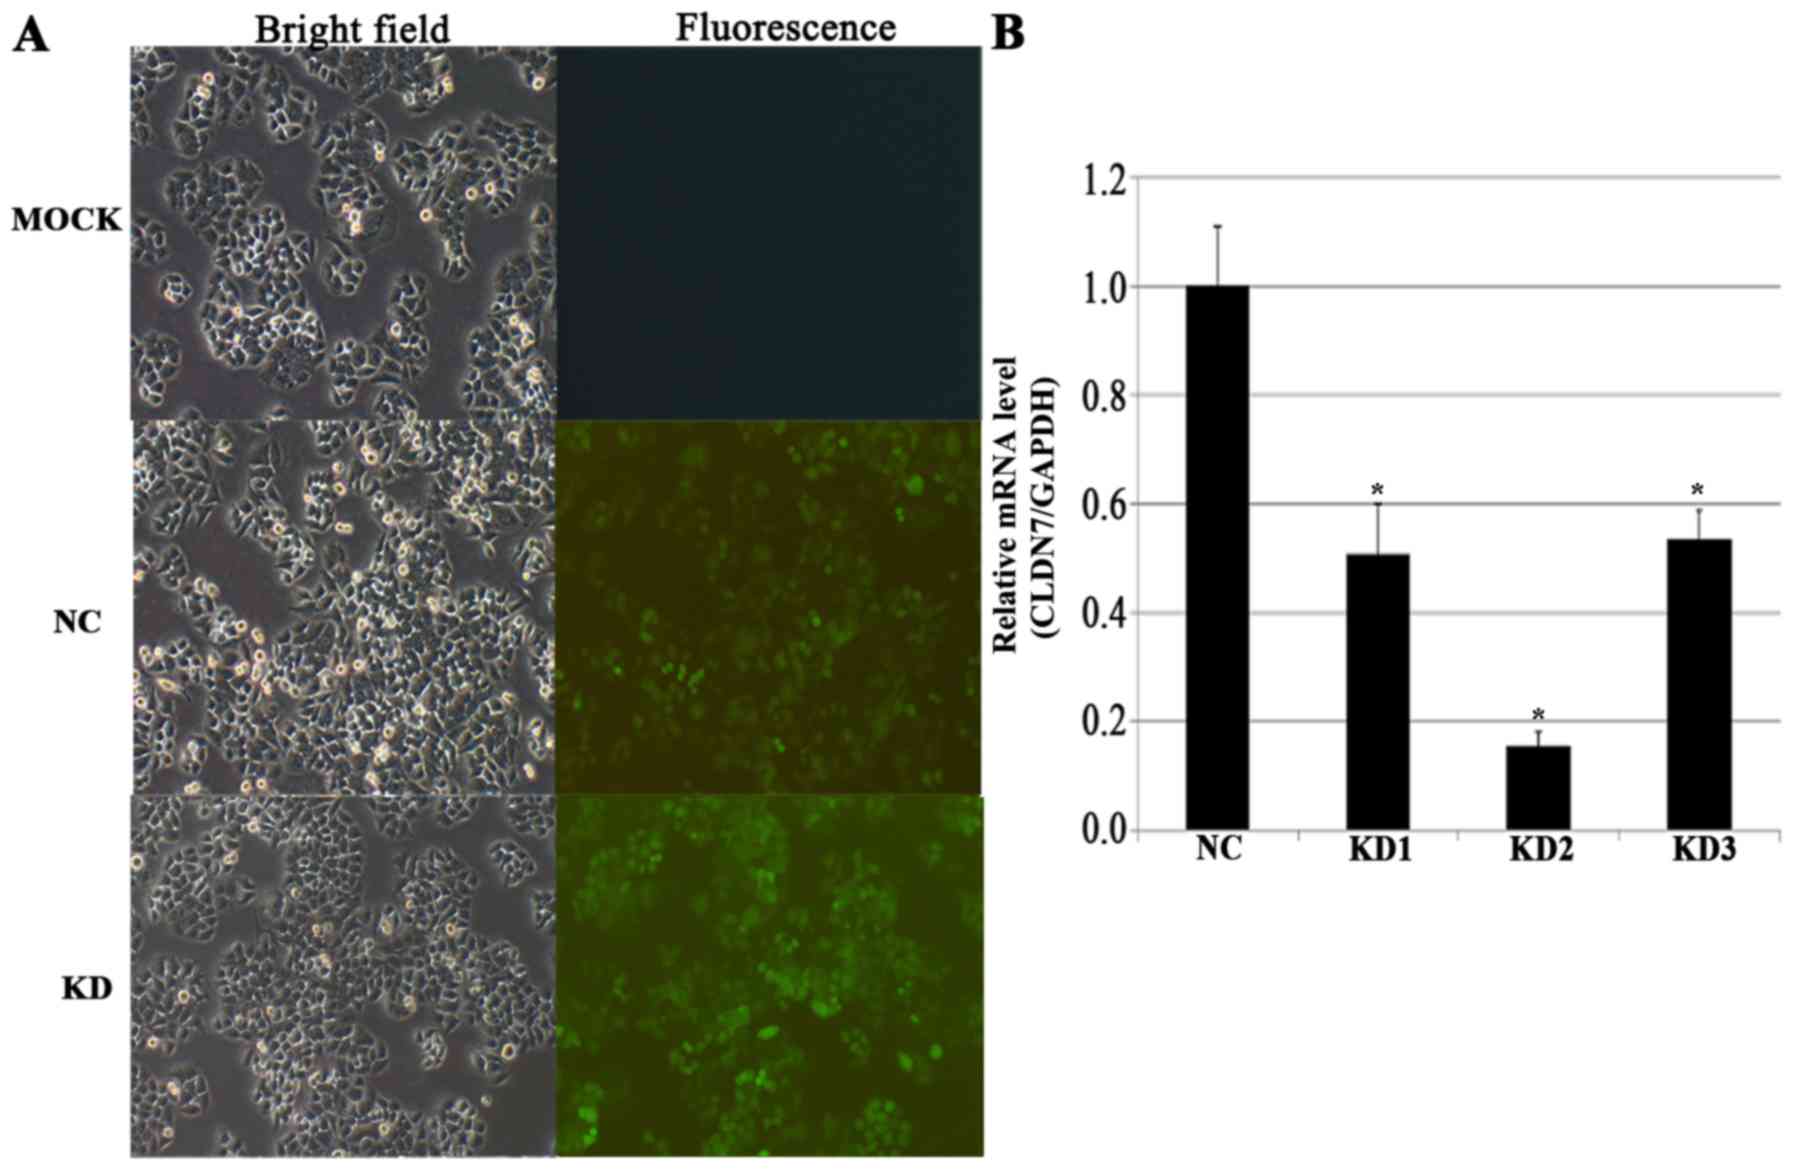
transfection. Analysis of transfected cells confirmed that cells,
particularly NC and mock groups, were typically viable and
apoptosis was rarely observed. In general, downstream applications
were conducted if the transfection rate exceeded 70%. The
lentivirus was fluorescently labeled with green fluorescent protein
(GFP). At ~72 h post-transfection, fluorescence microscopy (IX71;
Olympus Corporation, Tokyo, Japan) was performed to examine GFP
reporter gene expression, and the rate of fluorescence indicated
the rate of transfection. The lentivirus also harbored a resistant
gene marker allowing for selection of successfully transfected
cells. At 48–72 h post-transfection, culture medium was replaced
with a puromycin-containing culture medium (Clontech Laboratories,
Inc., Mountainview, CA, USA), and the incubation was performed at
37°C overnight in a humidified atmosphere with 5% CO2,
to select for transfected cells, identified as highly proliferative
cells. Positively identified transfected cells were used for
downstream applications; otherwise, the transfection process was
repeated. Each experiment represents a minimum of three independent
repeats.
RNA extraction and reverse
transcription-quantitative polymerase chain reaction (RT-qPCR)
Total RNA was extracted from cells using TRIzol
reagent (Pufei Biotech Co, Ltd., Shanghai, China), according to the
manufacturer's protocol. Total RNA was reverse transcribed to cDNA
using a reverse transcription kit (Promega Corporation, Madison,
WI, USA), according to the manufacturer's protocol. qPCR was
performed using 10.0 µl SYBR premix Ex Taq (Takara Bio Inc.,
Otsu, Japan), 2 µl forward primer (2.5 µM), 2 µl reverse primer
(2.5 µM), 2.0 µl cDNA and 4.0 µl RNase-free H2O. The
primers were synthesized by RiboBio Co., Ltd., (Guangzhou, China),
and the primer sequences used in the present study were as follows:
GAPDH forward, 5′-TGACTTCAACAGCGACACCCA-3′ and reverse,
5′-CACCCTGTTGCTGTAGCCAAA-3′; and claudin-1 (CLDN1) forward,
5′-AAAGTGAAGAAGGCCCGTATA-3′ and reverse,
5′-TAATGTTGGTAGGGATCAAAGG-3′. The reaction conditions were as
follows: Denaturation at 94°C for 10 min, followed by 45 cycles of
denaturation at 94°C for 15 sec, annealing at 60°C for 20 sec and
extension at 72°C for 15 sec. Duplicates were performed for all
reactions using the Bio-Rad CFX96 real-time PCR machine (Bio-Rad
Laboratories, Inc., Hercules, CA, USA). Melting curve analysis was
performed and relative gene expression for each group was
quantified by the 2−ΔΔCq method (6) as follows: ΔCq=Cq value of the target
gene-Cq value of the reference gene. At ΔCq≤12, gene expression was
considered to be high. At 12<ΔCq<16, gene expression was
considered to be moderate. At ΔCq≥16, gene expression was
considered to be low. Relative gene expression was normalized to
the endogenous housekeeping gene GAPDH. All experiments were
performed in triplicate.
MTT assay for detecting cell
proliferation
Cells in the logarithmic growth phase were digested
with trypsin (Shanghai Chemical Reagent Co., Ltd., Shanghai, China)
and re-suspended in complete medium (Ausbian; Shanghai Weizheng
Xiangsheng Biotechnology Co., Ltd., Shanghai, China) for
enumeration. The cells were seeded at a density of 2,000 cells/well
and incubated at 37°C for 1, 2, 3, 4 or 5 days. The cell density
was observed under a light microscope (XDS-100; Cai Kang Optical
Instrument Co., Ltd, Shanghai, China). The number of plates was
determined based on the experimental design (for example, if cells
were to be detected for 5 days, then a total of 5 96-well plates
were used). MTT (Genview; 20 µl at 5 mg/ml) was added to cells at 4
h prior to the termination of incubation. The culture medium was
completely removed after 4 h, ensuring the formazan particles that
formed at the bottom of the plates remained undisturbed. The
formazan particles were dissolved by adding 100 µl DMSO. The
mixtures were shaken for 2–5 min, and optical density values were
measured at 490/570 nm using a microplate reader. Each group was
replicated 3–5 times.
Flow cytometry for cell cycle
evaluation
Cells were treated by the aforementioned method, as
described for the MTT assay. Cell suspensions were collected at a
density of ≥1×10⁶ in 5-ml centrifuge tubes, with
triplicates for each group. The supernatant was discarded following
centrifugation (1,300 × g for 5 min at 4°C), and cells were washed
once with pre-chilled D-Hanks solution (pH, 7.2–7.4; Shanghai Jikai
Gene Chemical Technology Inc.). Cells were fixed with 75% ethanol
for 1 h prior to washing with D-Hanks solution. Cells were stained
with 40X propidium iodide concentrate (2 mg/ml; Sigma-Aldrich;
Merck KGaA, Darmstadt, Germany) at 37°C for 30 min and then stored
in the dark at 4°C. Cells were measured on a flow cytometer (Guava
easyCyte HT; Merck KGaA) with the flow rate set at 300–800
cells/sec. The experiment was repeated three times, and the data
were analyzed using the Modfit software (version 3.2; BD
Biosciences, Franklin Lakes, NJ, USA).
Annexin V-APC single-color staining
for detecting cell apoptosis
Cells were treated as aforementioned for the MTT
assay, collected in 5-ml centrifuge tubes and re-suspended in
complete medium for enumeration. Triplicate wells were set up for
each group (to ensure sufficient cell numbers, the cell numbers
were set at ≥5×10⁵ for each treatment). Cells were
centrifuged at 1,300 × g for 5 min at 4°C, and the supernatant was
discarded. Cells were washed with D-Hanks solution, and with 1X
binding buffer, and collected by re-centrifugation. A total of 200
µl 1X binding buffer was used to re-suspend the cell pellet, and 10
µl Annexin V-APC staining solution (eBioscience; Thermo Fisher
Scientific, Inc.) was added. The mixture was added to 400–800 µl 1X
binding buffer based on the cell number. Cells were examined using
a flow cytometer (Guava easyCyte HT; Merck KGaA) with the flow rate
set at 300–800 cells/sec, the data were analyzed using the Modfit
software, and the experiment was repeated three times.
Western blotting for
apoptosis-associated proteins
Cells from different treatment groups were collected
and treated with trypsin. Total protein was extracted using
radioimmunoprecipitation assay buffer (Shanghai DingGuo Biotech
Co., Ltd., Shanghai, China) and 1 µl protease inhibitor per
1×10⁶ cells, to lyse cells on ice for 30 min. The
mixture was centrifuged at 10,000 × g at 4°C for 10 min, and
protein quantification was performed using the Bradford method. The
protein concentration of each sample was adjusted to 2 µg/µl and 20
µl per sample was electrophoresed on 12% sodium dodecyl
sulfate-polyacrylamide gel and the proteins were transferred onto a
polyvinylidene difluoride membrane (EMD Millipore, Billerica, MA,
USA). The membrane was blocked for 1 h in a closed shaker at room
temperature. Membranes were probed with rabbit polyclonal
anti-B-cell lymphoma-2 (Bcl-2; 1:800; cat. no. BS70205), rabbit
polyclonal anti-Bcl-2-associated X (Bax; 1:500; cat. no. BS1030),
and mouse anti-human β-actin (1:10,000; cat. no. BS6007M; all
Bioworld Technology, Inc.). All primary antibodies were incubated
overnight at 4°C. Membranes were washed with TBS, and probed with
secondary horseradish peroxidase-conjugated goat anti-rabbit
(1:5,000; cat. no. KC-RB-035) or goat anti-mouse (1:5,000;
KC-MM-035; both Kangcheng Biology Engineering Co., Ltd., Shanghai,
China) IgG antibodies. The membrane was shaken at room temperature
for 1 h, washed with TBS, and chemiluminescence was obtained by
exposing the membrane to X-rays. The ECL Western Blotting Substrate
kit (Pierce; Thermo Fisher Scientific, Inc.) was used to visualize
the bands (Image Lab version 4.0; Bio-Rad Laboratories, Inc.), and
β-actin was used as an internal reference control.
Transwell assay for detecting cell
invasion
Matrigel was melted at 4°C overnight and diluted to
a ratio of 1:8 in RPMI-1640 culture medium. Diluted Matrigel (50
µl) was added to the membrane of the upper Transwell chamber (pore
size 8 µm; Corning Incorporated, Corning, NY, USA) of each well and
dried at room temperature. Cells were collected, 48 h
post-transfection and digested with trypsin, and cell density was
adjusted to 1×10⁵ cells/ml. A total of 200 µl of the
cell suspension was inoculated in the upper chamber, and 600 µl of
RPMI-1640 culture medium containing 10% FBS was added to the lower
chamber as the chemoattractant. Following incubation at 37°C and 5%
CO2 in air for 48 h, the Transwell chamber was removed
and the culture medium was eliminated. A cotton swab was used to
wipe off the Matrigel from the upper Transwell chamber and the
residual cells. The invading cells were then fixed using 95%
ethanol for 5 min, and stained with 0.1% crystal violet for 15 min,
both at room temperature. Cells that migrated through the inserts
were counted on 10 different randomly chosen fields of view per
inset under a light microscope (Nikon Corporation), at
magnification, ×100. The experiment was repeated three times.
Statistical analysis
Statistical analysis of all data was performed using
SPSS 21.0 (IBM Corp., Armonk, NY, USA). Data are expressed as the
mean ± standard deviation. Comparisons of multiple groups were
performed using a one-way analysis of variance with a least
significant difference post hoc test. P<0.05 was considered to
indicate a statistically significant difference.
Results
Effect of LV-CLDN1-RNAi transfection
on claudin-1 expression
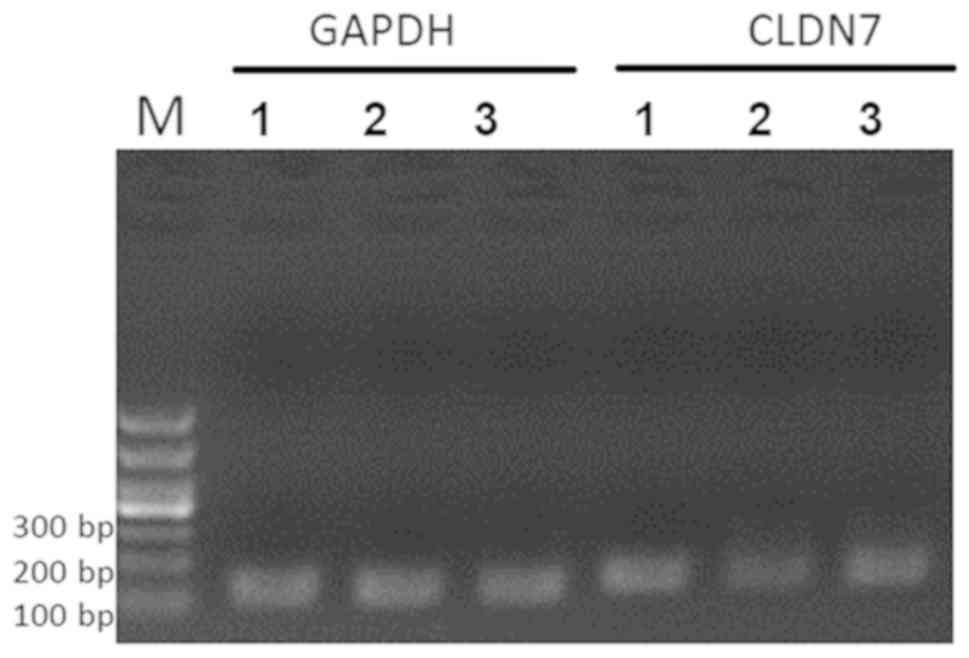
The qPCR results demonstrated that claudin-1 mRNA
was highly expressed in QBC939 and SGC996 cells, but only
moderately expressed in GBC-SD cells (Table I; Fig.
1). The QBC939 cell line is from human cholangiocarcinoma
cells; therefore, the gallbladder SGC996 cell line, which displayed
high claudin-1 mRNA expression, was selected for subsequent
functional studies. Furthermore, claudin-1 mRNA expression levels
in SGC996 cells transfected with LV-CLDN1-RNAi in the KD2 group
were significantly lower (P=0.0002) than those in control cells.
The overall knockout efficiency was 84.4% (Fig. 2).
 | Table I.ΔCq of SGC996, GBC-SD and QBC939 cells
showing high expression of claudin-1 mRNA in QBC939 and SGC996
cells, but moderate expression in GBC-SD cells.a |
Table I.
ΔCq of SGC996, GBC-SD and QBC939 cells
showing high expression of claudin-1 mRNA in QBC939 and SGC996
cells, but moderate expression in GBC-SD cells.a
| Cell line | GAPDH | Claudin-1 | ∆Cq |
|---|
| SGC996 | 14.46 | 20.99 | 6.53 |
|
| 14.49 | 20.97 | 6.48 |
|
| 14.66 | 20.94 | 6.28 |
| GBC-SD | 13.96 | 28.21 | 14.25 |
|
| 14.07 | 28.51 | 14.44 |
|
| 14.08 | 28.36 | 14.28 |
| QBC939 | 16.49 | 19.35 | 2.86 |
|
| 16.52 | 19.48 | 2.96 |
|
| 16.44 | 19.49 | 3.05 |
Effect of claudin-1 downregulation on
cell proliferation and the cell cycle
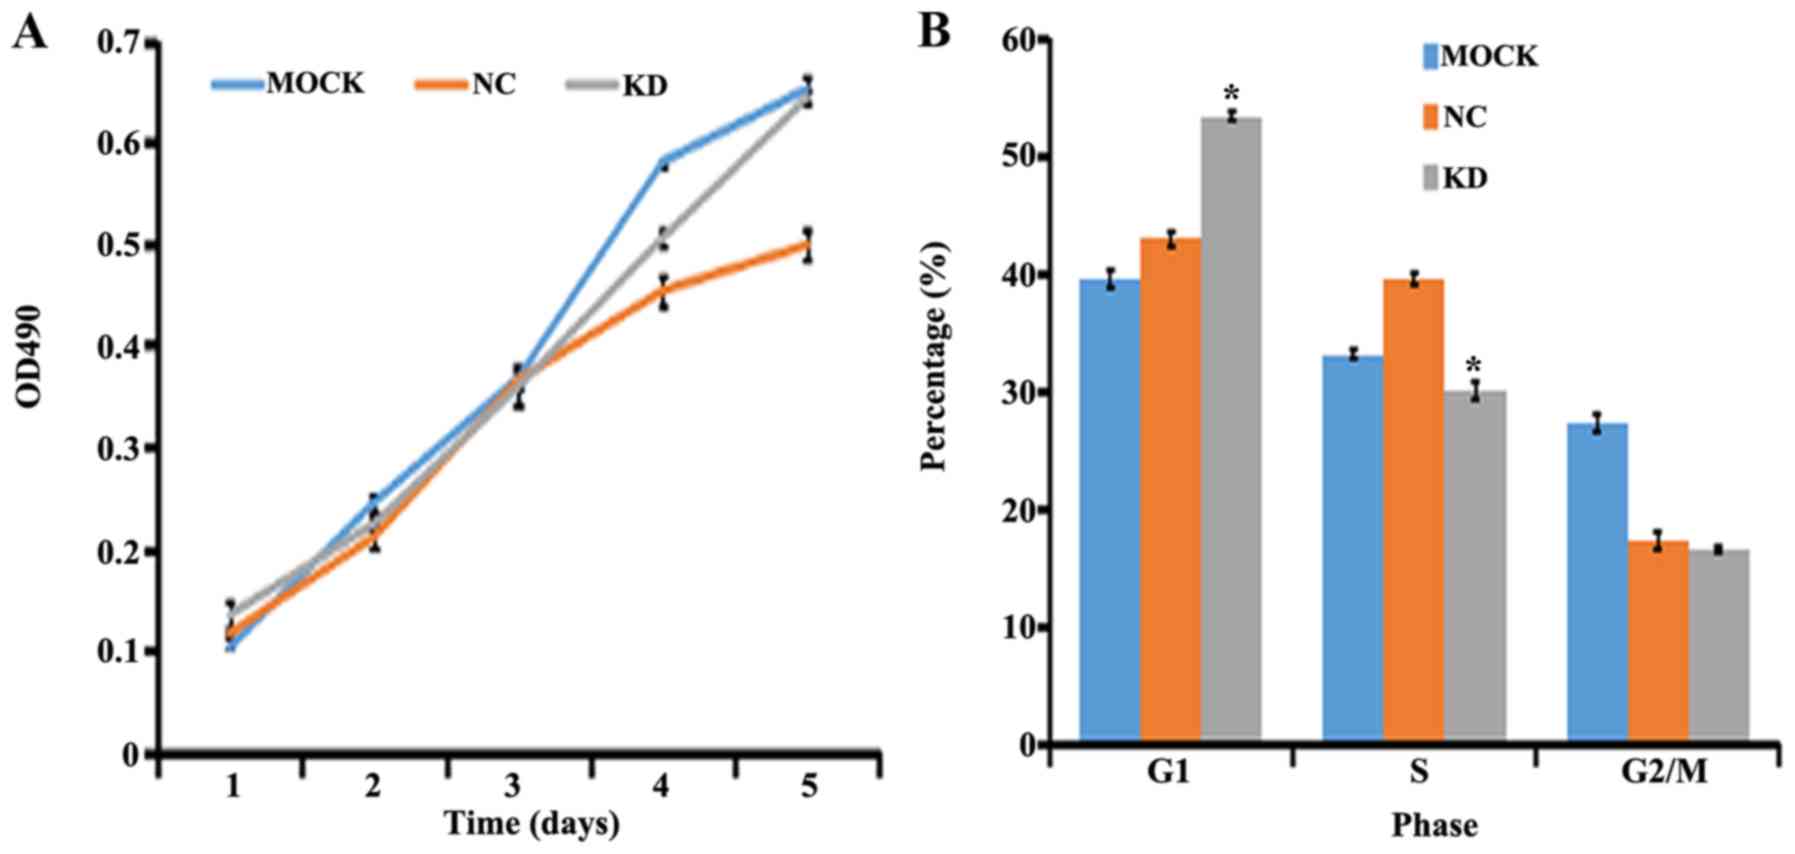
Analysis of cell proliferation by MTT assay
demonstrated that in response to transfection with LV-CLDN1-RNAi
after 1, 2, 3 and 4 days, the proliferation rate of SGC996 cells
was not significantly different compared with that of the control
group (P>0.05; Fig. 3A). Although
the Kruskal-Wallis test yielded a non-significant result
(P>0.05), the difference in the growth rate was <20%,
identified as negative, indicating no major effect on cell
proliferation. By contrast, flow cytometry analysis demonstrated
that the proportion of SGC996 cells in the G1 phase in
the KD group was significantly increased compared with that in the
NC group (P=0.000013), while the proportion of cells in the S phase
was significantly decreased (P=0.0004). There were no significant
differences between groups for cells in the G2/M phase
(P>0.05) (Fig. 3B).
Effect of claudin-1 downregulation on
apoptosis
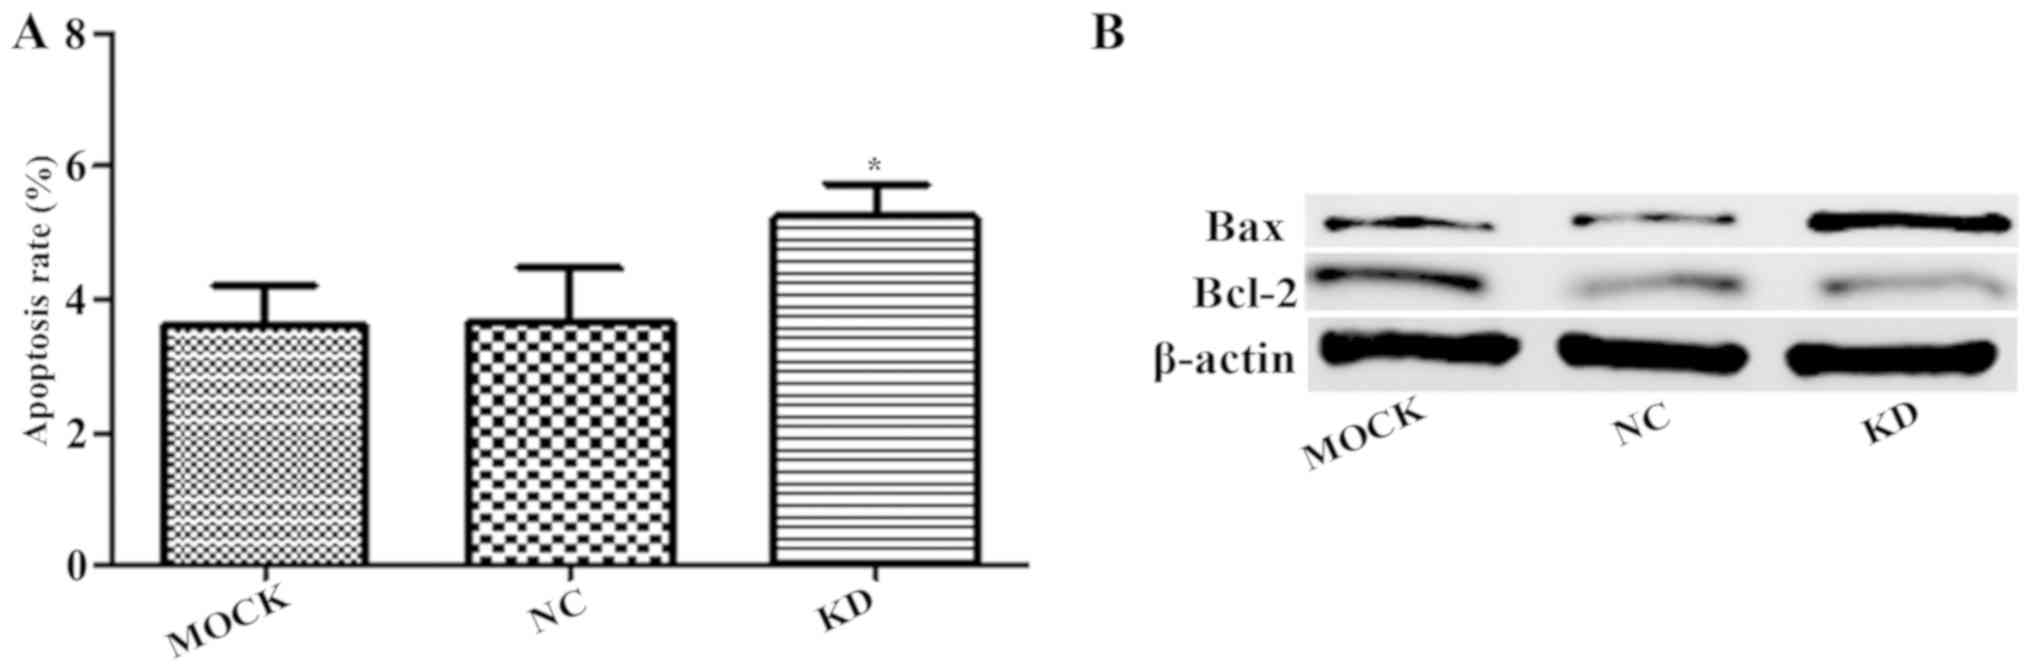
Annexin V-APC single-color staining revealed that
downregulation of claudin-1 led to significantly increased
apoptosis in the KD group compared with that in the NC group
(P<0.05; Fig. 4A). Similarly,
western blot analysis revealed that the downregulation of claudin-1
led to increased apoptotic protein Bax expression and decreased
anti-apoptotic protein Bcl-2 expression (Fig. 4B).
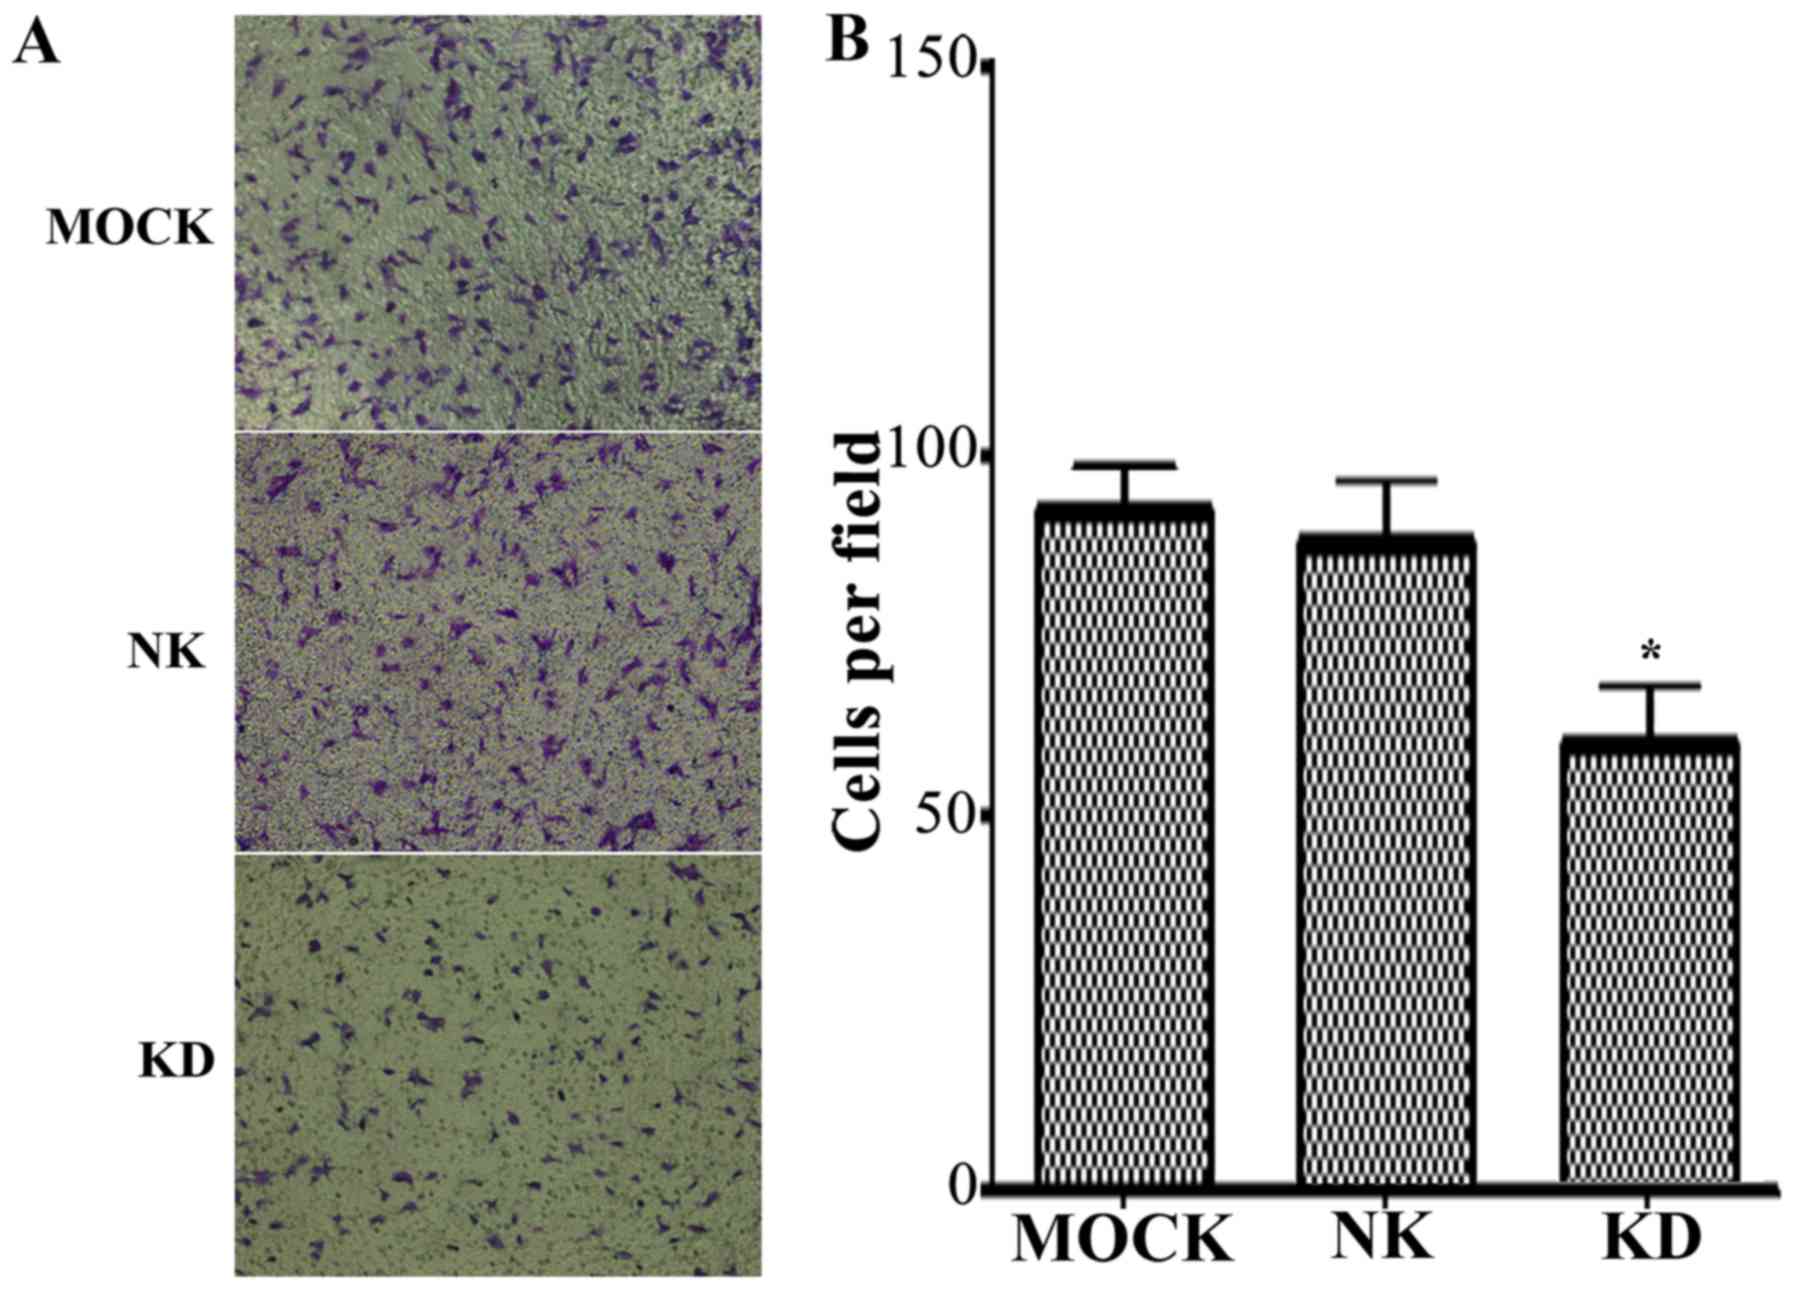
Effect of claudin-1 downregulation on
cell invasion
A Transwell invasion assay was conducted to assess
cells that traverse across a porous Matrigel membrane in order to
reach the lower chamber. As Matrigel mimics the in vivo
extracellular matrix, the assay may be applied to determine the
invasion capacity of gallbladder cells. The results demonstrated
that the invasion capacity of the KD group was significantly
inhibited compared with that of the NC group (Fig. 5).
Discussion
Claudin proteins contribute important functions in
tight junctions and the maintenance of epithelial cell polarity. To
date, 24 subtypes of claudin have been identified, of which
CLDN1 is located on the human chromosome 3q28-q29 locus.
CLDN1 encodes a subtype of tight-junction protein, which
consists of 211 amino acids and is mainly involved in the
regulation of cell-cell adhesion (7).
Previous studies have reported that claudin-1 expression may be
upregulated or ectopically expressed in tumors, implicating a role
in specific physiological processes during tumor development
(7,8).
The functions of claudin-1 in tumor development have been
previously reported in multiple studies (9–11). Suren
et al (12) observed that
claudin-1 expression was not altered in nose cancer tissues
compared with non-cancer epithelial tissues, and no association
with tumor prognosis was determined. However, Claudin-1 was
demonstrated to be highly upregulated in oral squamous cell
carcinoma, which was associated with histological grades, vascular
invasion, lymph node metastasis and clinical stages, which further
indicated a poor prognosis (13).
Holczbauer et al (14)
performed immunohistochemistry and western blotting to detect
claudin-1 expression in liver cancer tissues, liver cirrhosis
tissues and normal liver tissues. Claudin-1 expression was
significantly increased in liver cancer and hepatitis B-associated
liver cirrhosis tissues, but did not differ between normal tissues
and hepatitis C-associated liver cirrhosis tissues. These results
suggested that claudin-1 is able to promote the invasion of
hepatitis B virus and epithelial-mesenchymal transition. Bouchagier
et al (15) also observed that
increased claudin-1 expression in liver cancer tissues was a
positive prognostic indicator, suggesting that it may be associated
with a positive treatment effect and high survival rate.
Claudin-1 has also been demonstrated to be
associated with colon cancer. Matsuoka et al (16) reported that upregulated claudin-1
expression was linked with tumor invasion and development in colon
cancer. Furthermore, claudin-1 expression was significantly
increased in colon cancer that had metastasized. The study
suggested a possible mechanism by which claudin-1 expression is
initially reduced during the early stage of tumor formation in the
absence of metastasis, but subsequently increases during tumor
development, alongside a decrease in E-cadherin expression,
triggering the accumulation of β-catenin in the cell. Upregulation
of the β-catenin/TCF signaling pathway may further promote
claudin-1 expression, causing damage to the structure and function
of tight junction proteins. This results in a decrease in tissue
adhesion or causes damage to adhesion molecules, allowing cancer
cells to easily detach from their primary tumor site. The detached
cancer cells are able to adhere to the interstitial or
intercellular membranes of normal cells, blood and lymphatic
vessels. The enhanced migration capacity of the cancer cells
further promotes their infiltration, ultimately resulting in
metastasis. Süren et al (17)
demonstrated that reduced claudin-1 expression was highly
correlated with the degree of tumor invasion, metastasis, vascular
invasion and perineural invasion in colorectal carcinoma.
Furthermore, Guo et al (18)
revealed that claudin-1 expression in cholangiocarcinoma was
associated with tumor invasion and metastasis.
During our preliminary study, prior to the present
study, it was revealed that claudin-1 expression was significantly
upregulated in gallbladder cancer tissues (4). However, this observation differed from
that of another study (5), and the
exact mechanisms involved remain unclear. Therefore, the present
study was designed to specifically examine the effects of claudin-1
on the behavior and proliferation of cancer cells by downregulating
its expression by RNAi.
The results from the MTT assay demonstrated that
downregulated claudin-1 did not affect cell proliferation; however,
flow cytometry results revealed that a large proportion of cells
were arrested in the G0/G1 phase.
Furthermore, downregulating claudin-1 in SGC996 cells inhibited the
transition of the G1/S phase in gallbladder cancer
cells. Downregulation of claudin-1 promoted the apoptosis and
inhibited the invasion ability of gallbladder cancer cells in
vitro.
The results from the present study in gallbladder
cells are consistent with those reported by Shiozaki et al
(19) in gastric cancer, in which
downregulated claudin-1 inhibited the proliferation, invasion and
metastasis of gastric cancer cells, yet promoted apoptosis. A
possible mechanism was proposed, such that downregulation of
CLDN1 may induce tumor necrosis factor-α (TNF-α) expression,
which in turn altered the expression of 245 genes, including those
associated with cell motility, including matrix metallopeptidase 7
(MMP7), TNF (ligand) superfamily member 10, transforming
growth factor β receptor-1 and C-C motif chemokine 2 (CCL2).
Shiozaki et al (20) also
suggested that downregulated claudin-1 promoted apoptosis in human
lung cancer cells through the induction of TNF-α expression.
Typically, as a tight junction protein involved in cell adhesion,
downregulation of claudin-1 would be likely to promote cell
migration. However, the results from the present study are in
contrast with this expectation, suggesting a mechanism of induced
expression of cytoplasmic TNF-α, which further activates a series
of signaling pathways, ultimately leading to apoptosis (20). Pope et al (21) demonstrated that overexpression of
claudin-1 accelerated tumor growth and development, and was
indicative of a poor prognosis. A possible mechanism for this
effect is via the activation of the Wnt signaling pathway.
The results from the present study were therefore
consistent with those from previous studies, although the lack of
significant changes in cell proliferation in response to
downregulating claudin-1 expression remains to be addressed, which
could be due to experimental error. In addition, further studies on
a series of the potential molecular mechanisms in a state of
downregulated claudin-1 expression in gallbladder cancer are
required.
In summary, the present results demonstrated that
claudin-1 serves an important role in the proliferation, apoptosis
and invasion of gallbladder cancer cells, as well as in the
carcinogenesis and development of gallbladder cancer.
Identification of the signaling pathways triggered by claudin-1, as
well as the molecular mechanisms involved, is required in follow-up
studies. Understanding a clear mechanism for these effects will
likely contribute toward developing claudin-1 as a novel potential
target for the treatment of gallbladder cancer.
Acknowledgements
Not applicable.
Funding
The present study was supported by funding from the
Anhui Provincial Education Department (grant no. KJ2015B115BY).
Availability of data and materials
The datasets used and/or analyzed during the current
study are available from the corresponding author on reasonable
request.
Authors' contributions
HJ, QZ and SZ wrote the manuscript and conducted the
experiments; HL designed the present study and revised the
manuscript; ZM and YW performed data analysis.
Ethics approval and consent to
participate
Not applicable.
Patient consent for publication
Not applicable.
Competing interests
The authors declare that they have no competing
interests.
References
|
1
|
Wang JH and Jiang XQ: The epidemiological
studies of primary gallbladder carcinoma. Chin Arch Gen Surg
(Electronic Edition). 4:271–273. 2010.
|
|
2
|
Kunert-Keil C, Steinmüller F, Jeschke U,
Gredes T and Gedrange T: Immunolocation of glycodelin in human
adenocarcinoma of the lung, sqamous cell carcinoma of the lung and
lung metastases of colonic adenocarcinoma. Acta Histochem.
113:798–802. 2011. View Article : Google Scholar : PubMed/NCBI
|
|
3
|
Sánchez-Tilló E, de Barrios O, Siles L,
Cuatrecasas M, Castells A and Postigo A: β-catenin/TCF4 complex
induces the epithelial-to-mesenchymal transition(EMT)-activator
ZEBl to regulate tumor invasiveness. Proc Natl Acad Sci USA.
108:19204–19209. 2011. View Article : Google Scholar : PubMed/NCBI
|
|
4
|
Jin H, Liu HC, Zhou SB and Yu DH:
Expression of claudin-1 in gallbladder carcinoma and its
significance. J Bengbu Med Coll. 22–24. 2012.
|
|
5
|
Xiong L, Wen Y, Miao X and Yang Z:
Expressions of cell junction regulatory proteins and their
association with clinicopathologic parameters in benign and
malignant gallbladder lesions. Am J Med Sci. 342:388–394. 2011.
View Article : Google Scholar : PubMed/NCBI
|
|
6
|
Svec D, Tichopad A, Novosadova V, Pfaffl
MW and Kubista M: How good is a PCR efficiency estimate:
Recommendations for precise and robust qPCR efficiency assessments.
Biomol Detect Quantif. 3:9–16. 2015. View Article : Google Scholar : PubMed/NCBI
|
|
7
|
Hewitt KJ, Agarwal R and Morin PJ: The
claudin gene family: Expression in normal and neoplastic tissues.
BMC Cancer. 6:1862006. View Article : Google Scholar : PubMed/NCBI
|
|
8
|
Kominsky SL: Claudins: Emerging targets
for cancer therapy. Expert Rev Mol Med. 8:1–11. 2006. View Article : Google Scholar : PubMed/NCBI
|
|
9
|
Gruber R, Börnchen C, Rose K, Daubmann A,
Volksdorf T, Wladykowski E, Vidal-Y-Sy S, Peters EM, Danso M,
Bouwstra JA, et al: Diverse regulation of claudin-1 and claudin-4
in atopic dermatitis. Am J Pathol. 185:2777–2789. 2015. View Article : Google Scholar : PubMed/NCBI
|
|
10
|
Hahn-Strömberg V, Askari S, Befekadu R,
Matthiessen P, Karlsson S and Nilsson TK: Polymorphisms in the
CLDN1 and CLDN7 genes are related to differentiation and tumor
stage in colon carcinoma. APMIS. 122:636–642. 2014. View Article : Google Scholar : PubMed/NCBI
|
|
11
|
Morgan C, Jenkins SA, Kynaston HG and Doak
SH: The role of adhesion molecules as biomarkers for the aggressive
prostate cancer phenotype. PLoS One. 8:e816662013. View Article : Google Scholar : PubMed/NCBI
|
|
12
|
Suren D, Yildirim M, Kaya V, Elal R,
Selcuk OT, Osma U, Yildiz M, Gunduz S and Sezer C: Expression
patterns of claudins 1, 4, and 7 and their prognostic significance
in nasopharyngeal carcinoma. J BUON. 20:212–217. 2015.PubMed/NCBI
|
|
13
|
Sappayatosok K and Phattarataratip E:
Overexpression of claudin-1 is associated with advanced clinical
stage and invasive pathologic characteristics of oral squamous cell
carcinoma. Head Neck Pathol. 9:173–180. 2015. View Article : Google Scholar : PubMed/NCBI
|
|
14
|
Holczbauer Á, Gyöngyösi B, Lotz G, Törzsök
P, Kaposi-Novák P, Szijártó A, Tátrai P, Kupcsulik P, Schaff Z and
Kiss A: Increased expression of claudin-1 and claudin-7 in liver
cirrhosis and hepatocellular carcinoma. Pathol Oncol Res.
20:493–502. 2014. View Article : Google Scholar : PubMed/NCBI
|
|
15
|
Bouchagier KA, Assimakopoulos SF, Karavias
DD, Maroulis I, Tzelepi V, Kalofonos H, Karavias DD, Kardamakis D,
Scopa CD and Tsamandas AC: Expression of claudins-1, −4, −5, −7 and
occludin in hepatocellular carcinoma and their relation with
classic clinicopathological features and patients' survival. In
Vivo. 28:315–326. 2014.PubMed/NCBI
|
|
16
|
Matsuoka T, Mitomi H, Fukui N, Kanazawa H,
Saito T, Hayashi T and Yao T: Cluster analysis of claudin-l and 4,
E-eadhefin, and β-catenin expression in colorectal cancers. J Surg
Oncol. 103:674–686. 2011. View Article : Google Scholar : PubMed/NCBI
|
|
17
|
Süren D, Yıldırım M, Kaya V, Alikanoğlu
AS, Bülbüller N, Ylldlz M and Sezer C: Loss of tight junction
proteins (Claudin 1, 4, and 7) correlates with aggressive behavior
in colorectal carcinoma. Med Sci Monit. 20:1255–1262. 2014.
View Article : Google Scholar : PubMed/NCBI
|
|
18
|
Guo XJ, Wang M, Jiang JX, Shi CJ, Hu J and
Huang HJ: Expression of zonula occludens-1 and Claudin-1 and it's
significance in cholangiocarcinoma. Chin J Exp Surg. 31:1739–1741.
2014.(In Chinese).
|
|
19
|
Shiozaki A, Shimizu H, Ichikawa D, Konishi
H, Komatsu S, Kubota T, Fujiwara H, Okamoto K, Iitaka D, Nakashima
S, et al: Claudin 1 mediates tumor necrosis factor alpha-induced
cell migration in human gastric cancer cells. World J
Gastroenterol. 20:17863–17876. 2014. View Article : Google Scholar : PubMed/NCBI
|
|
20
|
Shiozaki A, Bai XH, Shen-Tu G, Moodley S,
Takeshita H, Fung SY, Wang Y, Keshavjee S and Liu M: Claudin 1
mediates TNF-α-induced gene expression and cell migration in human
lung carcinoma cells. PLoS One. 7:e380492012. View Article : Google Scholar : PubMed/NCBI
|
|
21
|
Pope JL, Ahmad R, Bhat AA, Washington MK,
Singh AB and Dhawan P: Claudin-1 overexpression in intestinal
epithelial cells enhances susceptibility to adenamatous polyposis
coli-mediated colon tumorigenesis. Mol Cancer. 13:1672014.
View Article : Google Scholar : PubMed/NCBI
|