Introduction
Chromogranin A (CgA), a member of the chromogranin
family, is an acidic and hydrophilic glycoprotein (1). It is widely distributed in various
tissues, including the sympathetic nerve endings, cardiac muscle,
pancreas, the central and peripheral nervous system, intestinal
endocrine tissues, and the thyroid and parathyroid glands, and can
be degraded into a series of smaller, biologically active peptides.
CgA has been recognised as the most important tumour marker in
functioning and non-functioning neuroendocrine neoplasms (NENs),
and is valuable for evaluating postoperative recurrence and
prognosis (2). Neuron-specific
enolase (NSE) is a glycolytic enzyme that is present in the
cytoplasm of neurons and neuroendocrine cells (3). This enzyme is expressed in various
tumour types with neuroendocrine differentiation, including
small-cell lung cancer and poorly differentiated NENs, for
differentiating NENs from non-endocrine tumours (4).
NENs arising from the diffuse endocrine system can
occur in any organ of the body. The most common sites are the ileum
and pancreas, with NENs in the thymus, breast, stomach, colon,
ovary and cervix being less common. Notably, serum CgA levels vary
according to the origin of the tumour. The incidence of NENs in
China has increased in the last decade (5), with a study showing the most common
primary sites of gastroenteropancreatic (GEP) NENs to be the
pancreas (31.5%) and rectum (29.6%), followed by the cardia (11.6%)
and body (15.4%) of the stomach, with small intestinal and colonic
NENs occurring in a small proportion of all patients. Compared with
cardiac and gastric body NENs, pancreatic and rectal NENs tended to
be found in younger, female, urban residents with a higher
education level, who were diagnosed at an earlier stage and lower
grade (6). The therapy of GEP-NENs,
including biotherapy, systemic chemotherapy and somatostatin
receptor radionuclide therapy, have made significant progress, but
surgical therapy still occupies an important position (7). It has been reported that ~60% of
patients will have recurrence following radical surgery, and the
5-year survival rate of local and regional metastases was 35–80%
(8). A large scale study including
35,097 cases indicated that the median survival duration in G1 and
G2 NENs was 124 and 64 months, respectively, whereas that of poorly
differentiated NENs was only 10 months (6). However, serum CgA assays are not widely
used in China, and serum CgA measurements for the diagnosis of
NENs, particularly in different primary tumour sites, have been
validated in a small number of clinical centres or laboratories.
The aim of the present study was to investigate the clinical role
of serum CgA levels in patients with GEP-NENs of different primary
tumour origins and different stages, and to determine the optimal
cut-off values for specific primary tumour sites, with the aim of
increasing the sensitivity of serum CgA for the diagnosis of
GEP-NENs.
Materials and methods
Patients and clinical
characteristics
Among the 109 patients with GEP-NENs, 59 were
females and 50 were males (mean age, 54 years; range, 21–79 years).
They were monitored at the Nanjing First Hospital (Nanjing, China)
between December 2012 and August 2016. The diagnosis was confirmed
in all patients by histopathology and imaging follow-up
(computerized tomography or magnetic resonance imaging). All 109
patients with GEP-NENs received a serum CgA test. The patients were
divided into 2 groups: Group 1 included 73 patients with detectable
lesions (38 patients with primary lesions prior to resection and 35
with recurrence and metastasis following primary tumor resection);
and Group 2 included 36 patients with no detectable lesions
post-surgery, as confirmed by anatomical and functional imaging
follow-up. Serum CgA levels in 73 patients with detectable lesions
were further analysed according to clinical characteristics. Among
the 109 patients with GEP-NENs, 52 (47.1%) were confirmed with
pancreatic, 22 (20.2%) with gastric and 35 (32.1%) with intestinal
neuroendocrine tumours. According to WHO 2010 international
consensus diagnostic criteria (9), 29
patients (26.6%) had G1 tumours, 55 (50.5%) had G2 tumours and 25
(22.9%) had G3 tumours. The control groups included 30 healthy
volunteers (Group 3) and 30 patients with other digestive tract
diseases, including a number of types of gastritis, with atrophic
gastritis included, and non-neuroendocrine gastric cancer (Group
4). Among the 109 patients, only 59 patients volunteered to receive
the NSE test. These patients were also divided into 2 groups: Group
5 included 18 patients with no detectable lesions post-surgery and
Group 6 included 41 patients with detectable lesions (primary
lesions prior to resection and recurrence and metastasis following
primary tumor resection). Serum NSE levels in 41 patients with
detectable lesions were also analysed according to clinical
characteristics. A total of 30 healthy volunteers received a NSE
test as a control group (Group 7). There were no significant sex or
age differences between the control groups. All patients gave
written informed consent to participate in the study at the Nanjing
Medical University (Nanjing, China).
Measurement of serum CgA and NSE
Serum samples were collected following overnight
fasting, stored at −20°C until use, and thawed immediately prior to
each assay. Serum CgA was measured by sandwich ELISA using a
commercial Chromoa assay kit (Cisbio, Codolet, France), which uses
2 monoclonal antibodies directed against the CgA amino acids at
locations 145–197 and 198–245. A first monoclonal antibody,
immobilized on the microplate, captures the CgA proteins contained
in the calibrators and samples. A second monoclonal antibody is
added, forming a complex with the antigen. Finally, the microplate
is developed by adding an enzymatic substrate to produce a visible
signal, which indicates the quantity of antigen in the sample. The
NSE values were measured in serum samples using the Roche
chemiluminescence analyser (Roche Diagnostics GmbH Mannheim,
Germany).
Histopathology
The CgA, synaptophysin (Syn) and neural cell
adhesion molecule 1 (CD56) are hallmarks of NENs in pathology
(9,10). The diagnosis was confirmed in all
patients by histopathology, but only a subset of pathology samples
of patients were collected for immunohistochemistry (IHC). The CgA,
Syn and CD56 expression in the tumour samples of the patients with
naïve or recurrent GEP-NENs were detected by IHC. Paraffin-embedded
tissue sections (4 µm) were fixed with 10% formalin for 24 h at
room temperature, deparaffinized in xylene and rehydrated in graded
anhydrous alcohol solutions (90, 80 and 70%). Sections were blocked
for 30 min in H2O2 (3%) at room temperature,
and underwent antigen retrieval by boiling (95–99°C) for 4 min at
max power, and for 12 min at 50% power. Subsequently, sections were
cooled down for 30 min, rinsed three times with PBS and incubated
with normal goat serum (cat. no. X090710-8; Dako; Agilent
Technologies, Inc., Santa Clara, CA, USA) for 30 min at room
temperature, followed by overnight incubation at 4°C with
antibodies against Syn (Ready-to-use; Syn:AM363-5M; snp88;
BioGenex, Fremont, CA, USA), CgA (Ready-to-use; CgA:AM126-5M;
LK2H10; BioGenex, Fremont, CA, USA) or CD56 (Ready-to-use;
CD56:003218; 123C3; Zymed; Thermo Fisher Scientific, Inc., Waltham,
MA, USA). Next day, sections were washed three times with PBS and
incubated for 30 min at room temperature with a goat anti-mouse
secondary antibody (cat. no. K400111-2; EnVisionTM+/HRP, Mo, 110
ml, Ready-to-use, Dako). Subsequently, washed with PBS, then the
substrate chromogen, DAB, enabled visualization of the complex via
a brown precipitate. Sections were counterstained with hematoxylin
for 1 min at room temperature and were mounted using coverslips.
Tissues were analysed with a light microscope (BX51; Olympus
Corporation, Tokyo, Japan; magnification, ×100-400). All biopsy
samples were interpreted by 3 certified pathology
physicians(Nanjing First Hospital, China) who were blinded to the
patients' clinical data according to the classification criteria of
the pathological diagnosis of gastrointestinal neuroendocrine
tumours (WHO, 2010) (9) and the
Chinese Consensus Guidelines (10).
Statistical analysis
All data were presented as median values with
interquartile ranges. The serum CgA and NSE levels were compared
between subgroups using the Mann-Whitney or Kruskal-Wallis tests,
and Dunn-Bonferroni post hoc test. The diagnostic value of the
serum CgA levels in GEP-NENs was investigated by calculating the
area under the curve (AUC) for each receiver operating
characteristic (ROC) curve. The CgA cut-off values that produced
the highest sensitivity and specificity were determined. The
correlation between serum NSE levels and serum CgA levels was
evaluated by the Pearson's correlation test. The correlation
between tumour CgA expression and serum CgA levels was analysed by
the Spearman's correlation method. All statistical analyses were
carried out using SPSS statistical software version 19.0 (IBM
Corp., Armonk, NY, USA). P<0.05 was considered to indicate
statistically significant differences.
Results
Serum CgA in GEP-NENs
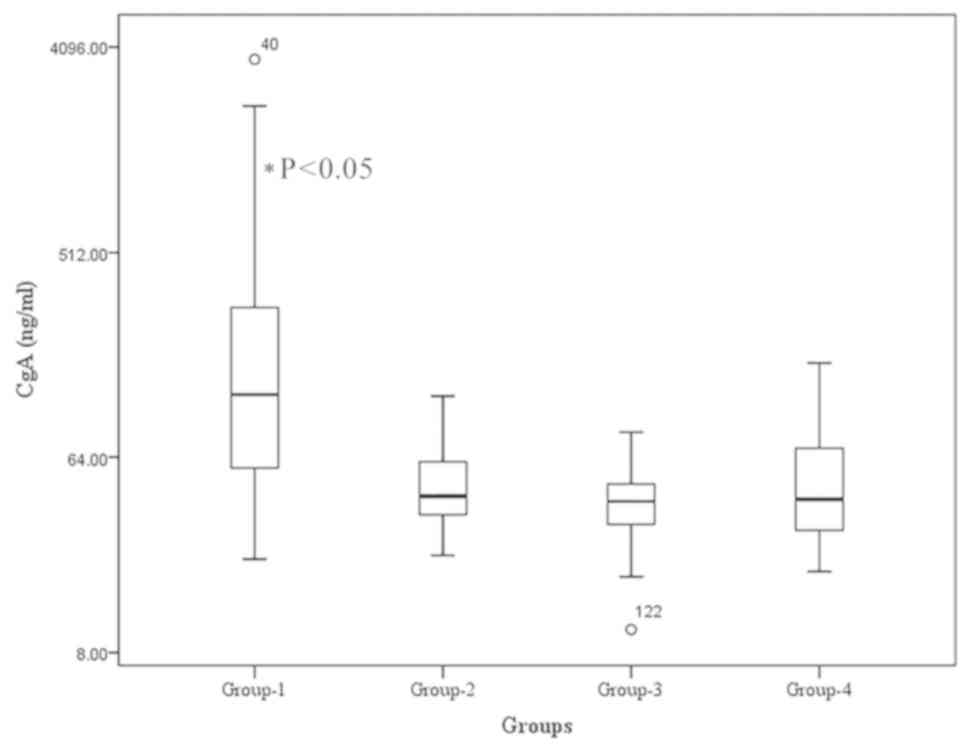
The median serum CgA level in Group 1 was 121.16
ng/ml, which was significantly higher compared with that in Groups
2, 3 and 4 (42.77, 40.51 and 41.41 ng/ml, respectively; P<0.05)
(Fig. 1). No significant differences
were observed among the serum CgA levels of Groups 2, 3 and 4.
Values 40 and 122 indicated in the figure represent the outliers at
the 40th and 122nd positions.
Cut-off levels for serum CgA and
diagnostic efficacy
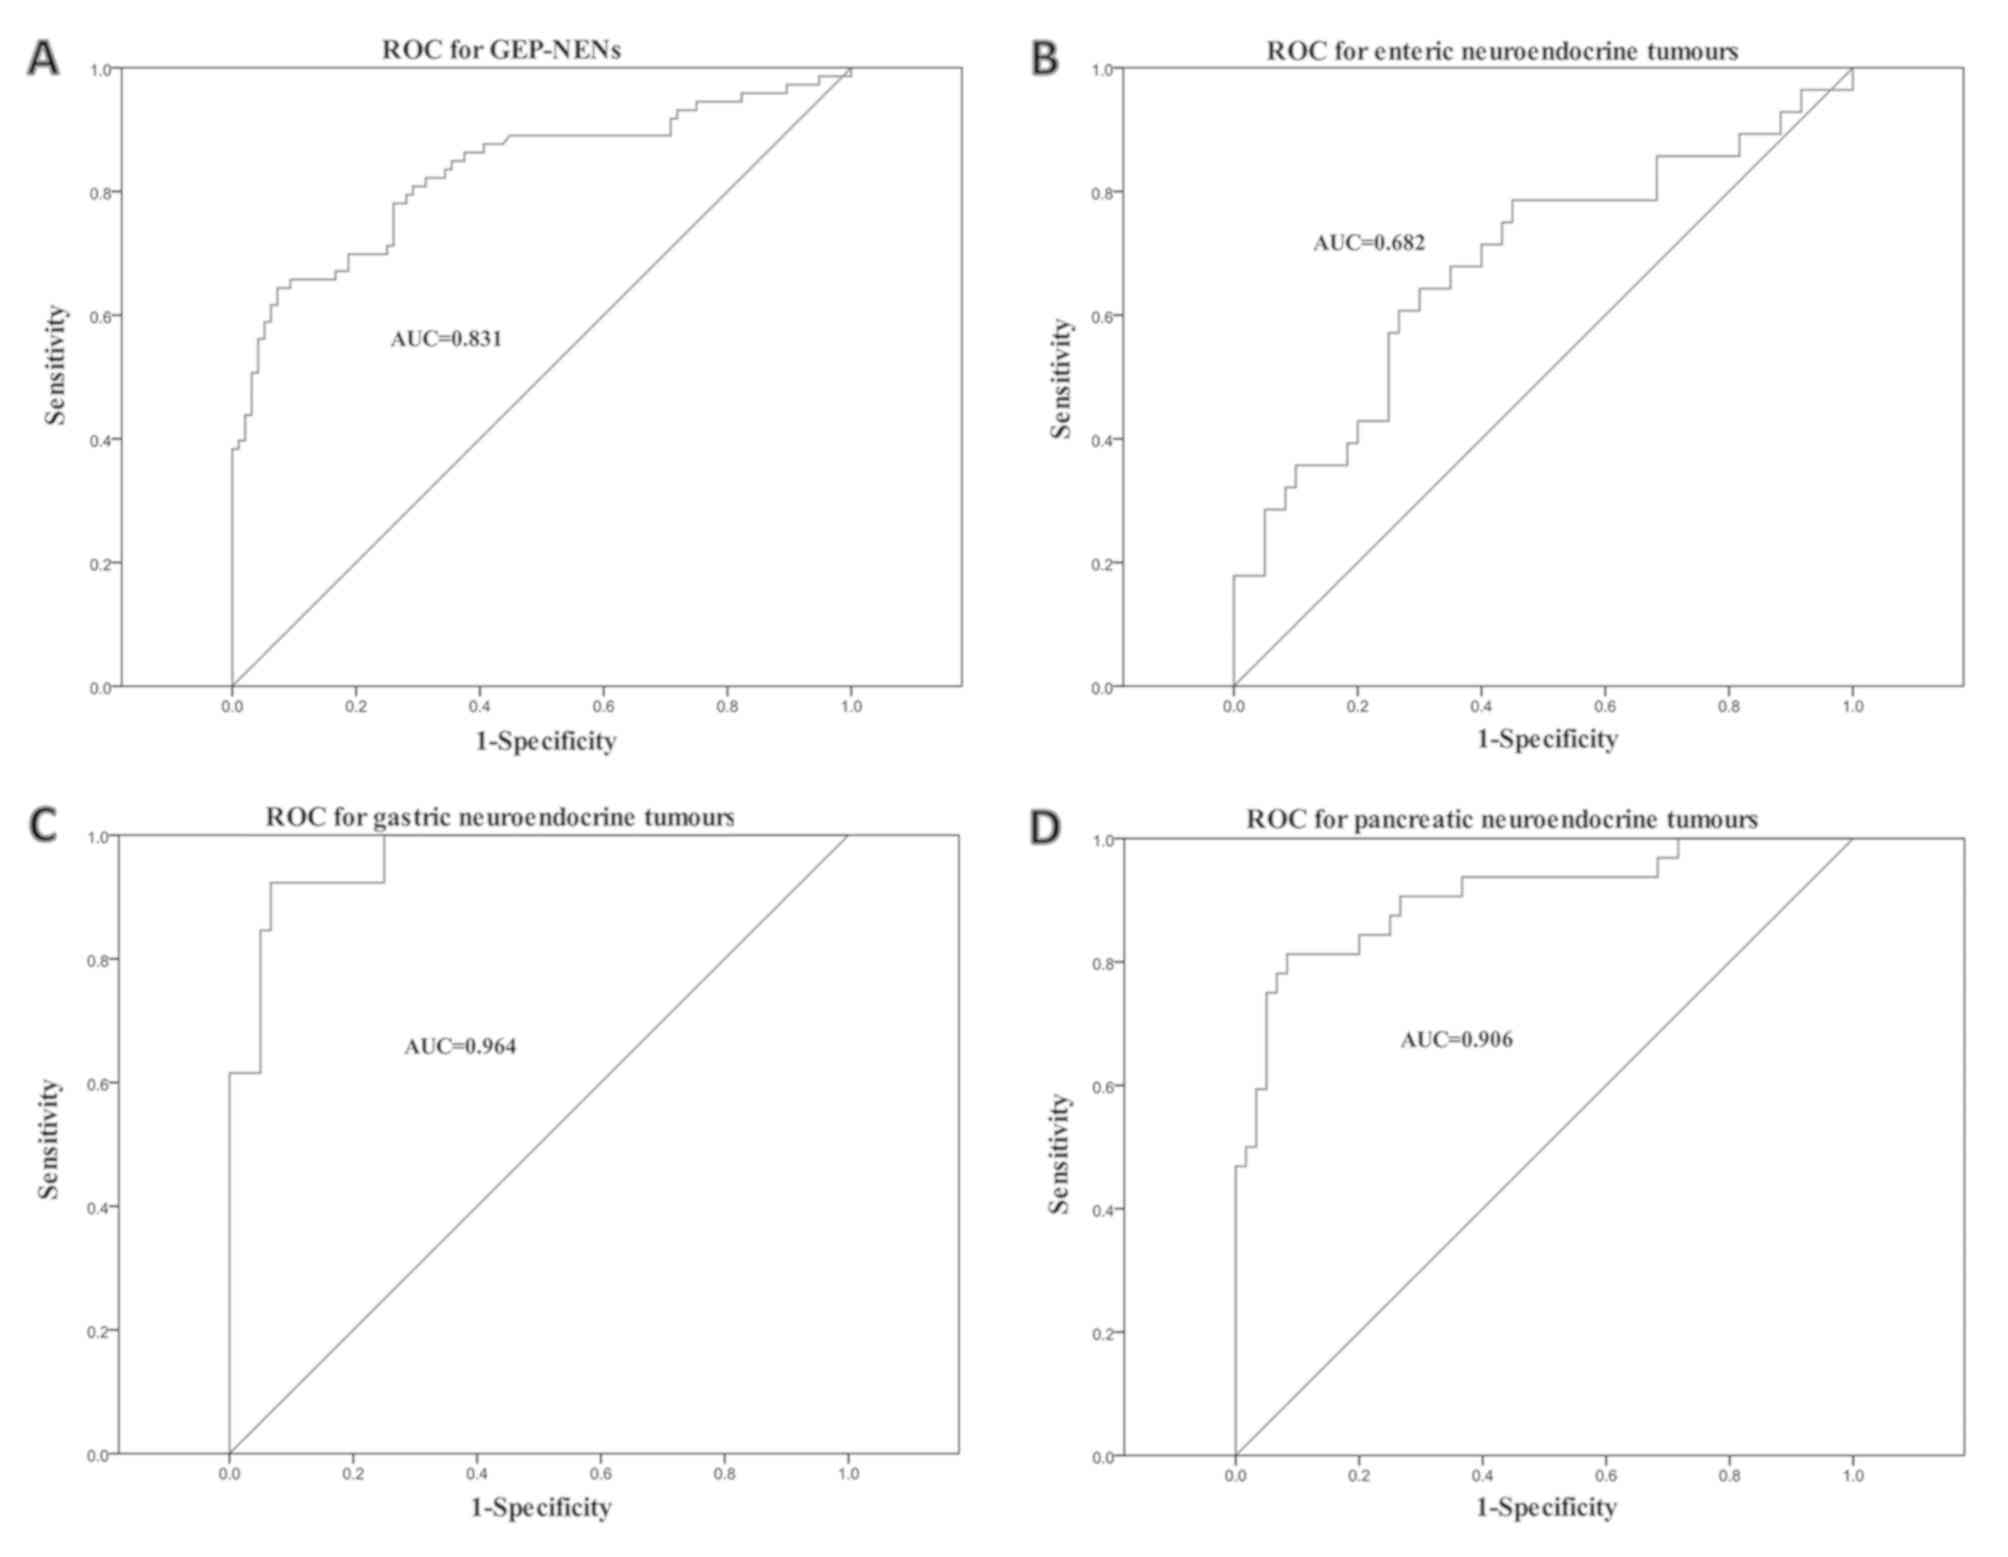
The serum CgA levels in GEP-NEN samples were
measured and a ROC curve was plotted (Fig. 2A). A total of 109 patients with
GEP-NENs participated, including 73 patients with primary or
detectable lesions (positive controls), 36 patients with a history
of GEP-NENs, who had been treated surgically, 30 patients with
other digestive tract diseases and 30 healthy volunteers (negative
controls). The ROC curve for the serum CgA levels revealed that a
cut-off value of 85.3 ng/ml led to 64.4% sensitivity and 92.7%
specificity (AUC, 0.831) for the diagnosis of GEP-NENs.
The ROC curves of serum CgA levels of the 73
patients with detectable lesions grouped according to different
tumour origins are presented in Fig.
2B-D. Overall, 32 primary lesions originated from the pancreas,
13 from the stomach and 28 from the intestines. The optimal serum
CgA concentration cut-off values were 86.19 ng/ml for pancreatic
NENs (sensitivity, 81.3%; specificity, 91.7%), 96.72 ng/ml for
gastric NENs (sensitivity, 92.3%; specificity, 93.3%) and 51.13
ng/ml for intestinal NENs (sensitivity, 64.3%; specificity, 70.0%).
Serum CgA levels were significantly increased in patients with
gastric NENs even at an early stage, whereas rectal NENs had low
levels of serum CgA
Serum CgA levels in patients with
GEP-NENs according to various clinical features
Serum CgA levels and patient characteristics are
listed in Table I. The median serum
CgA level in patients with gastric NENs was higher compared with
that in patients with pancreatic or intestinal NENs (259.95, 161.95
and 57.67 ng/ml, respectively; P<0.05). The median serum level
of CgA in patients with post-surgical recurrence or metastasis was
significantly lower compared with that in patients with untreated
primary lesions (103.24 and 146.71 ng/ml, respectively; P<0.05),
and the median serum level in patients with IHC-positive CgA
expression in their biopsy samples was significantly higher
compared with that in patients without tumour CgA expression
(P<0.05). Serum CgA levels in patients with GEP-NENs was not
associated with sex, age, grade, metastasis or CD56 expression.
 | Table I.Serum CgA levels in patients with
primary or advanced gastroenteropancreatic neuroendocrine neoplasms
(n=73) using Kruskal-Wallis test. |
Table I.
Serum CgA levels in patients with
primary or advanced gastroenteropancreatic neuroendocrine neoplasms
(n=73) using Kruskal-Wallis test.
| Variables | n | Median CgA level,
ng/ml (range) | Z-value | P-value |
|---|
| Age, years |
|
| 0.998 | 0.319 |
|
<54 | 33 | 155.64
(56.77–421.01) |
|
|
| ≥54 | 40 | 110.23
(57.46–213.29) |
|
|
| Sex |
|
| 0.000 | 1.000 |
| Male | 40 | 110.23
(58.18–300.28) |
|
|
|
Female | 33 | 143.69
(56.77–326.93) |
|
|
| Tumour site |
|
| 19.681 | <0.001 |
|
Stomach | 13 | 259.95
(112.73–1442.34) |
|
|
|
Intestines | 28 | 57.665
(44.12–109.41) |
|
|
|
Pancreas | 32 | 161.95
(102.24–367.14) |
|
|
| Grade |
|
| 3.359 | 0.186 |
| G1 | 17 | 105.09
(56.96–272.44) |
|
|
| G2 | 40 | 123
(49.17–287.94) |
|
|
| G3 | 16 | 178.5
(104.97–578.22) |
|
|
| Lesions |
|
| 2.260 | 0.024 |
|
Primary | 38 | 146.71
(66.33–419.7) |
|
|
|
Recurrent | 35 | 103.24
(45.5–186.43) |
|
|
| Metastasis |
|
| 0.743 | 0.458 |
| No | 14 | 125.93
(66.33–419.7) |
|
|
|
Yes | 59 | 115.31
(53.59–293.96) |
|
|
| IHC (CgA) |
|
| 2.277 | 0.023 |
| − | 13 | 56.66
(34.04–94.78) |
|
|
| + | 47 | 155.64
(58.08–405.56) |
|
|
| IHC (CD56) |
|
| 0.398 | 0.690 |
| − | 5 | 108.35
(67.23–223.77) |
|
|
| + | 36 | 112.81
(56.29–415.18) |
|
|
| IHC (Syn) |
|
| 0.531 | 0.596 |
| − | 1 | −a |
|
|
| + | 61 | 115.31
(54.84–350.37) |
|
|
Correlation between serum and tumour
CgA expression levels
The data were divided into positive and negative
groups based the serum CgA cut-off value of 85.3 ng/ml. The serum
and tumour CgA statuses were analysed among the 73 patients with
naive or recurrent GEP-NENs, and the results demonstrated that
significantly increased serum CgA levels were consistent with
positive CgA expression in 32 out of 60 patients (53.3%). The
Spearman's correlation analysis revealed a correlation between
serum CgA levels and tumour CgA expression (R=0.41, P=0.001) (data
not shown).
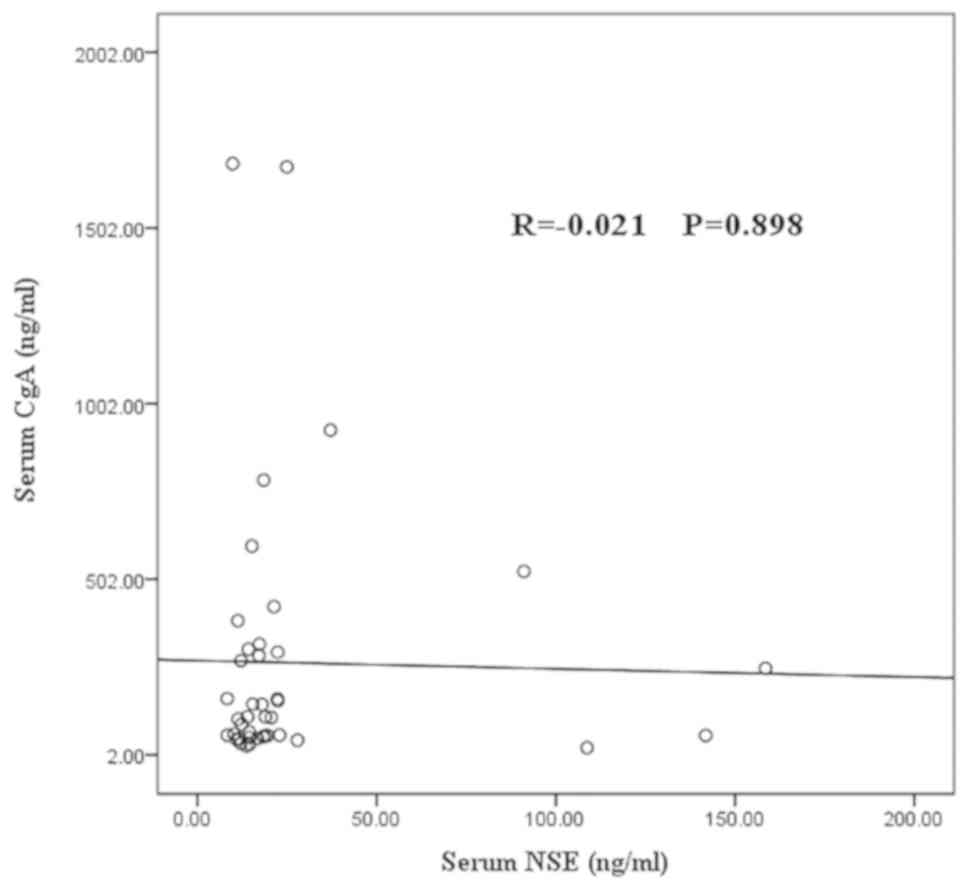
Correlation between serum CgA and NSE
levels
No correlation was observed between the serum CgA
and NSE levels in 41 patients with detectable GEP-NENs (R=−0.021;
P=0.9) (Fig. 3).
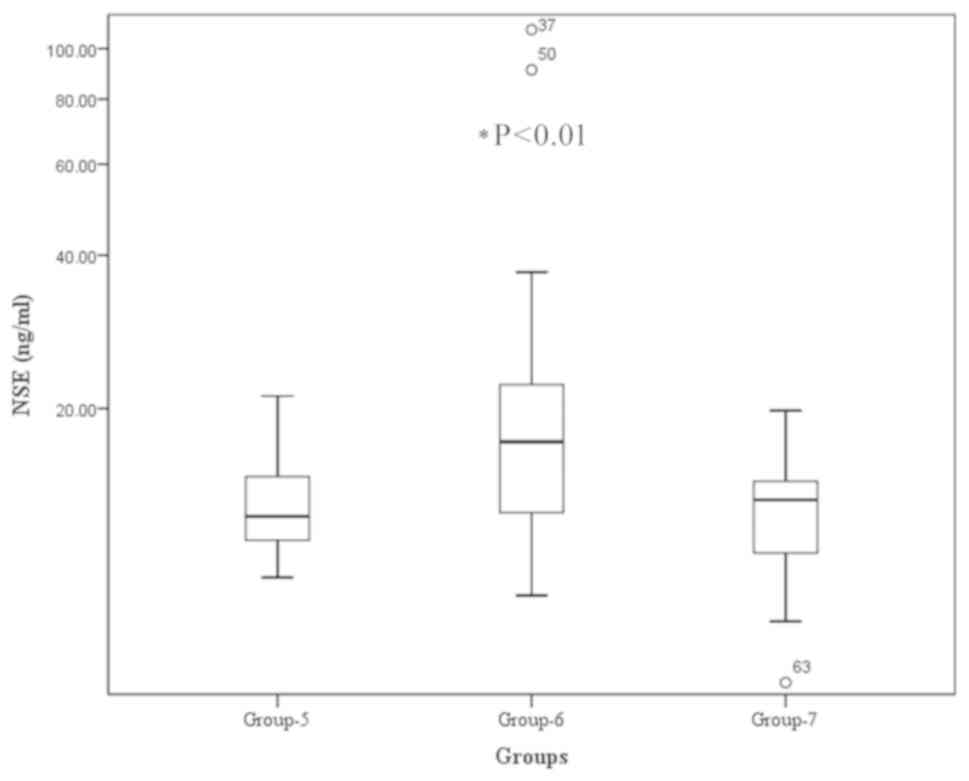
Serum NSE levels in patients with
GEP-NENs
The serum NSE levels were significantly higher in
patients with naive or recurrent GEP-NENs (Group 6), compared with
those with no detectable lesions post-surgery (Group 5) or the
healthy controls. The median NSE level in patients with naive or
recurrent NENs (Group 6) was 17.15 ng/ml, compared with 12.12 and
13.1 ng/ml in the treated group (Group 5) and control group (Group
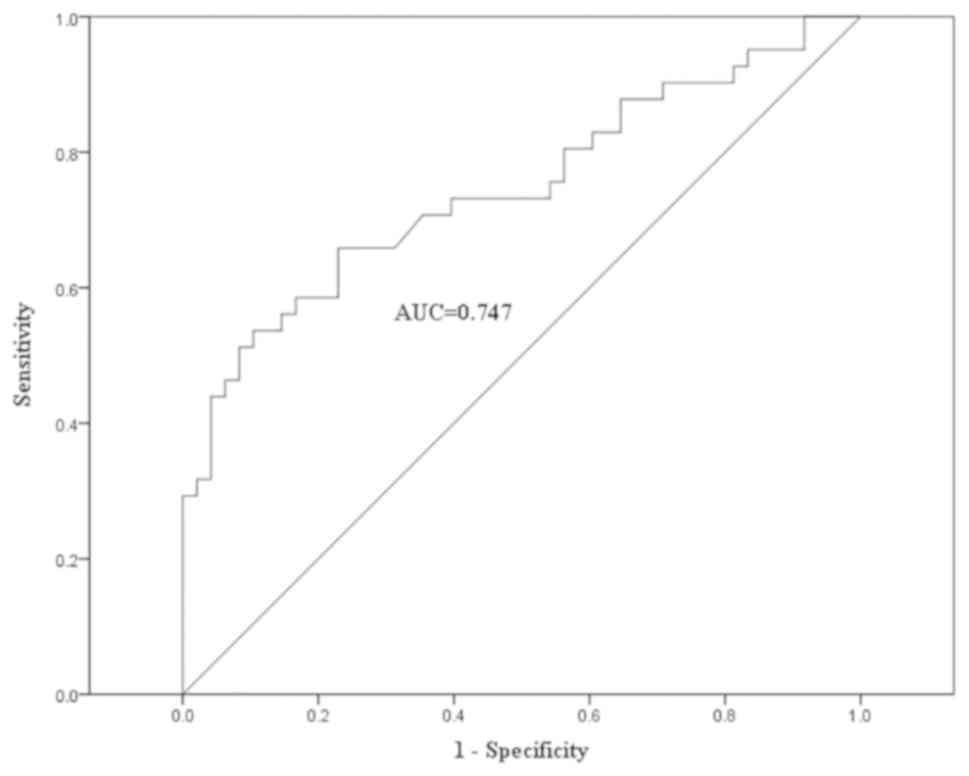
7), respectively (P<0.01; Fig. 4).
A ROC curve analysis of serum NSE levels was performed in 89
individuals (Fig. 5), including 41
patients with naive or recurrent GEP-NENs, 18 patients with treated
GEP-NENs and 30 healthy volunteers (negative controls). The ROC
curve indicated that a serum NSE cut-off concentration of 16.48
ng/ml gives 53.7% sensitivity and 89.6% specificity (AUC, 0.747).
The diagnostic efficacy of serum NSE is demonstrated in Table II. No significant association was
observed between the serum NSE levels and any clinical
characteristics in patients with GEP-NENs, including sex, age,
primary tumour origin, grading, metastasis, surgical status, or CgA
or CD56 expression.
| Table II.Diagnostic value of serum NSE
concentration in patients with gastroenteropancreatic
neuroendocrine neoplasms (n=41). |
Table II.
Diagnostic value of serum NSE
concentration in patients with gastroenteropancreatic
neuroendocrine neoplasms (n=41).
| Variables | n | Median NSE level,
ng/ml (range) | Z-value | P-value |
|---|
| Age, years |
|
| 0.392 | 0.695 |
|
<54 | 22 | 17.64
(13.74–21.6) |
|
|
|
≥54 | 19 | 14.48
(12.1–22.36) |
|
|
| Sex |
|
| 0.440 | 0.660 |
|
Male | 27 | 17.15
(12.13–21.34) |
|
|
|
Female | 14 | 17.38
(13.24–24.13) |
|
|
| Tumour site |
|
| 1.379 | 0.502 |
|
Stomach | 5 | 18.94
(10.56–20.45) |
|
|
|
Intestines | 16 | 14.48
(12.48–20.01) |
|
|
|
Pancreas | 20 | 17.87
(12.9–22.75) |
|
|
| Grade |
|
| 0.317 | 0.854 |
| G1 | 7 | 17.15
(12.1–21.34) |
|
|
| G2 | 27 | 15.44
(12.13–22.38) |
|
|
| G3 | 7 | 18.01
(15.16–19.55) |
|
|
| Lesions |
|
| 0.947 | 0.343 |
|
Primary | 15 | 19.55
(13.96–22.36) |
|
|
|
Recurrent | 26 | 15
(12.12–19.8) |
|
|
| Metastasis |
|
| 0.801 | 0.423 |
| No | 3 | 13.96a |
|
|
|
Yes | 38 | 17.21
(12.29–22.37) |
|
|
| IHC (CgA) |
|
| 1.789 | 0.074 |
| − | 8 | 14.05
(11.52–17.87) |
|
|
| + | 29 | 18.47
(13.27–22.63) |
|
|
| IHC (CD56) |
|
| 0.386 | 0.700 |
| − | 3 | 17.27a |
|
|
| + | 24 | 16.945
(12.11–19.4) |
|
|
Discussion
The worldwide incidence of NENs has risen markedly
in recent years, leading to widespread concern (6). The incidence of GEP-NENs in China
increased consistently between 2001 and 2010, with the highest
increases being in rectal and pancreatic NENs (5,11). Serum
CgA is a reliable circulating maker for the diagnosis of NENs and
is associated with tumour mass and patient survival (2,12–15). In the present study, it was
demonstrated that serum CgA levels were significantly higher in
patients with GEP-NENs compared with healthy controls, and that
they decreased to baseline concentrations in patients who were
treated following surgery. Serum CgA level may therefore serve as a
predictor of therapeutic response. GEP-NENs have a wide spectrum of
clinical presentations ranging from clinically silent to
tumour-derived peptide-associated symptoms, including flushing and
diarrhoea. In the present study, the serum CgA concentrations were
significantly higher in patients with GEP-NENs compared with those
with other digestive tract diseases (121.16 ng/ml vs. 41.41 ng/ml),
suggesting that this may be a useful tool for differentiating
between GEP-NENs and other digestive tract disorders.
Serum CgA was previously demonstrated to be
associated with tumour burden, treatment response and prognosis
(2,13,14,16).
However, in contrast to the results of a previous study (17), the CgA levels measured in the present
study were not significantly associated with age, sex or tumour
burden, and no difference was revealed in serum CgA levels with
regards to tumour grade (G1, G2 and G3). This discrepancy may be
due to different tumour origins. The variability of serum CgA
levels in patients with GEP-NENs may be explained by the difference
in tumour origin, differentiation and stage (18).
The WHO classification system introduced in 2000 was
based on a combination of pathological and clinical parameters, and
a new classification system focusing on staging and grading systems
was provided in 2010 (9). However,
NENs of different origins are associated with different biological
behaviours, and the G3 category includes a small number of tumours
(>20%) with well-differentiated characteristics, including cell
structure and alignment, and a proliferation marker protein Ki-67
index. To date, few studies have analysed the association between
NEN origin and serum CgA (19,20). In
the present study, the optimal serum CgA cut-off values were
determined for patients with tumours of different origins, and it
was revealed that serum CgA levels were higher in patients with
gastric NENs compared with those with pancreatic or intestinal NENs
(259.95, 161.95 and 57.67 ng/ml, respectively; P<0.001). In
addition, serum CgA levels were significantly increased in patients
with gastric NENs even at an early stage, whereas rectal NENs had
low levels of serum CgA. Serum CgA was therefore revealed to be
associated with tumour origin, as well as tumour staging. Future
studies will focus on the association between serum CgA and tumor
burden. The results indicate that serum CgA may assist in
identifying the tumour location, and understanding the variability
in CgA levels in GEP-NEN cases reported by various studies
(2,17,19).
To the best of our knowledge, only one study
investigated the CgA cut-off value for diagnosing GEP-NENs in
Chinese populations. In the present study, a cut-off value of 85.3
ng/ml serum CgA led to a sensitivity and specificity of 64.4 and
92.7%, respectively (AUC 0.83). This cut-off value is lower
compared with the recommended threshold of 95 ng/ml, giving the
best compromise between sensitivity (51.2%) and specificity
(87.5%), calculated in a previous study (21). The present study was the second to
calculate a cut-off value for serum CgA in a Chinese population.
The lower cut-off value of 85.3 ng/ml was associated with higher
sensitivity. Different serum CgA cut-off values were determined for
the detection of tumours at different sites, with a threshold of
96.72 ng/ml providing high sensitivity (92.3%) and specificity
(93.3%) for gastric NENs. However, a lower cut-off value (51.13
ng/ml) was recommended for enteric NENs, associated with moderate
sensitivity (64.3%) and specificity (70%). Furthermore, it was
demonstrated that high serum CgA levels were significantly
correlated with tumour CgA expression (R=0.341, P=0.015). However,
IHC CgA expression in enteric NENs has previously been demonstrated
to be lower compared with that in gastric NENs (22), which is consistent with the lower
serum CgA levels in enteric NENs determined in the present study.
Serum CgA demonstrated a lower sensitivity for detecting colon and
rectal NENs, whereas secretagogin (SCGN) was more sensitive as a
diagnostic marker for rectal NENs (23,24). The
diagnostic value of CgA combined with SCGN for the detection of
rectal NENs will be explored in future studies.
NSE is the neuron-specific isomer of the glycolytic
enzyme 2-phospho-D-glycerate hydrolase (or enolase), and is highly
expressed in NENs. In the present study, serum NSE levels were
revealed to be significantly higher in patients with advanced stage
or recurrent disease compared with patients who had their condition
controlled surgically. Significantly increased serum NSE levels may
indicate poor differentiation and a poor prognosis (25–27);
however, no significant correlation between serum NSE and CgA
levels was observed in patients with GEP-NENs in the present
study.
Serum CgA levels may vary according to the origin of
GEP-NENs. An overall cut-off value of 85.3 ng/ml is recommended for
the diagnosis of NENs in the Chinese population, but different
cut-off values are recommended for tumours depending on their
origin. However, the present study was conducted on a small
population size from a single centre, and further large-scale
population studies are required to clarify the role of serum CgA
concentrations in patients with GEP-NENs.
Acknowledgements
Not applicable.
Funding
The present study was supported by grants from the
National Natural Science Foundation of China (grant no. 81271604)
and the Jiangsu Provincial Nature Science Foundation (grant nos.
BL2012037 and BK2011104).
Availability of data and materials
The datasets used and analysed during the present
study are available from the corresponding author on reasonable
request, once the study has been published.
Authors' contributions
CZ, WQ and FW were in charge of design and
implementation of the study. CZ was in charge of statistical
analysis and writing the draft. FW made substantial contributions
to conception, framework and design. YH was in charge of
pathological interpretation. WQ was in charge of laboratory assays
and quality control, including NSE and CgA analysis. JL, XY, JW and
SZ made substantial contributions to clinical data collection and
clinical management. All authors were involved in drafting, reading
and approving the manuscript, and all agree to be accountable for
the results.
Ethics approval and consent to
participate
The present study was approved by the Ethics
Committee of Nanjing First Hospital, Nanjing Medical University.
Written informed consent to participate was obtained from all
participants, using a formulary approved by the Ethics
Committee.
Patient consent for publication
Not applicable.
Competing interests
The authors declare that they have no competing
interests.
Glossary
Abbreviations
Abbreviations:
|
CgA
|
chromogranin A
|
|
GEP-NEN
|
gastroenteropancreatic neuroendocrine
neoplasm
|
|
NEN
|
neuroendocrine neoplasm
|
|
NSE
|
neuron-specific enolase
|
|
IHC
|
immunohistochemistry
|
|
ROC
|
receiver operating characteristic
|
|
AUC
|
area under the curve
|
References
|
1
|
Konecki DS, Benedum UM, Gerdes HH and
Huttner WB: The primary structure of human chromogranin A and
pancreastatin. J Biol Chem. 262:17026–17030. 1987.PubMed/NCBI
|
|
2
|
Modlin IM, Gustafsson BI, Moss SF, Pavel
M, Tsolakis AV and Kidd M: Chromogranin A--biological function and
clinical utility in neuro endocrine tumor disease. Ann Surg Oncol.
17:2427–2443. 2010. View Article : Google Scholar : PubMed/NCBI
|
|
3
|
Påhlman S, Esscher T, Bergvall P and
Odelstad L: Purification and characterization of human
neuron-specific enolase: Radioimmunoassay development. Tumour Biol.
5:127–139. 1984.PubMed/NCBI
|
|
4
|
Baudin E, Gigliotti A, Ducreux M, Ropers
J, Comoy E, Sabourin JC, Bidart JM, Cailleux AF, Bonacci R, Ruffié
P and Schlumberger M: Neuron-specific enolase and chromogranin A as
markers of neuroendocrine tumours. Br J Cancer. 78:1102–1107. 1998.
View Article : Google Scholar : PubMed/NCBI
|
|
5
|
Fan JH, Zhang YQ, Shi SS, Chen YJ, Yuan
XH, Jiang LM, Wang SM, Ma L, He YT, Feng CY, et al: A nation-wide
retrospective epidemiological study of gastroenteropancreatic
neuroendocrine neoplasms in china. Oncotarget. 8:71699–71708.
2017.PubMed/NCBI
|
|
6
|
Yao JC, Hassan M, Phan A, Dagohoy C, Leary
C, Mares JE, Abdalla EK, Fleming JB, Vauthey JN, Rashid A and Evans
DB: One hundred years after ‘carcinoid’: Epidemiology of and
prognostic factors for neuroendocrine tumors in 35,825 cases in the
United States. J Clin Oncol. 26:3063–3072. 2008. View Article : Google Scholar : PubMed/NCBI
|
|
7
|
Plöckinger U, Rindi G, Arnold R, Eriksson
B, Krenning EP, de Herder WW, Goede A, Caplin M, Oberg K, Reubi JC,
et al: Guidelines for the diagnosis and treatment of neuroendocrine
gastrointestinal tumours. A consensus statement on behalf of the
European Neuroendocrine Tumour Society (ENETS). Neuroendocrinology.
80:394–424. 2004. View Article : Google Scholar : PubMed/NCBI
|
|
8
|
McEntee GP, Nagorney DM, Kvols LK, Moertel
CG and Grant CS: Cytoreductive hepatic surgery for neuroendocrine
tumors. Surgery. 108:1091–1096. 1990.PubMed/NCBI
|
|
9
|
Bosman FT, Carneiro F, Hruban RH and Theis
ND: WHO classification of tumours of the digestive system. (4th).
(Lyon). International Agency for Research on Cancer.
2010.PubMed/NCBI
|
|
10
|
Chinese Pathologic Consensus Group for
Gastrointestinal and Pancreatic Neuroendocrine Neoplasm: China
Consensus Guidelines for the standards of histopathologic diagnosis
in Gastroenteropancreatic Neuroendocrine neoplasm. Chin J Pathol.
40:257–262. 2011.
|
|
11
|
Modlin IM, Lye KD and Kidd M: A 5-decade
analysis of 13,715 carcinoid tumors. Cancer. 97:934–959. 2003.
View Article : Google Scholar : PubMed/NCBI
|
|
12
|
Oberg K, Modlin IM, De Herder W, Pavel M,
Klimstra D, Frilling A, Metz DC, Heaney A, Kwekkeboom D, Strosberg
J, et al: Consensus on biomarkers for neuroendocrine tumour
disease. Lancet Oncol. 16:e435–e446. 2015. View Article : Google Scholar : PubMed/NCBI
|
|
13
|
Yao JC, Pavel M, Phan AT, Kulke MH, Hoosen
S, St Peter J, Cherfi A and Öberg KE: Chromogranin A and
neuron-specific enolase as prognostic markers in patients with
advanced pNET treated with everolimus. J Clin Endocrinol Metab.
96:3741–3749. 2011. View Article : Google Scholar : PubMed/NCBI
|
|
14
|
Arnold R, Wilke A, Rinke A, Mayer C, Kann
PH, Klose KJ, Scherag A, Hahmann M, Müller HH and Barth P: Plasma
chromogranin A as marker for survival in patients with metastatic
endocrine gastroenteropancreatic tumors. Clin Gastroenterol
Hepatol. 6:820–827. 2008. View Article : Google Scholar : PubMed/NCBI
|
|
15
|
Jianming X, Houjie L, Shukui Q and Hui LW:
Expert consensus on neuroendocrine tumors of the pancreas and
stomach in China. J Clini Oncol. 21:927–946. 2016.
|
|
16
|
Jun E, Kim SC, Song KB, Hwang DW, Lee JH,
Shin SH, Hong SM, Park KM and Lee YJ: Diagnostic value of
chromogranin A in pancreatic neuroendocrine tumors depends on tumor
size: A prospective observational study from a single institute.
Surgery. 162:120–130. 2017. View Article : Google Scholar : PubMed/NCBI
|
|
17
|
Cimitan M, Buonadonna A, Cannizzaro R,
Canzonieri V, Borsatti E, Ruffo R and De Apollonia L: Somatostatin
receptor scintigraphy versus chromogranin A assay in the management
of patients with neuroendocrine tumors of different types: Clinical
role. Ann Oncol. 14:1135–1141. 2003. View Article : Google Scholar : PubMed/NCBI
|
|
18
|
Basturk O, Yang Z, Tang LH, Hruban RH,
Adsay V, McCall CM, Krasinskas AM, Jang KT, Frankel WL, Balci S, et
al: The high-grade (WHO G3) pancreatic neuroendocrine tumor
category is morphologically and biologically heterogenous and
includes both well differentiated and poorly differentiated
neoplasms. Am J Surg Pathol. 39:683–690. 2015. View Article : Google Scholar : PubMed/NCBI
|
|
19
|
Hijioka M, Ito T, Igarashi H, Fujimori N,
Lee L, Nakamura T, Jensen RT and Takayanagi R: Serum chromogranin A
is a useful marker for Japanese patients with pancreatic
neuroendocrine tumors. Cancer Sci. 105:1464–1471. 2014. View Article : Google Scholar : PubMed/NCBI
|
|
20
|
Qiao XW, Qiu L, Chen YJ, Meng CT, Sun Z,
Bai CM, Zhao DC, Zhang TP, Zhao YP, Song YL, et al: Chromogranin A
is a reliable serum diagnostic biomarker for pancreatic
neuroendocrine tumors but not for insulinomas. BMC Endocr Disord.
14:642014. View Article : Google Scholar : PubMed/NCBI
|
|
21
|
Wang YH, Yang QC, Lin Y, Xue L, Chen MH
and Chen J: Chromogranin A as a marker for diagnosis, treatment,
and survival in patients with gastroenteropancreatic neuroendocrine
neoplasm. Medicine (Baltimore). 93:e2472014. View Article : Google Scholar : PubMed/NCBI
|
|
22
|
Kloppel G, Couvelard A, Perren A,
Komminoth P, McNicol AM, Nilsson O, Scarpa A, Scoazec JY,
Wiedenmann B, Papotti M, et al: ENETS Consensus guidelines for the
standards of care in neuroendocrine tumors: Towards a standardized
approach to the diagnosis of gastroenteropancreatic neuroendocrine
tumors and their prognostic stratification. Neuroendocrinology.
90:162–166. 2009. View Article : Google Scholar : PubMed/NCBI
|
|
23
|
Lai M, Lü B, Xing X, Xu E, Ren G and Huang
Q: Secretagogin, a novel neuroendocrine marker, has a distinct
expression pattern from chromogranin A. Virchows Arch. 449:402–409.
2006. View Article : Google Scholar : PubMed/NCBI
|
|
24
|
Xing X, Lai M, Gartner W, Xu E, Huang Q,
Li H and Chen G: Identification of differentially expressed
proteins in colorectal cancer by proteomics: Down-regulation of
secretagogin. Proteomics. 6:2916–2923. 2006. View Article : Google Scholar : PubMed/NCBI
|
|
25
|
D'Alessandro M, Mariani P, Lomanto D,
Carlei F, Lezoche E and Speranza V: Serum neuron-specific enolase
in diagnosis and follow-up of gastrointestinal neuroendocrine
tumors. Tumour Biol. 13:352–357. 1992. View Article : Google Scholar : PubMed/NCBI
|
|
26
|
Cunningham RT, Johnston CF, Irvine GB and
Buchanan KD: Serum neurone-specific enolase levels in patients with
neuroendocrine and carcinoid tumours. Clin Chim Acta. 212:123–131.
1992. View Article : Google Scholar : PubMed/NCBI
|
|
27
|
Oishi S and Sato T: Elevated serum
neuron-specific enolase in patients with malignant
pheochromocytoma. Cancer. 61:1167–1170. 1988. View Article : Google Scholar : PubMed/NCBI
|