Introduction
In the World Health Organization (WHO) European
Region (ER), colorectal cancer (CRC) is the first tumour by
incidence, with 471,000 new cases each year and a mean mortality
rate of 28.2 per 100,000 Population (1). Incidence varies, peaking in central
European States and showing the lowest rates in some Mediterranean
States (2). CRC incidence and
mortality in a population are also related to changes in the
prevalence of some modifiable risk factors such as smoking, alcohol
consumption, and diet. According to epidemiological evidence, the
risk of developing CRC increases in relation to lifestyle (i.e.
consumption of red meat, increased alcohol consumption, etc.)
(3). In addition to primary
prevention, early detection and improved diagnosis and treatment of
symptomatic disease are potential factors that contribute to
decreasing CRC incidence and mortality.
Randomized controlled trials (RCT) have shown that
screening is associated with a reduction in mortality (4). Furthermore, CRC screening based on stool
testing (FOBT test) and flexible sigmoidoscopy has reduced
CRC-related mortality respectively by 16 and 22–31% (5,6). According
to cost-effectiveness studies, CRC screening is cost-effective
compared with no screening (7).
Screening for CRC is a complex process that includes
the initial screening test as well as follow-up diagnostic tests if
needed. Compared with spontaneous screening (also called
opportunistic), organized screening involves a greater focus on the
quality of the screening process, including follow-up (8). According to Karsa and colleagues
(9), at least 10 years are needed to
plan and organize a screening programme, and still longer to assess
the impact of a population-based (PB) programme in a country. After
a European Parliament resolution invited Member States (MS) to
adopt cancer screening programmes in 2010, several European
countries have introduced organized, PB CRC screening programmes
and others are planning to do so (1,2). Moreover,
high-quality cancer screening is nearly always available in
countries wealth and gross national income (GNI) level (10). Most high GNI countries in Europe are
Members States (MS) of the European Union (EU). The aim of this
study was to describe factors that correlation with CRC burden and
prevention actions in WHO European Region.
Materials and methods
GNI
According to the World Bank, economies can be
divided into low income (LI), lower-middle income (LMI),
upper-middle income (UMI), and high income (HI) in relation to GNI
per capita (10). In this study, the
53 WHO, ER countries were thus divided into: LMI, $1,026-4,035
(Armenia, Georgia, Kyrgyzstan, Moldova, Tajikistan, Ukraine and
Uzbekistan); UMI, $4,036-12,475 [Albania, Azerbaijan, Belarus,
Bosnia and Herzegovina, Bulgaria, Kazakhstan, FYR Macedonia (FM),
Hungary, Montenegro, Romania, Serbia, Turkey, Turkmenistan]; and
HI, $12,476 (Austria, Belgium, Czech Republic, Denmark, Estonia,
Finland, France, Germany, Greece, Iceland, Ireland, Israel, Italy,
Luxembourg, Norway, Poland, Portugal, Slovakia, Slovenia, Spain,
Sweden, Switzerland, The Netherlands, and United Kingdom, Andorra,
Croatia, Cyprus, Malta, Monaco, Latvia, Lithuania, Russian
Federation, and San Marino) (World Bank Country and Lending Groups
2016) (Table I).
 | Table I.Differences of colorectal cancer
burden and screening programs in 53 Countries of World Health
Organization European Region as of June 2017. |
Table I.
Differences of colorectal cancer
burden and screening programs in 53 Countries of World Health
Organization European Region as of June 2017.
| A, Cluster 1 |
|---|
|
|---|
|
|
Incidencea |
Mortalitya |
|
|
|
|
|
|
|
|---|
|
|
|
|
|
|
|
|
|
|
|
|---|
| Population | M | F | M and F | M | F | M and F | Life expectancy Year
2015 M and Fb | Screening
programmec | Regionsc | Testc–g | Age
targetc–g | Screening
Intervalc–g | Payment
Policyc–g |
|---|
| Uzbekistan | 5.6 | 4.9 | 5.3 | 3.9 | 3.3 | 3.9 | 68.5 | Unknown | NR | NA | NR | NR | NR |
| Outside European |
| Institutions |
| Tajikistan | 7.3 | 4.0 | 5.5 | 5.1 | 2.8 | 3.6 | 69.8 | Unknown | NR | NR | NR | NR | NR |
| Outside European |
| Institutions |
| Azerbaijan | 7.1 | 6.4 | 6.7 | 4.3 | 4.0 | 4.6 | 70.8 | Spontaneous | NR | iFOBT | NR | NR | NR |
| Outside European |
| Institutions |
| Kyrgyzstan | 8.1 | 8.3 | 8.2 | 5.7 | 5.8 | 4.1 | 70.7 | Unknown | NR | NA | NR | NR | NR |
| Outside
European |
| Institutions |
| Albania | 9.0 | 7.9 | 8.4 | 4.8 | 3.9 | 5.8 | 78.0 | Unknown | NR | NA | NR | NR | NR |
| Georgia | 9.9 | 7.5 | 8.5 | 5.5 | 4.0 | 5.7 | 74.8 | Organized, NPB | All nation | gFOBT | 50–69 | 2 | Free of charge |
| Turkmenistan | 9.3 | 9.0 | 9.0 | 6.0 | 5.7 | 4.4 | 65.7 | Not organized | NR | iFOBT | NR | NR | NR |
| Outside
European |
| Institutions |
| Greece | 16.3 | 11.2 | 13.5 | 9.2 | 6.1 | 13.7 | 81.6 | Spontaneous | All nation | FOBT | 50–70 | 2 | NR |
| Turkey | 20.5 | 13.1 | 16.6 | 12.6 | 7.8 | 7.5 | 75.4 | Organized, PB | All nation | FOBT | 50–69 | 2 | Free of charge |
| Bosnia and | 20.7 | 13.3 | 16.6 | 12.7 | 7.7 | 11.1 | 76.6 | Organized, | Regional | FOBT | >50 | NR | NR |
| Herzegovina |
|
|
|
|
|
|
| PB spontaneous | All nation | FOBT | >50 |
|
|
| Armenia | 22.8 | 17.0 | 19.3 | 13.4 | 9.7 | 9.8 | 74.8 | Spontaneous | NR | iFOBT | NR | NR | NR |
|
| B, Cluster
2 |
|
|
|
Incidencea |
Mortalitya |
|
|
|
|
|
|
|
|
|
|
|
|
|
|
|
|
|
|
|
Population | M | F | M and F | M | F | M and F | Life expectancy
Year 2015 M and Fb | Screening
programmec |
Regionsc |
Testc–g | Age
targetc–g | Screening
Intervalc–g | Payment
Policyc–g |
|
| Kazakhstan | 29.1 | 19.4 | 22.8 | 16.9 | 10.7 | 10.0 | 72.0 | Organized, PB | All nation | FOBT | 50–70 | 2 | NA |
| Outside
European |
| Institutions |
| Ukraine | 29.9 | 19.8 | 23.4 | 18.8 | 10.8 | 14.5 | 71.2 | Unknown | NR | NA | NR | NR | NR |
| Lithuania | 31.2 | 18.9 | 23.4 | 19.7 | 10.2 | 13.7 | 75.1 | Spontaneous, | All nation | iFOBT | 50–74 | 2 | Free of |
|
|
|
|
|
|
|
|
| NPB |
|
|
|
| charge |
| Finland | 28.2 | 19.7 | 23.5 | 10.2 | 6.9 | 10.4 | 81.4 | Organized, PB | All nation | FOBT | 50–69 | 2 | Free of |
|
|
|
|
|
|
|
|
|
|
|
|
|
| charge |
| Latvia | 30.0 | 20.2 | 23.7 | 17.7 | 10.4 | 15.9 | 74.1 | Spontaneous, | All nation | gFOBT | >50 | 2 | Free of |
|
|
|
|
|
|
|
|
| NPB |
|
|
|
| charge |
| FRY of Macedonia
Belarus | 28.4 | 20.5 | 24.3 | 15.5 | 10.8 | 13.4 | 75.5 | Unknown | NR | FOBT | NR | NR | NR |
| Outside
European |
| Institutions | 30.9 | 20.7 | 24.4 | 17.5 | 10.4 | 12.8 | 73.6 | Not organized | NR | NR | NR | NR | NR |
| Russian
Federation | 30.0 | 21.8 | 24.5 | 19.9 | 12.6 | 9.9 | 70.9 | Organized | St. Petersburg
region | iFOBT | 48–75 | 2 | NR |
| Outside
European |
| Institutions |
| Cyprus | 27.3 | 22.2 | 24.5 | 8.6 | 5.3 | 13.0 | 80.3 | Organized, PB | All nation | gFOBT | >50 | Once | Free of |
|
|
|
|
|
|
|
|
| Organized, PB | All nation | Coloscopy | >55 | Once | charge |
| Austria | 34.0 | 19.6 | 26.0 | 13.3 | 7.2 | 16.6 | 81.8 | Spontaneous, | All nation | iFOBT | >50 | 2 | Insurance |
|
|
|
|
|
|
|
|
| NPB |
| Coloscopy |
| 10 | Copayment |
| Romania | 34.5 | 20.2 | 26.4 | 18.2 | 9.7 | 12.9 | 75.0 | Unknown | NR | NA | NR | NR | NR |
| Poland | 37.2 | 19.5 | 27.0 | 20.6 | 10.3 | 12.9 | 78.2 | Organized, PB | All nation | Colonoscopy | 50–66 | 10 | Free of |
|
|
|
|
|
|
|
|
|
|
|
|
|
| charge |
| Estonia | 35.1 | 22.6 | 27.2 | 17.6 | 9.4 | 15.2 | 77.1 | Organized, PB | All nation | FOBT | 50–74 | 2 | Free of |
|
|
|
|
|
|
|
|
|
|
|
|
|
| charge |
| Montenegro | 36.2 | 21.1 | 28.2 | 20.7 | 12.0 | 11.2 | 76.3 | Unknown | NR | NA | NR | NR | NR |
| Republic of
Moldova | 36.0 | 23.0 | 28.3 | 22.0 | 12.6 | 8.3 | 71.6 | Spontaneous | NR | iFOBT | NR | NR | NR |
| Bulgaria | 40.0 | 25.1 | 31.5 | 21.3 | 12.0 | 12.3 | 74.5 | Spontaneous | NR | iFOBT
Coloscopy | NR | NR | NR |
| Serbia | 43.4 | 23.3 | 32.6 | 22.8 | 11.5 | 9.3 | 75.5 | Organized, PB | All nation | iFOBT | 50–74 | 2 | Free of charge |
| Croatia | 44.2 | 24.7 | 32.9 | 26.7 | 13.0 | 18.0 | 77.3 | Organized, PB | All nation | gFOBT | 50–74 | 2 | Free of charge |
|
| C, Cluster
3 |
|
|
|
Incidencea |
Mortalitya |
|
|
|
|
|
|
|
|
|
|
|
|
|
|
|
|
|
|
|
Population | M | F | M and F | M | F | M and F | Life expectancy
Year 2015 M and Fb | Screening
programmec |
Regionsc |
Testc–g | Age
targetc–g | Screening
Intervalc–g | Payment
Policyc–g |
|
| Ireland | 43.1 | 27.7 | 34.9 | 16.0 | 8.9 | 16.5 | 81.5 | Organized, PB | All nation | iFOBT | 55–74 | 2 | Free of charge |
| Israel | 43.0 | 30.3 | 35.9 | 12.6 | 10.0 | 10.7 | 82.1 | Organized, PB | All nation | iFOBT | 50–74 | 2 | Free of charge |
| Outside
European |
| Institutions |
| Belgium | 45.2 | 29.5 | 36.7 | 14.7 | 9.5 | 13.4 | 81.3 | Organized, PB | Regional | gFOBT | 50–74 | 2 | Free of charge |
| Slovenia | 49.7 | 27.0 | 37.0 | 22.9 | 11.2 | 16.2 | 81.1 | Organized, PB | All nation | iFOBT | 50–69 | 2 | Free of charge |
| Czech Republic | 54.0 | 27.1 | 38.9 | 22.6 | 9.9 | 16.0 | 79.5 | Spontaneous, | All nation | gFOBT | 50–54 | 1 | Insurance |
|
|
|
|
|
|
|
|
| NPB |
| gFOBT | >55 | 2 | Copayment |
|
|
|
|
|
|
|
|
|
|
| Coloscopy |
| 10 |
|
| Norway | 42.6 | 35.8 | 38.9 | 14.2 | 12.1 | 14.5 | 82.1 | Organized, PB | Regional | iFOBT | 55–64 | 2 | Free of charge |
| Netherlands | 47.5 | 33.9 | 40.2 | 16.0 | 11.2 | 13.0 | 81.7 | Organized, PB | All nation | iFOBT | 55–75 | 2 | Free of charge |
| Denmark | 45.9 | 37.5 | 40.5 | 16.8 | 12.5 | 20.8 | 81.1 | Organized, PB | All nation | gFOBT | 50–74 | 2 | Free of charge |
| Hungary | 58.9 | 30.5 | 42.3 | 30.1 | 14.5 | 15.4 | 76.0 | Organized, PB | All nation | iFOBT | 50–70 | 2 | Free of charge |
| Slovakia
Republic | 61.6 | 29.3 | 42.7 | 26.9 | 12.0 | 12.3 | 77.2 | Spontaneous,
NPB | All nation | Coloscopy | >50 | 2 | Free of charge |
|
| D, Cluster
4 |
|
|
|
Incidencea |
Mortalitya |
|
|
|
|
|
|
|
|
|
|
|
|
|
|
|
|
|
|
|
Population | M | F | M and F | M | F | M and F | Life expectancy
Year 2015 M and Fb | Screening
programmec |
Regionsc |
Testc–g | Age
targetc–g | Screening
Intervalc–g | Payment
Policyc–g |
|
| Iceland | 29.9 | 28.2 | 28.4 | 9.3 | 5.8 | 6.9 | 82.9 | Spontaneous, but
programmed as organized | All nation | iFOBT | 55–75 | 2 | Free of charge |
| Sweden | 32.3 | 26.5 | 29.2 | 12.2 | 9.7 | 7.4 | 82.6 | Organized, PB | Regional | gFOBT | 60–69 | 2 | Free of charge |
| Switzerland | 36.3 | 23.6 | 29.4 | 12.8 | 6.4 | 12.2 | 83.2 | Spontaneous | All nation | iFOBT | 50–70 | 2 | Insurance |
|
|
|
|
|
|
|
|
|
|
| Coloscopy |
| 10 | Copayment |
| France
(Metrop.) | 36.1 | 24.9 | 30.0 | 12.9 | 8.0 | 10.8 | 82.7 | Organized, PB | All nation | FOBT | 50–74 | 2 | Free of charge |
| United Kingdom | 36.8 | 24.4 | 30.2 | 13.0 | 8.7 | 13.6 | 82.0 | Organized, PB | All nation | gFOBT | 50–74 | 2 | Free of charge |
| Germany | 39.7 | 23.3 | 30.9 | 13.1 | 8.1 | 11.8 | 81.1 | Spontaneous, | All nation | gFOBT | 50–54 | 1 | Insurance |
|
|
|
|
|
|
|
|
| NPB |
| gFOBT | >55 | 2 | Copayment |
|
|
|
|
|
|
|
|
|
|
| Coloscopy |
| 10 |
|
| Luxembourg | 42.1 | 21.6 | 31.5 | 13.9 | 8.8 | 12.2 | 82.2 | Spontaneous,
NPB | All nation | iFOBT | 55–74 | 2 | Free of charge |
| Portugal | 41.8 | 23.6 | 31.7 | 19.0 | 9.4 | 10.2 | 81.5 | Organized, PB | Regional | FOBT | 50–70 | 2 | Free of charge |
| Malta | 39.9 | 25.2 | 31.9 | 14.5 | 10.4 | 18.7 | 81.9 | Organized, PB | All nation | iFOBT | 60–64 | 2 | Free of charge |
| Spain | 43.9 | 24.2 | 33.1 | 17.1 | 8.4 | 10.9 | 83.4 | Organized, PB | All nation | iFOBT | 50–69 | 2 | Free of charge |
| Italy | 41.5 | 27.5 | 33.9 | 13.5 | 8.6 | 11.1 | 83.5 | Organized, PB | All nation | iFOBT | 50–70 | 2 | Free of |
|
|
|
|
|
|
|
|
|
|
| Coloscopy | 58 or 60 | Once | Charge |
| Andorra | NR | NR | NR | NR | NR | NR | NR | NR | NR | iFOBT
Coloscopy | NR | NR | NR |
| Monaco | NR | NR | NR | NR | NR | NR | NR | NR | All nation | iFOBT | 50–80 | 2 | Free of charge |
| San Marino | NR | NR | NR | NR | NR | NR | NR | NR | All nation | iFOBT | 50–79 | 2 | Free of charge |
Sources of WHO European
Epidemiological Data
The main data source, the GLOBOCAN 2012 website of
the International Agency for Research on Cancer (IARC), provides
access to several databases that allow assessing the impact of CRC
in 184 countries or territories in the world (1).
These data were supplemented using the literature,
ministerial web pages of individual countries, WHO web and Europe
EU pages, World Bank Open Data Web pages, and the World Cancer
Registry, X edition.
The quality of epidemiological data of each WHO ER
country was evaluated (11). All
analyzed disaggregated data are reported in Table II.
| Table II.Epidemiological data quality in each
Country of World Health Organization European Region. |
Table II.
Epidemiological data quality in each
Country of World Health Organization European Region.
| A, Cluster 1 |
|---|
|
|---|
|
| Quality of
data |
|---|
|
|
|
|---|
|
| Data source | Methods |
|---|
|
|
|
|
|---|
| Country |
Incidencea |
Mortalitya |
Incidencea |
Mortalityb |
|---|
| Uzbekistan Outside
European Institutions | G | 2 | 5 | 2 |
| Tajikistan Outside
European Institutions | G | 3 | 5 | 2 |
| Azerbaijan Outside
European Institutions | G | 2 | 5 | 2 |
| Kyrgyzstan Outside
European Institutions | G | 2 | 5 | 1 |
| Albania | G | 3 | 4 | 1 |
| Georgia | G | 2 | 5 | 2 |
| Turkmenistan
Outside European Institutions | G | 2 | 5 | 1 |
| Greece | G | 3 | 4 | 1 |
| Turkey | C | 6 | 6 | 5 |
| Bosnia and
Herzegovina | D | 5 | 2 | 2 |
| Armenia | G | 3 | 5 | 2 |
|
| B, Cluster
2 |
|
|
| Quality of
data |
|
|
|
|
| Data
source | Methods |
|
|
|
|
| Country |
Incidencea |
Mortalitya |
Incidencea |
Mortalityb |
|
| Kazakhstan Outside
European Institutions | G | 2 | 5 | 2 |
| Ukraine | A | 2 | 2 | 2 |
| Lithuania | A | 1 | 1 | 1 |
| Finland | A | 1 | 1 | 1 |
| Latvia | A | 1 | 1 | 1 |
| FRY of
Macedonia | G | 3 | 4 | 1 |
| Belarus Outside
European Institutions | A | 2 | 1 | 2 |
| Russian Federation
Outside European Institutions | D | 2 | 1 | 1 |
| Cyprus | A | 3 | 2 | 2 |
| Austria | A | 2 | 1 | 1 |
| Romania | E | 1 | 4 | 1 |
| Poland | C | 3 | 3 | 1 |
| Estonia | A | 1 | 1 | 1 |
| Montenegro | G | 6 | 9 | 6 |
| Republic of
Moldova | A | 2 | 1 | 1 |
| Serbia | B | 2 | 4 | 1 |
| Bulgaria | A | 2 | 1 | 1 |
| Croatia | A | 2 | 1 | 1 |
|
| C, Cluster
3 |
|
| Quality of
data |
|
|
|
|
| Data
source | Methods |
|
|
|
|
| Country |
Incidencea |
Mortalitya |
Incidencea |
Mortalityb |
|
| Ireland | A | 1 | 1 | 1 |
| Israel Outside
European Institutions | A | 2 | 1 | 1 |
| Belgium | A | 2 | 2 | 2 |
| Slovenia | A | 1 | 1 | 1 |
| Czech Republic | A | 2 | 1 | 1 |
| Norway | A | 2 | 1 | 1 |
| Netherlands | A | 2 | 1 | 1 |
| Denmark | A | 2 | 1 | 1 |
| Hungary | G | 1 | 4 | 1 |
| Slovakia
Republic | A | 1 | 1 | 1 |
|
| D, Cluster
4 |
|
|
| Quality of
data |
|
|
|
|
| Data
source | Methods |
|
|
|
|
| Country |
Incidencea |
Mortalitya |
Incidencea |
Mortalityb |
|
| Iceland | A | 1 | 1 | 1 |
| Sweden | A | 2 | 3 | 1 |
| Switzerland | B | 2 | 3 | 1 |
| France
(Metrop.) | B | 2 | 3 | 1 |
| United Kingdom | A | 1 | 1 | 1 |
| Germany | B | 2 | 1 | 1 |
| Luxembourg | D | 2 | 4 | 1 |
| Portugal | C | 3 | 4 | 1 |
| Malta | A | 1 | 1 | 1 |
| Spain | B | 2 | 3 | 1 |
| Italy | B | 2 | 3 | 1 |
| Andorra | NR | NR | NR | NR |
| Monaco | NR | NR | NR | NR |
| San Marino | NR | NR | NR | NR |
It is underlined that Andorra, Monaco, and San
Marino were not included in the analysis because no data were
reported.
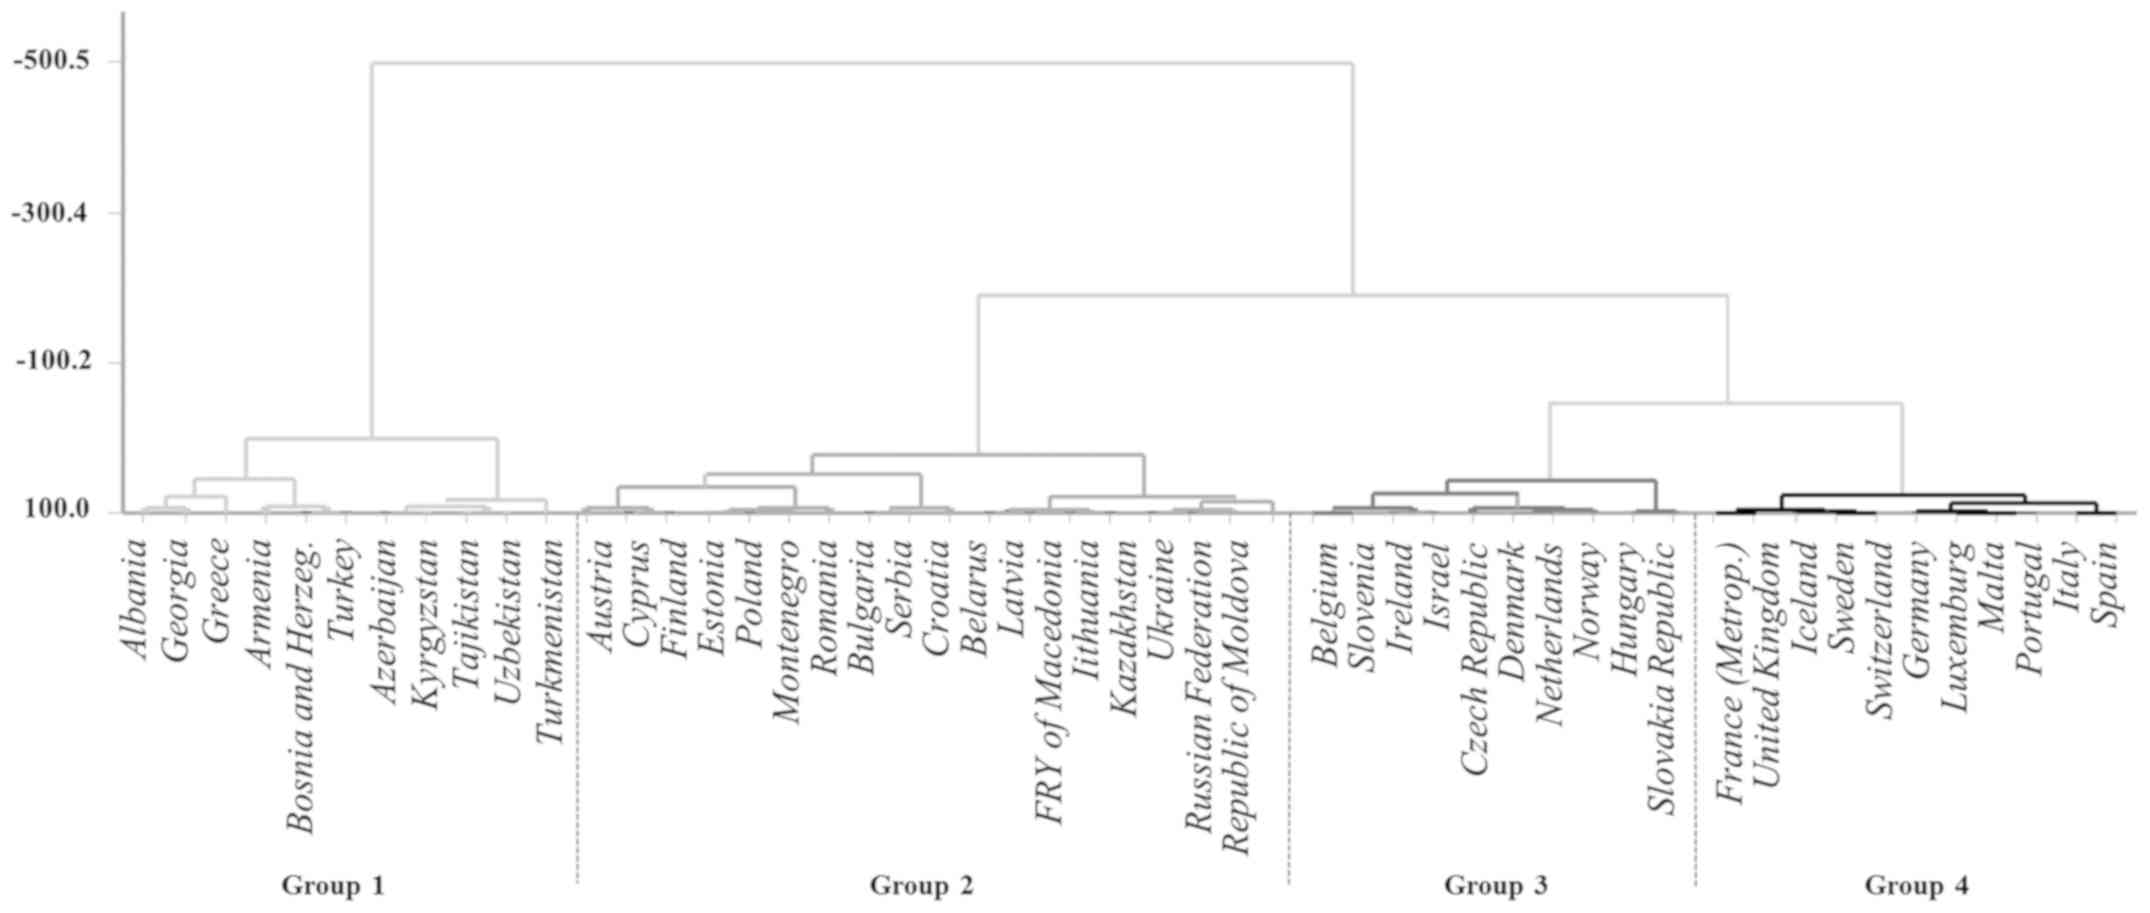
Statistical analysis
Clusters were obtained using ward-linkage clustering
analysis. In cluster analysis incidence and life expectancy data
were included and we obtained 4 groups of countries (clusters)
consisting of values close to each other of incidence and life
expectancy.
The object of Multiple Correspondence Analysis (MCA)
is to analyse categorical/categorized data that are transformed
into cross tables and to demonstrate the results in a graphical
manner. Multiple Correspondence Analysis (MCA) is a powerful
descriptive statistical technique for handling larger, more complex
datasets.
The dimensions can be interpreted in terms of
distances: The more a variable (i.e. low mortality) is placed in
the Cartesian plane far from the origin of the axis, the more it
has a strong discriminating power and therefore characterizing the
analysis. On the contrary, the more a variable (i.e. FOBT test)
takes on a value close to the origin of the axis, the less it will
have a discriminating value. Multiple Correspondence Analysis was
applied to examine the association among the following variables:
Clusters, GNI level (LMI, UMI and HI); type of CRC screening
programme in country (coverage national/non-national;
spontaneous/organized) (1,12); existence of cancer registries; payment
policies (insurance co-payment, free of charge); tests offered
(FOBT and colonoscopy, only FOBT, only colonoscopy, no test);
mortality and data quality. The latter measures included the
availability of incidence data, the availability of mortality data,
the methods adopted to estimate incidence rates, and the methods
used to estimate mortality rates. These variables were coded as
ordinal or nominal or dummy variables, as appropriate, and
incorporated into the model.
Data quality was grouped and defined according to:
i) The availability of incidence data (three categories): ‘High
quality’, ‘medium quality’, and ‘low quality’ (11,13); ii)
The availability of mortality data (three categories):
‘High/medium’, ‘low’ and ‘incomplete or absent’ (11,13); iii)
the quality of the method adopted to estimate incidence rates
(three categories): ‘High’; ‘medium’ and ‘low’ (11,13); iv)
the quality of the method used to estimate mortality rates (three
categories): ‘High’, ‘medium’ and ‘low’ (11,13). SPSS
(version 22) and Minitab (version 18.1.0) software were used for
statistical analysis.
Results
Cluster analysis
The cluster analysis has identified four clusters
including 50 out of 53 WHO ER countries. The results are
represented in Fig. 1.
Cluster 1 includes 11 countries: Albania, Georgia,
Greece, Armenia, Bosnia and Herzegovina, Turkey, Azerbaijan,
Kyrgyzstan, Tajikistan, Uzbekistan and Turkmenistan. Respect to all
countries of WHO ER this cluster grouped 7/11 countries with the
lowest incidence rates, and 5/8 countries with the lowest mortality
rates.
Cluster 2 includes 18 countries: Austria, Cyprus,
Finland, Estonia, Poland, Montenegro, Romania, Bulgaria, Serbia,
Croatia, Belarus, Latvia, FYR Macedonia [FM], Lithuania,
Kazakhstan, Ukraine, Russian Federation, Republic of Moldova. This
cluster includes countries with high income (Austria, Croatia,
Cyprus, Estonia, Finland, Latvia, Lithuania, Poland and Russian
Federation), while East-European and Asian countries (Belarus,
Bulgaria, FRY of Macedonia, Montenegro, Romania, Serbia and
Kazakhstan) have upper-middle income. Republic of Moldova and
Ukraine have low-middle income.
Cluster 3 includes 10 countries: Belgium, Slovenia,
Ireland, Israel, Czech Republic, Denmark, The Netherlands, Norway,
Hungary, Slovakia; countries with the highest incidence rates. This
cluster includes countries with high income, except for Hungary
with upper-middle income.
Cluster 4 includes 11 countries: France, United
Kingdom, Iceland, Sweden, Switzerland, Germany, Luxembourg, Malta,
Portugal, Italy, Spain; countries with the highest life expectancy.
The cluster includes only countries with high income.
Multiple correspondence analysis
The results of MCA are represented in Fig. 2 (object scores plot). The data
provided two dimensions with values that explain 78% of the
variance: Dimension 1=0.51 and dimension 2=0.27. The first
dimension is related to the following variables: Cluster, test
offered, GNI level, availability of incidence data and the quality
of the method applied to estimate incidence and mortality; the
second dimension is related to the availability of mortality data
and the quality of the method applied to estimate mortality.
Fig. 2 is subdivided
in four quadrants whose numbering is counter clockwise. In the
first quadrant (upper right), the modality of variables found are:
Low/medium mortality rates, medium quality incidence data,
incomplete/low or absent quality mortality data and low-quality of
methods applied to estimate mortality, UM income, no test offered.
The modality of variables found in the second quadrant (upper left)
are: Clusters 2 and 4, medium/high mortality rates, medium quality
methods to estimate incidence, no-national register,
population-based screening, organized screening, FOBT as test
offered and free of charge. The third quadrant (lower left)
includes: Cluster 3, high mortality rates, H income, tests offered
(colonoscopy, FOBT and colonoscopy), the existence of a national
registry, population-based screening, high-quality availability of
incidence data, high-quality methods used to estimate incidence and
mortality rates, medium/high-quality availability of mortality
data, national screening, payment of insurance policy.
The modality of variables found in the fourth
quadrant (lower right) includes: Cluster 1, LM income, no organized
screening programme, low mortality rates, low quality of the method
used to estimate incidence, medium quality of the method used to
estimate mortality data, low quality availability of incidence
data.
Discussion
Cancer mortality rates are mounting worldwide, and
since 1990 cancer has moved up from third to second place among the
causes of death, after cardiovascular disease (14). This rising trend is related to a
number of factors that include population aging, high demographic
growth, reduced mortality from other causes, and higher cancer
rates induced in some populations by the growth of some risk
factors-like tobacco smoking and Westernization of lifestyles (e.g.
the diet) in low- and medium-income countries (15). It is thus critical for governments to
optimise their limited resources to improve prevention, early
diagnosis and treatment. This can be done using national and
regional cancer burden figures. Comparison of occurrence data over
time allows monitoring of the interventions adopted and the
assessment of their effectiveness and the necessary eventual
changes. Indeed, the reduction in mortality rates in several
developed countries has been achieved through a complex combination
of improvements in primary prevention, early diagnosis, screening
and treatment (16). The screening
programmes for early diagnosis of breast, cervical, and colorectal
cancer have gotten better considerably. In Europe, a number of
countries have improved their screening programmes, others have
introduced the and others will do so in the near future (2,13,17–19).
The most common causes of cancer death in HI
countries are lung, colorectal, breast (in women) and pancreas
cancer, which together accounted for ~48% of all deaths in 2012
(1). The most frequent causes in LMI
countries are lung, breast and colorectal cancer, which together
account for around half of cancer deaths (1). CRC is the second-ranking cause of cancer
death by incidence and mortality in developed countries and the
fourth in developing countries (20).
Approximately 45% of CRC patients die despite treatment (13), whose cost places a heavy strain on
resources. Although it is well established that CRC generally
develops from a precursor lesion, the adenomatous polyp, and that
progression to invasive cancer takes years (21,22), CRC
screening is currently offered to a small proportion of the target
population in nearly all countries in the world, regardless of
their GNI level (23). This is
confirmed by the data of the 53 WHO ER countries (Table I). The variables found in the quadrant
occupied by HI countries include nationwide, organized, PB
screening, high incidence and mortality rates, high-quality
availability of incidence and mortality data, and high quality of
the method adopted to estimate incidence and mortality rates; these
features form a clear pattern that reflects a strong interest in
epidemiological monitoring and produces accurate indicators of
disease occurrence. It should also be stressed that PB screening
essentially aims at covering all the individuals at risk in a given
time interval. UMI and LM countries have a less efficient general
organization, and the proportion of organized programmes is low in
the former while programmes are often absent in the latter. In
general, CRC screening has been demonstrated to be cost-effective
compared with no screening (24),
also in countries with limited resources (25). Surveillance strategies also need to be
improved in UMI and LM countries: Since national vital statistics
are unavailable, partial or inaccurate, the coverage and
completeness of the mortality data are frequently poor. A
high-quality data could be associated to high-quality sources. The
adoption of accurate methods to estimate incidence and mortality.
Is required by cancer registries and PB screening. It is useful to
underline that high-quality occurrence data are important to
understand cancer trends and to implement surveillance strategies.
Moreover, data on the type of screening organization, target
population, rounds and tests administered are not available for the
majority of LM WHO ER countries (Table
I). It has been established that poor quality healthcare is
associated with under screening, poor quality of screening,
inappropriate use of resources, and poor follow-up of individuals
who test positive on screening. In 2010, the IARC published the
European Guidelines for Quality Assurance in CRC screening
(26), where participation (at least
65%) (27), follow-up, and cancer
detection rates are key factors in screening performance.
The present findings are in line with the current
literature in highlighting a disparity between HI and LMI areas
also in relation to the population covered by cancer registries
(28). This reflects on the one hand
the scarce importance attributed to registries and the lack of
resources allocated for their institution. However, some recent
changes in priorities have been emerging in the use (and shift) of
national resources allocated for cancer screening (29).
Analysis of the factors reviewed above highlighted
broad variations among national CRC screening practices in the WHO
ER, and prompt some reflections. First of all, high-quality
occurrence data are essential to understand cancer trends and
devise control strategies; critically, screening measures should
always be specified both to enable comparisons among countries and
to try and improve screening quality. The poor quality of the
availability of incidence and mortality data and the poor quality
of the detection method could result in underestimation of the
respective rates. Estimates should thus be taken with caution,
since a steep, unexpected increase in the frequency of cancer cases
is a possible future scenario that would have repercussions on
clinical practice. Secondly, the countries with the lowest GNI
should use their resources to implement organized screening
programmes also in view of the Westernization of lifestyle and of
population aging, to improve patients' quality of life and survival
and reduce their impact and burden on healthcare resources and
facilities. In the third place, healthcare professionals should all
collaborate in promoting changes in resource allocation by
politicians, since healthcare investments require medical
personnel, and good monitoring, evaluation, and quality control
systems. HI countries that still lack an organized screening
programme should urgently set them up (Greece, Austria, Lithuania,
Latvia, Czech Republic, Slovakia, Switzerland, Germany and
Luxemburg). Finally, small communities lacking specialized staff
and laboratories and the economic resources to set up screening
programmes could rely on nearby centres or regions having the
resources and facilities for quality screening. In addition,
provision of cancer screening might be related directly to the type
of health care scheme and coverage. Furthermore, effectiveness in
screening for other cancers may be used as benchmark data.
The success of preventive policies depends not only
on the scientific evidence they produce, but also on the awareness
of the participants in this highly complex process. In addition, it
is important to underline that the resources (as measured by GNI)
available appear to be major factors in the quality of surveillance
epidemiology, and prevention programmes.
Acknowledgements
Not applicable.
Funding
No funding was received.
Availability of data and materials
The datasets used and/or analyzed during the current
study are available from the corresponding author on reasonable
request.
Authors' contributions
EA made substantial contributions to the conception
and design of the present study, conducted the literature review,
developed the statistical analysis, and drafted, edited and
critically revised the manuscript. LR contributed to the literature
search and built the database. GC participated in the literature
search and acquired the data. RF and VFP participated in data
acquisition. CM participated in data acquisition. All authors read
and approved the final version of the manuscript.
Ethics approval and consent to
participate
Not applicable.
Patient consent for publication
Not applicable.
Competing interests
The authors declare that they have no competing
interests.
References
|
1
|
Ferlay J, Soerjomataram I, Ervik M,
Dikshit R, Eser S, Mathers C, Rebelo M, Parkin DM, Forman D and
Bray F: GLOBOCAN 2012 v1.0, cancer incidence and mortality
worldwide: IARC cancer base no. 11. Lyon, France: International
Agency for Research on Cancer. 2014, http://globocan.iarc.frMarch 23–2018
|
|
2
|
Altobelli E, Lattanzi A, Paduano R,
Varassi G and di Orio F: Colorectal cancer prevention in Europe:
Burden of disease and status of screening programs. Prev Med.
62:132–141. 2014. View Article : Google Scholar : PubMed/NCBI
|
|
3
|
Johnson CM, Wei C, Ensor JE, Smolenski DJ,
Amos CI, Levin B and Berry DA: Meta-analyses of colorectal cancer
risk factors. Cancer Causes Control. 24:1207–1222. 2013. View Article : Google Scholar : PubMed/NCBI
|
|
4
|
Fitzpatrick-Lewis D, Ali MU, Warren R,
Kenny M, Sherifali D and Raina P: Screening for colorectal cancer:
A systematic review and meta-analysis. Clin Colorectal Cancer.
15:298–313. 2016. View Article : Google Scholar : PubMed/NCBI
|
|
5
|
Heresbach D, Manfredi S, D'halluin PN,
Bretagne JF and Branger B: Review in depth and meta-analysis of
controlled trials on colorectal cancer screening by faecal occult
blood test. Eur J Gastroenterol Hepatol. 18:427–433. 2006.
View Article : Google Scholar : PubMed/NCBI
|
|
6
|
Schoen RE, Pinsky PF, Weissfeld JL,
Yokochi LA, Church T, Laiyemo AO, Bresalier R, Andriole GL, Buys
SS, Crawford ED, et al: Colorectal-cancer incidence and mortality
with screening flexible sigmoidoscopy. N Engl J Med. 366:2345–2357.
2012. View Article : Google Scholar : PubMed/NCBI
|
|
7
|
Hirst Y, Kerrison R, Kobayashi LC,
Counsell N, Djedovic N, Ruwende J, Stewart M and von Wagner C: Text
Reminders in Colorectal Cancer Screening (TRICCS): Protocol for a
randomised controlled trial. BMC Public Health. 16:742016.
View Article : Google Scholar : PubMed/NCBI
|
|
8
|
Miles A, Cockburn J, Smith RA and Wardle
J: A perspective from countries using organized screening programs.
Cancer. 101 Suppl 5:S1201–S1213. 2004. View Article : Google Scholar
|
|
9
|
Karsa LV, Lignini TA, Patnick J, Lambert R
and Sauvaget C: The dimensions of the CRC problem. Best Pract Res
Clin Gastroenterol. 24:381–396. 2010. View Article : Google Scholar : PubMed/NCBI
|
|
10
|
World Bank Country and Lending Groups for
July 2016. https://datahelpdesk.worldbank.org/knowledgebase/articles/906519March
23–2018
|
|
11
|
Mathers CD, Fat DM, Inoue M, Rao C and
Lopez AD: Counting the dead and what they died from: An assessment
of the global status of cause of death data. Bull World Health
Organ. 83:171–177. 2005.PubMed/NCBI
|
|
12
|
Ferlay J, Shin HR, Bray F, Forman D,
Mathers C and Parkin DM: Estimates of worldwide burden of cancer in
2008: GLOBOCAN 2008. Int J Cancer. 127:2893–2917. 2010. View Article : Google Scholar : PubMed/NCBI
|
|
13
|
Altobelli E, Rapacchietta L, Angeletti PM,
Barbante L, Profeta FV and Fagnano R: Breast cancer screening
programmes across the WHO European region: Differences among
countries based on National Income Level. Int J Environ Res Public
Health. 14:E4522017. View Article : Google Scholar : PubMed/NCBI
|
|
14
|
GBD 2013 Mortality and Causes of Death
Collaborators: Global, regional, and national age-sex specific
all-cause and cause-specific mortality for 240 causes of death,
1990–2013: A systematic analysis for the global burden of disease
study 2013. Lancet. 385:117–171. 2015. View Article : Google Scholar : PubMed/NCBI
|
|
15
|
Bray F, Jemal N, Grey N, Ferlay J and
Forman D: Global cancer transitions according to the human
development index (2008–2030): A population-based study. Lancet
Oncol. 13:790–801. 2012. View Article : Google Scholar : PubMed/NCBI
|
|
16
|
Karim-Kos HE, de Vries E, Soerjomataram I,
Lemmens V, Siesling S and Coebergh JW: Recent trends of cancer in
Europe: A combined approach of incidence, survival and mortality
for 17 cancer sites since the 1990s. Eur J Cancer. 44:1345–1389.
2008. View Article : Google Scholar : PubMed/NCBI
|
|
17
|
Altobelli E: Improving cervical cancer
screening in Baltic, central, and eastern European countries.
Lancet Oncol. 17:1349–1350. 2016. View Article : Google Scholar : PubMed/NCBI
|
|
18
|
Altobelli E and Lattanzi A: Cervical
carcinoma in the European Union: An update on disease burden,
screening program state of activation, and coverage as of March
2014. Int J Gynecol Cancer. 25:474–483. 2015. View Article : Google Scholar : PubMed/NCBI
|
|
19
|
Altobelli E and Lattanzi A: Breast cancer
in European Union: An update of screening programmes as of March
2014 (Review). Int J Oncol. 45:1785–1792. 2014. View Article : Google Scholar : PubMed/NCBI
|
|
20
|
Global Burden of Disease Cancer
Collaboration, ; Fitzmaurice C, Dicker D, Pain A, Hamavid H,
Moradi-Lakeh M, MacIntyre MF, Allen C, Hansen G, Woodbrook R, Wolfe
C, et al: The Global burden of cancer 2013. JAMA Oncol. 1:505–527.
2015. View Article : Google Scholar : PubMed/NCBI
|
|
21
|
Kuntz KM, Lansdorp-Vogelaar I, Rutter CM,
Knudsen AB, van Ballegooijen M, Savarino JE, Feuer EJ and Zauber
AG: A systematic comparison of microsimulation models of colorectal
cancer: The role of assumptions about adenoma progression. Med
Decis Making. 31:530–539. 2011. View Article : Google Scholar : PubMed/NCBI
|
|
22
|
Brenner H, Hoffmeister M, Stegmaier C,
Brenner G, Altenhofen L and Haug U: Risk of progression of advanced
adenomas to colorectal cancer by age and sex: Estimates based on
840,149 screening colonoscopies. Gut. 56:1585–1589. 2007.
View Article : Google Scholar : PubMed/NCBI
|
|
23
|
Schreuders EH, Ruco A, Rabeneck L, Schoen
RE, Sung JJ, Young GP and Kuipers EJ: Colorectal cancer screening:
A global overview of existing programmes. Gut. 64:1637–1649. 2015.
View Article : Google Scholar : PubMed/NCBI
|
|
24
|
Lansdorp-Vogelaar I, Knudsen AB and
Brenner H: Cost-effectiveness of colorectal cancer screening.
Epidemiol Rev. 33:88–100. 2011. View Article : Google Scholar : PubMed/NCBI
|
|
25
|
Ginsberg GM, Lauer JA, Zelle S, Baeten S
and Baltussen R: Cost effectiveness of strategies to combat breast,
cervical, and colorectal cancer in sub-Saharan Africa and South
East Asia: Mathematical modelling study. BMJ. 344:e6142012.
View Article : Google Scholar : PubMed/NCBI
|
|
26
|
von Karsa L, Patnick J and Segnan N:
European guidelines for quality assurance in colorectal cancer
screening and diagnosis. First Edition-Executive summary.
Endoscopy. 44 Suppl 3:SE1–SE8. 2012.PubMed/NCBI
|
|
27
|
Moss S, Ancelle-Park R and Brenner H:
International Agency for Research on Cancer: European guidelines
for quality assurance in colorectal cancer screening and diagnosis.
First Edition-Evaluation and interpretation of screening outcomes.
Endoscopy. 44 Suppl 3:SE49–SE64. 2012.PubMed/NCBI
|
|
28
|
Forman D, Bray F, Brewster DH, Gombe
Mbalawa C, Kohler B, Piñeros M, Steliarova-Foucher E and
Swaminathan R: Cancer Incidence in Five Continents. 10. IARC Press;
Lyon, France: 2014, PubMed/NCBI
|
|
29
|
Bray F, Znaor A, Cueva P, Korir A,
Swaminathan R, Ullrich A, Wang SA and Parkin DM: Planning and
Developing Population-based Cancer Registration in Low- and
Middle-income Settings. IARC Technical publication. (43)IARC Press;
Lyon, France: 2014
|