Introduction
Colorectal cancer (CRC) is one of the most common
malignant tumors and one of the most serious health problems
worldwide (1). In China, the
morbidity and mortality of CRC are both ranked fifth for all cancer
types, responsible for 191,000 cancer-associated cases of mortality
in 2015 (2,3).
The diagnosis of CRC at an early stage is crucial to
enhance the success of treatment approaches. However, the detection
and management of CRC is challenging due to the variable nature of
the disease (4). To the best of our
knowledge, there are no reliable predictors of CRC development or
rate of progression and the diagnosis of CRC is inadequate.
Effective systems to predict the occurrence and aggression of this
malignancy are urgently required (5). Previously, Saghapouret and Sehhati
(6) used a logistic regression model
and artificial neural networks (ANNs) as two nonlinear models to
establish a two-stage hybrid modeling procedure for prediction of
metastasis in advanced CRC. Additionally, Chen et al
(7) developed a proteomic approach
for the simultaneous detection and analysis of multiple proteins to
distinguish individuals with CRC from healthy individuals.
ANNs are a family of models inspired by biological
neural networks that are used to estimate functions that depend on
a large number of generally unknown inputs (8,9). ANNs
constitute a class of flexible nonlinear models designed to mimic
biological neural systems (10).
ANNs are generally presented as systems of interconnected neurons
that exchange messages with each other (10). Each connection has a numerical weight
that can be adjusted based on experience, making ANNs adaptive to
inputs and capable of learning (10). ANNs have been applied in many
different areas and employed to solve medical diagnostic problems
(10).
ANN is a mathematical and computational method that
has been applied for diagnosis and prognosis prediction in several
cancer types. Previously, this method has achieved higher
sensitivity and specificity compared with traditional procedures
(11–13). Recently, Peng et al (14) established a scoring system based on
an ANN model which could better predict the long-term prognosis for
patients with stage IIA colon cancer following radical surgery and
screen out individuals at high risk of further aggressive
progression. This study identified that decreased expression of
TGFBR2 and increased expression of β-catenin, MAPK,
TGF-β and pin1 may be predictive of a poor 10-year
survival outcome.
The aim of the current study was to use ANN to build
multiple CRC diagnosis models based on a dataset from The Cancer
Genome Atlas (TCGA). The diagnosis models included: Cancer/Normal,
M0/M1 (M0, without distant metastasis; M1, with distant
metastasis), carcinoembryonic antigen (CEA) <5/≥5 µg/l and
Clinical stage I–II/III–IV. The models were generated to help
clinicians diagnose patients with CRC, predict the postoperative
outcome and screen high-risk prognostic subgroups.
Materials and methods
Data collection
The mRNA expression data used in the current study
was downloaded from TCGA (https://cancergenome.nih.gov/). The publically
available dataset contained relatively large and diverse CRC
RNA-seq expression data, with a total of 633 samples (15). Samples in which the respective
clinical data were missing were deleted. A total of 328 samples
were used in the current study. The dataset used in the
Cancer/Normal contained 287 CRC samples and 41 healthy colorectal
samples and M0/M1 models contained 189 M0 samples and 39 M1
samples. The database was filtered according to CEA classification
and clinical stage for the CEA and Clinical stage models. Detailed
information regarding the size of the relevant datasets is
presented in Table I.
 | Table I.Datasets used in the four diagnosis
models. |
Table I.
Datasets used in the four diagnosis
models.
| Datasets | Cancer/normal,
n | M0/M1, n | CEA <5/≥5,
n | Clinical stage
I–II/III–IV, n |
|---|
| TCGA_colorectal
cancer | 287/41 | 189/39 | 79/43 | 155/101 |
Genetic algorithm (GA)
A GA is an optimization method used to identify the
best solution to a problem by applying Darwin's evolution
hypothesis and different genetic functions, including crossover and
mutation (16,17). GA was proposed by John Holland in the
early 1970s (18). Compared to
traditional optimization and search procedures, GA is a stochastic
method used to solve optimization problems, particularly when there
is little or no prior knowledge about the process to be controlled
(19,20). In the current study, GA was used as a
robust nonlinear statistical method for variable selection. The
feature genes selected by GA were used as numerical encoded
parameters to denote cancerous, metastatic or healthy samples.
Mean impact value (MIV)
MIV is considered to be one of the best indicators
to evaluate the impact of input variables for neural cells in a
neural network (21). Each input
variable of the training samples, comprising of the 171 samples
used for model 2 generation (Table
II), was increased and decreased by 10% to create two new
samples for the simulation function. Then the mean of the
difference between values of simulation was calculated to provide
the variable MIV. A well-trained neural network model based on MIV
is theoretically capable of selecting the most important gene
(22).
| Table II.Number of samples used in training
sets and test sets. |
Table II.
Number of samples used in training
sets and test sets.
|
|
| Diagnosis
model |
|---|
|
|
|
|
|---|
| Use | Total sample,
n | Cancer/normal,
n | M0/M1, n | CEA <5/≥5,
n | Clinical stage
I–II/III–IV, n |
|---|
| Training set | 246 | 215/31 | – | – | – |
| Test set | 82 | 72/10 | – | – | – |
| Training set | 171 | – | 140/31 | – | – |
| Test set | 57 | – | 49/8 | – | – |
| Training set | 92 | – | – | 60/32 | – |
| Test set | 30 | – | – | 19/11 | – |
| Training set | 208 | – | – | – | 118/90 |
| Test set | 69 | – | – | – | 37/32 |
ANNs: Back propagation (BP) and
learning vector quantization (LVQ) models
In the current study, two types of ANN were used to
build multiple diagnosis models: BP and LVQ. The BP neural network
includes three layers: An input layer, a hidden layer and an output
layer. The first layer has input neurons, which send data via
synapses to a hidden layer of neurons, which have synapses to the
third layer of output neurons (9,23). The
LVQ neural network was a method of training neural networks for
pattern classification (24,25). This network architecture includes the
input layer, representing the space of inputs in the X dimension,
the competition layer, which models the space of the inputs, and
the output layer, in which decisions are made. In the current
study, both algorithm programs were created using Matlab software
(version 2010b; MathWorks, Natick, MA, USA).
Evaluation of diagnosis models
The overall performance of the four models was
evaluated by two distinct approaches: Predictive accuracy (ACC) and
the area under the curve (AUC) of a receiver operating
characteristic (ROC) curve for an independent dataset test. The
stability of the models was evaluated using a 10-fold
cross-validation test (26). ACC was
defined as follows: ACC=(∑TP+TN)/N, where TP was the true positive,
TN was the true negative and N was the total number of predicted
samples.
The ability of a test to identify true positives and
negatives in a dataset was measured by sensitivity and specificity
as follows (27): Sensitivity =
TP/(TP+FN) and specificity = TN/(TN+FP), where FN was the false
negative and FP was the false positive.
An ROC curve demonstrates the efficacy of a test by
identifying both the sensitivity and specificity for different
cutoff points (27). ROC curve
analysis was performed with R software (version 3.2.0; http://www.r-project.org/). The most frequently used
criterion for comparing multiple ROC curves is the AUC, which can
range from 0.5 (poor performance of prediction model/no
discrimination) to 1.0 (ideal performance of prediction model/high
discrimination) (28).
For 10-fold cross-validation testing, the dataset
was randomly divided into 10 sets, nine of which were used to set
the parameters of the predictive algorithm. ACC of the algorithm
was then evaluated against the remaining set. This procedure was
repeated 10 times before the sensitivity and specificity against
different parameters were calculated by an ROC curve for 10 test
datasets.
Results and Discussion
Feature gene selection
The CRC mRNA expression data from TCGA was divided
into four different groups: Cancer/Normal (model 1), M0/M1 (model
2), CEA <5/≥5 (model 3) and Clinical stage I–II/III–IV (model
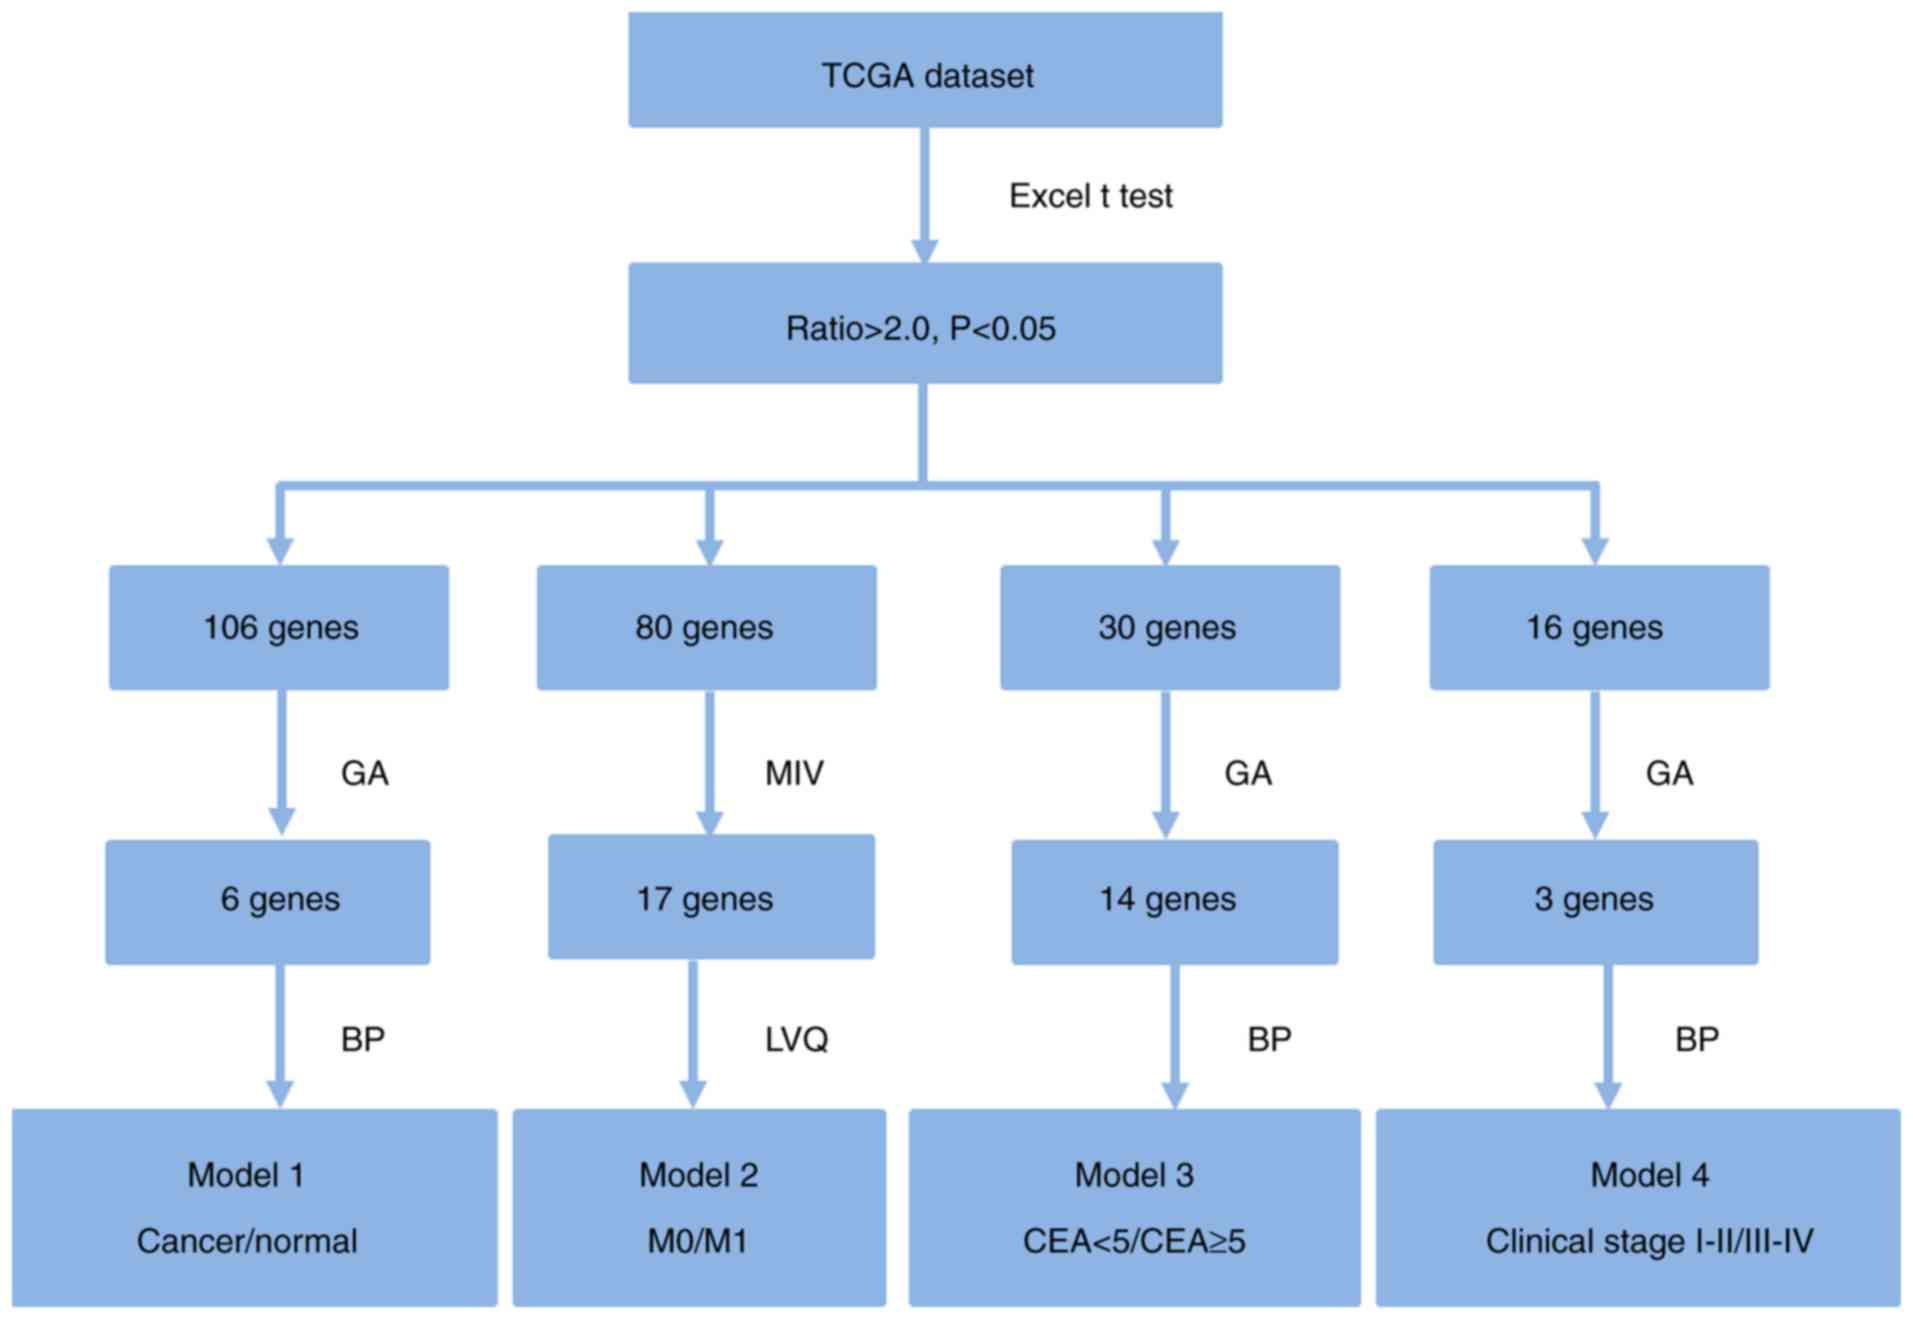
4). A flow chart outlining the feature genes selection method is
presented in Fig. 1. Briefly,
P-values and ratio values were calculated for all candidate genes
by performing a t-test between every two groups using Excel 2007
(Microsoft Corporation, Redmond, WA, USA). Genes were selected with
P<0.05 and ratio >2 for further analysis. The number of genes
passing this first selection criteria for model 1, 2, 3 and 4 were
106, 80, 30 and 16, respectively. For selection of the most
important genes, GA was run 1,000 times with different initial
population sets. A population of good models was obtained. These
genes were used to construct diagnosis models using the BP and LVQ
techniques. Six, 17, 14 and three feature genes were selected to
build models 1, 2, 3 and 4, respectively. Gene selection
information is presented in Tables
II and III.
| Table III.Diagnostic genes used in diagnosis
models. |
Table III.
Diagnostic genes used in diagnosis
models.
| Diagnosis
model | Gene symbol | mRNA
description | Ratio | Regulation |
|---|
| Cancer/normal | MT1M | Metallothionein
1M | 57.35 | Down |
| Cancer/normal | ATP1A2 | ATPase
Na+/K+ Transporting Subunit Alpha 2 | 45.00 | Down |
| Cancer/normal | ALPI | Alkaline
Phosphatase, Intestinal | 43.49 | Down |
| Cancer/normal | LOC646627 | Uncharacterized
LOC646627 | 43.23 | Down |
| Cancer/normal | TMEM72 | Transmembrane
Protein 72 | 34.31 | Down |
| Cancer/normal | CPNE7 | Copine 7 | 33.87 | Up |
| M0/M1 | ALPPL2 | Alkaline
Phosphatase, Placental Like 2 |
2.08 | Down |
| M0/M1 | ALPP | Alkaline
Phosphatase, Placental |
2.35 | Down |
| M0/M1 | CACNG4 | Calcium
Voltage-Gated Channel Auxiliary Subunit Gamma 4 |
2.60 | Down |
| M0/M1 | CAMK2B | Calcium/Calmodulin
Dependent Protein Kinase II Beta |
2.30 | Down |
| M0/M1 | DLX3 | Distal-Less
Homeobox 3 |
2.87 | Down |
| M0/M1 | FREM2 | FRAS1 Related
Extracellular Matrix Protein 2 |
2.52 | Down |
| M0/M1 | GPR81 | Hydroxycarboxylic
Acid Receptor 1 |
2.14 | Down |
| M0/M1 | HEPHL1 | Hephaestin Like
1 |
2.25 | Down |
| M0/M1 | KRT6A | Keratin 6A |
2.24 | Down |
| M0/M1 | LOC100133545 | MRPL23 antisense
RNA 1 |
2.62 | Down |
| M0/M1 | LOC440173 | Uncharacterized
LOC440173 |
2.03 | Down |
| M0/M1 | MAP7D2 | MAP7 Domain
Containing 2 |
2.21 | Down |
| M0/M1 | MSLN | Mesothelin |
2.05 | Down |
| M0/M1 | PSCA | Prostate Stem Cell
Antigen |
2.19 | Down |
| M0/M1 | SCEL | Sciellin |
2.39 | Down |
| M0/M1 | SLC14A1 | Solute Carrier
Family 14 Member 1 (Kidd Blood Group) |
3.47 | Down |
| M0/M1 | SLC15A1 | Solute Carrier
Family 15 Member 1 |
2.08 | Down |
| CEA <5/≥5 | ADH6 | Alcohol
Dehydrogenase 6 (Class V) |
2.17 | Down |
| CEA <5/≥5 | AHSG |
Alpha-2-HS-Glycoprotein |
2.05 | Down |
| CEA <5/≥5 | CCL25 | C-C Motif Chemokine
Ligand 25 |
3.34 | Down |
| CEA <5/≥5 | CPLX2 | Complexin 2 |
2.36 | Down |
| CEA <5/≥5 | DEFA5 | Defensin Alpha
5 |
4.40 | Down |
| CEA <5/≥5 | DKK4 | Dickkopf WNT
Signaling Pathway Inhibitor 4 |
2.25 | Down |
| CEA <5/≥5 | ELF5 | E74 Like ETS
Transcription Factor 5 |
2.39 | Up |
| CEA <5/≥5 | EMX1 | Empty Spiracles
Homeobox 1 |
3.04 | Down |
| CEA <5/≥5 | FABP4 | Fatty Acid Binding
Protein 4 |
2.19 | Up |
| CEA <5/≥5 | GNG4 | G Protein Subunit
Gamma 4 |
2.58 | Up |
| CEA <5/≥5 | IGFL2 | IGF Like Family
Member 2 |
2.08 | Down |
| CEA <5/≥5 | NOS2 | Nitric Oxide
Synthase 2 |
2.31 | Down |
| CEA <5/≥5 | SVOPL | SVOP Like |
2.07 | Up |
| CEA <5/≥5 | TNFRSF6B | Tumor Necrosis
Factor Receptor Superfamily 6b |
2.11 | Down |
| Clinical stage | LY6G6D | Lymphocyte Antigen
6 Complex, Locus G6D |
2.01 | Down |
| I–II/III–IV |
| Clinical stage | PALM3 | Paralemmin 3 |
2.23 | Down |
| I–II/III–IV |
| Clinical stage | PRKAA2 | Protein Kinase
AMP-Activated Catalytic Subunit Alpha 2 |
2.14 | Down |
| I–II/III–IV |
Cancer/normal diagnosis model
Using the GA method, six feature genes (upregulated:
CPNE7; downregulated: MT1M, ATP1A2, ALPI, LOC646627
and TMEM72) were obtained to create the Cancer/Normal
diagnosis model.
Here, the TCGA dataset was divided into a training
set containing 246 samples that was used for model generation and a
test set with 82 samples that was used to evaluate the model. The
ACC and AUC of the training sets and test sets are presented in
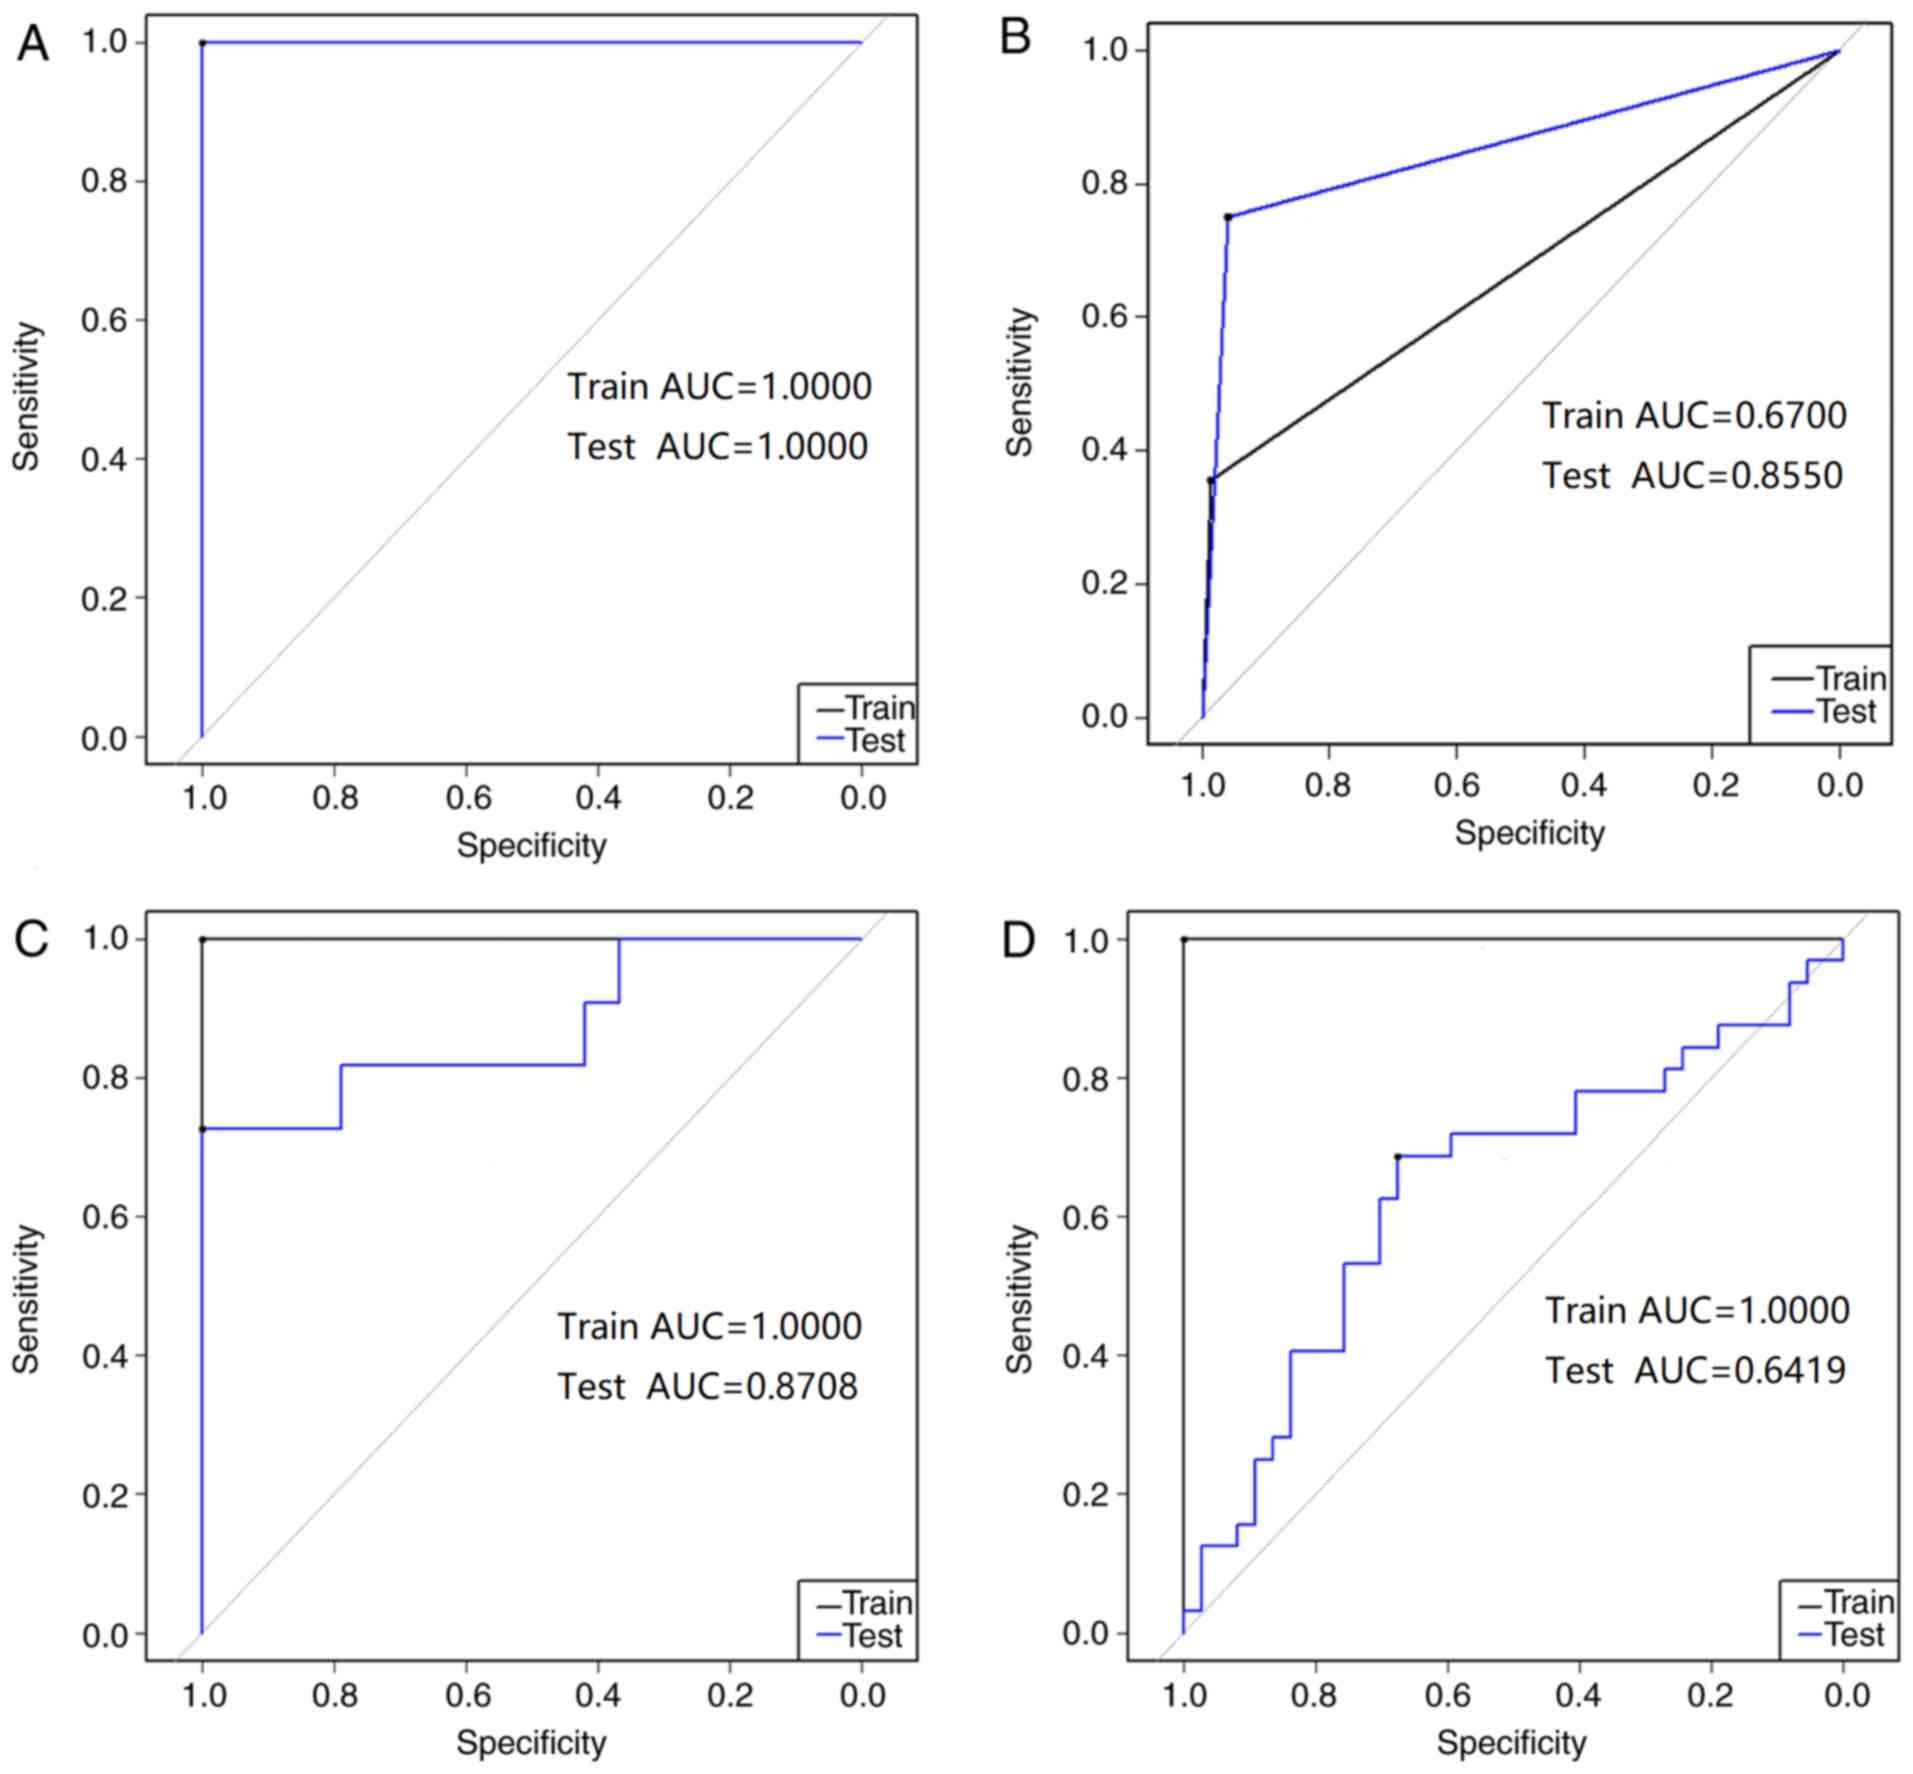
Table IV. Fig. 2A presents the ROC for the
Cancer/Normal diagnosis model. The ACC and AUC were 100% and 1.000,
respectively, for both the training set and the test set. AUC was
applied to quantify the comprehensive performance of the prediction
model. Therefore, the aforementioned statistical data indicated
that the proposed Cancer/Normal diagnosis model exhibited a good
ability to predict patients with cancer compared with healthy
individuals.
| Table IV.Diagnosis model testing results. |
Table IV.
Diagnosis model testing results.
| Diagnosis
model | Use | ACC, % | AUC |
|---|
| Cancer/Normal | Training set | 100.00 | 1.0000 |
| Cancer/Normal | Test set | 100.00 | 1.0000 |
| M0/M1 | Training set |
87.14 | 0.6700 |
| M0/M1 | Test set |
92.98 | 0.8550 |
| CEA <5/≥5 | Training set | 100.00 | 1.0000 |
| CEA <5/≥5 | Test set |
80.00 | 0.8708 |
| Clinical stage
I–II/III–IV | Training set | 100.00 | 1.0000 |
| Clinical stage
I–II/III–IV | Test set |
65.22 | 0.6419 |
The stability of the model was evaluated using a
10-fold cross-validation test and the results are presented in
Table V. The ACC values of the
Cancer/Normal diagnosis model in all 10 tests were in the range
93.75–99.39% and the sensitivity values were all 1.0000, suggesting
that the Cancer/Normal diagnosis model has promising reliability
and efficacy to identify cancer tissues against different test
datasets.
| Table V.10-fold cross validation of diagnosis
model TCGA training sets. |
Table V.
10-fold cross validation of diagnosis
model TCGA training sets.
|
| Cancer/normal | M0/M1 | CEA <5/≥5 | Clinical stage
I–II/III–IV |
|---|
|
|
|
|
|
|
|---|
| 10-fold cross | ACC | Sen | ACC | Sen | ACC | Sen | ACC | Sen |
|---|
| 10-1 | 0.9375 | 1.0000 | 0.8824 | 1.0000 | 0.9231 | 1.0000 | 0.6000 | 0.6364 |
| 10-2 | 0.9692 | 1.0000 | 0.8824 | 1.0000 | 0.8000 | 0.9375 | 0.6829 | 0.6087 |
| 10-3 | 0.9796 | 1.0000 | 0.8431 | 0.9762 | 0.7568 | 0.8750 | 0.6885 | 0.6176 |
| 10-4 | 0.9847 | 1.0000 | 0.8088 | 0.9496 | 0.7551 | 0.8438 | 0.6707 | 0.6304 |
| 10-5 | 0.9878 | 1.0000 | 0.8118 | 0.9429 | 0.7377 | 0.7750 | 0.6602 | 0.6552 |
| 10-6 | 0.9898 | 1.0000 | 0.8058 | 0.9286 | 0.6986 | 0.7234 | 0.6452 | 0.6429 |
| 10-7 | 0.9913 | 1.0000 | 0.8083 | 0.9388 | 0.6744 | 0.7091 | 0.6414 | 0.6585 |
| 10-8 | 0.9924 | 1.0000 | 0.8102 | 0.9464 | 0.6735 | 0.7143 | 0.6024 | 0.6170 |
| 10-9 | 0.9923 | 1.0000 | 0.8117 | 0.9524 | 0.6909 | 0.7324 | 0.5936 | 0.6038 |
| 10-10 | 0.9939 | 1.0000 | 0.8187 | 0.9571 | 0.6721 | 0.7215 | 0.5913 | 0.6017 |
M0/M1 diagnosis model
M0 represents CRC without distant metastasis, while
M1 represents CRC with distant metastasis. Distant metastasis is
the main cause of cancer-associated cases of mortality for patients
with CRC (29). The common organs
for CRC distant metastasis are the liver and lung (30). As a result, M1 indicates a high risk
of poor prognosis (31).
Following establishment of the BP diagnosis model to
distinguish between cancer patients and healthy patients, the LVQ
neural network was used to develop the M0/M1 diagnosis model with a
training set of 171 samples, based on 17 feature genes selected by
the MIV method (downregulated: ALPPL2, ALPP, CACNG4, CAMK2B,
DLX3, FREM2, GPR81, HEPHL1, KRT6A, LOC100133545, LOC440173, MAP7D2,
MSLN, PSCA, SCEL, SLC14A1 and SLC15A1). The test set
consisted of 57 samples.
As presented in Table
IV and Fig. 2B, the ACC of the
training set in the LVQ model was 87.14% and the AUC was 0.670. The
ACC of the test set was 92.98% and the AUC was 0.855. The AUC value
is an indicator of the efficacy of the diagnosis model; an AUC
close to 1.0 indicates a high overall efficacy of the test. The
test set of M0/M1 diagnosis model had an AUC of approximately 0.9,
suggesting that it had a relatively high ability to identify the
distant metastasis tissues against the tissues without distant
metastasis. The statistical data of the test set indicated that the
M0/M1 diagnosis model had the ability to predict patients with and
without metastasis.
ACC values for the LVQ M0/M1 diagnosis model in all
10-fold cross-validation tests were in the range 80.58–88.24% and
the sensitivity was in the range 0.9286–1.0000 (Table IV). These results verified that the
M0/M1 diagnosis model had a good statistical significance.
CEA <5/≥5 diagnosis model
CEA is an immunoglobulin cell adhesion molecule that
is considered to be a marker for CRC (32). Previously, Spindler et al
(33) reported that elevated
preoperative CEA is a risk factor for aggressive tumor biology and
poor prognosis for patients with CRC. CEA was also identified as an
independent factor for shorter relapse-free survival and shorter
overall survival (OS). Furthermore, elevated preoperative CEA has
also been demonstrated to not only improve staging of CRC, but also
guide adjuvant chemotherapy (34).
Therefore, it is important to develop a CEA <5/≥5 diagnosis
model to improve diagnosis and therapy for patients with CRC.
The BP neural network was used to develop a CEA
<5/≥5 diagnosis model with a training set of 92 samples which
contained 60 CEA <5 and 32 CEA ≥5 samples based on 14 feature
genes (upregulated: ELF5, FABP4, GNG4 and SVOPL;
downregulated: ADH6, AHSG, CCL25, CPLX2, DEFA5, DKK4, EMX1,
IGFL2, NOS2 and TNFRSF6B) selected by the GA method. The
TCGA test set contained 30 samples (19 CEA <5 and 11 CEA ≥5
samples).
The CEA <5/≥5 diagnosis model had a good ability
to predict patients with CEA <5/≥5 in the training set and the
test set. As presented in Table IV
and Fig. 2C, the ACC for the
training set was 100% and the AUC was 1.000. The ACC for the test
set was 80% and the AUC was 0.8708. These statistical data indicate
that the test set accuracy of the CEA <5/≥5 model is
>80%.
The ACC values of the CEA <5/≥5 diagnosis model
in all 10-fold cross-validation tests were in the range
67.21–92.31% and the sensitivity values were in the range
0.7091–1.0000 (Table V). This
demonstrates that the accuracy and sensitivity ranges of the
training set are relatively large but it still has ACC >67.21%,
sensitivity >0.7091. Demonstrating that the model has ability to
diagnose disease.
Clinical stage I–II/III–IV diagnosis
model
The clinical stage of disease is an indicator of
prognosis for patients with CRC. Clinical stage I–II is considered
early stage, while clinical stage III–IV is considered to be late
stage (35,36).
The current study generated a clinical stage
I–II/III–IV diagnosis model using the BP neural network to assist
with CRC diagnosis. A BP neural network was used to develop the
model with a training set containing 208 samples and a test set
containing 69 samples based on three feature genes (downregulated:
LY6G6D, PALM3 and PRKAA2) selected by the GA
method.
As presented in Table
IV and Fig. 2D, the clinical
stage I–II/III–IV diagnosis model training set had an ACC of 100%
and an AUC of 1.0000. The ACC of the test set was 65.22% and the
AUC was 0.6419. Meanwhile, the ACC values of this diagnosis model
in all 10-fold cross-validation tests were in the range
59.13–68.85% and the sensitivity values were in the range
0.6017–0.6585 (Table V). This result
indicates that although the training set for the Clinical stage
I–II/III–IV diagnosis model has a high accuracy, the model is
unreliable as the accuracy of the test set is only 65.22%.
Survival analysis
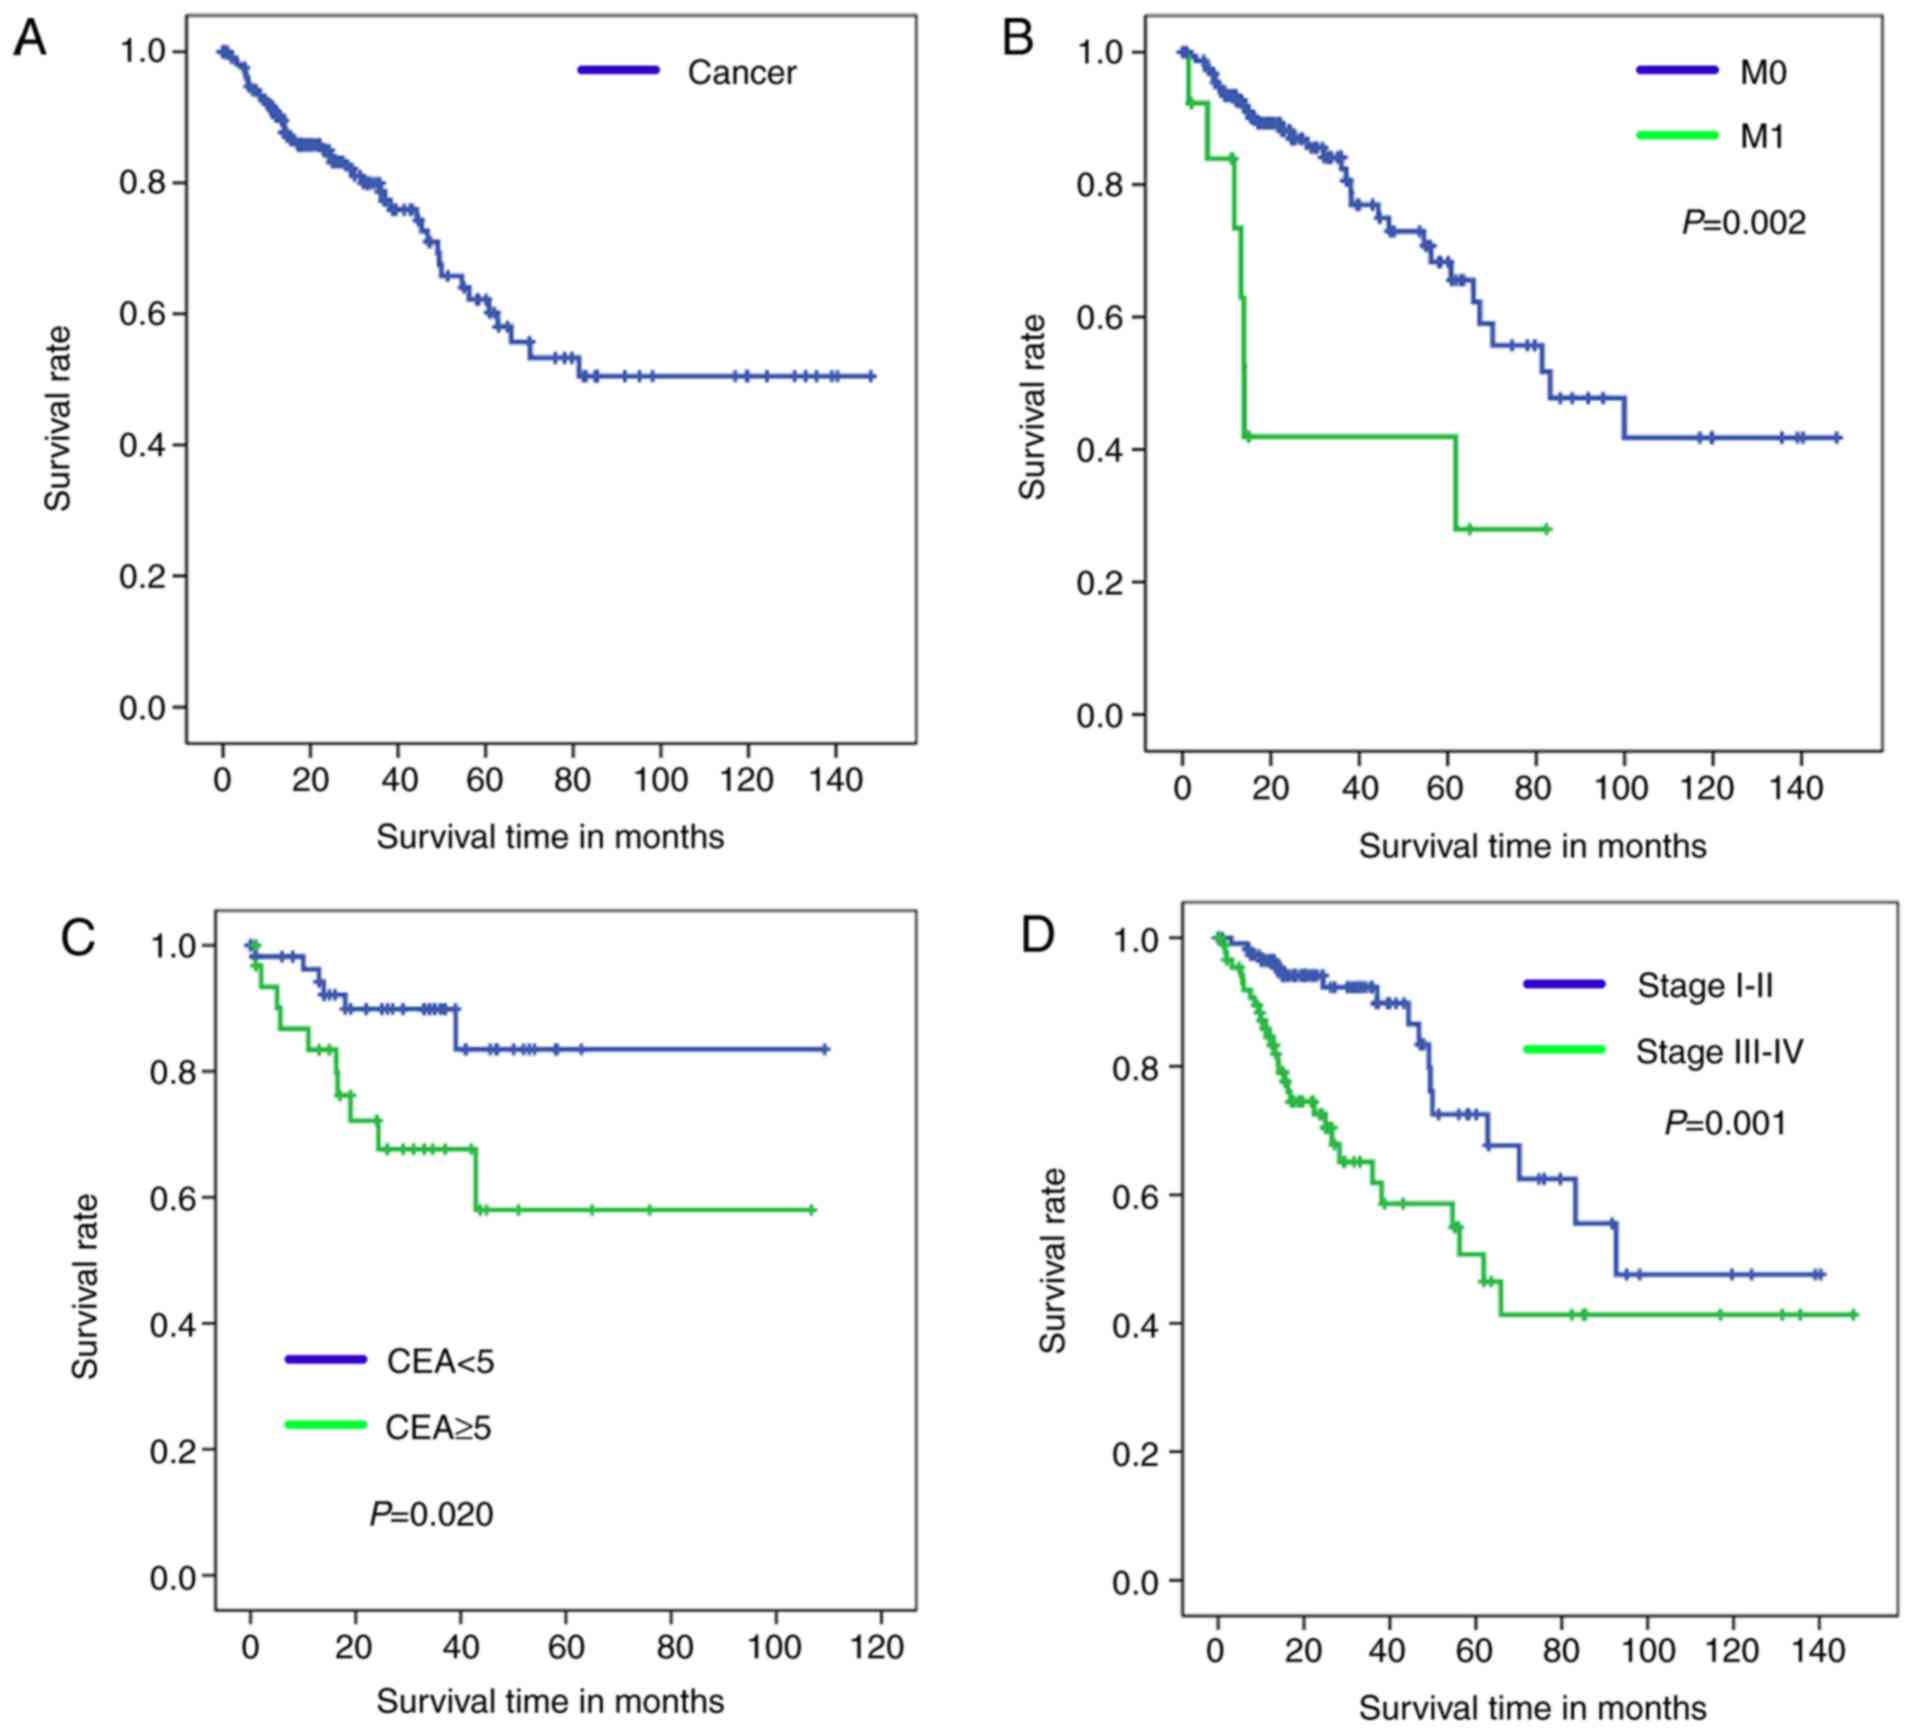
Kaplan-Meier analysis with a log-rank test was used
to determine OS of patients in the four diagnosis models. According
to the results of these models, Kaplan-Meier survival curves of
overall survival are presented in Fig.
3 (training set) and Fig. 4
(test set).
The healthy tissue and tumor tissue originated from
the same sample, therefore, these paired samples have the same
sample number and OS time so only one OS curve can be presented in
Figs. 3A and 4A. Fig. 3B-D
demonstrates significant differences in the OS between patients in
the M0 and M1 groups (P=0.002; Fig.
3B), CEA <5 and CEA ≥5 groups (P=0.020; Fig. 3C), and stage I–II and III–IV groups
(P=0.001; Fig. 3D).
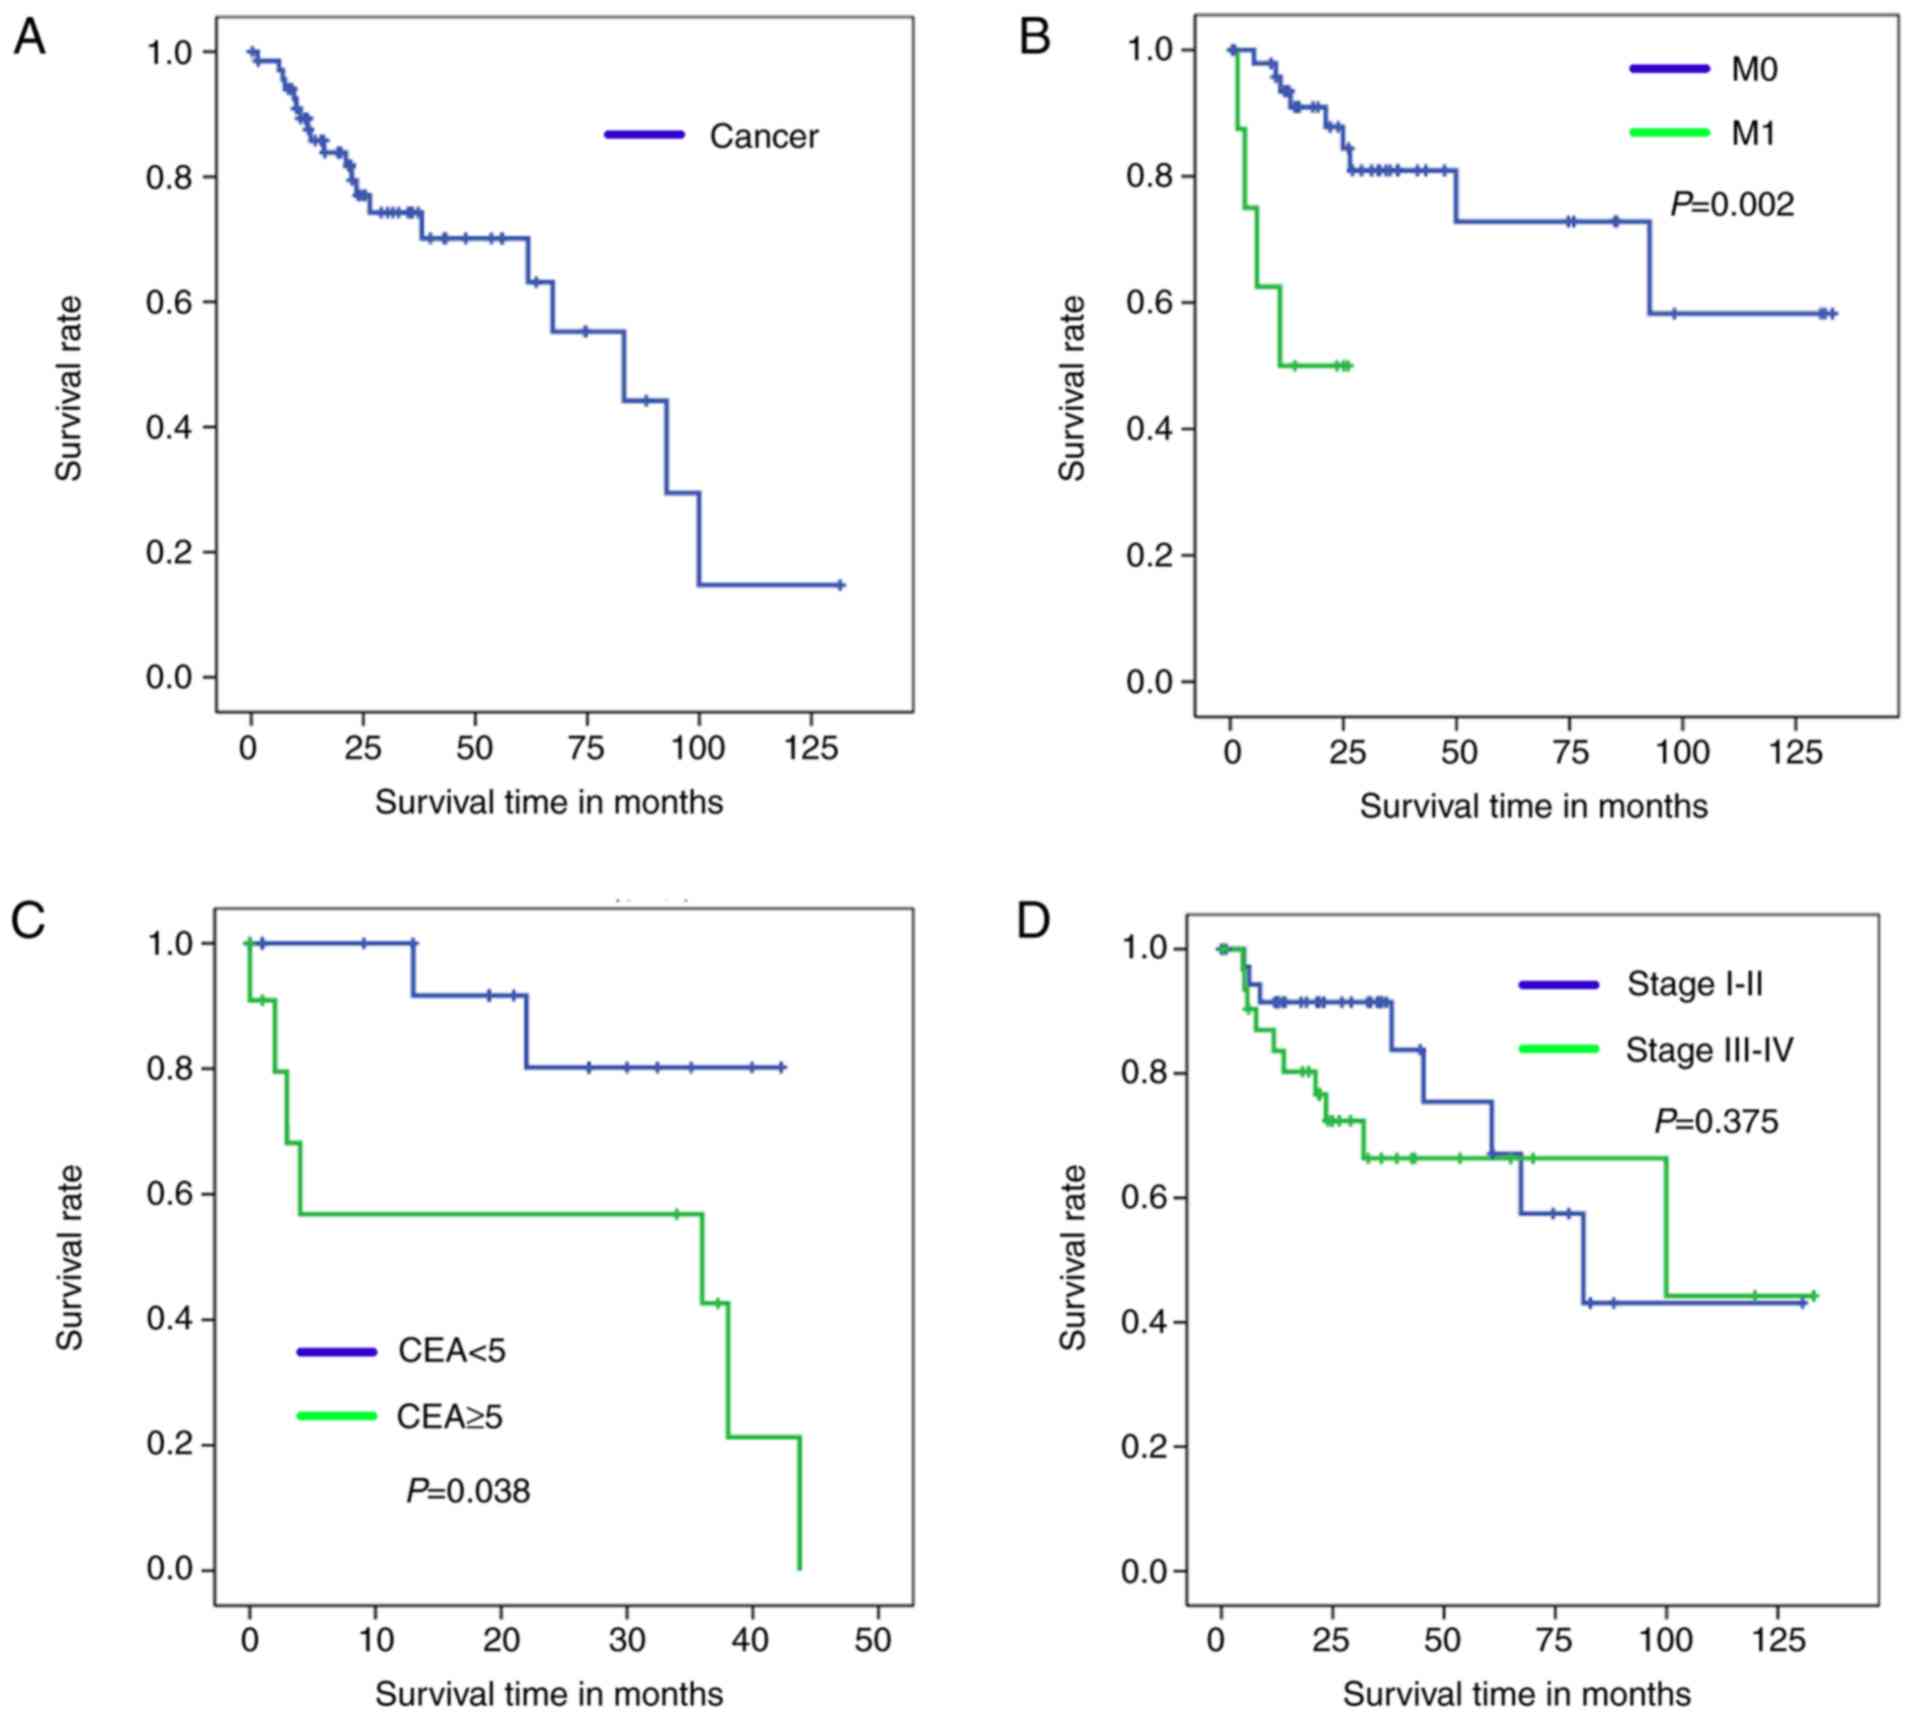
By comparing the Kaplan-Meier survival curve for the
test set to OS (Fig. 4A), it can be
concluded that the Cancer/Normal diagnosis model was successfully
established. Furthermore, the current study effectively
distinguished cancer samples into a favorable and unfavorable
diagnosis group according to their M0/M1 and CEA index. As
demonstrated in Fig. 4B and C, a
significant difference was identified in the OS rates of patients
in the M1 and CEA ≥5 groups compared with those in the M0 and CEA
≥5 groups (Fig 4B, P=0.002; Fig. 4C, P=0.038).
As illustrated in Fig.
4D, no statistically significant difference was identified in
the OS time of the stage I–II groups compared with the stage III–IV
groups (P=0.375). Fig. 4D also
demonstrates that there was no significant difference in the OS
rate of the two groups after 100 months. Therefore, the clinical
stage I–II/III–IV model is not suitable for predicting prognosis of
patients with CRC.
In conclusion, the current study established
multiple novel diagnosis models for human CRC based on TCGA data
using the ANN method. Feature genes were selected by GA and MIV
methods, which represent characteristics of tumor and healthy
samples that were used to generate the diagnosis models. Analysis
demonstrated that the BP and LVQ models have strong predictive
abilities with high ACC and AUC values in both the training and
test sets, as well as robust stability, with notable accuracy and
sensitivity values determined by 10-fold cross-validation. The
M0/M1 and CEA <5/≥5 diagnosis models demonstrated a high ability
to predict patient prognosis. The Cancer/Normal, M0/M1, CEA
<5/≥5 and Clinical stage diagnosis models created in the current
study, used a variety of artificial intelligence algorithms
combined with an RNA-seq dataset to assist with human CRC diagnosis
and postoperative outcome prediction.
Acknowledgements
Not applicable.
Funding
The study was supported by grants from the National
Natural Science Foundation of China (grant no. 81272556), the
Science and Technology Project of Guangdong Province (grant no.
2017A030311035) and the Science and Technology Program of
Guangzhou, China (grant no. 2014Y2-00137).
Availability of data and materials
All data generated or analysed during this study are
included in this published article.
Authors' contributions
QW, WL, JC, JW and ZC designed the study and wrote
the manuscript; TZ, JZ, BZ and PY collected and analysed the data.
All authors read and approved the final manuscript.
Ethics approval and consent to
participate
Not applicable.
Patient consent for publication
Not applicable.
Competing interests
The authors declare that they have no competing
interests.
Glossary
Abbreviations
Abbreviations:
|
CRC
|
colorectal cancer
|
|
ANN
|
artificial neural network
|
|
GA
|
genetic algorithm
|
References
|
1
|
Torre LA, Bray F, Siegel RL, Ferlay J,
Lortet-Tieulent J and Jemal A: Global cancer statistics, 2012. CA
Cancer J Clin. 65:87–108. 2015. View Article : Google Scholar : PubMed/NCBI
|
|
2
|
Chen W, Zheng R, Zhang S, Zeng H, Xia C,
Zuo T, Yang Z, Zou X and He J: Cancer incidence and mortality in
China, 2013. Cancer Letters. 401:63–71. 2017. View Article : Google Scholar : PubMed/NCBI
|
|
3
|
Chen W, Zheng R, Baade PD, Zhang S, Zeng
H, Bray F, Jemal A, Yu XQ and He J: Cancer statistics in China,
2015. CA Cancer J Clin. 66:115–132. 2016. View Article : Google Scholar : PubMed/NCBI
|
|
4
|
Quah HM, Chou JF, Gonen M, Shia J, Schrag
D, Landmann RG, Guillem JG, Paty PB, Temple LK, Wong WD and Weiser
MR: Identification of patients with high-risk stage II colon cancer
for adjuvant therapy. Dis Colon Rectum. 51:503–507. 2008.
View Article : Google Scholar : PubMed/NCBI
|
|
5
|
de Gramont A, Hubbard J, Shi Q, O'Connell
MJ, Buyse M, Benedetti J, Bot B, O'Callaghan C, Yothers G, Goldberg
RM, et al: Association between disease-free survival and overall
survival when survival is prolonged after recurrence in patients
receiving cytotoxic adjuvant therapy for colon cancer: Simulations
based on the 20,800 Patient ACCENT Data Set. J Clin Oncol Official.
28:460–465. 2010. View Article : Google Scholar
|
|
6
|
Saghapour E and Sehhati M: Prediction of
metastasis in advanced colorectal carcinomas using CGH data. J
Theor Biol. 429:116–123. 2017. View Article : Google Scholar : PubMed/NCBI
|
|
7
|
Chen YD, Zheng S, Yu JK and Hu X:
Artificial neural networks analysis of surface-enhanced laser
desorption/ionization mass spectra of serum protein pattern
distinguishes colorectal cancer from healthy population. Clin
Cancer Res. 10:8380–8385. 2004. View Article : Google Scholar : PubMed/NCBI
|
|
8
|
Hagan MT, Demuth HB and Beale M: Neural
network design. InWseas International Conference on Circuits.
357:1997.
|
|
9
|
Kuan CM: Artificial Neural Networks. Ieas
Working Paper Academic Research. 1:1–23. 2006.
|
|
10
|
Shi HY, Lee KT, Wang JJ, Sun DP, Lee HH
and Chiu CC: Artificial neural network model for predicting 5-year
mortality after surgery for hepatocellular carcinoma: A nationwide
study. J Gastrointest Surg. 16:2126–2131. 2012. View Article : Google Scholar : PubMed/NCBI
|
|
11
|
Spelt L, Nilsson J, Andersson R and
Andersson B: Artificial neural networks-a method for prediction of
survival following liver resection for colorectal cancer
metastases. Eur J Surg Oncol. 39:648–654. 2013. View Article : Google Scholar : PubMed/NCBI
|
|
12
|
Tsao CW, Liu CY, Cha TL, Wu ST, Sun GH, Yu
DS, Chen HI, Chang SY, Chen SC and Hsu CY: Artificial neural
network for predicting pathological stage of clinically localized
prostate cancer in a Taiwanese population. J Chin Med Assoc.
77:513–518. 2014. View Article : Google Scholar : PubMed/NCBI
|
|
13
|
Hu HP, Niu ZJ, Bai YP and Tan XH: Cancer
classification based on gene expression using neural networks.
Genet Mol Res. 14:17605–17611. 2015. View Article : Google Scholar : PubMed/NCBI
|
|
14
|
Peng JH, Fang YJ, Li CX, Ou QJ, Jiang W,
Lu SX, Lu ZH, Li PX, Yun JP, Zhang RX, et al: A scoring system
based on artificial neural network for predicting 10-year survival
in stage II A colon cancer patients after radical surgery.
Oncotarget. 7:22939–22947. 2016. View Article : Google Scholar : PubMed/NCBI
|
|
15
|
Cancer Genome Atlas Network: Comprehensive
molecular characterization of human colon and rectal cancer.
Nature. 487:330–337. 2012. View Article : Google Scholar : PubMed/NCBI
|
|
16
|
Whitley D: A genetic algorithm tutorial.
Stat Comput. 4:65–85. 1994. View Article : Google Scholar
|
|
17
|
Shaefer CG: Genetic algorithm. Springer.
(New York, NY). 8191993.
|
|
18
|
Mitchell M, Forrest S and Holland JH: The
royal road for genetic algorithms: Fitness landscapes and GA
Performance. In: Proceedings of the First European Conference on
Artificial Life. MIT Press. (Cambridge, MA). 245–254.
1992.PubMed/NCBI
|
|
19
|
Zhang X, Zhang X, Li Q, Sun Z, Song L and
Sun T: Support vector machine applied to study on quantitative
structure-retention relationships of polybrominated diphenyl ether
congeners. Chromatographia. 77:1387–1398. 2014. View Article : Google Scholar
|
|
20
|
Jalaliheravi M and Kyani A: Application of
genetic algorithm-kernel partial least square as a novel nonlinear
feature selection method: Activity of carbonic anhydrase II
inhibitors. Eur J Med Chem. 42:649–659. 2007. View Article : Google Scholar : PubMed/NCBI
|
|
21
|
Fu ZG, Qi MF and Jing Y: Regression
forecast of main steam flow based on mean impact value and support
vector regression. In: Proceedings of Asia Pacific Power and Energy
Engineering Conference. IEEE. (Shanghai). 1–5. 2012.
|
|
22
|
Jiang JL, Su X, Zhang H, Zhang XH and Yuan
YJ: A novel approach to active compounds identification based on
support vector regression model and mean impact value. Chem Biol
Drug Des. 81:650–657. 2013. View Article : Google Scholar : PubMed/NCBI
|
|
23
|
Hagan MT and Beale M: Neural network
design China Machine Press. 2002.
|
|
24
|
Hassoun MH: Fundamentals of artificial
neural networks. Proceedings of the IEEE. 84:9061996. View Article : Google Scholar
|
|
25
|
Boubaker M, Khalifa KB, Girau B, Dogui M
and Bedoui MH: On-line arithmetic based reprogrammable hardware
implementation of LVQ neural network for alertness classification.
IJCSNS Int J Comput Science Netw Secur. 8:260–266. 2008.
|
|
26
|
Jiang FN, He HC, Zhang YQ, Yang DL, Huang
JH, Zhu YX, Mo RJ, Chen G, Yang SB, Chen YR, et al: An integrative
proteomics and interaction network-based classifier for prostate
cancer diagnosis. PLoS One. 8:e639412013. View Article : Google Scholar : PubMed/NCBI
|
|
27
|
Baldi P, Brunak S, Chauvin Y, Andersen CA
and Nielsen H: Assessing the accuracy of prediction algorithms for
classification: An overview. Bioinformatics. 16:412–424. 2000.
View Article : Google Scholar : PubMed/NCBI
|
|
28
|
Sun Y and Goodison S: Optimizing molecular
signatures for predicting prostate cancer recurrence. Prostate.
69:1119–1127. 2009. View Article : Google Scholar : PubMed/NCBI
|
|
29
|
Heinzerling JH, Anthony T, Livingston EH
and Huerta S: Predictors of distant metastasis and mortality in
patients with stage II colorectal cancer. Am Surg. 73:230–238.
2007.PubMed/NCBI
|
|
30
|
He F, Chen H, Yang P. Wu Q, Zhang T, Wang
C, Wei J, Chen Z, Hu H, Li W and Cao J: Gankyrin sustains
PI3K/GSK-3β/β-catenin signal activation and promotes colorectal
cancer aggressiveness and progression. Oncotarget. 7:81156–81171.
2016. View Article : Google Scholar : PubMed/NCBI
|
|
31
|
Akkoca AN, Yanık S, Ozdemir ZT, Cihan FG,
Sayar S, Cincin TG, Cam A and Ozer C: TNM and modified dukes
staging along with the demographic characteristics of patients with
colorectal carcinoma. Int J Clin Exp Med. 7:2828–2835.
2014.PubMed/NCBI
|
|
32
|
Ullenhag GJ, Frödin JE, Jeddi-Tehrani M,
Strigard K, Eriksson E, Samanci A, Choudhury A, Nilsson B, Rossmann
ED, Mosolits S and Mellstedt H: Durable carcinoembryonic antigen
(CEA)-specific humoral and cellular immune responses in colorectal
carcinoma patients vaccinated with recombinant CEA and
granulocyte/macrophage colony-stimulating factor. Clin Cancer Res.
10:3273–3281. 2004. View Article : Google Scholar : PubMed/NCBI
|
|
33
|
Spindler KLG, Christensen IJ, Nielsen HJ,
Jakobsen A and Brünner N: TIMP-1 and CEA as biomarkers in
third-line treatment with irinotecan and cetuximab for metastatic
colorectal cancer. Tumour Biol. 36:4301–4308. 2015. View Article : Google Scholar : PubMed/NCBI
|
|
34
|
Aldulaymi B, Christensen IJ, Sölétormos G,
Jess P, Nielsen SE, Brünner N and Nielsen HJ: Changes in soluble
CEA and TIMP-1 levels during adjuvant chemotherapy for stage III
colon cancer. Anticancer Res. 30:233–237. 2010.PubMed/NCBI
|
|
35
|
Liu LG, Yan XB, Xie RT, Jin ZM and Yang Y:
Stromal expression of vimentin predicts the clinical outcome of
stage II colorectal cancer for high-risk patients. Med Sci Monit.
23:28972017. View Article : Google Scholar : PubMed/NCBI
|
|
36
|
Lee KW, Lee SS, Kim SB, Sohn BH, Lee HS,
Jang HJ, Park YY, Kopetz S, Kim SS, Oh SC and Lee JS: Significant
association of oncogene YAP1 with poor prognosis and cetuximab
resistance in colorectal cancer patients. Clin Cancer Res.
21:357–364. 2015. View Article : Google Scholar : PubMed/NCBI
|