Introduction
Increasing evidence has revealed that the adaptive
immune response to cancer is a prospective prognostic marker and a
diagnostic criterion for various types of cancer (1,2).
Previously, targeted immune-based therapies have revealed durable
responses and may represent novel promising treatments for various
types of cancer, including melanoma (3), breast (4), renal (5), non-small cell lung (6) and bladder cancer (7). These emerging immunotherapies,
including the immunomodulators Bacillus Calmette-Guérin (BCG)
polysaccharide nucleic acid and adoptive cell transfer, highlight
the crucial need to better monitor and comprehend
tumour-infiltrating lymphocytes (TILs).
T cells in cancer tissues are generated during
T-cell differentiation in the thymus (8) and serve a central role in the tumour
immune response. T cells recognize antigens displayed on the
surface of cancer cells via the membrane protein T-cell receptor
(TCR). Each T cell commonly possesses a single TCR. The majority of
TCRs contain an α-polypeptide chain and a β-polypeptide chain. Each
chain has a variable region (V region), a joining region (J region)
and a constant region (C region). The β chain also possesses a
diversity region (D region) (8). The
V region of the TCR α- and β-chains contains three hypervariable
regions, including complementarity determining regions (CDR) 1, 2
and 3, of which CDR3 is the most variable and therefore the primary
source of antigen-specific recognition. The diversity of TCR is
generated by a random rearrangement of the V, D, J and C regions,
extended by non-germline-encoded nucleotides randomly inserted at
the junctions of the final segments (9).
Since the diversity of distinct TCRs is
~2.5×10¹⁸ in a normal adult, the TCR repertoire is
therefore difficult to analyse (10). High-throughput sequencing (HTS) is a
novel method that can profile the TCR repertoire and analyse the
adaptive immune response; therefore allowing the study of TCR
repertoire diversity at a greater depth than previously (11,12).
Notably, this technology has been used to investigate and monitor
the implication of TCR in tumour immunity through large-scale
sequencing of CDR3 (13–15). The present study aimed to evaluate
the complexity and diversity of cancer tissues compared with
paracancerous tissues by amplifying the CDR3 of TCRs using
multiplex polymerase chain reaction (PCR) and HTS. Decrypting the
TCRβ chain repertoire in TILs may offer novel insights for the
development of future biomarkers and monitoring in bladder
cancer.
Materials and methods
Patients
Five patients with muscle-invasive bladder cancer
were selected, and cancer and paracancerous specimens were
collected at The Shenzhen People's Hospital (Shenzhen, China)
between January and April 2016. The diagnosis of bladder cancer was
confirmed by pathological diagnosis and clinical evidence. The
patient cohort was 44–82 years old, with a mean age of 63.10±19.21
years. These patients had not been treated with chemotherapy prior
to the study, and written informed consent was obtained for study
participation. This study passed the discussion and approval of the
Ethics Committee of Guilin No. 181 Hospital (Guilin, China) and the
Shenzhen People's Hospital (Shenzen, China).
Sample preparation
A total of 5–10 cancerous and paracancerous sections
were obtained from each patient with bladder cancer, and total DNA
was extracted using a standard method. Briefly, dewaxing was
performed using xylene, followed by an overnight proteinase K
digestion at 56°C. Total DNA in tissue samples was extracted using
the QIAamp DNA Mini kit (Qiagen GmbH, Hilden, Germany) according to
the manufacturer's protocol. The DNA concentration of each sample
was determined using a Qubit fluorometer (Invitrogen; Thermo Fisher
Scientific, Inc., Waltham, MA, USA). DNA quality was evaluated via
0.8% agarose gel electrophoresis. The DNA samples extracted from
the cancerous tissues of the five patients were mixed together in a
1:1:1:1:1 ratio according to the Qubit value, to obtain a unique
cancer sample. Similarly, the DNA samples extracted from the
paracancerous tissues of the five patient were mixed together in a
1:1:1:1:1 ratio according to the Qubit value, to obtain a unique
control sample.
Multiplex polymerase chain reaction
(PCR) amplification of the TCRβ CDR3 region
The human TCRβ sequences were downloaded from the
international ImMunoGeneTics information system® for
immunoglobulins or antibodies (http://www.imgt.org/) (16). A relatively conserved region in frame
region 3, upstream of CDR3, was selected for the putative forward
primer region. A cluster of primers (Table I) corresponding to the majority of
the V gene sequence family was selected. Reverse primers,
corresponding to the J gene family, were similarly designed
(17). A total of 30 forward primers
and 13 reverse primers were used with the QIAGEN multiplex PCR kit
(Qiagen GmbH) to amplify the rearranged TCRβ CDR3 region. The PCR
reactions (50 µl) consisted of 2 µl TCRβ variable (TRBV) pool (10
µM), 2 µl TCRβ joining (TRBJ) pool (10 µM), 25 µl 2X QIAGEN
Multiplex PCR Master, 5 µl 5X Q-solution, 10 µl template DNA and 6
µl H2O. The PCR conditions were 95°C for 15 min followed
by 25 cycles of 94°C for 15 sec and 60°C for 3 min, with a final
extension for 10 min at 72°C. The PCR products were purified from
the primer sequences by AMPure XP beads (Beckman Coulter, Inc.,
Brea, CA, USA). A second round of PCR was performed to add a
sequencing index to each sample. The PCR reaction (50 µl) consisted
of 13.5 µl H2O, 0.5 µl 2X Q5 DNA polymerase, 10 µl 5X Q5
buffer, 1 µl dNTP (10 mM), 1 µl P1 (10 µM), 23 µl DNA, and 1 µl
index (10 µM). The PCR condition was set at 98°C for 1 min,
followed by 25 cycles of 98°C for 20 sec, 65°C for 30 sec and 72°C
for 30 sec, with a final extension for 5 min at 72°C. The library
was separated by agarose gel electrophoresis, and the target region
was isolated and cleaned using QIAquick Gel Extraction kits
according to the manufacturer's protocol (Qiagen GmbH).
 | Table I.TRB V primers (5′-3′). |
Table I.
TRB V primers (5′-3′).
| Primer | Sequence |
|---|
| TRBV2 |
ATTTCACTCTGAAGATCCGGTC |
|
| CAC |
| TRBV3-1 |
AAACAGTTCCAAATCGMTTCT |
|
| CAC |
| TRBV4-1/2/3 |
CAAGTCGCTTCTCACCTGAATG |
| TRBV5-1 |
GCCAGTTCTCTAACTCTCGC |
|
| TCT |
| TRBV5-4/5/6/8 |
TCAGGTCGCCAGTTCCCTAAY |
|
| TAT |
| TRBV6-4.1 |
CACGTTGGCGTCTGCTGTAC |
|
| CCT |
| TRBV6-8/5/1.2 |
CAGGCTGGTGTCGGCTGCTC |
|
| CCT |
| TRBV6-9/7/1.1/6 |
CAGGCTGGAGTCAGCTGCTC |
|
| CCT |
| TRBV6-4.2 |
AGTCGCTTGCTGTACCCTCT |
|
| CAG |
| TRRBV6-2/3 |
GGGGTTGGAGTCGGCTGCTC |
|
| CCT |
| TRBV7-2/4/6/7/8 |
GGGATCCGTCTCCACTCTGAM |
|
| GAT |
| TRBV7-3 |
GGGATCCGTCTCTACTCTGAA |
|
| GAT |
| TRBV7-9 |
GGGATCTTTCTCCACCTTGGA |
|
| GAT |
| TRBV9 |
CCTGACTTGCACTCTGAACTAA |
|
| ACCT |
| TRBV10-1 |
CCTCACTCTGGAGTCTGCTGCC |
| TRBV10-2/3 |
CCTCACTCTGGAGTCMGCT |
|
| ACC |
| TRBV11-1/2/3 |
GCAGAGAGGCTCAAAGGAGT |
|
| AGACT |
| TRBV12-3.2/5.2 |
GAAGGTGCAGCCTGCAGAAC |
|
| CCAG |
| TRBV12-3.1/4/5.1 |
GAAGATCCAGCCCTCAGAACC |
|
| CAG |
| TRBV13 |
TCGATTCTCAGCTCAACAGTTC |
| TRBV14 |
GGAGGGACGTATTCTACTCTGA |
|
| AGG |
| TRBV15 |
TTCTTGACATCCGCTCACCAGG |
| TRBV16 |
CTGTAGCCTTGAGATCCAGGC |
|
| TACGA |
| TRBV18 |
TAGATGAGTCAGGAATGC |
|
| CAAAG |
| TRBV19 |
TCCTTTCCTCTCACTGTGACAT |
|
| CGG |
| TRBV20-1 |
AACCATGCAAGCCTGACCTT |
| TRBV24-1 |
CTCCCTGTCCCTAGAGTCTGC |
|
| CAT |
| TRBV25-1 |
GCCCTCACATACCTCTCAGTA |
|
| CCTC |
| TRBV27-1 |
GATCCTGGAGTCGCCCAGC |
| TRBV28 |
ATTCTGGAGTCCGCCAGC |
| TRBV29-1 |
AACTCTGACTGTGAGCAACATGAG |
| TRBV30-F5 |
CAGATCAGCTCTGAGGTGCCCCA |
High-throughput sequencing and data
analysis
The library was quantified using an ABI StepOnePlus
Real-Time PCR system (Applied Biosystems; Thermo Fisher Scientific,
Inc.) and an Agilent 2100 Bioanalyzer instrument (Agilent DNA 1000
Reagents; Agilent Technologies GmbH, Waldbronn, Germany), and
sequenced by Illumina MiSeq (Illumina, Inc., San Diego, CA, USA).
Briefly, the low-quality reads and the adaptor reads were filtered
from the raw data, and the clean data were used in further
alignment. Subsequently, the clean data were aligned to the human
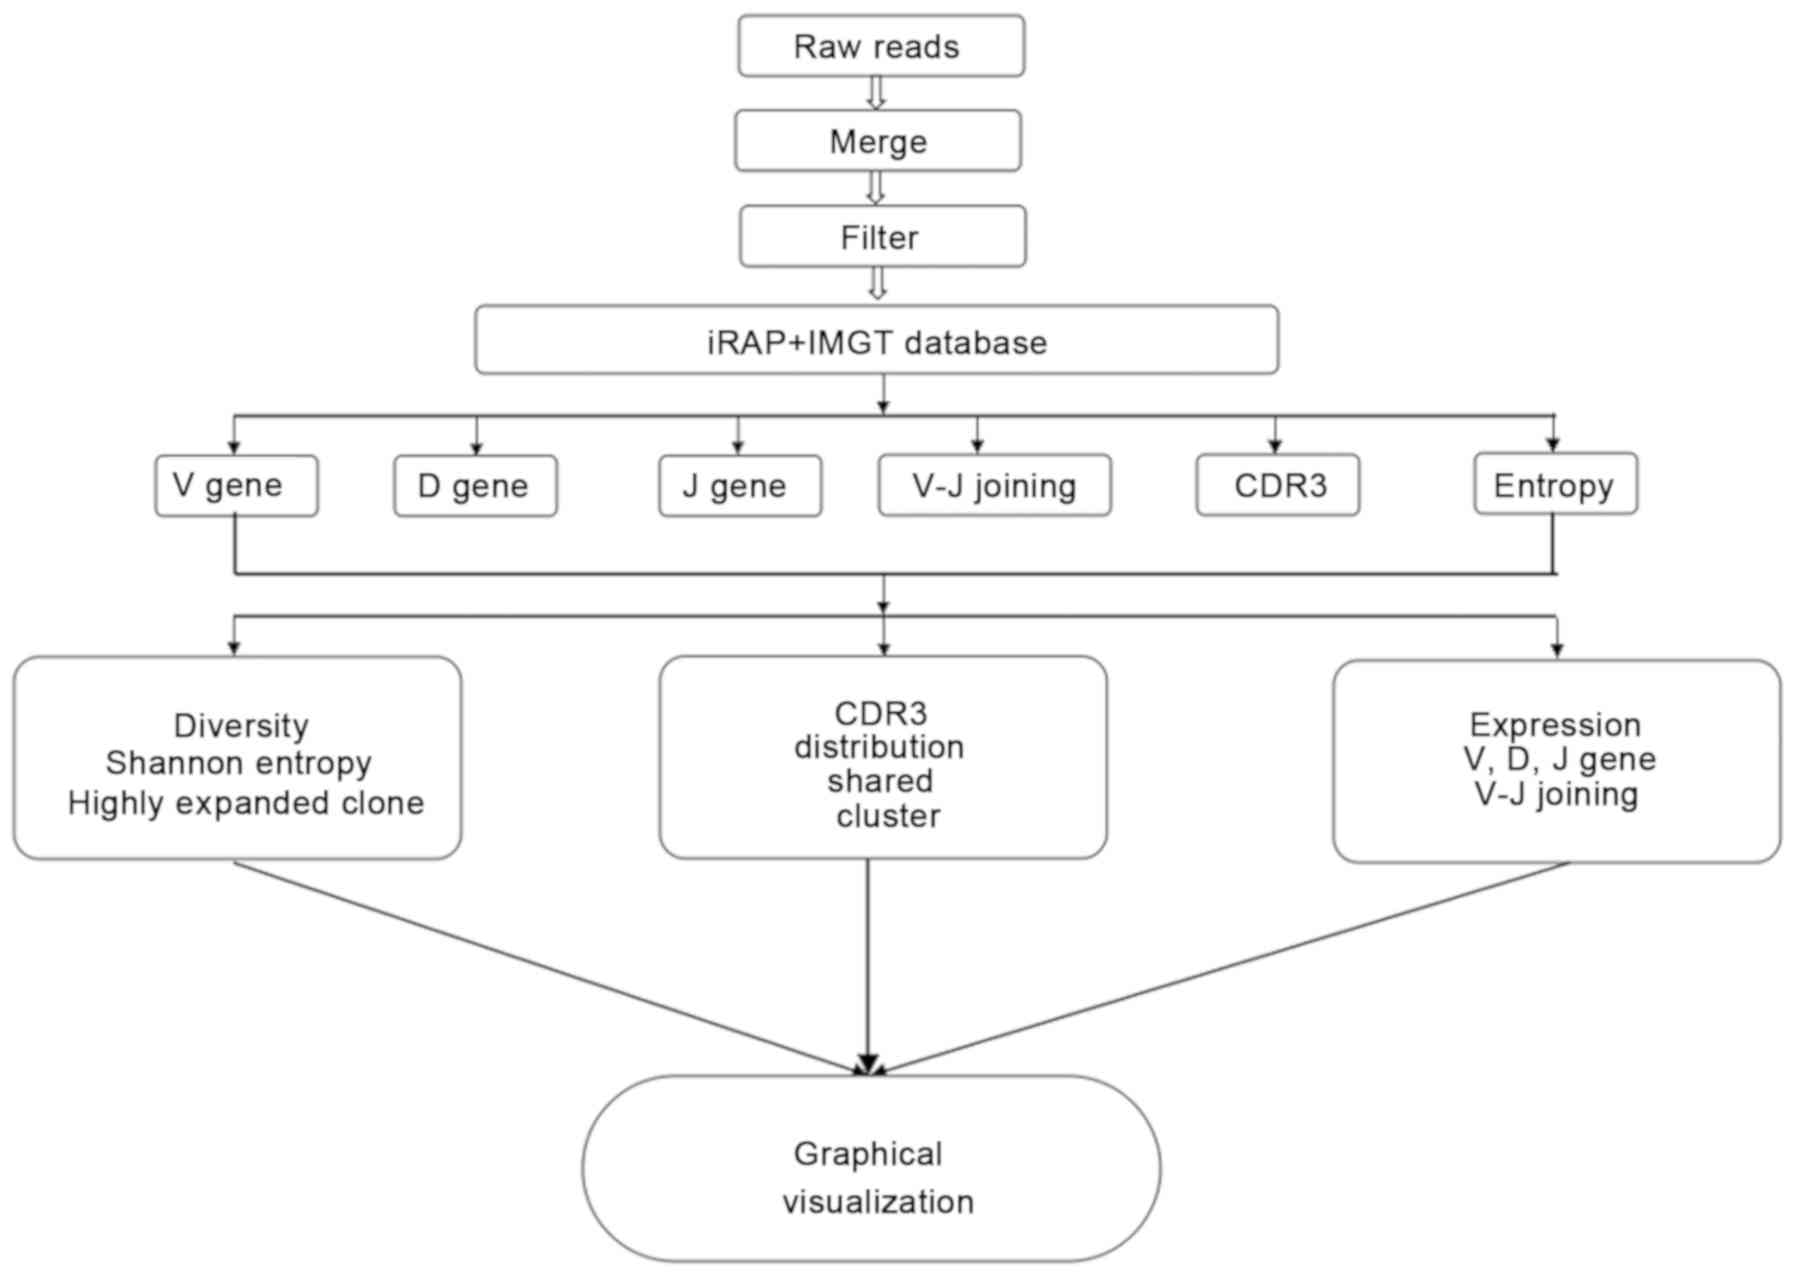
TRBV database and were analysed using the online IMGT
(ImMunoGeneTics)/HighV-QUSET and miTCR (MiLaboratory LLC, Solana
Beach, CA, USA) tools. The data included the V, D and J
assignments, the CDR3 length distribution, clustering, highly
expanded clone and Shannon entropy index (18). Shannon entropy index is a measure of
immune diversity in the field of immune library. This index ranges
between 0 and 1, where 1 indicates the most diversity, and 0
indicates no diversity at all. The flow chart of biological
information is presented in Fig.
1.
Results
T-cell receptor β sequence
statistics
A total of 1,789,531 raw reads and 857,022 raw reads
were obtained for the cancer sample and the control sample,
respectively. The miTCR was used to map the reads to the available
databases. The mapping of the immune sequence reads, the total CDR3
sequences, and the unique CDR3 nucleotide sequences per sample are
presented in Tables II and III.
| Table II.TRB J primers (5′-3′). |
Table II.
TRB J primers (5′-3′).
| Primer | Sequence |
|---|
| TRBJ1.1 |
CTTACCTACAACTGTGAGTCTGGTG |
| TRBJ1.2 |
CTTACCTACAACGGTTAACCTGGTC |
| TRBJ1.3 |
CTTACCTACAACAGTGAGCCAACTT |
| TRBJ1.4 |
AAGACAGAGAGCTGGGTTCCACT |
| TRBJ1.5 |
CTTACCTAGGATGGAGAGTCGAGTC |
| TRBJ1.6 |
CATACCTGTCACAGTGAGCCTG |
| TRBJ2.1 |
CCTTCTTACCTAGCACGGTGA |
| TRBJ2.2 |
CTTACCCAGTACGGTCAGCCT |
| TRBJ2.3 |
CCGCTTACCGAGCACTGTCAG |
| TRBJ2.4 |
AGCACTGAGAGCCGGGTCC |
| TRBJ2.5 |
CGAGCACCAGGAGCCGCGT |
| TRBJ2.6 |
CTCGCCCAGCACGGTCAGCCT |
| TRBJ2.7 |
CTTACCTGTGACCGTGAGCCTG |
| Table III.T-cell receptor β sequence
statistics. |
Table III.
T-cell receptor β sequence
statistics.
| Data type | Cancer | Control |
|---|
| Total raw
reads | 1,789,531 | 857,022 |
| Total clean
sequences number | 1,081,491 | 551,870 |
| Immune sequences
number | 1,059,138 | 543,038 |
| Unknown sequences
number |
22,353 | 8,832 |
| Productive
sequences number |
744,400 | 417,942 |
| Nonproductive
sequences number |
314,738 | 125,096 |
| In-frame sequences
number |
763,882 | 433,569 |
| Out-of-frame
sequences number |
287,038 | 105,628 |
| Total CDR3
sequences number |
718,791 | 410,030 |
| Unique CDR3 nt
sequences number |
13,196 | 26,051 |
| Unique CDR3 aa
sequences number |
10,125 | 21,721 |
Degree of expansion and diversity
analysis of T-cell clones
In order to comprehensively and accurately
understand the diversity of the TCR clones in the cancer and
control samples, the degree of clonal amplification of the DNA
sequences was calculated in each sample. The statistical method
used to determine the degree of clonal amplification of the
sequence in each sample represented the number of times the
sequence was present in the test sample. In the present study, a
highly expanded clone (HEC) was defined as a TCR clone with a
frequency >0.5% of the total reads in each sample. In the cancer
sample, 32 DNA sequences were observed and defined as HECs, with a
HEC ratio of 0.46. Conversely, only 14 clones were HECs, with a HEC
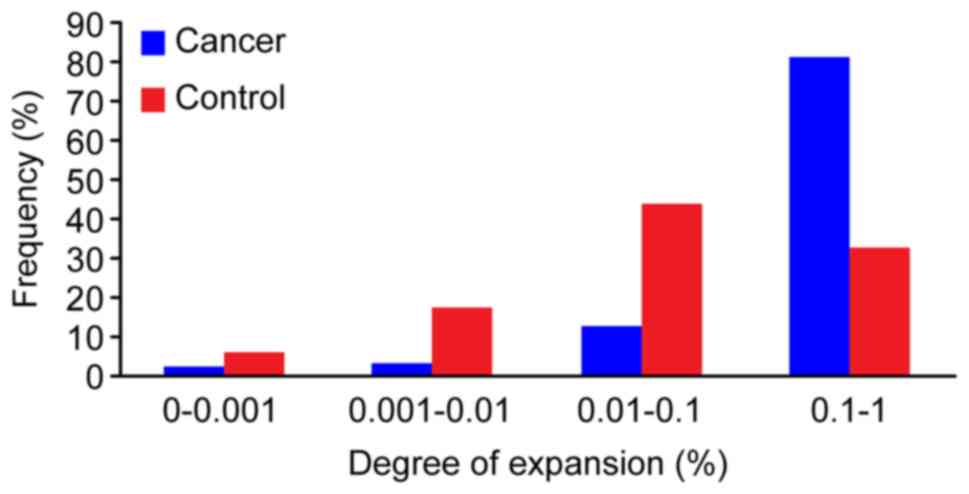
ratio of 0.19, in the control sample. Subsequently, a plot of the
frequency distribution of the TCR repertoire was developed in
cancer and control samples. Few DNA sequences were present at
substantially higher frequencies (>1%), and the majority of the
DNA sequences occurred at low frequencies in both cancer and
control samples. The percentages of different abundance clones were
determined. In the cancer sample, the percentage of clones with an
abundance of 0.1–1% was 81.50% of the total T-cell sequences,
whereas the percentage of clones with an abundance of 0.01–0.1% was
12.80%. Conversely, in the control sample, the percentage of clones
with an abundance of 0.1–1% was 32.60%, whereas the percentage of
clones with an abundance of 0.01–0.1% was highest, at 43.86%
(Fig. 2). The TCR repertoire in the
cancer sample had a greater HEC value (>0.5%), HEC ratio and a
higher degree clone percentage (>0.1%) than the control sample.
To compare the TCR diversity of the cancer and control samples, the
normalized Shannon entropy index was also used. The normalized
Shannon entropy index of the cancer sample was lower than that of
the control sample (0.40 vs. 0.59) (data not shown). The present
study suggested that the entire TCR repertoire in the cancer sample
had a substantially more skewed clonotype composition than the
control sample.
Special and shared TCR sequences
To further assess how TCR sequences were shared
between the cancer and control samples, deep sequencing was used to
characterize the HEC sequences of the respective TCR repertoires.
The analysis focused mainly on the DNA and amino acid (aa)
sequences of CDR3, which was the most diverse region of the TCR
molecule and was relevant to antigen epitope recognition. With
regards to the DNA sequences, 12,516 special DNA sequences were
obtained in the cancer sample, of which five were HECs. A total of
25,371 special DNA sequences were obtained in the control sample,
of which 10 were HECs (Table IV).
For the aa sequence, 9,424 special aa sequences were obtained in
the cancer sample, of which, seven were HECs, whereas the control
sample exhibited 21,020 special aa sequences, of which 10 were HECs
(Table V). In addition, 680 shared
DNA sequences and 701 shared aa sequences were determined in the
cancer and control samples. In a further comparative analysis, all
27 HEC DNA sequences in the cancer sample demonstrated a lower
expression (<0.5%) in the control sample. Conversely, four HEC
DNA sequences in the control sample had a lower expression
(<0.5%) in the cancer sample (Table
VI). For the shared aa sequence, all 28 HECs in the cancer
sample exhibited a lower expression (<0.5%) in the control
sample. In contrast, four HECs in the control sample showed a lower
expression (<0.5%) in the cancer sample (Table VII). There were no shared HECs in
the DNA and aa sequences between the cancer and control samples.
These results suggested that comparisons of the TCR HECs in cancer
and control samples may accelerate the screening process for
possible novel biomarkers.
| Table IV.A summary of the highly expressed
special DNA sequences (>0.5%). |
Table IV.
A summary of the highly expressed
special DNA sequences (>0.5%).
| A, Cancer |
|---|
|
|---|
| Clonotype
(5′-3′) | Frequency (%) |
|---|
|
GCCACCAGTGAGTTCGACAGGGGTAAAGAGACCCAGTAC | 0.54 |
|
GCCACCAGTGATCAGATTCATGTGGAGACCCAGTAC | 0.71 |
|
GCCAGCAATACCGGGACAGGGGCATATGGCTACACC | 0.72 |
|
GCCAGCAGTGATTTGGGGCCAGGCCTGTATGGCTACACC | 0.77 |
|
GCCAGCTACTCCTATGGCTACACC | 0.72 |
|
| B,
Control |
|
| Clonotype
(5′-3′) | Frequency
(%) |
|
|
GCCACCAGCAAAGGGACGACTAGGGCCGGCGAGCAGTAC | 0.90 |
|
GCCACCAGTTTTATTAAACAGCCCCAGCAT | 1.49 |
|
GCCAGCAGCCCGGGACAACCACCCCTCCAC | 0.59 |
|
GCCAGCAGCTTAGAGTCCGGACCCTACGAGCAGTAC | 0.51 |
|
GCCAGCAGTGACAACGGGCCAAATCAGCCCCAGCAT | 1.41 |
|
GCCAGCAGTGACCGGGGTGAGCAGTAC | 1.03 |
|
GCCAGCAGTTACAGGGGGGGGGAGCTGTTT | 1.35 |
|
GCCAGTAGCCCCACGGGGGCAGGGAACACTGAAGCTTTC | 1.06 |
|
GCCTCCACCGACAACAGGGAGACCCAGTAC | 1.41 |
|
GCCTGGAGTGTTACCGGGGCAGATGAAAAACTGTTT | 0.62 |
| Table V.A summary of the highly expressed
special amino acid sequences (>0.5%). |
Table V.
A summary of the highly expressed
special amino acid sequences (>0.5%).
| A, Cancer |
|---|
|
|---|
| Clonotype
(5′-3′) | Frequency (%) |
|---|
| ASNTGTGAYGYT | 0.73 |
| ASSDLGPGLYGYT | 0.78 |
| ASSMGRTDTQY | 0.53 |
| ASSVEGRTQY | 0.50 |
| ASYSYGYT | 0.72 |
| ATSDQIHVETQY | 0.73 |
| ATSEFDRGKETQY | 0.54 |
|
| B,
Control |
|
| Clonotype
(5′-3′) | Frequency
(%) |
|
| ASSDNGPNQPQH | 1.43 |
| ASSDRGEQY | 1.05 |
| ASSLESGPYEQY | 0.51 |
| ASSPGQPPLH | 0.60 |
| ASSPTGAGNTEAF | 1.08 |
| ASSYRGGELF | 1.37 |
| ASTDNRETQY | 1.42 |
| ATSFIKQPQH | 1.51 |
| ATSKGTTRAGEQY | 0.92 |
| AWSVTGADEKLF | 0.63 |
| Table VI.A summary of the highly expressed
shared DNA sequences (>0.5%). |
Table VI.
A summary of the highly expressed
shared DNA sequences (>0.5%).
| Clonotype
(5′-3′) | Cancer (%) | Control (%) |
|---|
|
GCCACCAGCAGAACGGCAGGAGAGACCCAGTAC | 0.781 | 0.001 |
|
GCCACCAGCAGAGAAGCTAGCGGGATCCAAGAGACCCAGTAC | 0.558 | 0.001 |
|
GCCACCAGCAGAGATACTCTAGGCACAGATACGCAGTAT | 0.001 | 2.191 |
|
GCCACCAGCAGAGATGGGGGCGGGGTACAAGAGACCCAGTAC | 0.737 | 0.001 |
|
GCCACCAGCAGTCCCTCGGGGATCTATGGCTACACC | 1.429 | 0.014 |
|
GCCACCAGCGATGATCAGGGGAGTTTTAATGAAAAACTGTTT | 0.748 | 0.001 |
|
GCCACCAGTGATATAGCGGGAGAGACCCAGTAC | 1.315 | 0.001 |
|
GCCACCAGTGATCGGGACTACTACAATGAGCAGTTC | 1.036 | 0.002 |
|
GCCACCAGTGATTCATCGGATTACGAGCAGTAC | 0.501 | 0.033 |
|
GCCACCAGTGATTGGGACAGCCCGACCTACGAGCAGTAC | 0.514 | 0.001 |
|
GCCACCAGTGATTTGCGGGGACAGGGCCAAGAGACCCAGTAC | 0.896 | 0.001 |
|
GCCACCAGTGATTTGGCCAGGCATTATGGCTACACC | 0.650 | 0.001 |
|
GCCACCAGTGATTTTAGGGGCCAACCCCAAGAGACCCAGTAC | 1.053 | 0.008 |
|
GCCACCAGTGATTTTGATTCGGGACTTTCGGGGACCCAGCAC | 0.656 | 0.001 |
|
GCCACCAGTGATTTTGATTCGGGACTTTCGGGGACCCAGTAC | 17.886 | 0.027 |
|
GCCACCAGTGATTTTGGAGGGATCCAAGAGACCCAGTAC | 0.595 | 0.001 |
|
GCCACCTCAGGGGACGGCTATGGCTACACC | 0.869 | 0.001 |
|
GCCAGCACCCTCTGGGGGAACACTGAAGCTTTC | 0.001 | 1.601 |
|
GCCAGCAGCTTTGGGAGCGAGCAGTAC | 0.564 | 0.001 |
|
GCCAGCAGGGAATTCGGACAGGGGGCAAAGGCTTTC | 1.972 | 0.001 |
|
GCCAGCAGTGAAAGCGGGAGTAGTGCAGATACGCAGTAT | 2.047 | 0.001 |
|
GCCAGCAGTGAAGGGGGGCAGGGGCGGCAGACCCAGTAC | 0.574 | 0.001 |
|
GCCAGCAGTTCCGCAACGTACCGATACACC | 1.303 | 0.009 |
|
GCCAGCATATTCGCGGTAGAGACTGAAGCTTTC | 0.001 | 0.533 |
|
GCCAGCCAGGGGTTCGGGGAGCTGTTT | 0.811 | 0.001 |
|
GCCAGCCTTCCCGAGACTAGCGGGAGCCACGAGCAGTAC | 0.532 | 0.001 |
|
GCCAGTACCCATACGGGTCGAGTGGACGGCTACACC | 0.557 | 0.001 |
|
GCCAGTAGTATCAATCTTAACGGCGAGCAGTAC | 0.840 | 0.002 |
|
GCCAGTAGTATCGGGACAGGGGGCGCCGGGGGCTACACC | 0.839 | 0.001 |
|
GCCAGTGGGGAGGGCCGGACCGGGGAGCTGTTT | 2.025 | 0.001 |
|
GCCTCGCGGGAGGGCCCCACCGGGGAGCTGTTT | 0.710 | 0.001 |
|
GCCTGGAGTATTTGGACTAACACTGAAGCTTTC | 0.001 | 4.212 |
| Table VII.A summary of the highly expressed
shared amino acid sequences (>0.5%). |
Table VII.
A summary of the highly expressed
shared amino acid sequences (>0.5%).
| Clonotype | Cancer (%) | Control (%) |
|---|
| ASGEGRTGELF | 2.038 | 0.001 |
| ASIFAVETEAF | 0.001 | 0.538 |
| ASLPETSGSHEQY | 0.535 | 0.001 |
| ASQGFGELF | 0.815 | 0.001 |
| ASREFGQGAKAF | 1.988 | 0.001 |
| ASREGPTGELF | 0.715 | 0.001 |
| ASSEGGQGRQTQY | 0.579 | 0.001 |
| ASSEGRKY | 0.502 | 0.001 |
| ASSESGSSADTQY | 2.063 | 0.001 |
| ASSFGSEQY | 0.565 | 0.001 |
| ASSIGTGGAGGYT | 0.846 | 0.001 |
| ASSINLNGEQY | 0.846 | 0.001 |
| ASSSATYRYT | 1.311 | 0.009 |
| ASTHTGRVDGYT | 0.560 | 0.001 |
| ASTLWGNTEAF | 0.001 | 1.624 |
| ATSDDQGSFNEKLF | 0.755 | 0.001 |
| ATSDFDSGLSGTQH | 0.663 | 0.001 |
| ATSDFDSGLSGTQY | 18.071 | 0.027 |
| ATSDFGGIQETQY | 0.600 | 0.001 |
| ATSDFRGQPQETQY | 1.062 | 0.008 |
| ATSDIAGETQY | 1.329 | 0.001 |
| ATSDLARHYGYT | 0.656 | 0.001 |
| ATSDLRGQGQETQY | 0.903 | 0.001 |
| ATSDRDYYNEQF | 1.042 | 0.001 |
| ATSDSSDYEQY | 0.492 | 0.034 |
| ATSDWDSPTYEQY | 0.517 | 0.001 |
| ATSGDGYGYT | 0.873 | 0.001 |
| ATSRDGGGVQETQY | 0.753 | 0.001 |
| ATSRDTLGTDTQY | 0.001 | 2.241 |
| ATSREASGIQETQY | 0.582 | 0.001 |
| ATSRTAGETQY | 0.789 | 0.001 |
| ATSSPSGIYGYT | 1.437 | 0.014 |
| AWSIWTNTEAF | 0.001 | 4.276 |
Comparison of TRBV, TCRβ diversity
(TRBD) and TRBJ repertoires
To determine whether cancer-specific differences
exist in the TRBV, TRBD and TRBJ repertoires, the expression levels
of the respective TRBV, TRBD and TRBJ repertoires were compared
between the cancer and control samples. Results demonstrated that
four special TRBV segments (TRBV12-1, TRBV5-7, TRBV6-7 and TRBV6-8)
were present in the control sample, whereas none were present in
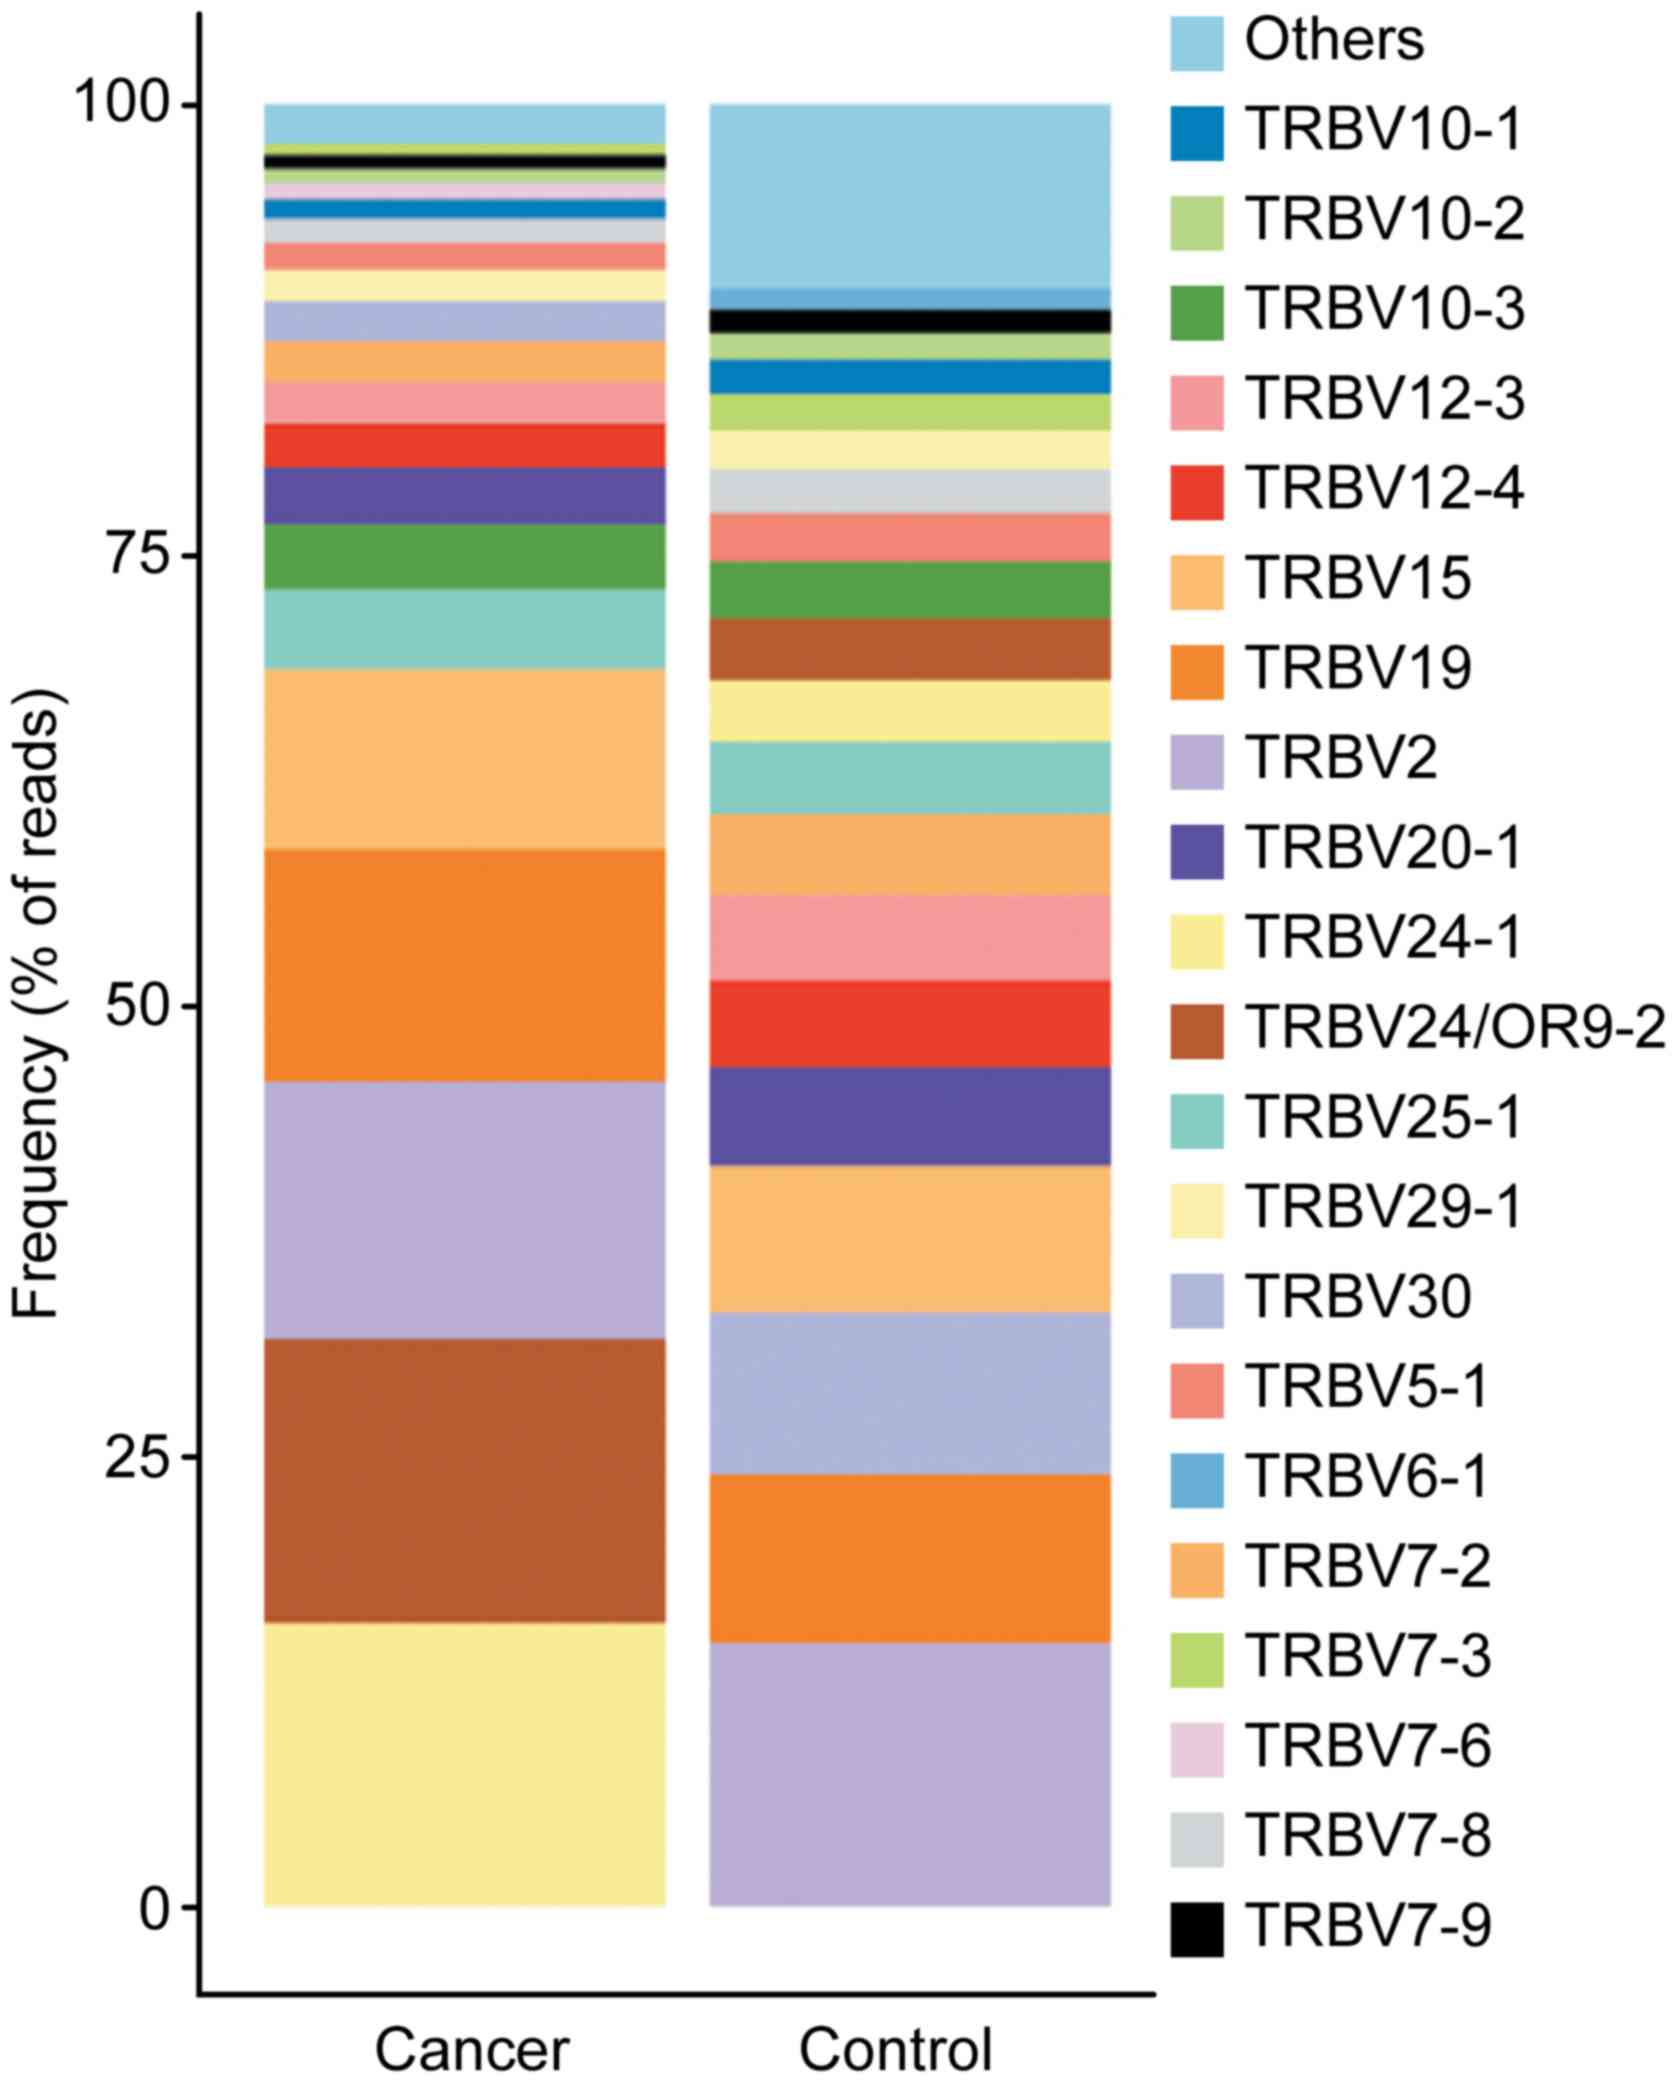
the cancer sample. For the 52 shared TRBV gene segments, the usage
frequencies of TRBV2 (14.32 vs. 14.61%) and TRBV25-1 (4.43 vs.
4.04%) were similar (±10%) between the cancer and control samples.
For the other distinct TRBV gene segments, the usage frequencies of
each TRBV gene exhibited extreme variation. A stacked bar chart was
generated to display the frequencies of the 20 top TRBV genes, and
differences were revealed between the cancer and control samples
(Fig. 3). The usage frequencies of
the TRBD gene segment were 38.42 and 61.58% for TRBD1 and TRBD2,
respectively in the cancer sample. Conversely, the usage
frequencies of the TRBD1 and TRBD2 gene segments were 53.76 and
46.24%, respectively in the control sample (data not shown). With
the exception of TRBJ2-2P (0.01 vs. 0.01%), the other 13 TRBJ gene
segments usage frequencies displayed extreme variation between the
cancer sample and control sample. These data indicated that there
might be clonal expansion, in particular for the V and J gene
families, in the cancer sample.
To compare the expression difference of the V-J
pairs between the cancer and control samples, seven special V-J
pairs were obtained in the cancer sample and 132 special V-J pairs
in the control sample; there were 483 shared V-J pairs between the
cancer and control samples. However, the seven special V-J pairs in
the cancer sample and 132 special V-J pairs in the control sample
demonstrated lower usage frequency (<1%), whereas for the 483
shared V-J pairs, 23 V-J pairs were found in the cancer sample and
22 V-J pairs in the control sample that exhibited a high usage
frequency (>1%) (Table VIII).
Among these, 10 V-J pairs were overlapping, and the other V-J pairs
revealed extreme variation between the cancer sample and control
sample. For example, TRBV24-1-TRBJ2-5 (23.67%) exhibited the
highest expression in the cancer sample, with a low expression in
the control sample (0.75%). Conversely TRBV30-TRBJ1-1 (4.90%)
displayed the highest expression in the control sample, whereas its
expression was very low in the cancer sample (0.22%). Taken
together, these data indicated that specific V-J dominant pairs
were dominant in the cancer sample.
| Table VIII.V-J pair usage percentage (>1%) in
the cancer and control samples. |
Table VIII.
V-J pair usage percentage (>1%) in
the cancer and control samples.
| A, Cancer |
|---|
|
|---|
| V-J pairs | Usage (%) |
|---|
| TRBV24-1,
TRBJ2-5 | 23.67 |
| TRBV15,
TRBJ2-5 | 3.79 |
| TRBV19,
TRBJ2-2 | 3.78 |
| TRBV19,
TRBJ1-2 | 3.27 |
| TRBV2, TRBJ2-3 | 2.65 |
| TRBV2,
TRBJ2-7 | 2.29 |
| TRBV24-1,
TRBJ2-7 | 2.23 |
| TRBV2,
TRBJ1-1 | 2.18 |
| TRBV12-3,
TRBJ1-1 | 2.05 |
| TRBV24-1,
TRBJ2-1 | 1.89 |
| TRBV2,
TRBJ2-5 | 1.82 |
| TRBV2, TRBJ1-5 | 1.79 |
| TRBV24-1,
TRBJ1-2 | 1.72 |
| TRBV15,
TRBJ1-2 | 1.48 |
| TRBV12-3,
TRBJ1-2 | 1.47 |
| TRBV19,
TRBJ2-7 | 1.41 |
| TRBV10-3,
TRBJ2-7 | 1.38 |
| TRBV15,
TRBJ2-7 | 1.37 |
| TRBV19,
TRBJ2-5 | 1.32 |
| TRBV2,
TRBJ1-2 | 1.26 |
| TRBV15,
TRBJ1-4 | 1.24 |
| TRBV25-1,
TRBJ1-2 | 1.21 |
| TRBV25-1,
TRBJ2-7 | 1.11 |
|
| B,
Control |
|
| V-J
pairs | Usage
(%) |
|
| TRBV25-1,
TRBJ1-4 | 1.57 |
| TRBV15,
TRBJ2-7 | 2.14 |
| TRBV19,
TRBJ2-5 | 2.13 |
| TRBV19,
TRBJ1-2 | 1.43 |
| TRBV20-1,
TRBJ2-5 | 1.10 |
| TRBV24-1,
TRBJ1-5 | 1.76 |
| TRBV30,
TRBJ1-1 | 4.90 |
| TRBV2, TRBJ2-1 | 1.06 |
| TRBV12-3,
TRBJ1-2 | 1.00 |
| TRBV25-1,
TRBJ1-1 | 1.15 |
| TRBV20-1,
TRBJ2-7 | 1.20 |
| TRBV2,
TRBJ2-7 | 3.21 |
| TRBV24-1,
TRBJ2-7 | 1.07 |
| TRBV12-3,
TRBJ2-7 | 1.18 |
| TRBV12-3,
TRBJ2-2 | 1.94 |
| TRBV2,
TRBJ1-2 | 2.09 |
| TRBV12-3,
TRBJ1-1 | 1.12 |
| TRBV19,
TRBJ1-1 | 1.89 |
| TRBV2,
TRBJ1-1 | 2.85 |
| TRBV2,
TRBJ2-5 | 1.63 |
| TRBV15,
TRBJ2-3 | 2.69 |
| TRBV7-2,
TRBJ2-7 | 1.38 |
Discussion
Intrinsic and extrinsic factors are important in the
development of bladder cancer; however, the exact pathogenesis is
still not fully understood. TILs are strictly correlated with
patient prognosis and provide the theoretical basis for
gene-immunological therapy in bladder cancer (19). Pichler et al revealed that the
tumour microenvironment influences the therapeutic response to BCG,
which may permit individualized treatment (7). However, most studies on individualized
treatment are based on changes and molecular typing of T-cell
subsets, and only a few studies focus on the sequence information
of TCR binding to tumour antigens. T lymphocytes serve an important
role in the tumour immune response; they recognize major
histocompatibility complex-bound peptides, which are mediated by
TCRs. The CDR3 region of TCRs has a special molecular structure,
which represents the different populations of T cells. In the
present study, multiplex PCR and HTS were used to investigate the
T-cell repertoires in cancerous and paracancerous tissues from
patients with bladder cancer. A total of 1,081,491 and 551,870
sequences were obtained from the cancer sample and the control
sample, respectively, providing substantial evidence regarding the
TCR repertoire in bladder cancer.
HECs are crucial in the immunological repertoire and
may be the result of physiological responses to pathogens or
antigens. In the present study, the number of HECs and the
contribution of these HECs to the total TCR repertoire were
analysed. The TCR repertoire in the cancer sample had a greater HEC
(>0.5% total TCR analysed) number, HEC ratio, and a higher
degree clone percentage (>0.1%) than in the control sample.
These results suggested that the degree of amplification in cancer
tissue was significantly higher than in paracancerous tissue.
Furthermore, to better understand the TCR diversity of the cancer
and control samples, the Shannon entropy index (20) was used. The results suggested that
the diversity of cancer tissues was lower than that of
paracancerous tissues. Nakanishi et al similarly
demonstrated that the proportion of CDR3 aa sequence accounting for
>0.01% of the total molecular population in the TILs is
significantly higher than in peripheral blood lymphocytes in
colorectal cancer (15). In
addition, Han et al revealed that the HEC ratio of the TCRβ
chain CDR3 sequence in carcinoma tissues is significantly higher
than in the adjacent tissues from patients with hepatitis B
virus-associated hepatocellular carcinoma (21). Velotti et al, via
high-resolution PCR, determined the CDR3 size lengths of TCRβ
transcripts from patients with bladder cancer, and demonstrated
that the number of expanded clones in the cancer tissues is larger
than that in peripheral blood (22).
This difference may be explained by the prolonged exposure of T
lymphocytes to tumour antigens, leading to a targeted rearrangement
of the TCR gene, eventually resulting in significant enrichment of
the corresponding clones in the cancer tissues. The identification
of bladder cancer-specific HECs may therefore accelerate the
screening process of potential novel tumour antigens. This
screening is critical to better understand the TCR repertoire, and
may represent a novel diagnostic tool for patients with bladder
cancer.
In the present study, analysis of the expression
levels of TRBV, TRBD and TRBJ repertoires was systematically
performed and revealed significant differences in the cancer
tissues compared with the paracancerous tissues. In addition, 13
identified V-J pairs were highly expressed (>1%) in the
cancerous tissue, whereas their expression was very low in the
paracancerous tissue. The high expression of one or more TCR BV
subfamilies in the cancer tissues from patients with bladder cancer
may be associated with the immune pathogenesis of the disease.
Therefore, the present study provided a theoretical foundation for
further investigations on the immune pathogenesis and
gene-immunological therapy of bladder cancer. In the absence of
disease, TCR BV is rearranged randomly, and T cells exhibit a
positive polyclonal state. However, in the case of disease,
prolonged stimulation by specific antigens gives rise to a
selective rearrangement and excessive abnormal cloning of one or
more TCR BV subfamilies; excessive cloning of the cloned T cell may
thus inhibit cloning of other T cells (23,24).
Wang et al reported a preferential use of TRBV and TRBJ
genes in cancerous tissues compared with adjacent tissues in breast
cancer (25). A recent study
identified specific V-J pairs that may distinguish the TCR
repertoires of patients with liver cancer from healthy subjects.
These specific V-J pairs may therefore be used as novel biomarkers
in liver cancer (21).
In conclusion, the present study demonstrated that
deep analysis of the TCR families from tissue samples may be
performed using a HTS platform. This may be a powerful novel
approach to evaluate the complexity and diversity of the T-cell
immune repertoire in bladder cancer. However, the sample size of
this study was small, which did not allow a complete description of
the diversity of the TCRβ CDR3 repertoire in various types of
bladder cancer. A better understanding of the functional basis of
the TCRβ CDR3 clonalities is crucial, and further studies based on
larger sample sizes, using tools such as NetMHC and SYFPEITHI, are
required to identify certain particular peptides including signal
transducer and activator of transcription 3 and glutathione
S-transferase alpha 1. This may represent a novel biomarker for the
detection, prognosis and development of gene-immunological therapy
of bladder cancer.
Acknowledgements
Not applicable.
Funding
This study was supported by grants from The
Scientific and Technology Project of Guangdong Province (grant no.
2016A050503009) and the Science and Technology Plan of Shenzhen
(grant no. JCY20160422164313440).
Availability of data and material
The datasets used and/or analysed during the current
study are available from the corresponding author on reasonable
request.
Authors' contributions
JM, YD and WS conceived and designed the
experiments. JM, GS, PZ and SL performed the experiments. JM, SL,
MO and ZC analysed the data. GS, CZ and FLC provided reagents,
materials and analysis tools, and acquired the data. JM and WS
wrote the paper.
Ethics approval and consent to
participate
This study passed the discussion and approval of the
Ethics Committee of Guilin No. 181 Hospital and Shenzhen People's
Hospital of Guangdong. All patients consented to participate in the
study and for their tissues to be used, as specified in the
Declaration of Helsinki.
Patient consent for publication
Not applicable.
Competing interests
The authors declare that they have no competing
interests.
References
|
1
|
de la Cruz-Merino L, Grande-Pulido E,
Albero-Tamarit A and Codes-Manuel de Villena ME: Cancer and immune
response: Old and new evidence for future challenges. Oncologis.
13:1246–1254. 2008. View Article : Google Scholar
|
|
2
|
Gooden MJ, de Bock GH, Leffers N, Daemen T
and Nijman HW: The prognostic influence of tumour-infiltrating
lymphocytes in cancer: A ystematic review with meta-analysis. Br J
Cancer. 105:93–103. 2011. View Article : Google Scholar : PubMed/NCBI
|
|
3
|
Delyon J, Mateus C, Lefeuvre D, Lanoy E,
Zitvogel L, Chaput N, Roy S, Eggermont AM, Routier E and Robert C:
Experience in daily practice with ipilimumab for the treatment of
patients with metastaticmelanoma: An early increase in lymphocyte
and eosinophil counts is associated with improved survival. Ann
Oncol. 24:1697–1703. 2013. View Article : Google Scholar : PubMed/NCBI
|
|
4
|
Lee AH, Gillett CE, Ryder K, Fentiman IS,
Miles DW and Millis RR: Different patterns of inflammation and
prognosis in invasive carcinoma of the breast. Histopathology.
48:692–701. 2006. View Article : Google Scholar : PubMed/NCBI
|
|
5
|
Lipson EJ, Sharfman WH, Drake CG, Wollner
I, Taube JM, Anders RA, Xu H, Yao S, Pons A, Chen L, et al: Durable
cancer regression off-treatment and effective reinduction therapy
with an anti-PD-1 antibody. Clin Cancer Res. 19:462–468. 2013.
View Article : Google Scholar : PubMed/NCBI
|
|
6
|
Brahmer JR, Tykodi SS, Chow LQ, Hwu WJ,
Topalian SL, Hwu P, Drake CG, Camacho LH, Kauh J, Odunsi K, et al:
Safety and activity of anti-PD-L1 antibody in patients with
advanced cancer. N Engl J Med. 366:2455–2465. 2012. View Article : Google Scholar : PubMed/NCBI
|
|
7
|
Pichler R, Fritz J, Zavadil C, Schäfer G,
Culig Z and Brunner A: Tumor-infiltrating immune cell
subpopulations influence the oncologic outcome after intravesical
Bacillus Calmette-Guérin therapy in bladder cancer. Oncotarget.
7:39916–39930. 2016. View Article : Google Scholar : PubMed/NCBI
|
|
8
|
Davis MM and Bjorkman PJ: T cell antigen
receptor genes and T cell recognition. Nature. 334:395–402. 1988.
View Article : Google Scholar : PubMed/NCBI
|
|
9
|
Rubtsova K, Scott-Browne JP, Crawford F,
Dai S, Marrack P and Kappler JW: Many different Vbeta CDR3s can
reveal the inherent MHC reactivity of germline-encoded TCR V
regions. Proc Natl Acad Sci USA. 106:7951–7956. 2009. View Article : Google Scholar : PubMed/NCBI
|
|
10
|
Arstila TP, Casrouge A, Baron V, Even J,
Kanellopoulos J and Kourilsky P: A direct estimate of the human
alphabeta T cell receptor diversity. Science. 286:958–961. 1999.
View Article : Google Scholar : PubMed/NCBI
|
|
11
|
Serratì S, De Summa S, Pilato B, Petriella
D, Lacalamita R, Tommasi S and Pinto R; Next-generation sequencing,
: Advances and applications in cancer diagnosis. Onco Targets Ther.
9:7355–7365. 2016. View Article : Google Scholar : PubMed/NCBI
|
|
12
|
Calis JJ and Rosenberg BR: Characterizing
immune repertoires by high throughput sequencing: Strategies and
applications. Trends Immunol. 35:581–590. 2014. View Article : Google Scholar : PubMed/NCBI
|
|
13
|
Gerlinger M, Quezada SA, Peggs KS, Furness
AJ, Fisher R, Marafioti T, Shende VH, McGranahan N, Rowan AJ,
Hazell S, et al: Ultra-deep T cell receptor sequencing reveals the
complexity and intratumour heterogeneity of T cell clones in renal
cell carcinomas. J Pathol. 231:424–432. 2013. View Article : Google Scholar : PubMed/NCBI
|
|
14
|
Weng WK, Armstrong R, Arai S, Desmarais C,
Hoppe R and Kim YH: Minimal residual disease monitoring with
high-throughput sequencing of T cell receptors in cutaneous T cell
lymphoma. Sci Transl Med. 5:214ra1712013. View Article : Google Scholar : PubMed/NCBI
|
|
15
|
Nakanishi K, Kukita Y, Segawa H, Inoue N,
Ohue M and Kato K: Characterization of the T cell receptor beta
chain repertoire in tumor-infiltrating lymphocytes. Cancer Med.
5:2513–2521. 2016. View
Article : Google Scholar : PubMed/NCBI
|
|
16
|
Lefranc MP: Immunoglobulin and T cell
receptor genes: IMGT(®) and the birth and rise of
immunoinformatics. Front Immunol. 5:222014. View Article : Google Scholar : PubMed/NCBI
|
|
17
|
Hou X, Lu C, Chen S, Xie Q, Cui G, Chen J,
Chen Z, Wu Z, Ding Y, Ye P, et al: High throughput sequencing of T
cell antigen receptors reveals a conserved TCR repertoire. Medicine
(Baltimore). 95:e28392016. View Article : Google Scholar : PubMed/NCBI
|
|
18
|
Sui W, Hou X, Zou G, Che W, Yang M, Zheng
C, Liu F, Chen P, Wei X, Lai L and Dai Y: Composition and variation
analysis of the TCR β-chain CDR3 repertoire in systemic lupus
erythematosus using high-throughput sequencing. Mol Immunol.
67:455–464. 2015. View Article : Google Scholar : PubMed/NCBI
|
|
19
|
Lipponen PK, Eskelinen MJ, Jauhiainen K,
Harju E and Terho R: Tumour infiltrating lymphocytes as an
independent prognostic factor in transitional cell bladder cancer.
Eur J Cancer 29A. 69–75. 1992.
|
|
20
|
Magurran AE: Measuring biological
diversity. John Wiley & Sons; 2013
|
|
21
|
Han Y, Liu X, Wang Y, Wu X, Guan Y, Li H,
Chen X, Zhou B, Yuan Q, Ou Y, et al: Identification of
characteristic TRB V usage in HBV-associated HCC by using
differential expression profiling analysis. OncoImmunology.
4:e10215372015. View Article : Google Scholar : PubMed/NCBI
|
|
22
|
Velotti F, Chopin D, Gil-Diez S, Maille P,
Abbou CC, Kourilsky P and Even J: Clonality of tumor-infiltrating
lymphocytes in human urinary bladder carcinoma. J Immunother.
20:470–478. 1997. View Article : Google Scholar : PubMed/NCBI
|
|
23
|
Long SA, Khalili J, Ashe J, Berenson R,
Ferrand C and Bonyhadi M: Standardized analysis for the
quantification of Vbeta CDR3 T-cell receptor diversity. J Immunol
Methods. 317:100–113. 2006. View Article : Google Scholar : PubMed/NCBI
|
|
24
|
Miqueu P, Guillet M, Degauque N, Doré JC,
Soulillou JP and Brouard S: Statistical analysis of CDR3 length
distributions for the assessment of T and B cell repertoire biases.
Mol Immunol. 44:1057–1064. 2007. View Article : Google Scholar : PubMed/NCBI
|
|
25
|
Wang T, Wang C, Wu J, He C, Zhang W, Liu
J, Zhang R, Lv Y, Li Y, Zeng X, et al: The different T cell
receptor repertoires in breast cancer tumors, draining lymph nodes,
and adjacent tissues. Cancer Immunol Res. 5:148–156. 2017.
View Article : Google Scholar : PubMed/NCBI
|