Introduction
Pancreatic cancer has a poor prognosis, with a
median survival time of 3–6 month and a 5-year survival rate of
less than 5% (1–3). The most common type of pancreatic
cancer is pancreatic ductal adenocarcinoma (PDAC), accounting for
~90% of pancreatic cancer cases (4).
Although numerous studies have focused on the pathogenesis and
progression of pancreatic cancer, the etiology and molecular
mechanisms of pancreatic cancer remain unclear (5,6).
Previous scientific studies have demonstrated that the occurrence
and progression of pancreatic cancer involve the interaction of
several factors, including gene mutations and environmental
conditions (7,8). Thus far, there remains a lack of
information regarding the molecular mechanisms that cause the
development and progression of pancreatic cancer that would allow
for improved precision therapies. Therefore, understanding the
molecular mechanisms of pancreatic cancer can provide an effective
basis for early prevention, diagnosis and treatment.
The advent of the gene chip and high-throughput gene
analysis platforms allows for the rapid detection of gene
expression in a microarray, which is particularly suitable for
screening differentially expressed genes (DEGs) (9). With the widespread application of gene
chip technology in cancer research, a large amount of genetic data
has been produced and stored in public gene databases.
Classification, integration and analysis of these data can provide
valuable insights and evidence for cancer research. In the past few
years, numerous gene chip expression profiles have been used to
study the pathogenesis and development of PDAC and hundreds of DEGs
have been identified (10). However,
due to differences in sample size and limitations of the studies,
no reliable biomarkers were identified. The combination of gene
chip and biological information analysis technology can be used to
monitor the expression of DEGs in the development and progression
of PDAC and to elucidate the signaling pathways involved,
potentially revealing targets which can be modulated to treat PDAC
(11).
In the present study, the original GSE28735 data set
(12) was downloaded from the Gene
Expression Omnibus (GEO) database (13). The dataset contained the gene
expression profiles of 45 matching pairs of pancreatic tumor and
adjacent non-tumor tissues from 45 patients with PDAC. DEGs were
detected by comparing the gene expression profiles between tumor
tissues and paracancerous tissues in patients with PDAC.
Subsequently, the DEGs were filtered using the Morpheus website
(https://software.broadinstitute.org/morpheus/) with
data processing standard. Then, the DEGs were screened using the
Gene-Spring software (version 11.5; Agilent Technologies, Inc.,
Santa Clara, CA, USA), followed by Gene Ontology (GO); (www.geneontology.org) and pathway enrichment analysis.
In addition, a protein-protein interaction (PPI) network was
established and three significant modules were analyzed. The
analysis of the biological pathways underlying the development of
PDAC may provide information for its diagnosis, prognosis and
treatment.
Materials and methods
Microarray data
The gene expression profiles of the GSE28735 dataset
were downloaded from the GEO database. The GPL6244 [HuGene-1_0-st]
Affymetrix Human Gene 1.0 ST Array platform (Affymetrix; Thermo
Fisher Scientific, Inc., Waltham, MA, USA) was used. The GSE28735
dataset contained 90 samples, including 45 PDAC tumor samples and
45 matching pairs of adjacent non-tumor tissue samples.
Identification of DEGs in
GSE28735
The raw expression data files include TXT files
(Affymetrix platform) used for analysis by processing using the
Morpheus website. Data were categorized into two groups with
similar expression patterns in PDAC tumor samples and matching
pairs of adjacent non-tumor tissue samples. A t-test was used to
identify the DEGs and |log2 fold change|≥1 and P<0.05 were
considered statistically significant.
Gene ontology and pathway enrichment
analysis of DEGs
GO analysis was used to annotate genes and classify
up and downregulated DEGs. GO terms are divided into three main
categories: Biological process (BP), cellular component (CC) and
molecular function (MF). The Kyoto Encyclopedia of Genes and
Genomes (KEGG; www.kegg.jp) website is an online
database which contains defined and associated gene sets and their
pathways. The Database for Annotation, Visualization and Integrated
Discovery (DAVID; david.ncifcrf.gov) allows analysis of gene lists and
provides biological information regarding genes. To analyze the
upregulated and downregulated genes in DEGs, GO and KEGG pathway
analysis were used in the DAVID database. P<0.05 was considered
to indicate a statistically significant difference.
Integration of PPI network
The Search Tool for the Retrieval of Interacting
Genes (STRING; www.string-db.org) was used to evaluate the PPI
information. The PPI network served to identify the key genes and
Cytoscape software (version 3.51; www.cytoscape.org) was used to draw the network
diagram. The topology of the PPI network was analyzed and the
extent of the expression of each gene was calculated. P<0.05 was
considered to indicate a statistically significant difference.
Results
Identification of DEGs in pancreatic
cancer
A total of 45 PDAC tumor samples and 45 matching
pairs of adjacent non-tumor tissue samples were analyzed. A total
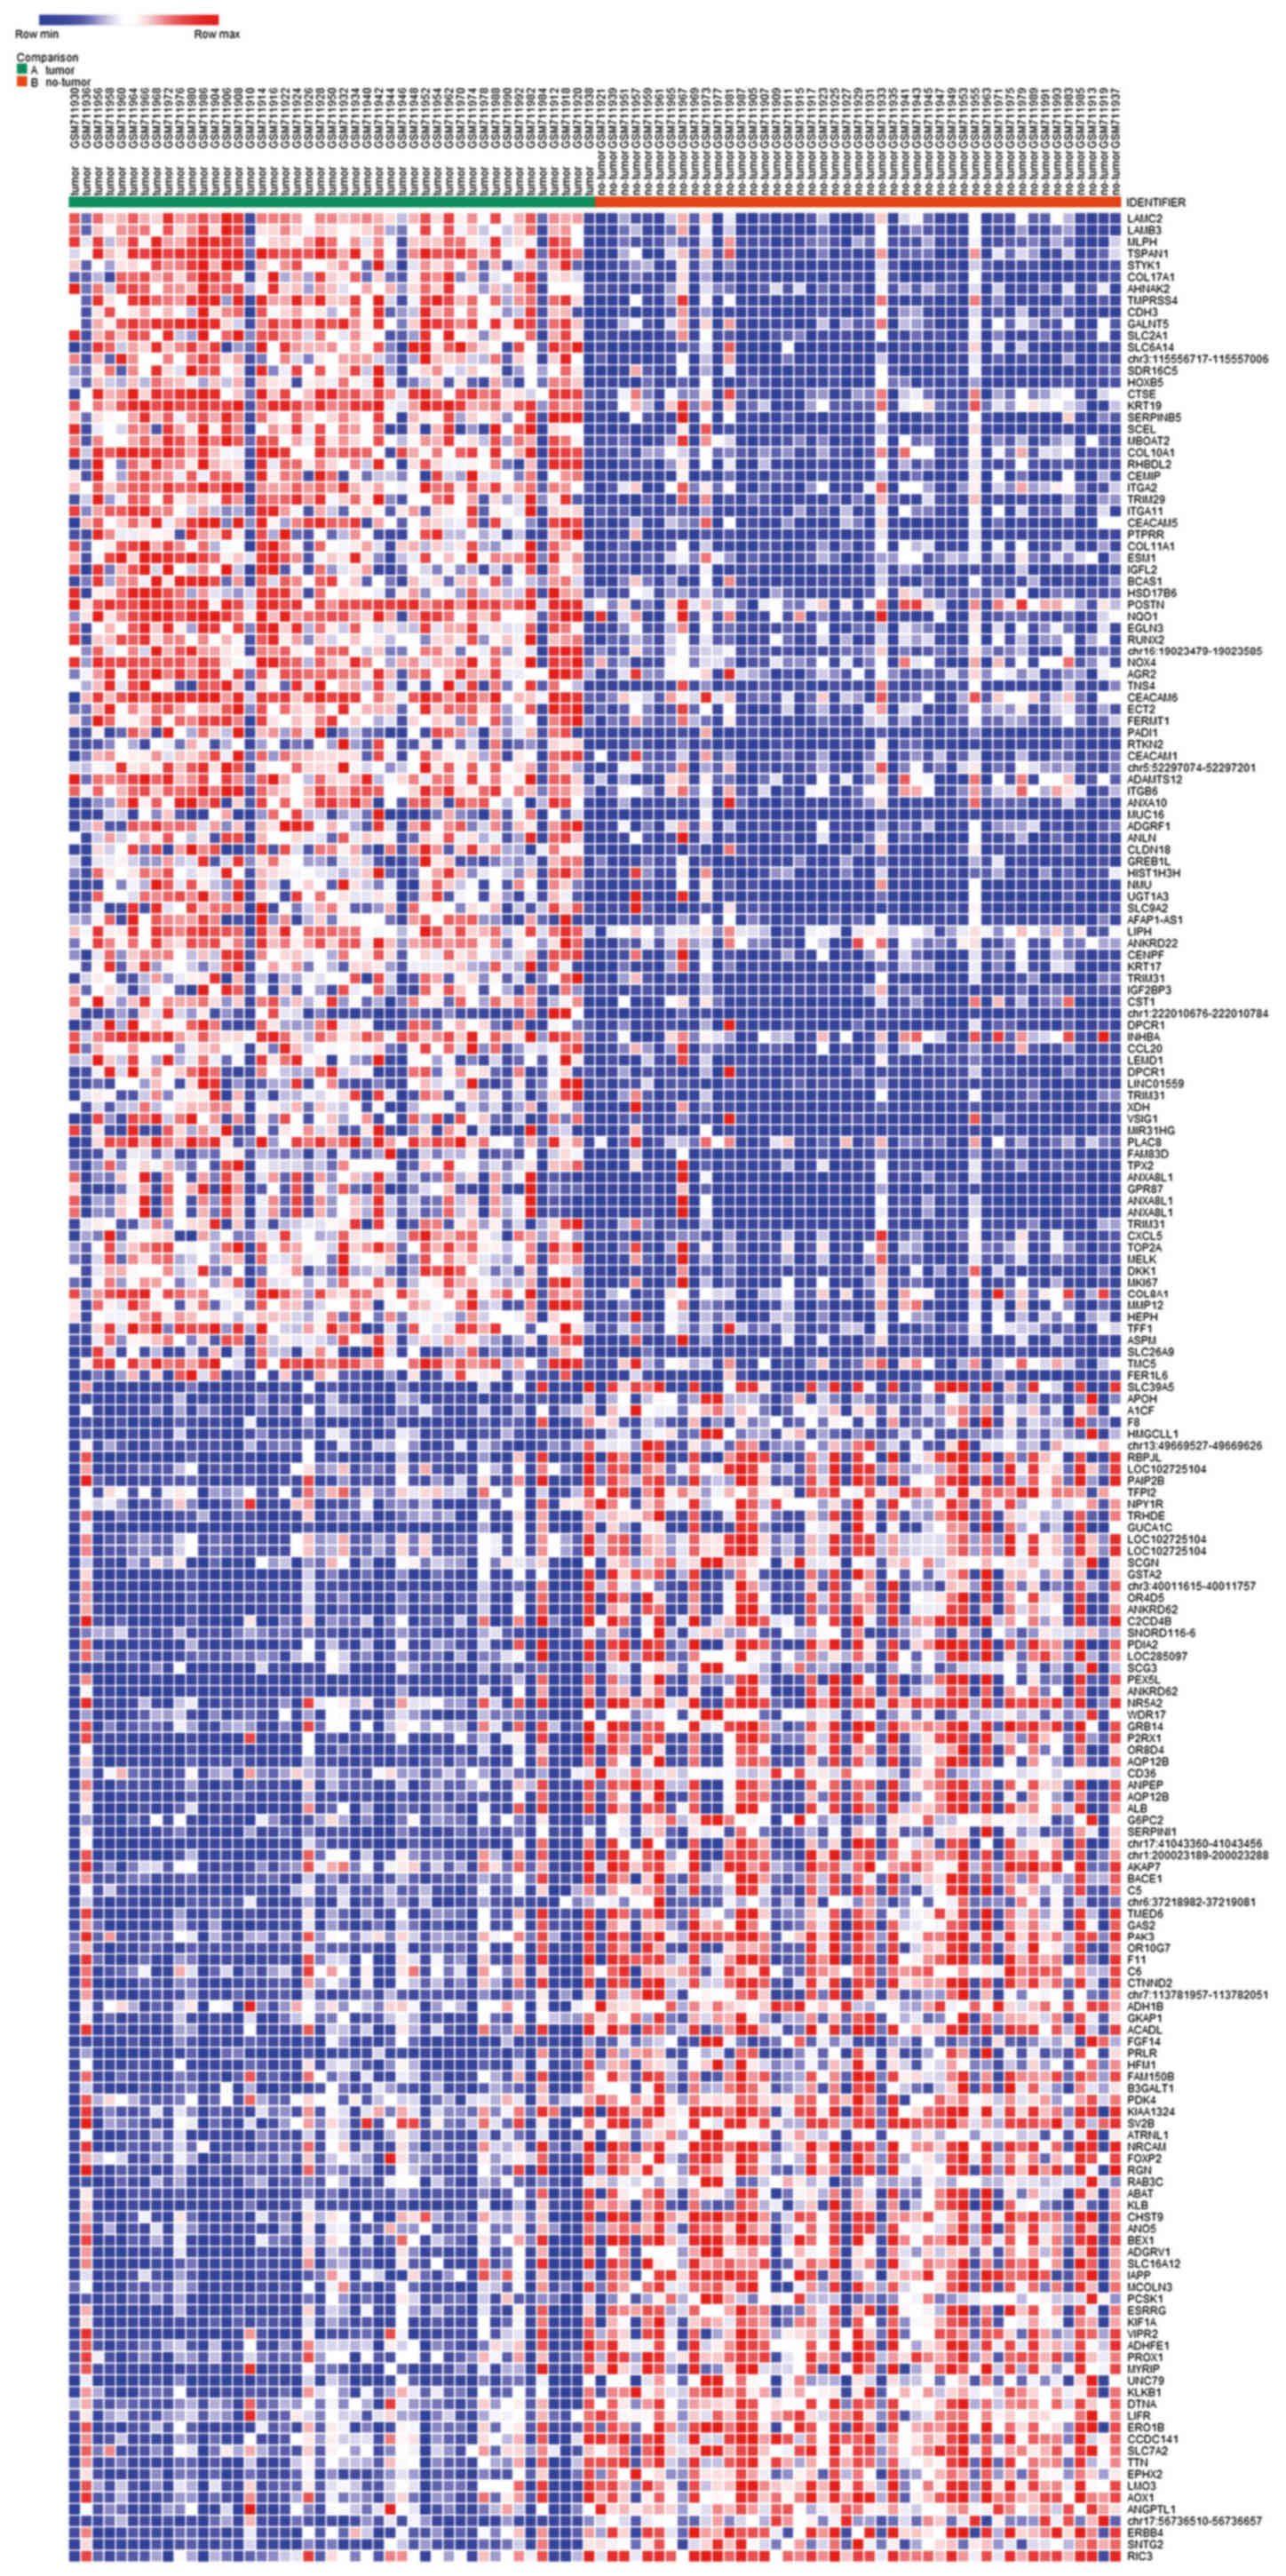
of 424 DEGs were identified from GSE28735, including 159
upregulated and 265 downregulated genes (Table I). The heat map of DEG expression,
presenting the top 50 upregulated and 50 downregulated genes was
constructed using the web-based tool Morpheus (Fig. 1).
 | Table I.A total of 424 DEGs were identified
from the GSE28735 dataset, including 159 upregulated genes and 265
downregulated genes in PDAC tissues, compared to adjacent non-tumor
tissue samples. |
Table I.
A total of 424 DEGs were identified
from the GSE28735 dataset, including 159 upregulated genes and 265
downregulated genes in PDAC tissues, compared to adjacent non-tumor
tissue samples.
| Differential
expression | Gene symbol |
|---|
| Upregulated | EPB41L4B, FAM129A,
SLC1A2, KLKB1, ALDH1A1, PAH, CHGA, CHST9, SEMA6A, SERPINA5, KIF1A,
CHRDL1, SLC16A10, CLU, MIR27B, PRKAR2B, FAM3B, ADHFE1, LONRF2, DPT,
CHRM3, SLC3A1, ABAT, PPY, BNIP3, NUCB2, GPHA2, ATRNL1, ESRRG,
ABCA8, FAM150B, ONECUT1, PRSS3P2, OR4D5, CXCL12, IL22RA1, TSPAN7,
F8, GCG, ADGRV1, SV2B, UGT2B11, SPINK1, PROX1, ANGPTL1, UNC79,
AMY2B, MCOLN3, AQP12B, FAM159B, FOSB, BTG2, SLC43A1, FLRT2, GSTA1,
AQP12B, C5, SCG3, CCDC141, DPP10, PKHD1, PRSS3, C2CD4B, MT1G,
HOMER2, GRB14, LYVE1, BACE1, SLC39A5, CD36, RGN, SYCN, GC, EPHX2,
REG3G, DCDC2, GUCA1C, SST, PCSK1, PDZK1P1, BEX1, PRSS2, LIFR, GRPR,
SLC30A8, MIR217, LMO3, ANKRD62, CTNND2, PM20D1, CFTR, GNMT, TFPI2,
SLC17A4, PAK3, GSTA2, AMY2B, G6PC2, TTN, CELP, SLC4A4, PRSS3P2, C6,
TTR, QP8, SLC7A2, KCNJ16, PDK4, OR8D4, REG3A, FABP4, NRCAM, NRG4,
PAIP2B, GATM, FGL1, ACADL, ADH1B, TRHDE, RBPJL, SCGN, REG1A, PRSS1,
CPB1, SLC16A12, ANPEP, TMED6, KLK1, RO1B, F11, CTRB2, AOX1, NR5A2,
KIAA1324, CELA3B, EGF, CPA1, PDIA2, REG1CP, EG1B, PNLIP, CTRB1,
CTRL, CELA3A, CELA2B, CELA2A, PLA2G1B, SERPINI2, CLPS, ERP27,
FAM24B, ALB, CPA2, CEL, GP2, CTRC, IAPP, PNLIPRP2, PNLIPRP1 |
| Downregulated | CEACAM5, SLC6A14,
LAMC2, GALNT5, TSPAN1, CTSE, POSTN, CEACAM6, ANXA10, LAMB3, ITGA2,
TMPRSS4, FN1, COL11A1, SERPINB5, DPCR1, AGR2, CLDN18, ITGB6, KRT19,
GABRP, CST1, VSIG1, SULF1, TFF1, COL17A1, SLC2A1, PLAC8, CEMIP,
SLPI, CP, AHNAK2, MMP12, COL12A1, TMC5, VCAN, MUC17, KRT7, ANLN,
INHBA, TRIM31, LIPH, CDH3, TRIM31, SCEL, NOX4, THBS2, EGLN3, C13,
ADGRF1, MBOAT2, ANTXR1, TCN1, ANKRD22, COL10A1, CXCL5, XYD3, KRT17,
BCAS1, ITGA3, SDR16C5, EDIL3, APOL1, UGT1A3, COL1A1, MMP11, FERMT1,
FAP, ANXA8L1, CDH11, COL1A2, MET, FNDC1, FBXO32, COMP, NQO1, ACSL5,
MLPH, NPR3, ANXA8L1, MIA-RAB4B, COL8A1, GCNT3, IGFL2, ADAMTS12,
TNS4, CAPG, TRIM29, TSPAN8, CYP2C18, TRIM31, TMEM45B, MATN3,
COL5A2, PLAU, PADI1, ITGA11, COL3A1, CCL20, IGFP5, LAMA3, HK2,
IFI27, MYOF, PLAT, FER1L6, KRT6C, ECT2, LY75, MMP14, TOP2A, DNRA,
LEF1, CENPF, TNFAIP6, ITGB4, PLEK2, CEACAM1, LAMP5, TMC7, NPR3,
OLR1, SERPINB3, ANO1, DHRS9, SLC6A6, MICAL2, MUC16, ARNTL2, PTPRR,
KYNU, NRP2, S100A14, CD109, BAIAP2L1, AFAP1-AS1, LOXL2, FGD6, CST2,
IFI44L, S100P, MMP1, COL6A3, SL44A4, ERO1A, ASPM, BGN, DKK1, STYK1,
MMP7, RUNX2, NT5E, TGM2, HEPH, KRT17, GPX2, OSBPL3, LMO7, GPRC5A,
EPHA4, DCP1, GF2BP3, S100A16, PXDN, MKI67, EFNA5, KRT17, MELK,
ADAM9, SLC22A3, MST1R, ACTA2, FF2, LCN2, PLPP4, ADAM28, MXRA5,
DPYSL3, TGFBI, XDH, CCL18, OAS1, ABHD17C, RHBDL2, HIST1H3H, MUC1,
INPP4B, AEBP1, MMP9, MTMR11, FOXQ1, ENO2, OCIAD2, DLGAP5, HPGD,
TPX2, PLA2R1, SRPX2, LRRN1, SLCO1B3, SEMA3C, IL1RAP, SYTL2, FER1L4,
DSG2, SULF2, HOXB5, MFP5, IL2RG, SULT1B1, CORIN, SLC9A2, GJB2,
ADAM12, PLS1, AK4, ATP2C2, GREM1, ETV1, LTBP1, OAS2, ASAP2, SGIP1,
PGM2L1, DDX60, DGKH, KCNN4, MALL, P4HA1, ANXA3, TSK, EPYC, NRP2,
FUT3, ADAMTS6, KRT6A, IL1R2, DCBLD2, NMU, EFNB2, ST6GALNAC1,
ANGPT2, FCGR3B, KIF23, FBN1, PKM, SEMA7A, TRIM16, RTKN2, SLC26A9,
NTM, PCDH7, RAI14, SULT1C2, ESM1, AREG, DSG3, GPX8, MACC1, CTHRC1,
HIST1H3I, SCNN1A, SLC16A3 |
GO term and pathway enrichment
analyses
To further elucidate the function of the selected
genes, the online software DAVID was used to perform DEG GO
analysis. As aforementioned, GO analysis results classify DEG
functions and pathways into three functional groups: BP, CC and MF.
For BP, the upregulated DEGs were enriched in ‘digestion’, ‘lipid
digestion’ and ‘proteolysis’, while the downregulated DEGs were
enriched in ‘ECM organization’, ‘extracellular structure
organization’ and ‘cell adhesion’ (Tables II and III). For CC, the upregulated DEGs were
enriched in the ‘extracellular region’, and the downregulated DEGs
were enriched in ‘extracellular region’ and ‘ECM’ (Tables II and III). For MF, the upregulated DEGs were
enriched in ‘serine-type peptidase activity’, ‘serine hydrolase
activity’ and ‘peptidase activity’, and the downregulated DEGs were
enriched in ‘ECM structural constituent’, ‘integrin binding’ and
‘cell adhesion molecule binding’ (Tables II and III).
| Table II.GO analysis of upregulated DEGs
associated with PDAC. |
Table II.
GO analysis of upregulated DEGs
associated with PDAC.
| Category | Term | Gene function | Count | P-value |
|---|
| BP | GO:0007586 | Digestion | 18 |
3.31×10⁻¹⁴ |
| BP | GO:0044241 | Lipid
digestion | 6 |
9.18×10⁻⁷ |
| BP | GO:0006508 | Proteolysis | 35 |
1.08×10⁻⁶ |
| BP | GO:0006766 | Vitamin metabolic
process | 9 |
1.57×10⁻⁵ |
| BP | GO:0009235 | Cobalamin metabolic
process | 5 |
2.56×10⁻⁵ |
| BP | GO:0015850 | Organic hydroxy
compound transport | 10 |
4.03×10⁻⁵ |
| BP | GO:0006767 | Water-soluble
vitamin metabolic process | 7 |
9.77×10⁻⁵ |
| BP | GO:0006629 | Lipid metabolic
process | 26 |
1.11×10⁻⁴ |
| BP | GO:0046903 | Secretion | 23 |
1.23×10⁻⁴ |
| BP | GO:0032940 | Secretion by
cell | 21 |
1.67×10⁻⁴ |
| CC | GO:0005576 | Extracellular
region | 90 |
1.47×10⁻¹⁷ |
| CC | GO:0005615 | Extracellular
space | 47 |
4.64×10⁻¹⁵ |
| CC | GO:0044421 | Extracellular
region part | 78 |
8.75×10⁻¹⁵ |
| CC | GO:0031988 | Membrane-bounded
vesicle | 64 |
6.61×10⁻⁹ |
| CC | GO:0070062 | Extracellular
exosome | 52 |
1.46×10⁻⁷ |
| CC | GO:1903561 | Extracellular
vesicle | 52 |
1.72×10⁻⁷ |
| CC | GO:0043230 | Extracellular
organelle | 52 |
1.74×10⁻⁷ |
| CC | GO:0030141 | Secretory
granule | 15 |
4.27×10⁻⁶ |
| CC | GO:0060205 | Cytoplasmic
membrane-bounded vesicle lumen | 8 |
4.51×10⁻⁵ |
| CC | GO:0031983 | Vesicle lumen | 8 |
4.80×10⁻⁵ |
| MF | GO:0008236 | Serine-type
peptidase activity | 18 |
2.13×10⁻¹⁰ |
| MF | GO:0017171 | Serine hydrolase
activity | 18 |
2.51×10⁻¹⁰ |
| MF | GO:0008233 | Peptidase
activity | 27 |
3.41×10⁻¹⁰ |
| MF | GO:0004252 | Serine-type
endopeptidase activity | 17 |
4.20×10⁻¹⁰ |
| MF | GO:0070011 | Peptidase activity,
acting on L-amino acid peptides | 26 |
8.65×10⁻¹⁰ |
| MF | GO:0004175 | Endopeptidase
activity | 18 |
8.45×10⁻⁷ |
| MF | GO:0008238 | Exopeptidase
activity | 9 |
4.27×10⁻⁶ |
| MF | GO:0008235 | Metalloexopeptidase
activity | 6 |
1.98×10⁻⁴ |
| MF | GO:0004806 | Triglyceride lipase
activity | 4 |
7.93×10⁻⁴ |
| MF | GO:0005179 | Hormone
activity | 6 |
3.54×10⁻³ |
| Table III.GO analysis of downregulated DEGs
associated with PDAC. |
Table III.
GO analysis of downregulated DEGs
associated with PDAC.
| Category | Term | Gene function | Count | P-value |
|---|
| BP | GO:0030198 | Extracellular
matrix organization | 42 |
2.61×10⁻²⁷ |
| BP | GO:0043062 | Extracellular
structure organization | 42 |
2.94×10⁻²⁷ |
| BP | GO:0007155 | Cell adhesion | 67 |
2.12×10⁻¹⁵ |
| BP | GO:0022610 | Biological
adhesion | 67 |
2.52×10⁻¹⁵ |
| BP | GO:0016477 | Cell migration | 53 |
3.81×10⁻¹⁴ |
| BP | GO:0030574 | Collagen catabolic
process | 15 |
1.91×10⁻¹³ |
| BP | GO:0051674 | Localization of
cell | 55 |
2.69×10⁻¹³ |
| BP | GO:0048870 | Cell motility | 55 |
2.69×10⁻¹³ |
| BP | GO:0044243 | Multicellular
organism catabolic process | 15 |
8.59×10⁻¹³ |
| BP | GO:0006928 | Movement of cell or
subcellular component | 64 |
1.18×10⁻¹² |
| CC | GO:0005576 | Extracellular
region | 148 |
4.33×10⁻²⁵ |
| CC | GO:0044421 | Extracellular
region part | 133 |
3.86×10⁻²⁴ |
| CC | GO:0031012 | Extracellular
matrix | 42 |
8.29×10⁻¹⁸ |
| CC | GO:0005578 | Proteinaceous
extracellular matrix | 35 |
1.90×10⁻¹⁷ |
| CC | GO:0044420 | Extracellular
matrix component | 19 |
1.21×10⁻¹² |
| CC | GO:0005615 | Extracellular
space | 59 |
6.91×10⁻¹² |
| CC | GO:0070062 | Extracellular
exosome | 84 |
6.11×10⁻¹⁰ |
| CC | GO:1903561 | Extracellular
vesicle | 84 |
7.84×10⁻¹⁰ |
| CC | GO:0043230 | Extracellular
organelle | 84 |
7.99×10⁻¹⁰ |
| CC | GO:0031988 | Membrane-bounded
vesicle | 96 |
9.00×10⁻⁹ |
| MF | GO:0005201 | Extracellular
matrix structural constituent | 13 |
1.27×10⁻⁹ |
| MF | GO:0005178 | Integrin
binding | 14 |
2.41×10⁻⁹ |
| MF | GO:0050839 | Cell adhesion
molecule binding | 25 |
2.52×10⁻⁸ |
| MF | GO:0019838 | Growth factor
binding | 13 |
2.08×10⁻⁷ |
| MF | GO:0004222 |
Metalloendopeptidase activity | 12 |
4.62×10⁻⁷ |
| MF | GO:0005539 | Glycosaminoglycan
binding | 15 |
1.20×10⁻⁶ |
| MF | GO:0005509 | Calcium ion
binding | 28 |
2.19×10⁻⁶ |
| MF | GO:0005518 | Collagen
binding | 9 |
2.67×10⁻⁶ |
| MF | GO:0005102 | Receptor
binding | 43 |
3.59×10⁻⁶ |
| MF | GO:0008237 | Metallopeptidase
activity | 13 |
1.34×10⁻⁵ |
KEGG pathway analysis in pancreatic
cancer
KEGG pathway analysis was used to analyze the most
significantly enriched pathways of the upregulated DEGs and
downregulated DEGs. The upregulated DEGs were enriched in
‘pancreatic secretion’, ‘protein digestion and absorption’ and ‘fat
digestion and absorption’ (Table
IV). The downregulated DEGs were enriched in ‘ECM-receptor
interaction’, ‘focal adhesion’ and ‘PI3K/Akt signaling’ pathways
(Table IV).
| Table IV.KEGG pathway analysis of DEGs
associated with PDAC. |
Table IV.
KEGG pathway analysis of DEGs
associated with PDAC.
| A, Upregulated |
|---|
|
|---|
| Pathway | Name | Count | P-value | Genes |
|---|
| hsa04972 | Pancreatic
secretion | 19 |
4.1×10⁻¹⁸ | PNLIP, CELA3A,
PNLIPRP1, CELA3B, PNLIPRP2, PRSS1, CFTR, CEL, CHRM3, PRSS2, PRSS3,
CPA2, PLA2G1B, CELA2B, CELA2A, CPA1, CPB1, SLC4A4, CTRL |
| hsa04974 | Protein digestion
and absorption | 13 |
1.9×10⁻¹⁰ | CELA3A, CELA3B,
SLC16A10, PRSS2, PRSS3, PRSS1, CPA2, CELA2B, CELA2A, CPA1, SLC3A1,
CPB1, CTRL |
| hsa04975 | Fat digestion and
absorption | 7 |
4.1×10⁻⁶ | PNLIP, CEL, CLPS,
PNLIPRP1, PNLIPRP2, CD36, PLA2G1B |
| hsa04610 | Complement and
coagulation cascades | 6 |
1.0×10⁻³ | F11, KLKB1,
SERPINA5, C6, C5, F8 |
| hsa00982 | Drug metabolism-
cytochrome P450 | 5 |
7.1×10⁻³ | GSTA1, GSTA2, AOX1,
UGT2B11, ADH1B |
| hsa00561 | Glycerolipid
metabolism | 4 |
2.7×10⁻² | PNLIP, CEL,
PNLIPRP1, PNLIPRP2 |
| hsa04950 | Maturity onset
diabetes of the young | 3 |
3.4×10⁻² | ONECUT1, IAPP,
NR5A2 |
| hsa00830 | Retinol
metabolism | 4 |
3.7×10⁻² | ALDH1A1, AOX1,
UGT2B11, ADH1B |
| hsa04971 | Gastric acid
secretion | 4 |
4.9×10⁻² | KCNJ16, CHRM3,
CFTR, SST |
| hsa00980 | Metabolism of
xenobiotics by cytochrome P450 | 4 |
5.1×10⁻² | GSTA1, GSTA2,
UGT2B11, ADH1B |
|
| B,
Downregulated |
|
| Pathway | Name | Count | P-value | Genes |
|
| hsa04512 | ECM-receptor
interaction | 17 |
1.4×10⁻¹³ | COL3A1, ITGB4,
ITGA11, ITGA2, ITGA3, COL5A2, LAMB3, LAMA3, COMP, ITGB6, COL6A3,
COL1A2, LAMC2, COL1A1, THBS2, COL11A1, FN1 |
| hsa04510 | Focal adhesion | 18 |
1.1×10⁻⁸ | COL3A1, MET, ITGB4,
ITGA11, ITGA2, ITGA3, COL5A2, LAMB3, LAMA3, COMP, COL6A3, ITGB6,
COL1A2, LAMC2, COL1A1, THBS2, COL11A1, FN1 |
| hsa04151 | PI3K-Akt signaling
pathway | 21 |
20×10−7 | COL3A1, MET,
ITGA11, ITGB4, ITGA2, ITGA3, COL5A2, LAMB3, LAMA3, COMP, COL6A3,
ITGB6, COL1A2, LAMC2, EFNA5, IL2RG, COL1A1, THBS2, ANGPT2, COL11A1,
FN1 |
| hsa05146 | Amoebiasis | 11 |
4.4×10⁻⁶ | IL1R2, LAMB3,
LAMA3, COL3A1, COL1A2, LAMC2, COL1A1, SERPINB3, COL11A1, COL5A2,
FN1 |
| hsa04974 | Protein digestion
and absorption | 10 |
7.0×10⁻⁶ | KCNN4, COL17A1,
COL3A1, COL6A3, COL1A2, COL12A1, COL1A1, COL11A1, COL5A2,
COL10A1 |
| hsa05412 | Arrhythmogenic
right ventricular cardiomyopathy | 7 |
7.2×10⁻⁴ | DSG2, ITGB6,
ITGA11, ITGB4, LEF1, ITGA2, ITGA3 |
| hsa05202 | Transcriptional
misregulation in cancer | 10 |
1.0×10⁻³ | PLAT, IL1R2, MMP9,
MET, ETV1, RUNX2, HPGD, HIST1H3H, PLAU, HIST1H3I |
| hsa05222 | Small cell lung
cancer | 6 |
9.6×10⁻³ | LAMB3, LAMA3,
ITGA2, LAMC2, ITGA3, FN1 |
| hsa05230 | Central carbon
metabolism in cancer | 5 |
1.6×10⁻² | SLC16A3, PKM,
SLC2A1, MET, HK2 |
| hsa05410 | Hypertrophic
cardiomyopathy | 5 |
3.1×10⁻² | ITGB6, ITGA11,
ITGB4, ITGA2, ITGA3 |
PPI and modular analysis in pancreatic
cancer
Using the STRING online database and Cytoscape
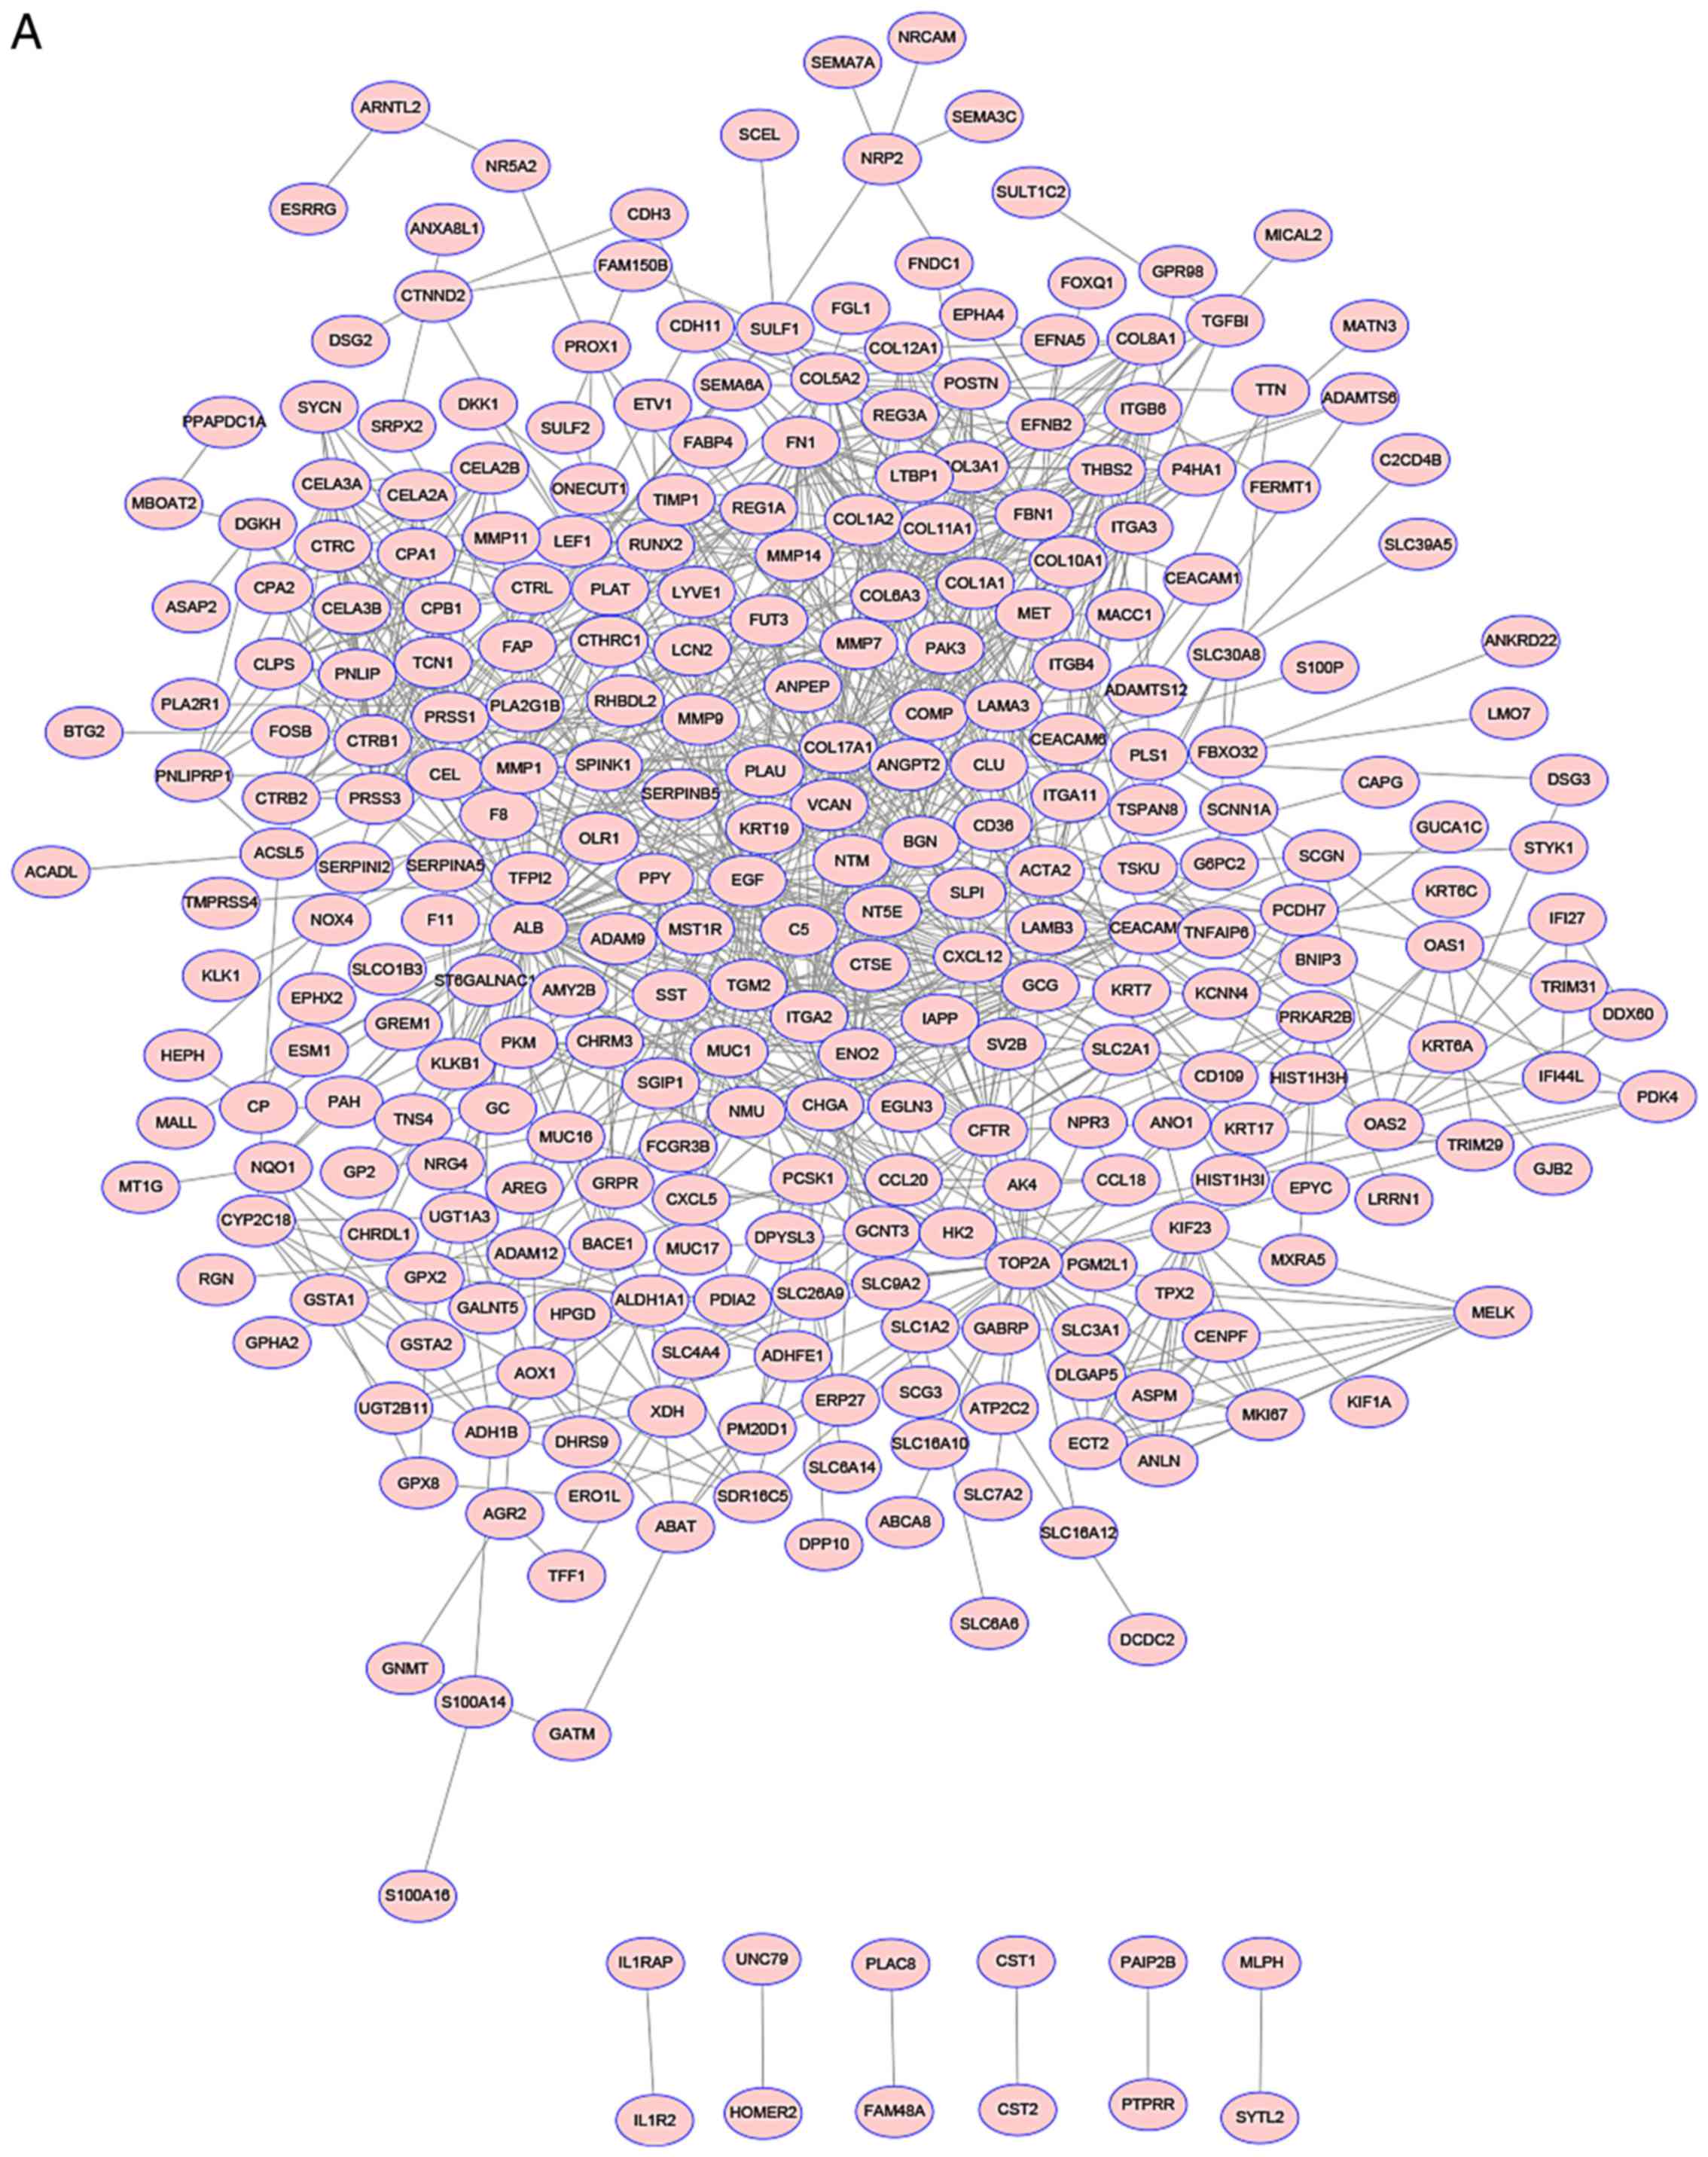
software analysis, a total of 386 DEGs (143 upregulated and 243
downregulated genes) of the 424 commonly altered DEGs were filtered
into the DEGs PPI network complex, including 424 nodes and 1090
edges (Fig. 2A). The 10 nodes with
the highest degree were cystic fibrosis transmembrane conductance
regulator (CFTR), SLC7A2 (solute carrier family 7 member 2), C-C
motif chemokine ligand 18 (CCL18), pyruvate dehydrogenase kinase 4
(PDK4), BAI1 associated protein 2 like 1 (BAIAP2L1), integrin
subunit α3 (ITGA3), carboxypeptidase A1 (CPA1), G protein-coupled
receptor class C group 5 member A (GPRC5A),
serine/threonine/tyrosine kinase 1 (STYK1), and ST6
N-acetylgalactosaminide α-2, 6-sialyltransferase 1 (ST6GALNAC1).
Among the upregulated DEGs, a total of 143 DEGs were filtered into
the DEG PPI network complex including 143 nodes and 263 edges
(Fig. 2B), which were mainly
associated with ‘digestion’, ‘serine-type peptidase activity’ and
the ‘extracellular region’ (Table
V). Among the downregulated DEGs, a total of 143 DEGs were
filtered into the DEGs PPI network complex including 243 nodes and
497 edges (Fig. 2C), which were
mainly associated with ‘ECM organization’, ‘ECM structural
constituents’ and the ‘extracellular region’ (Table VI).
| Table V.The enriched pathways of upregulated
DEGs PPI network in PDAC. |
Table V.
The enriched pathways of upregulated
DEGs PPI network in PDAC.
| A, Biological
process |
|---|
|
|---|
| Term | Description | Count | P-value |
|---|
| GO.0007586 | Digestion | 13 |
1.12×10⁻⁸ |
| GO.0065008 | Regulation of
biological quality | 45 |
7.78×10⁻⁵ |
| GO.0044281 | Small molecule
metabolic process | 36 |
1.85×10⁻⁴ |
| GO.0046903 | Secretion | 18 |
1.85×10⁻⁴ |
| GO.0002576 | Platelet
degranulation | 7 |
6.08×10⁻³ |
|
| B, Molecular
function |
|
| Term |
Description | Count | P-value |
|
| GO.0008236 | Serine-type
peptidase activity | 13 |
2.61×10⁻⁸ |
| GO.0004252 | Serine-type
endopeptidase activity | 12 |
2.83×10⁻⁷ |
| GO.0070011 | Peptidase activity,
acting on L-amino acid peptides | 18 |
1.40×10⁻⁵ |
| GO.0008233 | Peptidase
activity | 18 |
1.77×10⁻⁵ |
| GO.0004175 | Endopeptidase
activity | 13 |
3.51×10⁻³ |
|
| C, Cellular
component |
|
| Term |
Description | Count | P-value |
|
| GO.0005576 | Extracellular
region | 76 |
2.57×10⁻¹⁵ |
| GO.0031988 | Membrane-bounded
vesicle | 62 |
3.76×10⁻¹² |
| GO.0044421 | Extracellular
region part | 62 |
4.12×10⁻¹¹ |
| GO.0005615 | Extracellular
space | 35 |
8.18×10⁻¹¹ |
| GO.0070062 | Extracellular
exosome | 50 |
2.10×10⁻⁹ |
| Table VI.The enriched pathways of
downregulated DEGs PPI network in PDAC. |
Table VI.
The enriched pathways of
downregulated DEGs PPI network in PDAC.
| A, Biological
process |
|---|
|
|---|
| Term | Description | Count | P-value |
|---|
| GO.0030198 | Extracellular
matrix organization | 35 |
4.14×10⁻²⁴ |
| GO.0022617 | Extracellular
matrix disassembly | 20 |
1.55×10⁻¹⁷ |
| GO.0030574 | Collagen catabolic
process | 15 |
6.65×10⁻¹⁴ |
| GO.0007155 | Cell adhesion | 32 |
4.45×10⁻⁹ |
| GO.0001704 | Formation of
primary germ layer | 13 |
5.25×10⁻⁹ |
|
| B, Molecular
function |
|
| Term |
Description | Count | P-value |
|
| GO.0005201 | Extracellular
matrix structural constituent | 10 |
5.72×10⁻⁷ |
| GO.0005518 | Collagen
binding | 8 |
4.92×10⁻⁶ |
| GO.0005539 | Glycosaminoglycan
binding | 13 |
1.12×10⁻⁵ |
| GO.0005515 | Protein
binding | 66 |
1.16×10⁻⁴ |
| GO.0004222 |
Metalloendopeptidase activity | 9 |
1.94×10⁻⁴ |
|
| C, Cellular
component |
|
| Term |
Description | Count | P-value |
|
| GO.0005576 | Extracellular
region | 100 |
7.19×10⁻²⁵ |
| GO.0044421 | Extracellular
region part | 91 |
2.70×10⁻²⁴ |
| GO.0005615 | Extracellular
space | 44 |
1.93×10⁻¹⁴ |
| GO.0070062 | Extracellular
exosome | 63 |
4.76×10⁻¹³ |
| GO.0031012 | Extracellular
matrix | 24 |
6.44×10⁻¹³ |
Discussion
The incidence of PDAC is increasing worldwide
(14). The clinical signs and
symptoms may be difficult to diagnose in the initial stages of the
disease (7). Patients are often
diagnosed at a late stage, when regional invasion or distant
metastasis have occurred, resulting in a 5-year survival rate of
~5% (15,16). An insight into the molecular
mechanisms of PDAC would allow for earlier diagnosis and more
effective treatment. The rapid development of gene chips and
high-throughput sequencing can rapidly and accurately provide gene
expression data for thousands of genes in the human genome.
Previous studies have identified some of the genes and signaling
pathways that serve a role in the development of pancreatic cancer
from chip analysis (17,18). In the present study, the chip data in
the GSE28735 dataset was comprehensively analyzed and 424 common
DEGs (159 upregulated and 265 downregulated) between PDAC and
matching pairs of adjacent non-tumor tissue were identified using
bioinformatics analysis.
GO analysis is an international standardized gene
function classification system that provides the molecular function
of genes involved in a variety of biological processes (19). In the current study, GO term analysis
revealed that the upregulated genes were mainly involved in
‘digestion’, ‘lipid digestion’ and ‘proteolysis’, and downregulated
DEGs were involved in ‘extracellular matrix organization’,
‘extracellular structure organization’ and ‘cell adhesion’. The
pancreas mainly secretes trypsin and pancreatic lipase and
abnormalities in secretions can interfere with protein and lipid
metabolism, leading to chronic pancreatitis which is one of the
important contributing factors for pancreatic cancer (20). The stability of cell structure and
cell adhesion is also a major factor in the formation of pancreatic
cancer (21).
Furthermore, KEGG pathway analysis indicated that
the upregulated DEGs were involved in pancreatic secretion pathways
and protein and lipid digestion and absorption pathways. Existing
studies revealed that metabolic change is considered one of the
characteristics of cancer, especially the dysfunction of pancreatic
secretion (11,22). In pancreatic cancer, metabolic
changes are prominent in protein and lipid digestion and absorption
pathways (23). The downregulated
DEGs were associated with ‘ECM-receptor interaction’, ‘focal
adhesion’ and the ‘PI3K-Akt signaling’ pathways.
Previous studies indicated that pancreatic stellate
cells, which can cause pancreatic fibrosis leading to pancreatic
cancer, can produce and secrete ECM (24,25). One
of the components of ECM, hyaluronic acid, can combine with CD44
antigen and influence vascular epithelial-mesenchymal transition
(EMT) as well as cancer cell resistance to chemotherapy (4). Furthermore, the main constitutive
protein of ECM, collagen I, can promote the adhesion of pancreatic
cancer cells through the proliferation and migration of integrin
α2β1 (24). Collagen, fibronectin
and laminin are also associated with chemoresistance in pancreatic
cancer cells in vitro (26).
Previous studies revealed that focal adhesions interact with the
ECM and can promote EMT, thereby promoting cell carcinogenesis
(27). Furthermore, the PI3K-Akt
signaling pathway is important in the etiology of pancreatic cancer
(28). Therefore, these signaling
pathways can promote the development of pancreatic cancer in a
variety of ways, and may provide a new direction for the systematic
treatment of pancreatic cancer.
In the current study, the top 10 degree hub genes
identified in the PPI network were: CFTR, SLC7A2, CCL18, PDK4,
BAIAP2L1, ITGA3, CPA1, GPRC5A, STYK1 and ST6GALNAC1. CFTR was the
highest scoring gene. The CFTR gene codes for the cystic fibrosis
transmembrane conductance regulator protein, an important member of
the ATP binding cassette transporter family (29). It serves an important role in anion
regulation and tissue homeostasis of various epithelial cells,
activates the cAMP channel and promotes chloride and bicarbonate
secretion in the digestive system (30,31). A
previous study revealed that increased expression of CFTR in
drug-resistant prostate cancer tissues or cells that block CFTR can
inhibit tumor cell viability and autophagy via the PI3K/Akt
signaling pathway (32). In CFTR
knockout mice, mucosal barrier function was impaired, including
tight junction disruption, which resulted in impaired tolerance to
bacterial colonization and infection, abnormal innate and adaptive
immune responses, and inflammation (33,34). It
has been reported that CFTR is a negative regulator of the
pro-inflammatory nuclear factor k-light-chain-enhancer of activated
B cells-mediated innate immune response, including interleukin-8,
and evokes a positive feedback loop of cyclooxygenase
2-prostaglandin E2 in inflammation, and therefore, these factors
may work together to promote tumorigenesis (35,36). The
pancreas is a digestive organ that secretes a variety of substances
to regulate the digestive fluids through exocrine and endocrine
methods (37). At the same time, the
abovementioned 10 hub genes can also regulate the development and
progression of pancreatic cancer by regulating immune and
inflammatory processes, protein glycosylation and energy metabolism
which affect multiple signaling pathways (38–43).
Therefore, these genes can be an important target for the precise
treatment of pancreatic cancer.
For the upregulated DEGs, module analysis of the PPI
network revealed that they were associated with pancreatic
secretion signaling pathways and ‘protein digestion and absorption’
and ‘lipid digestion and absorption’ signaling pathways.
Stimulation of the pancreas by secretagogues, including
acetylcholine and cholecystokinin, results in intracellular Ca2+
signals, leading to the polarized secretion of enzymes (44). However, activation of the CFTR Cl-
channel and the CFTR-dependent Cl-/HCO3- exchange is
responsible for cAMP-induced HCO3- secretion (44). The secretory function of the pancreas
is directly associated with both protein and lipid metabolism in
the body, the disruption of which may lead to chronic inflammation
of the pancreas, developing into pancreatic cancer (45).
The downregulated DEGs were associated with
ECM-receptor interactions, focal adhesion and the PI3K-Akt
signaling pathway (46). The ECM
serves an important role in the morphogenesis of tissues and
organs, and in the maintenance of cell and tissue structures and
functions (47). These interactions
lead to direct or indirect control of cell activity, including
adhesion, migration, differentiation, proliferation, and apoptosis
(48). Furthermore, the focal
adhesion signaling pathway is the key signaling pathway of cell
matrix adhesion, which serves an important role in cell movement,
cell proliferation, cell differentiation, gene expression
regulation and cell survival (49).
The proliferation and metastasis of cancer cells depend on the
regulation of this pathway (50,51). The
PI3K-Akt signaling pathway serves as a bridge between extracellular
signals and intracellular responses (52,53).
Once activated, Akt phosphorylation can be involved in apoptosis,
matrix control, important cellular processes, protein synthesis,
metabolism and the cell cycle (54).
The results obtained in the current study suggest that pancreatic
secretory dysfunction, the imbalance of ECM-associated signaling
pathways and the PI3K-Akt signaling pathway may result in cell
cycle disruption and metabolism-associated microenvironmental
changes, which can trigger the development of pancreatic
cancer.
In conclusion, the current study investigated the
biological pathways involved in PDAC by providing a comprehensive
bioinformatics map of DEGs. These DEGs are involved in the
development and progression of PDAC and provide a basis for the
effective study of the molecular mechanisms of pancreatic cancer.
Further molecular biological experiments and animal studies are
required to confirm the functions and roles of these DEGs in
PDAC.
Acknowledgements
Not applicable.
Funding
This study was supported by the Key Foundation of
Sichuan Municipal Commission of Health and Family Planning
Foundation of China (grant no. 17ZD008) and the Sichuan Medical
Research Project Foundation of China (grant no. S16007).
Availability of data and materials
The datasets analyzed during the current study are
available in the GSE28735 repository (www.ncbi.nlm.nih.gov/geo).
Authors' contributions
YH, YL and HW conceived of and designed the
experiments. YH, YL, JG, CL and HZ performed the experiments. YH,
YL and HW acquired, analyzed and interpreted the data and wrote the
paper.
Ethics approval and consent to
participate
Not applicable.
Patient consent for publication
Not applicable.
Competing interests
The authors declare that they have no competing
interests.
References
|
1
|
Ryan DP, Hong TS and Bardeesy N:
Pancreatic adenocarcinoma. N Engl J Med. 371:2140–2141. 2014.
View Article : Google Scholar : PubMed/NCBI
|
|
2
|
Quaresma M, Coleman MP and Rachet B:
40-year trends in an index of survival for all cancers combined and
survival adjusted for age and sex for each cancer in England and
Wales, 1971–2011: A population-based study. Lancet. 385:1206–1218.
2015. View Article : Google Scholar : PubMed/NCBI
|
|
3
|
Siegel R, Naishadham D and Jemal A: Cancer
statistics, 2013. CA Cancer J Clin. 63:11–30. 2013. View Article : Google Scholar : PubMed/NCBI
|
|
4
|
Maron R, Schechter B, Mancini M,
Mahlknecht G, Yarden Y and Sela M: Inhibition of pancreatic
carcinoma by homo- and heterocombinations of antibodies against
EGF-receptor and its kin HER2/ErbB-2. Proc Natl Acad Sci USA.
110:15389–15394. 2013. View Article : Google Scholar : PubMed/NCBI
|
|
5
|
Chen YL, Hu CM, Hsu JT, Chang CC, Huang
TY, Chiang PH, Chen WY, Chang YT, Chang MC, Tien YW, et al:
Cellular 5-hydroxylmethylcytosine content determines tumorigenic
potential and prognosis of pancreatic ductal adenocarcinoma. Am J
Cancer Res. 8:2548–2563. 2018.PubMed/NCBI
|
|
6
|
Capello M, Vykoukal JV, Katayama H, Bantis
LE, Wang H, Kundnani DL, Aguilar-Bonavides C, Aguilar M, Tripathi
SC, Dhillon DS, et al: Exosomes harbor B cell targets in pancreatic
adenocarcinoma and exert decoy function against complement-mediated
cytotoxicity. Nat Commun. 10:2542019. View Article : Google Scholar : PubMed/NCBI
|
|
7
|
Chu LC, Goggins MG and Fishman EK:
Diagnosis and detection of pancreatic cancer. Cancer J. 23:333–342.
2017. View Article : Google Scholar : PubMed/NCBI
|
|
8
|
Ilic M and Ilic I: Epidemiology of
pancreatic cancer. World J Gastroenterol. 22:9694–9705. 2016.
View Article : Google Scholar : PubMed/NCBI
|
|
9
|
Vogelstein B, Papadopoulos N, Velculescu
VE, Zhou S, Diaz LA Jr and Kinzler KW: Cancer genome landscapes.
Science. 339:1546–1558. 2013. View Article : Google Scholar : PubMed/NCBI
|
|
10
|
Lin QJ, Yang F, Jin C and Fu DL: Current
status and progress of pancreatic cancer in China. World J
Gastroenterol. 21:7988–8003. 2015. View Article : Google Scholar : PubMed/NCBI
|
|
11
|
Yan X, Wan H, Hao X, Lan T, Li W, Xu L,
Yuan K and Wu H: Importance of gene expression signatures in
pancreatic cancer prognosis and the establishment of a prediction
model. Cancer Manag Res. 11:273–283. 2018. View Article : Google Scholar : PubMed/NCBI
|
|
12
|
Zhang G, Schetter A, He P, Funamizu N,
Gaedcke J, Ghadimi BM, Ried T, Hassan R, Yfantis HG, Lee DH, et al:
DPEP1 inhibits tumor cell invasiveness, enhances chemosensitivity
and predicts clinical outcome in pancreatic ductal adenocarcinoma.
PLoS One. 7:e315072012. View Article : Google Scholar : PubMed/NCBI
|
|
13
|
Zhou S, Liu P, Jiang W and Zhang H:
Identification of potential target genes associated with the effect
of propranolol on angiosarcoma via microarray analysis. Oncol Lett.
13:4267–4275. 2017. View Article : Google Scholar : PubMed/NCBI
|
|
14
|
Huang H and Brekken RA: The next wave of
stroma-targeting therapy in pancreatic cancer. Cancer Res.
79:328–330. 2019. View Article : Google Scholar : PubMed/NCBI
|
|
15
|
Siegel RL, Miller KD and Jemal A: Cancer
statistics, 2016. CA Cancer J Clin. 66:7–30. 2016. View Article : Google Scholar : PubMed/NCBI
|
|
16
|
Heinemann V, Reni M, Ychou M, Richel DJ,
Macarulla T and Ducreux M: Tumour-stroma interactions in pancreatic
ductal adenocarcinoma: rationale and current evidence for new
therapeutic strategies. Cancer Treat Rev. 40:118–128. 2014.
View Article : Google Scholar : PubMed/NCBI
|
|
17
|
Zhang G, He P, Tan H, Budhu A, Gaedcke J,
Ghadimi BM, Ried T, Yfantis HG, Lee DH, Maitra A, et al:
Integration of metabolomics and transcriptomics revealed a fatty
acid network exerting growth inhibitory effects in human pancreatic
cancer. Clin Cancer Res. 19:4983–4993. 2013. View Article : Google Scholar : PubMed/NCBI
|
|
18
|
Zhang G, Schetter A, He P, Funamizu N,
Gaedcke J, Ghadimi BM, Ried T, Hassan R, Yfantis HG, Lee DH, et al:
DPEP1 inhibits tumor cell invasiveness, enhances chemosensitivity
and predicts clinical outcome in pancreatic ductal adenocarcinoma.
PLoS One. 7:e315072012. View Article : Google Scholar : PubMed/NCBI
|
|
19
|
Ling YH, Ren CH, Guo XF, Xu LN, Huang YF,
Luo JC, Zhang YH, Zhang XR and Zhang ZJ: Identification and
characterization of microRNAs in the ovaries of multiple and
uniparous goats (Capra hircus) during follicular phase. BMC
Genomics. 15:3392014. View Article : Google Scholar : PubMed/NCBI
|
|
20
|
Raimondi S, Lowenfels AB, Morselli-Labate
AM, Maisonneuve P and Pezzilli R: Pancreatic cancer in chronic
pancreatitis; aetiology, incidence, and early detection. Best Pract
Res Clin Gastroenterol. 24:349–358. 2010. View Article : Google Scholar : PubMed/NCBI
|
|
21
|
Grippo PJ and Munshi HG: Imaging the
Pancreatic ECM. Pancreatic Cancer and Tumor Microenvironment.
Trivandrum (India): Transworld Research Network. Chapter 2.
2012
|
|
22
|
Hanahan D and Weinberg RA: Hallmarks of
cancer: The next generation. Cell. 144:646–674. 2011. View Article : Google Scholar : PubMed/NCBI
|
|
23
|
Le A, Rajeshkumar NV, Maitra A and Dang
CV: Conceptual framework for cutting the pancreatic cancer fuel
supply. Clin Cancer Res. 18:4285–4290. 2012. View Article : Google Scholar : PubMed/NCBI
|
|
24
|
Apte MV, Pirola RC and Wilson JS:
Pancreatic stellate cells: A starring role in normal and diseased
pancreas. Front Physiol. 3:3442012. View Article : Google Scholar : PubMed/NCBI
|
|
25
|
Koikawa K, Ohuchida K, Takesue S, Ando Y,
Kibe S, Nakayama H, Endo S, Abe T, Okumura T, Horioka K, et al:
Pancreatic stellate cells reorganize matrix components and lead
pancreatic cancer invasion via the function of Endo180. Cancer
Lett. 412:143–154. 2018. View Article : Google Scholar : PubMed/NCBI
|
|
26
|
Grzesiak JJ, Ho JC, Moossa AR and Bouvet
M: The integrin-extracellular matrix axis in pancreatic cancer.
Pancreas. 35:293–301. 2007. View Article : Google Scholar : PubMed/NCBI
|
|
27
|
Burridge K: Focal Adhesions: A personal
perspective on a half century of progress. FEBS J. 284:3355–3361.
2017. View Article : Google Scholar : PubMed/NCBI
|
|
28
|
Ebrahimi S, Hosseini M, Shahidsales S,
Maftouh M, Ferns GA, Ghayour-Mobarhan M, Hassanian SM and Avan A:
Targeting the Akt/PI3K signaling pathway as a potential therapeutic
strategy for the treatment of pancreatic cancer. Curr Med Chem.
24:1321–1331. 2017. View Article : Google Scholar : PubMed/NCBI
|
|
29
|
Zou WB, Tang XY, Zhou DZ, Qian YY, Hu LH,
Yu FF, Yu D, Wu H, Deng SJ, Lin JH, et al: SPINK1, PRSS1, CTRC, and
CFTR genotypes influence disease onset and clinical outcomes in
chronic pancreatitis. Clin Transl Gastroenterol. 9:2042018.
View Article : Google Scholar : PubMed/NCBI
|
|
30
|
Collins FS: Cystic fibrosis: Molecular
biology and therapeutic implications. Science. 256:774–779. 1992.
View Article : Google Scholar : PubMed/NCBI
|
|
31
|
Anderson MP, Gregory RJ, Thompson S, Souza
DW, Paul S, Mulligan RC, Smith AE and Welsh MJ: Demonstration that
CFTR is a chloride channel by alteration of its anion selectivity.
Science. 253:202–205. 1991. View Article : Google Scholar : PubMed/NCBI
|
|
32
|
Zhu Q, Li H, Liu Y and Jiang L: Knockdown
of CFTR enhances sensitivity of prostate cancer cells to cisplatin
via inhibition of autophagy. Neoplasma. 64:709–717. 2017.
View Article : Google Scholar : PubMed/NCBI
|
|
33
|
De Lisle RC: Disrupted tight junctions in
the small intestine of cystic fibrosis mice. Cell Tissue Res.
355:131–142. 2014. View Article : Google Scholar : PubMed/NCBI
|
|
34
|
Munck A: Cystic fibrosis: Evidence for gut
inflammation. Int J Biochem Cell Biol. 52:180–183. 2014. View Article : Google Scholar : PubMed/NCBI
|
|
35
|
Vij N, Mazur S and Zeitlin PL: CFTR is a
negative regulator of NFkappaB mediated innate immune response.
PLoS One. 4:e46642009. View Article : Google Scholar : PubMed/NCBI
|
|
36
|
Chen J, Jiang XH, Chen H, Guo JH, Tsang
LL, Yu MK, Xu WM and Chan HC: CFTR negatively regulates
cyclooxygenase-2-PGE(2) positive feedback loop in inflammation. J
Cell Physiol. 227:2759–2766. 2012. View Article : Google Scholar : PubMed/NCBI
|
|
37
|
Brereton MF, Iberl M, Shimomura K, Zhang
Q, Adriaenssens AE, Proks P, Spiliotis II, Dace W, Mattis KK,
Ramracheya R, et al: Reversible changes in pancreatic islet
structure and function produced by elevated blood glucose. Nat
Commun. 5:46392014. View Article : Google Scholar : PubMed/NCBI
|
|
38
|
Sun P, Zhu X, Shrubsole MJ, Ness RM,
Hibler EA, Cai Q, Long J, Chen Z, Li G, Hou L, et al: Genetic
variation in SLC7A2 interacts with calcium and magnesium intakes in
modulating the risk of colorectal polyps. J Nutr Biochem. 47:35–40.
2017. View Article : Google Scholar : PubMed/NCBI
|
|
39
|
Chen J, Yao Y, Gong C, Yu F, Su S, Chen J,
Liu B, Deng H, Wang F, Lin L, et al: CCL18 from tumor-associated
macrophages promotes breast cancer metastasis via PITPNM3. Cancer
Cell. 19:541–555. 2011. View Article : Google Scholar : PubMed/NCBI
|
|
40
|
Bonnet S, Archer SL, Allalunis-Turner J,
Haromy A, Beaulieu C, Thompson R, Lee CT, Lopaschuk GD, Puttagunta
L, Bonnet S, et al: A mitochondria-K+ channel axis is suppressed in
cancer and its normalization promotes apoptosis and inhibits cancer
growth. Cancer Cell. 11:37–51. 2007. View Article : Google Scholar : PubMed/NCBI
|
|
41
|
Wang YP, Huang LY, Sun WM, Zhang ZZ, Fang
JZ, Wei BF, Wu BH and Han ZG: Insulin receptor tyrosine kinase
substrate activates EGFR/ERK signalling pathway and promotes cell
proliferation of hepatocellular carcinoma. Cancer Lett. 337:96–106.
2013. View Article : Google Scholar : PubMed/NCBI
|
|
42
|
Yang L, Ma T and Zhang J: GPRC5A exerts
its tumor-suppressive effects in breast cancer cells by inhibiting
EGFR and its downstream pathway. Oncol Rep. 36:2983–2990. 2016.
View Article : Google Scholar : PubMed/NCBI
|
|
43
|
Wang J, Farris AB, Xu K, Wang P, Zhang X,
Duong DM, Yi H, Shu HK, Sun SY and Wang Y: GPRC5A suppresses
protein synthesis at the endoplasmic reticulum to prevent
radiation-induced lung tumorigenesis. Nat Commun. 7:117952016.
View Article : Google Scholar : PubMed/NCBI
|
|
44
|
Chey WY and Chang T: Neural hormonal
regulation of exocrine pancreatic secretion. Pancreatology.
1:320–335. 2001. View Article : Google Scholar : PubMed/NCBI
|
|
45
|
Vaziri-Gohar A, Zarei M, Brody JR and
Winter JM: Metabolic dependencies in pancreatic cancer. Front
Oncol. 8:6172018. View Article : Google Scholar : PubMed/NCBI
|
|
46
|
Rijkers AP, Bakker OJ, Ahmed Ali U,
Hagenaars JCJP, van Santvoort HC, Besselink MG, Bollen TL and van
Eijck CH;: Dutch Pancreatitis Study Group: Risk of pancreatic
cancer after a primary episode of acute pancreatitis. Pancreas.
46:1018–1022. 2017. View Article : Google Scholar : PubMed/NCBI
|
|
47
|
Theocharis AD, Skandalis SS, Gialeli C and
Karamanos NK: Extracellular matrix structure. Adv Drug Deliv Rev.
97:4–27. 2016. View Article : Google Scholar : PubMed/NCBI
|
|
48
|
Canobbio I, Balduini C and Torti M:
Signalling through the platelet glycoprotein Ib-V-IX complex. Cell
Signal. 16:1329–1344. 2004. View Article : Google Scholar : PubMed/NCBI
|
|
49
|
Eke I and Cordes N: Focal adhesion
signaling and therapy resistance in cancer. Semin Cancer Biol.
31:65–75. 2015. View Article : Google Scholar : PubMed/NCBI
|
|
50
|
Guo W and Giancotti FG: Integrin
signalling during tumour progression. Nat Rev Mol Cell Biol.
5:816–826. 2004. View Article : Google Scholar : PubMed/NCBI
|
|
51
|
Lee JW and Juliano R: Mitogenic signal
transduction by integrin- and growth factor receptor-mediated
pathways. Mol Cells. 17:188–202. 2004.PubMed/NCBI
|
|
52
|
Engelman JA, Luo J and Cantley LC: The
evolution of phosphatidylinositol 3-kinases as regulators of growth
and metabolism. Nat Rev Genet. 7:606–619. 2006. View Article : Google Scholar : PubMed/NCBI
|
|
53
|
Song G, Ouyang G and Bao S: The activation
of Akt/PKB signaling pathway and cell survival. J Cell Mol Med.
9:59–71. 2005. View Article : Google Scholar : PubMed/NCBI
|
|
54
|
Hers I, Vincent EE and Tavaré JM: Akt
signalling in health and disease. Cell Signal. 23:1515–1527. 2011.
View Article : Google Scholar : PubMed/NCBI
|