Introduction
Breast cancer (BC) is one of the most common
malignancies in women, with ~30% of all BC cases possessing genetic
origins. Hereditary factors involve mutations of numerous genes,
including the genes for breast cancer type 1 susceptibility
protein/breast cancer type 2 susceptibility protein (BRCA1/2),
cellular tumor antigen p53 (p53) and phosphatase and tensin
homolog, and represent a familial aggregation, although a small
proportion of hereditary BCs have no familial origin (1). The most frequent mutations in
hereditary BCs involve the genes coding for BRCA1 and BRCA2
(1), which increase the risk of
familial breast cancer (FBC) by ~16% (2). Patients with FBC can pass these
mutations to their children, who have a significantly increased
risk of developing breast or ovarian cancer (3). However, the role of BRCA1/2 expression
in sporadic breast cancer (SBC) remains unclear.
Fanconi anemia (FA) is a rare autosomal recessive
disease that involves various types of cytopenias, congenital
malformations and neoplastic diseases (4). In the FA pathway, which is mainly
activated through the S phase of the cell cycle, DNA damage repair
is regulated by interactions between a large number of proteins,
including FA group A protein (FANCA), FANCB, FANCC, FANCD1 (also
known as BRCA2), Fanconi anemia group D2 protein (FANCD2), FANCE,
FANCF, FANCG, FANCI, BRCA1 interacting protein C-terminal helicase
1 (FANCJ), E3 ubiquitin-protein ligase FANCL (FANCL), FANCM,
partner and localizer of BRCA2 (FANCN), DNA repair protein RAD51
homolog 3 (FANCO), SLX4 structure-specific endonuclease subunit
(FANCP), DNA repair endonuclease XPF (FANCQ), DNA repair protein
RAD51 homolog 1 (FANCR), FANCS (also known as BRCA1) and
Ubiquitin-conjugating enzyme E2 T (FANCT) (5). When exogenous DNA damage induces
replication blockage, the aborted replication fork activates
nuclear FANCA, FANCB, FANCC, FANCE, FANCF, FANCG, FANCL and FANCM
to form the upstream E3 ubiquitin ligase complex through
phosphorylation modification. This complex is crucial for the
downstream mono-ubiquitination of FANCD2 at Lys561, which
represents the central step in FA pathway activation (6,7). The
FANCD2 gene encodes a 1,451-amino acid protein and comprises 44
exons that are located in 3p25.3, with a mutation probability of
~3% (8,9). Ubiquitinated FANCD2 is considered as
the long-form of FANCD2 (FANCD2-L; 162 kDa) compared with its
non-ubiquitinated version FANCD2-S, which is 155 kDa. FANCD2-S
conversion into FANCD2-L can be activated by DNA cross-linking
agents, ultraviolet radiation and ionizing radiation in a time- and
dose-dependent manner (10). The
final step of ubiquitination involves the aggregation of
ubiquitinated FANCD2 to DNA double-strand breaks, where it
interacts with BRCA1/FANCS, BRCA2/FANCD1, FANCN, FANCJ, FANCP and
other nuclear proteins to repair intra-DNA cross-link damage and
maintain replication fork stability (9–13).
FANCD2 therefore serves a central role in the FA pathway, and its
ubiquitination is a crucial process in DNA damage repair.
BRCA1 is present in and co-colocalizes with the
downstream FA pathway proteins (14). Domchek et al (15) reported that BRCA1 serves a central
role in the FA pathway and that the BRCA1 gene may be involved in
FA development. In this context, these findings suggest that BRCA1
mutation can increase the risk of FBC, although its role in SBC
remains unclear. Further studies are therefore required to
determine the associations and prognostic value of BRCA1 and FANCD2
in FBC and SBC. The present study used immunohistochemistry and
western blotting to detect BRCA1 and FANCD2 expression in FBC and
SBC tissues samples, and aimed to evaluate their association with
the clinical characteristics and prognosis of the patients.
Materials and methods
Patient selection and data
collection
The present study was approved by the Ethics
Committee of The First Affiliated Hospital of China Medical
University (Shenyang, Liaoning, China). All enrolled patients
provide written informed consent prior to the study.
Specimens from 335 patients with BC who underwent
breast surgery between January 2004 and January 2009 at The First
Affiliated Hospital of China Medical University were randomly
selected. All patients had undergone modified radical mastectomy
with no trace of distant metastasis at the diagnosis and received
no neoadjuvant therapy prior to the study. The 335 BC cases
comprised 141 FBC and 147 SBC cases, and 47 control cases of benign
breast tumors. The FBC group included patients who had a
first-degree relative with a history of BC, whereas the SBC group
included patients with no familial history of BC. Clinical
characteristics were retrospectively collected and included age,
pathological type, histological grade, tumor size, lymph node
infiltration, Tumor-Node-Metastasis (TNM) stage (16), estrogen receptor (ER), progesterone
receptor (PR) and human epidermal growth factor receptor 2 (HER2)
status, and Ki-67 index. All patients were followed up clinically
until January 2016, and the disease-free survival (DFS) time was
calculated from the time of surgery to the first occurrence of
relapse, progression or mortality from any cause, or the last
follow-up.
Immunohistochemistry
A standard indirect immunoperoxidase protocol was
used for the immunohistochemical analysis (17). Briefly, at room temperature, the
paraffin-embedded tumor tissue sample were placed in 4%
paraformaldehyde for 3 h and then 4-µm thick sections were
deparaffinized, rehydrated and blocked using 3% hydrogen peroxide
for 15 min. Samples were then incubated at 120°C for 1 min to
expose antigens, and allowed to cool to room temperature. Tissues
were blocked with 1% bovine serum albumin (Reagent A, KIT-9710
UltraSensitive™ SP (Mouse/Rabbit) IHC Kit, MXB Biotechnology) at
room temperature to avoid non-specific binding, and labeled with
the mouse anti-human primary antibodies against BRCA1 (cat. no.
sc-56030; 1:200) and FANCD2 (cat. no. sc-20022; 1:150) (both Santa
Cruz Biotechnology, Inc., Dallas, TX, USA). Sections were incubated
with primary antibodies overnight at 4°C in a humidified chamber.
Sections were then further incubated with the UltraSensitive™ SP
(Mouse/Rabbit) IHC kit (KIT-9710; Fuzhou Maixin Biotech Co., Ltd.,
Fuzhou, China) at room temperature for 10 min and visualized by
staining with 3,30-diaminobenzidine tetrahydrochloride (Fuzhou
Maixin Biotech Co., Ltd) at room temperature for 10 min. Sections
were counterstained with hematoxylin at room temperature for 10
min, dehydrated in 75, 85, 95 and 100% absolute ethanol for 2 min
and covered with coverslips. Positive controls were selected from
previously diagnosed sections at the Department of Pathology, The
First Affiliated Hospital of China Medical University. Sections
that were not stained with primary antibodies represented negative
controls. Two pathologists independently scored each section by
analyzing 10 fields under an optical microscope (magnification,
×200) that contained >200 cells. Nuclear and cytoplasmic
staining for BRCA1 was scored as either negative, or mildly,
moderately or strongly positive for <5, 5–25, 25–50 or >50%
stained cells, respectively (18).
FANCD2 nuclear staining was scored as either negative, or mildy,
moderately or strongly positive for <5, 5–25, 25–50 or >50%
stained cells, respectively (19).
Patients with samples that were mildy, moderately or strongly
stained were assigned to the positive expression group.
Western blotting
Western blotting was used to detect FANCD2
ubiquitination level in 56 randomly selected frozen SBC specimens.
Tumor tissues were frozen in liquid nitrogen and homogenized using
a membrane and cytosol protein extraction kit (cat. no. P0033;
Beyotime Institute of Biotechnology, Haimen, China) to extract
proteins. Tissues were crushed and washed with PBS and lysed in 100
µl lysis buffer (catalog no. 78833; Thermo Fisher Scientific,
Inc.). Cell lysates were centrifuged at room temperature, at 13,500
× g for 5 min. Protein concentration was determined by the BCA
method (catalog no. P0012S; Beyotime Institute of Biotechnology).
Equal amounts of proteins (50 µg) were separated by
SDS-polyacrylamide gel electrophoresis, and transferred onto a
nitrocellulose membrane (Bio-Rad Laboratories, Inc., Hercules, CA,
USA). Membranes were blocked with 5% fat-free milk diluted with
TBST (10 mM Tris-HCl, Ph 7.4, 150 mM NaCl, 0.1% Tween-20) at room
temperature for 1 h and incubated for 1 h with the rabbit
anti-human primary antibodies against FANCD2 (cat. no. sc-28194;
1:1,000) and β-actin (cat. no. sc-47778; 1:3,000) (both Santa Cruz
Biotechnology). Membranes were then incubated with a horseradish
peroxidase-conjugated goat anti-rabbit secondary antibody (1:5,000;
cat. no. A0545; Sigma-Aldrich; Merck KGaG) at room temperature for
1 h. Membranes were washed three times for 5 min, and visualized
using a Pierce enhanced chemiluminescence substrate (Thermo Fisher
Scientific, Inc., Waltham, MA, USA). Gel-pro software (version 6.0;
Media Cybernetics, Inc., Rockville, MD, USA) was used to analyze
the net absorbance values of protein bands and internal reference
bands. FA proteins were visualized as two bands, of which the upper
(L) and lower (S) bands represented the ubiquitinated and
un-ubiquitinated FANCD2, respectively. The L/S ratio indicated the
FANCD2 ubiquitination degree (20,21).
Statistical analysis
All statistical analysis was performed using SPSS
24.0 (IBM Corp., Armonk, NY, USA). P<0.05 was considered to
indicate a statistically significant difference. Patient clinical
characteristics were compared using the χ2 test.
Survival analyses were assessed using the Kaplan-Meier (KM) method
and the two-tailed log-rank test. Univariable and multivariable
analyses were performed using a Cox proportional hazard model to
evaluate the effects of BRCA1 and FANCD2 expression on DFS. Results
were reported as hazard ratios (HRs) and 95% confidence intervals
(CI).
Expression of BRCA1 and FANCD2 based
on The Cancer Genome Atlas (TCGA) dataset
Further analyses of BRCA1 and FANCD2 gene expression
in BC tissues were conducted based on The Cancer Genome Atlas
(TCGA) dataset (https://cancergenome.nih.gov/) (22). In addition, the Gene Expression
Profiling Interactive Analysis (GEPIA) dataset (http://gepia.cancer-pku.cn/) was used to compare BRCA1
and FANCD2 gene expression between BC tissues and their adjacent
non-cancerous tissues (23). GEPIA
data were analyzed using an unpaired Student's t-test. To verify
the associations between BRCA1 and FANCD2 gene expression and
clinical characteristics, data obtained from 1,080 patients with BC
in the TCGA dataset were analyzed using the χ2 test.
Results
Patient clinical characteristics
The 47 women included in the benign tumor group
presented with various types of tumors, including fibroadenoma,
cystic hyperplasia, intraductal papilloma and sclerosing adenosis
(15, 24, 7 and 1 cases, respectively), and had a median age at
diagnosis of 46 years (range, 18–71 years). The remaining 288 women
with primary malignant breast cancer (Table I) were divided into the FBC (n=141)
and SBC (n=147) groups. Patients in the FBC and SBC groups had a
median age at diagnosis of 52 years (range, 31–76 years) and 50
years (range, 25–79 years), respectively. The malignant tumors
included intraductal carcinoma, invasive ductal carcinoma, invasive
lobular carcinoma and other rare types (39, 172, 47 and 30 cases,
respectively). The histological types were predominantly of type I
(FBC, 30.5%; SBC, 21.1%) and type II (FBC, 47.5%; SBC, 53.1%), and
large proportions of the tumors were considered as stage T1
(46.9%), T2 (43.1%) or involving lymphatic invasion (41%).
According to the 2017 American Joint Committee on Cancer criteria
(24), the majority of patients had
stage I (FBC, 43.3%; SBC, 37.4%) or stage II (FBC, 36.2%; SBC,
38.1%) disease. The follow-up ended in January 2016, with a median
follow-up time of 74.4 months (range, 4–155 months). The median DFS
time was 91.8 months, with 1-, 3- and 5-year DFS rates of 97.9,
91.7 and 83.3%, respectively. A total of 24 (8.33%) local
recurrences and 29 (10.08%) distant metastases occurred within 5
years.
 | Table I.Demographic and clinical
characteristics of patients with BC in the FBS (n=141) and SBC
(n=147) groups. |
Table I.
Demographic and clinical
characteristics of patients with BC in the FBS (n=141) and SBC
(n=147) groups.
|
| FBC | SBC |
|
|---|
|
|
|
|
|
|---|
| Patients
characteristics | Value | % | Value | % | Total, n |
|---|
| Age in years |
|
|
|
|
|
| Median (range) | 52 (31–76) |
| 50 (25–79) |
|
|
| <51,
n | 69 | 48.9 | 75 | 51.0 | 144 |
| ≥51,
n | 72 | 51.1 | 72 | 49.0 | 144 |
| Pathological
type |
|
|
|
|
|
| In
situ | 21 | 14.9 | 18 | 12.2 | 39 |
|
Invasive ductal carcinoma | 81 | 57.4 | 91 | 61.9 | 172 |
|
Invasive lobular
carcinoma | 25 | 17.7 | 22 | 15.0 | 47 |
|
Others | 14 | 9.9 | 16 | 10.9 | 30 |
| Histological
grade |
|
|
|
|
|
| I | 43 | 30.5 | 31 | 21.1 | 74 |
| II | 67 | 47.5 | 78 | 53.1 | 145 |
|
III | 31 | 22.0 | 38 | 25.9 | 69 |
| Tumor size |
|
|
|
|
|
| T1 | 63 | 44.7 | 72 | 49.0 | 135 |
| T2 | 61 | 43.3 | 63 | 42.9 | 124 |
| T3 | 16 | 11.3 | 12 | 8.2 | 28 |
| T4 | 1 | 0.7 | 0 | 0.0 | 1 |
| Node
involvement |
|
|
|
|
|
|
Positive | 63 | 44.7 | 56 | 38.1 | 119 |
|
Negative | 78 | 55.3 | 91 | 61.9 | 169 |
| TNM stage |
|
|
|
|
|
| I | 61 | 43.3 | 55 | 37.4 | 116 |
| II | 51 | 36.2 | 56 | 38.1 | 107 |
|
III | 29 | 20.6 | 36 | 24.5 | 65 |
| IV | 0 | 0.0 | 0 | 0.0 | 0 |
| ER status |
|
|
|
|
|
|
Positive | 82 | 58.2 | 80 | 54.4 | 162 |
|
Negative | 59 | 41.8 | 67 | 45.6 | 126 |
| PR status |
|
|
|
|
|
|
Positive | 67 | 47.5 | 78 | 53.1 | 145 |
|
Negative | 74 | 52.5 | 69 | 46.9 | 143 |
| HER2 status |
|
|
|
|
|
|
Positive | 56 | 39.7 | 57 | 38.8 | 113 |
|
Negative | 85 | 60.3 | 90 | 61.2 | 175 |
| Ki-67 |
|
|
|
|
|
|
≥15% | 84 | 59.6 | 88 | 59.9 | 162 |
|
<15% | 57 | 40.4 | 59 | 40.1 | 126 |
Immunohistochemical staining for BRCA1
and FANCD2
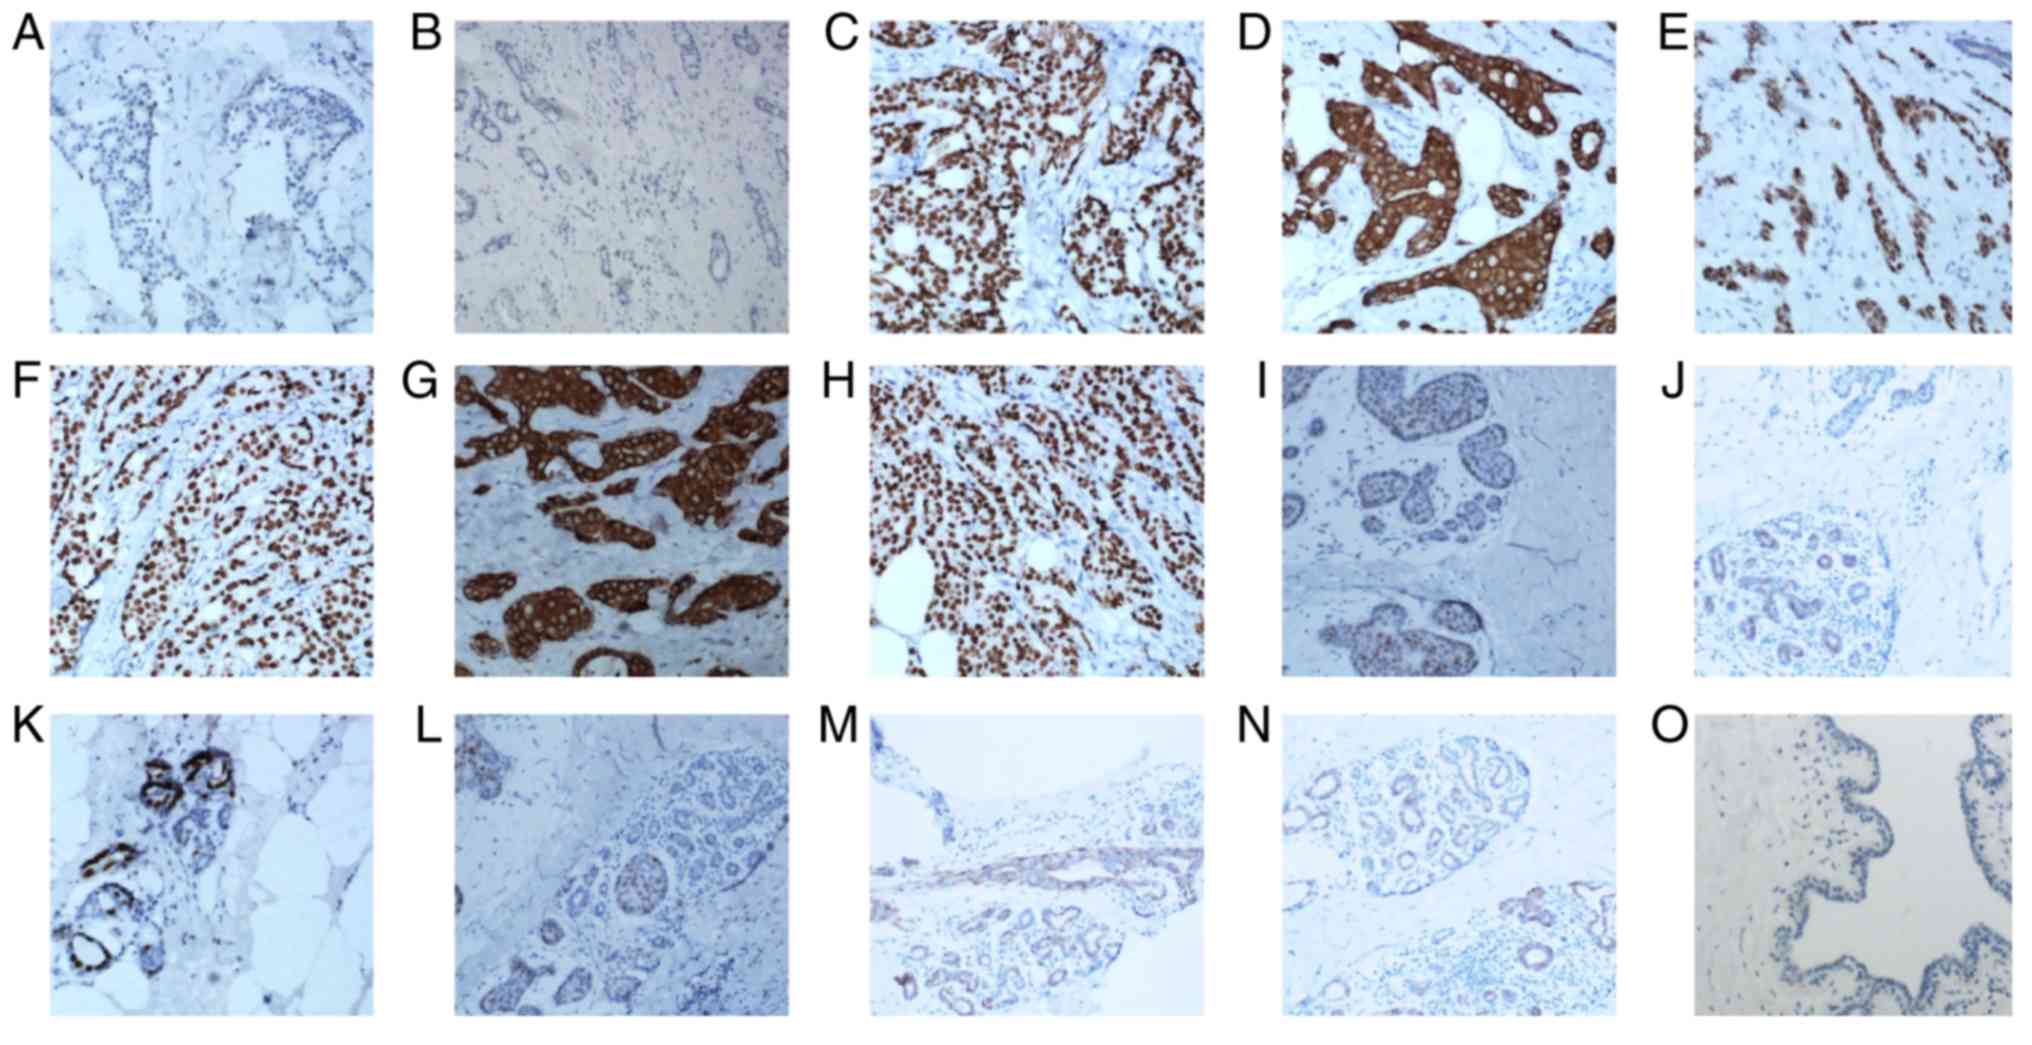
The typical staining for BRCA1 was nuclear and
cytoplasmic in the benign and malignant tissues (Fig. 1). Negative and positive controls were
selected from previously diagnosed sections at the Department of
Pathology, The First Affiliated Hospital of China Medical
University. Positive expression of BRCA1 was associated with a
significantly higher 5-year DFS rate in the FBC group (99/141,
70.2%) compared with the SBC group (21/147, 14.3%; P<0.001). The
typical staining for FANCD2 was predominantly nuclear in the benign
and malignant tissues (Fig. 1D-H).
Positive expression of FANCD2 was associated with a significantly
higher 5-year DFS rate in the FBC group (59/141, 41.8%) compared
with the SBC group (42/147, 28.6%) (P=0.037). Table II presents the clinical
characteristics of the patients and the expression levels of BRCA1
and FANCD2. Expression of BRCA1 in the FBC group was positively
associated with tumor size (P=0.021), lymphatic invasion (P=0.004),
TNM stage (P=0.01), ER status (P=0.014) and FANCD2 expression
(P<0.001). These associations were not observed in the SBC
group. However, FANCD2 expression in SBC group was positively
associated with tumor size (P=0.003), TNM stage (P<0.001), ER
status (P=0.02) and Ki-67 index (P=0.015). The benign tissues were
commonly positive for BRCA1 (29/47, 61.7%) and FANCD2 (21/47,
44.7%). There was no significant association between the expression
of the two proteins (P=0.587). BRCA1 and FANCD2 expression was
predominantly positive in the benign tissues compared with that in
the SBC tissues (BRAC1, 61.7 vs. 14.3%, P<0.001; and FANCD2, 7
vs. 27.9%, P=0.069).
| Table II.Expression of BRCA1 and FANCD2, and
clinical characteristics of patients with BC. |
Table II.
Expression of BRCA1 and FANCD2, and
clinical characteristics of patients with BC.
|
| BRCA1 in FBC
group | FANCD2 in FBC
group | BRCA1 in SBC
group | FANCD2 in SBC
group |
|---|
|
|
|
|
|
|
|---|
| Patients
characteristics | Positive | Negative | P-value | Positive | Negative | P-value | Positive | Negative | P-value | Positive | Negative | P-value |
|---|
| Age, years |
|
|
|
|
|
|
|
|
|
|
|
|
|
>51 | 49 | 23 | 0.567 | 30 | 42 | 0.965 | 9 | 63 | 0.544 | 16 | 56 | 0.133 |
|
≤51 | 50 | 19 |
| 29 | 40 |
| 12 | 63 |
| 25 | 50 |
|
| Histological
grade |
|
|
|
|
|
|
|
|
|
|
|
|
|
I–II | 73 | 37 | 0.08 | 42 | 68 | 0.097 | 14 | 95 | 0.398 | 27 | 82 | 0.153 |
|
III | 26 | 5 |
| 17 | 14 |
| 7 | 31 |
| 14 | 24 |
|
| Tumor size, cm |
|
|
|
|
|
|
|
|
|
|
|
|
|
>2 | 61 | 17 | 0.021 | 34 | 44 | 0.64 | 10 | 65 | 0.736 | 29 | 46 | 0.003 |
| ≤2 | 38 | 25 |
| 25 | 38 |
| 11 | 61 |
| 12 | 60 |
|
| Lymphatic
invasion |
|
|
|
|
|
|
|
|
|
|
|
|
|
Positive | 52 | 11 | 0.004 | 32 | 31 | 0.053 | 11 | 45 | 0.145 | 17 | 39 | 0.601 |
|
Negative | 47 | 31 |
| 27 | 51 |
| 10 | 81 |
| 24 | 67 |
|
| TNM stage |
|
|
|
|
|
|
|
|
|
|
|
|
|
I–II | 73 | 39 | 0.01 | 44 | 68 | 0.226 | 16 | 96 | 0.953 | 22 | 90 | <0.001 |
|
III–IV | 26 | 3 |
| 15 | 14 |
| 5 | 31 |
| 19 | 17 |
|
| ER status |
|
|
|
|
|
|
|
|
|
|
|
|
|
Positive | 51 | 31 | 0.014 | 30 | 52 | 0.136 | 10 | 70 | 0.499 | 16 | 64 | 0.02 |
|
Negative | 48 | 11 |
| 29 | 30 |
| 11 | 56 |
| 25 | 42 |
|
| PR status |
|
|
|
|
|
|
|
|
|
|
|
|
|
Positive | 42 | 25 | 0.063 | 26 | 41 | 0.478 | 13 | 65 | 0.38 | 22 | 56 | 0.928 |
|
Negative | 57 | 17 |
| 33 | 41 |
| 8 | 61 |
| 19 | 50 |
|
| HER2 status |
|
|
|
|
|
|
|
|
|
|
|
|
|
Positive | 44 | 12 | 0.078 | 27 | 29 | 0.213 | 7 | 50 | 0.58 | 17 | 40 | 0.677 |
|
Negative | 55 | 30 |
| 32 | 53 |
| 14 | 76 |
| 24 | 66 |
|
| Ki-67 |
|
|
|
|
|
|
|
|
|
|
|
|
|
≥15% | 60 | 24 | 0.702 | 34 | 50 | 0.689 | 10 | 78 | 0.216 | 31 | 57 | 0.015 |
|
<15% | 39 | 18 |
| 25 | 32 |
| 11 | 48 |
| 10 | 49 |
|
| FANCD2 |
|
|
|
|
|
|
|
|
|
|
|
|
|
Positive | 52 | 7 | <0.001 |
|
|
| 7 | 35 | 0.587 |
|
|
|
|
Negative | 47 | 35 |
|
|
|
| 14 | 92 |
|
|
|
|
Further analysis of BRCA1 and FANCD2
expression in breast cancer based on TCGA data
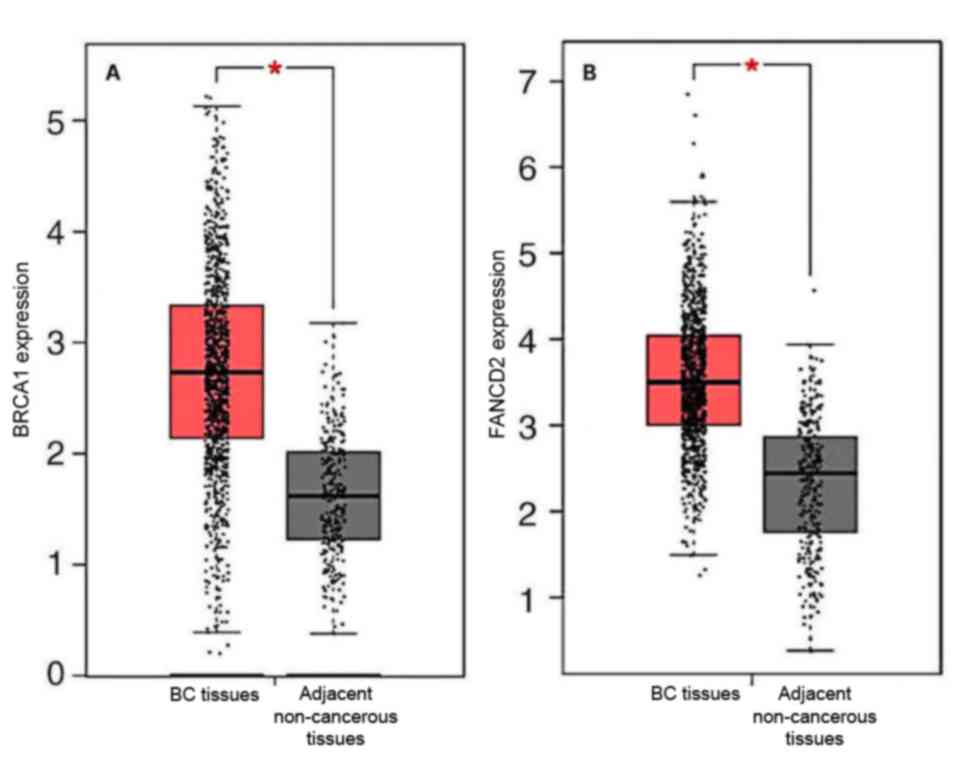
Immunohistochemistry revealed that BRCA1 and FANCD2
were expressed in BC tissues and adjacent tissues. Analysis of the
GEPIA dataset demonstrated that BRCA1 and FANCD2 gene expression in
BC tissues was higher than that in adjacent tissues (Fig. 2). Furthermore, associations between
FANCD2 and BRCA1 gene expression and patient clinical
characteristics were assessed using TCGA dataset. The results
revealed from TCGA dataset were slightly different from the results
of the tissue samples analysis due to variations in the samples
grouping (Table III). BRCA1 and
FANCD2 gene expression in TCGA dataset was positively associated
with tumor size (both P<0.001) and ER expression (both
P<0.001). In addition, BRCA1 and FANCD2 gene expression
demonstrated a positive association. Furthermore, FANCD2 gene
expression in TCGA dataset was positively associated with PR stage
(P<0.001), lymphatic invasion (P=0.017) and TNM stage (P=0.039).
Results from TCGA dataset analysis were consistent with those from
tissues samples analyses.
| Table III.Expression of BRCA1 and FANCD2, and
clinical characteristics of patients with breast cancer obtained
from The Cancer Genome Atlas dataset. |
Table III.
Expression of BRCA1 and FANCD2, and
clinical characteristics of patients with breast cancer obtained
from The Cancer Genome Atlas dataset.
|
| BRCA1 | FANCD2 |
|---|
|
|
|
|
|---|
| Patients
characteristics | High, n | Low, n | P-value | High, n | Low, n | P-value |
|---|
| Age, years
(n=1,078) |
|
|
|
|
|
|
|
>58 | 288 | 275 | 0.428 | 272 | 291 | 0.241 |
|
≤58 | 251 | 264 |
| 267 | 248 |
|
| Tumor size, cm
(n=1,077) |
|
|
|
|
|
|
|
>2 | 389 | 409 | <0.001 | 492 | 306 | <0.001 |
| ≤2 | 98 | 181 |
| 116 | 163 |
|
| Lymphatic invasion
(n=914) |
|
|
|
|
|
|
|
Positive | 234 | 229 | 0.32 | 213 | 250 | 0.017 |
|
Negative | 222 | 229 |
| 243 | 208 |
|
| TNM stage
(n=768) |
|
|
|
|
|
|
|
I–II | 302 | 292 | 0.32 | 309 | 285 | 0.039 |
|
III–IV | 81 | 93 |
| 76 | 100 |
|
| ER (n=1,024) |
|
|
|
|
|
|
|
Positive | 390 | 400 | <0.001 | 346 | 445 | <0.001 |
|
Negative | 48 | 187 |
| 167 | 68 |
|
| PR (n=1,024) |
|
|
|
|
|
|
|
Positive | 340 | 346 | 0.691 | 302 | 384 | <0.001 |
|
Negative | 173 | 167 |
| 211 | 129 |
|
| HER2 (n=611) |
|
|
|
|
|
|
|
Positive | 150 | 134 | 0.158 | 136 | 148 | 0.739 |
|
Negative | 154 | 173 |
| 161 | 166 |
|
| FANCD2
(n=1,080) |
|
|
|
|
|
|
|
Negative | 289 | 253 | 0.031 |
|
|
|
|
Positive | 253 | 288 |
|
|
|
|
Prognostic value of BRCA1 and FANCD2
expression
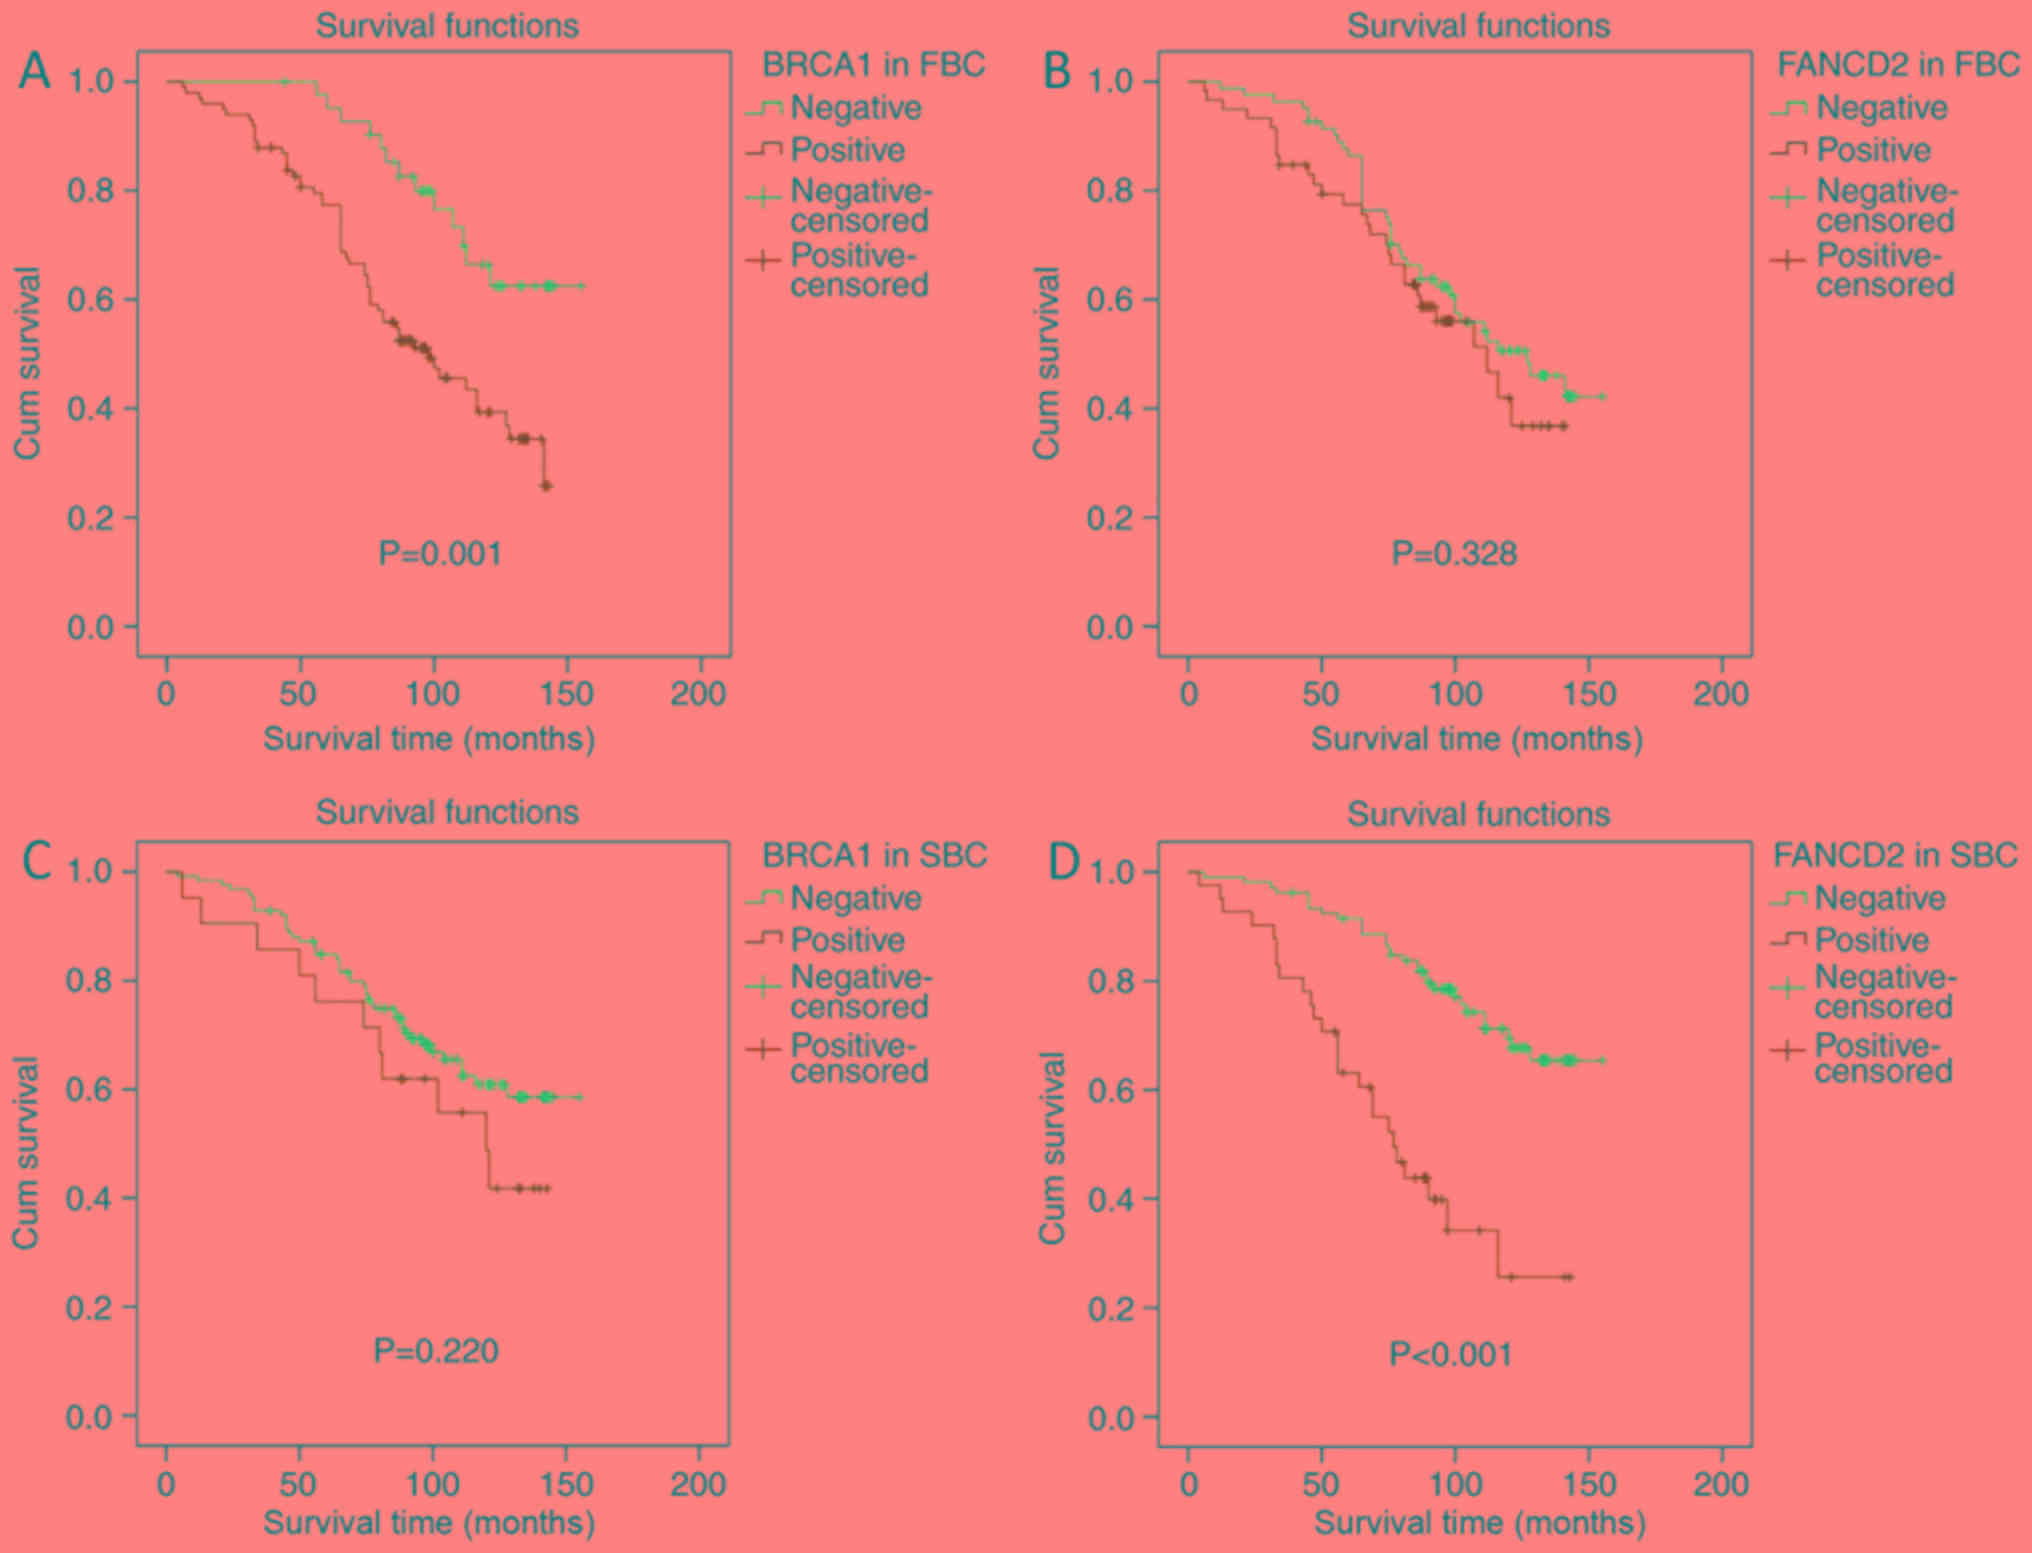
The KM curves were compared according to BRCA1 and
FANCD2 status and grouping. In the FBC group, BRCA1 expression was
associated with a significantly decreased DFS rate when compared
with the absence of BRCA1 expression (P=0.001; Fig. 3A). This observation was associated
with a lower 5-year DFS rate (77.8 vs. 95.2%) and a shorter median
DFS time (81.4 vs. 108.8 months). However, in the FBC group, there
was no significant difference in prognosis whether FANCD2
expression was positive or not (P=0.328; Fig. 3B), although the group with positive
FANCD2 expression had a lower 5-year DFS rate (78 vs. 86.6%) and a
shorter median DFS time (79.7 vs. 96.7 months). In the SBC group,
BRCA1 expression was not associated with a significant difference
in DFS rate (P=0.22; Fig. 3C),
although the group with positive BRCA1 expression had a slightly
lower 5-year DFS rate (76.2 vs. 84.9%) and a shorter median DFS
time (92 vs. 94.3 months). In the SBC group, FANCD2 expression was
associated with significantly decreased DFS rate (P<0.001;
Fig. 3D), with a lower 5-year DFS
rate (63.4 vs. 91.5%) and a shorter median DFS time (69.7 vs. 103.3
months). These results suggested that BRCA1 and FANCD2 expression
may be considered of prognostic value in patients with FBC and SBC,
respectively.
Univariable and multivariable analyses
of DFS rate in patients with BC
Univariable analyses revealed that DFS rate in
patients with FBC was significantly associated with TNM stage
(P=0.001) and BRCA1 expression (P=0.001). DFS rate in patients with
SBC was significantly associated with tumor size (P=0.001),
lymphatic invasion (P=0.004), TNM stage (P<0.001), Ki-67 index
(P=0.025) and FANCD2 expression (P<0.001). Multivariable Cox
proportional hazards model demonstrated that DFS rate in patients
with FBC was independently predicted by TNM stage (III–IV vs. I–II;
HR, 2.042; 95% CI, 1.150–3.624; P=0.015) and BRCA1 expression
(positive vs. negative; HR, 2.168; 95% CI, 1.142–4.113; P=0.018).
In the SBC group, DFS rate was independently predicted by TNM stage
(III–IV vs. I–II; HR, 4.361; 95% CI, 2.465–7.716; P<0.001) and
FANCD2 expression (positive vs. negative; HR, 1.192; 95% CI,
1.041–3.512; P=0.037) (Table
IV).
| Table IV.Univariable and multivariable
analyses of disease-free survival in the two groups of patients
with breast cancer. |
Table IV.
Univariable and multivariable
analyses of disease-free survival in the two groups of patients
with breast cancer.
|
|
| FBC univariable
analysis | FBC multivariable
analysis |
| SBC univariable
analysis | SBC multivariable
analysis |
|---|
|
|
|
|
|
|
|
|
|---|
| Patients
characteristics | Patients
(n=141) | HR (95% CI) | P-value | HR (95% CI) | P-value | Patients
(n=147) | HR (95% CI) | P-value | HRP(95% CI) | P-value |
|---|
| Age, years |
|
|
|
|
|
|
|
|
|
|
|
>51 | 66 | 0.801 | 0.367 |
|
| 63 | 0.952 | 0.859 |
|
|
|
|
| (0.495–1.296) |
|
|
|
| (0.557–1.628) |
|
|
|
|
≤51 | 75 | 1 |
|
|
| 84 | 1 |
|
|
|
| Histological
grade |
|
|
|
|
|
|
|
|
|
|
|
I–II | 110 | 1 | 0.398 |
|
| 109 | 1 | 0.227 |
|
|
|
III | 31 | 1.267 |
|
|
| 38 | 1.424 |
|
|
|
|
|
| (0.732–2.195) |
|
|
|
| (0.802–2.527) |
|
|
|
| Tumor size, cm |
|
|
|
|
|
|
|
|
|
|
|
>2 | 78 | 1.480 | 0.115 | 1.253 | 0.377 | 75 | 2.620 | 0.001 | 1.684 | 0.118 |
|
|
| (0.908–2.411) |
| (0.759–2.069) |
|
| (1.496–4.589) |
| (0.876–3.238) |
|
| ≤2 | 63 | 1 |
| 1 |
| 72 | 1 |
| 1 |
|
| Lymphatic
invasion |
|
|
|
|
|
|
|
|
|
|
|
Positive | 63 | 1.472 | 0.112 | 1.085 | 0.755 | 56 | 2.176 | 0.004 | 1.717 | 0.064 |
|
|
| (0.914–2.372) |
| (0.651–1.807) |
|
| (1.278–3.704) |
| (0.970–3.041) |
|
|
Negative | 78 | 1 |
| 1 |
| 91 | 1 |
| 1 |
|
| TNM stage |
|
|
|
|
|
|
|
|
|
|
|
I–II | 112 | 1 | 0.001 | 1 | 0.015 | 111 | 1 | <0.001 | 1 | <0.001 |
|
III–IV | 29 | 2.461 |
| 2.042 |
| 36 | 5.925 |
| 4.361 |
|
|
|
| (1.454–4.166) |
| (1.150–3.624) |
|
| (3.462–10.141) |
| (2.465–7.716) |
|
| ER status |
|
|
|
|
|
|
|
|
|
|
|
Positive | 82 | 0.634 | 0.146 | 0.672 | 0.11 | 81 | 0.630 | 0.088 | 0.796 | 0.434 |
|
|
| (0.393–1.023) |
| (0.413–1.095) |
|
| (0.37–1.071) |
| (0.449–1.411) |
|
|
Negative | 59 | 1 |
| 1 |
| 66 | 1 |
| 1 |
|
| PR status |
|
|
|
|
|
|
|
|
|
|
|
Positive | 77 | 0.957 | 0.855 |
|
| 78 | 0.836 | 0.506 |
|
|
|
|
| (0.594–1.540) |
|
|
|
| (0.493–1.418) |
|
|
|
|
Negative | 64 | 1 |
|
|
| 69 | 1 |
|
|
|
| HER2 status |
|
|
|
|
|
|
|
|
|
|
|
Positive | 59 | 1.018 | 0.943 |
|
| 57 | 0.898 | 0.701 |
|
|
|
|
| (0.626–1.655) |
|
|
|
| (0.518–1.556) |
|
|
|
|
Negative | 82 | 1 |
|
|
| 90 | 1 |
|
|
|
| Ki-67 |
|
|
|
|
|
|
|
|
|
|
|
≥15% | 84 | 1.469 | 0.127 | 1.384 | 0.204 | 88 | 1.907 | 0.025 | 1.194 | 0.569 |
|
|
| (0.896–2.408) |
| (0.838–2.286) |
|
| (1.086–3.350) |
| (0.648–2.201) |
|
|
<15% | 57 | 1 |
| 1 |
| 59 | 1 |
| 1 |
|
| BRCA1 |
|
|
|
|
|
|
|
|
|
|
|
Positive | 99 | 2.707 | 0.001 | 2.168 | 0.018 | 21 | 1.507 | 0.224 |
|
|
|
|
| (1.472–4.978) |
| (1.142–4.113) |
|
| (0.778–2.918) |
|
|
|
|
Negative | 42 | 1 |
| 1 |
| 126 | 1 |
|
|
|
| FANCD2 |
|
|
|
|
|
|
|
|
|
|
|
Positive | 59 | 1.272 | 0.334 |
|
| 42 | 3.801 | <0.001 | 1.192 | 0.037 |
|
|
| (0.781–2.073) |
|
|
|
|
| (2.201–6.563) | (1.041–3.512) |
|
|
Negative | 82 | 1 |
|
|
| 105 | 1 |
|
|
|
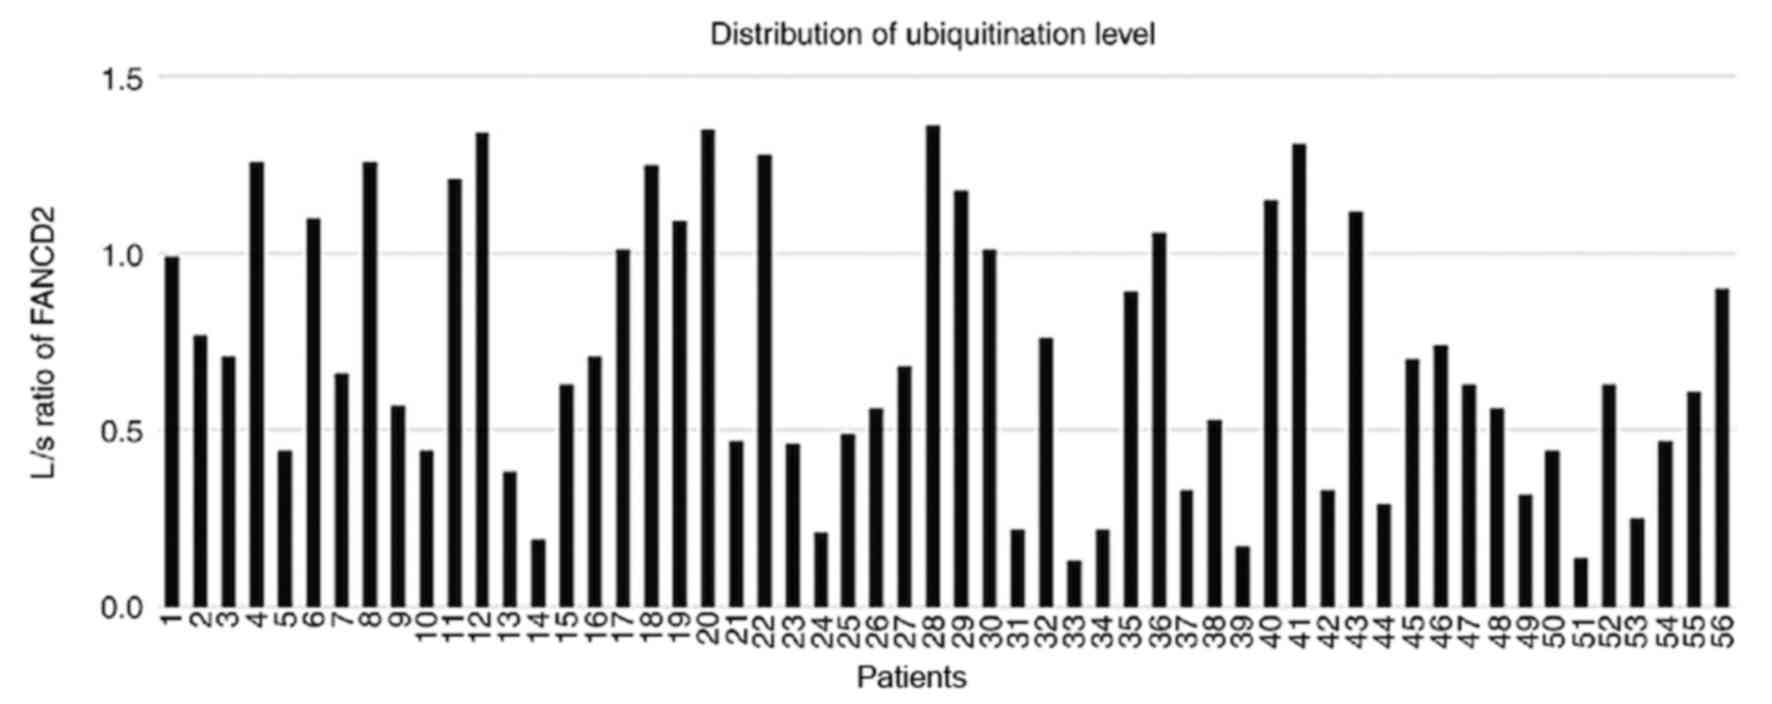
FANCD2 ubiquitination is an
independent prognostic factor for patients with SBC
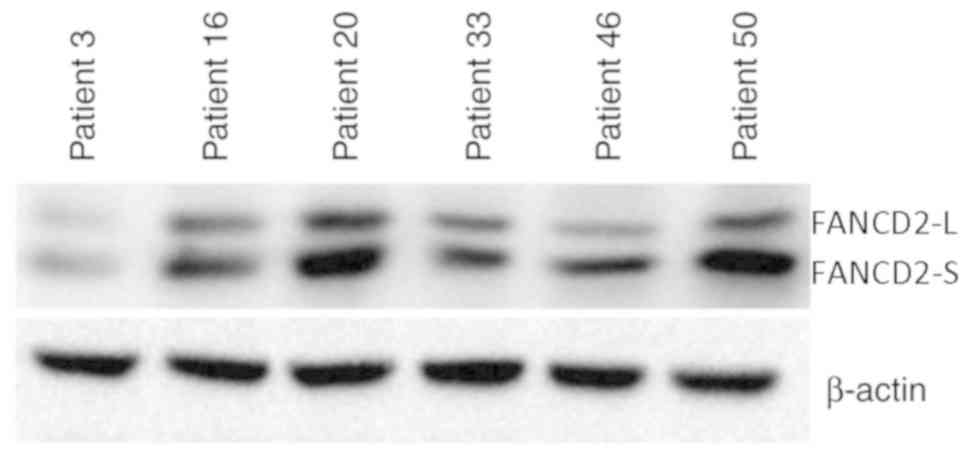
FANCD2 ubiquitination reflects functional activation
of the FA pathway (7,9). Results from the present study
demonstrated that FANCD2 expression was an independent prognostic
factor for SBC. Western blotting of 56 randomly selected SBC
tissues was performed to examine whether FANCD2 ubiquitination was
associated with prognosis. Expression of FANCD2-L and FANCD2-S
(Figs. 4 and S1) was used to calculate the L/S ratio to
quantify FANCD2 ubiquitination. L/S ratios ranged from 0.13 to 1.36
(median, 0.645; Fig. 5). The 56
cases were subsequently divided according to their L/S value into
the ubiquitinationHigh (UbHigh, ≥0.645) group
and the ubiquitinationLow (UbLow, <0.645)
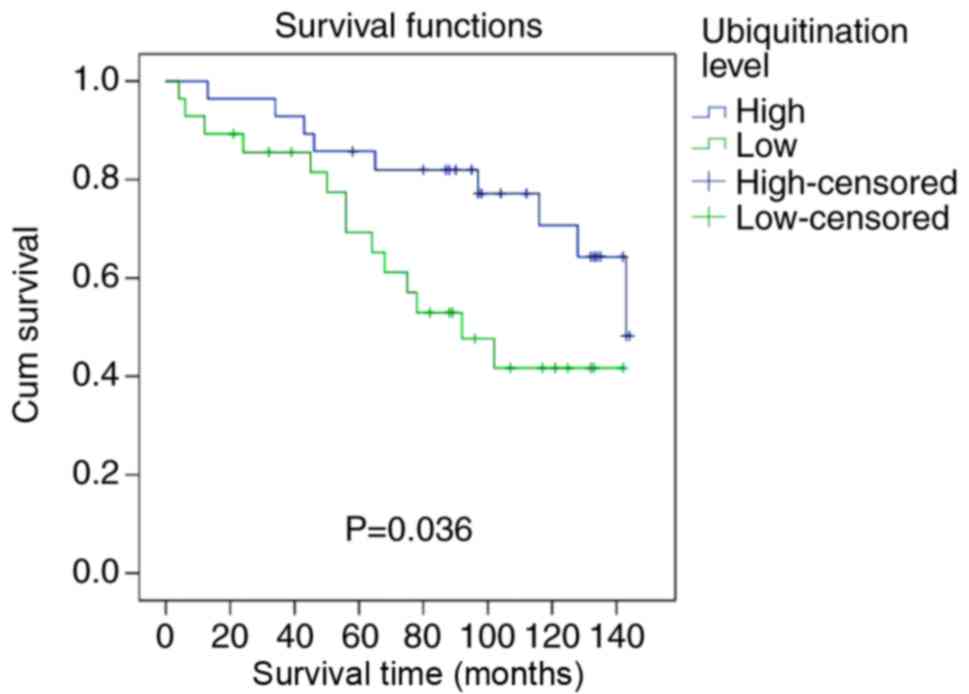
group. Representative western blotting is presented in Figs. 4 and S1. Patients in the UbHigh group
had significantly higher DFS than patients in the UbLow
group (P=0.036; Fig. 6). In the FBC
group, patients with UbHigh had a significantly higher
5-year DFS rate (85.7 vs. 71.4%) and a significantly higher median
DFS time (101.2 vs. 73.4 months) compared with patients with
UbLow. Results from the univariable and multivariable
analyses are presented in Table V.
Univariable analysis revealed that the DFS rate in patients with
SBC was significantly associated with ubiquitination level
(P=0.042). Multivariable analyses revealed that, in addition to TNM
stage (P=0.003) and FANCD2 expression (P=0.006), FANCD2
ubiquitination independently predicted DFS in the SBC group
(UbHigh vs. UbLow; HR, 0.335; 95% CI,
0.128–0.875; P=0.026) (Table V).
| Table V.Univariable and multivariable
analyses of disease-free survival in patients with sporadic breast
cancer (n=141). |
Table V.
Univariable and multivariable
analyses of disease-free survival in patients with sporadic breast
cancer (n=141).
|
|
| Univariable
analysis | Multivariable
analysis |
|---|
|
|
|
|
|
|---|
| Patients
characteristics | n | HR (95% CI) | P-value | HR (95% CI) | P-value |
|---|
| Tumor size, cm |
|
|
|
|
|
|
>2 | 30 | 2.266
(0.956–5.369) | 0.063 | 1.329
(0.459–3.847) | 0.6 |
| ≤2 | 26 | 1 |
| 1 |
|
| Lymphatic
invasion |
|
|
|
|
|
|
Positive | 27 | 2.545
(1.071–6.050) | 0.034 | 2.485
(0.896–6.895) | 0.08 |
|
Negative | 29 | 1 |
| 1 |
|
| TNM stage |
|
|
|
|
|
|
I–II | 39 | 1 | <0.001 | 1 | 0.003 |
|
III–IV | 17 | 6.389
(2.687–15.190) |
| 4.236
(1.658–10.820) |
|
| ER status |
|
|
|
|
|
|
Positive | 31 | 0.700
(0.308–1.594) | 0.396 |
|
|
|
Negative | 25 | 1 |
|
|
|
| Ki-67 status |
|
|
|
|
|
|
≥15% | 41 | 1.946
(0.708–5.348) | 0.197 | 1.705
(0.520–5.584) | 0.378 |
|
<15% | 15 | 1 |
| 1 |
|
| FANCD2 |
|
|
|
|
|
|
Positive | 18 | 3.133
(1.370–7.169) | 0.007 | 3.755
(1.465–9.625) | 0.006 |
|
Negative | 38 | 1 |
| 1 |
|
| Ubiquitination
level |
|
|
|
|
|
|
≥0.645 | 28 | 0.403
(0.167–0.968) | 0.042 | 0.335
(0.128–0.875) | 0.026 |
|
<0.645 | 28 | 1 |
| 1 |
|
Discussion
BC is the most common malignant tumor in women in
developed countries, and 10–30% of cases involve a family history,
which represents a strong risk factor for BC (25). Based on its etiology, BC can be
divided into two groups, SBC and FBC, where FBC involves a direct
family history of BC. Compared with SBC, FBC affects younger women
and is often associated with lymph node metastasis and negative
hormone receptor expression, which leads to a poor prognosis
(26).
Mutations of BRCA1/2 genes increase female
susceptibility to BC and are closely associated with FBC. BRCA1 is
involved in DNA damage repair and cell cycle regulation, and ~45%
of FBC cases comprise BRCA1 mutations. Conversely, SBC is less
frequently associated with gene mutations or deletions, with
BRCA1/2 mutations being relatively rare in SBC (27,28). The
present study used immunohistochemical analysis, which cannot
detect deleterious BRCA1 mutations, however, aids in understanding
tumor cell physiology and confirming BRCA1 protein involvement in
breast tumor cells (29). Previous
studies reported that BRCA1 is less likely to be expressed and
mutated in SBC (30,31). The present study highlighted a
positive association between BRCA1 expression and tumor size in the
FBC group, although this result was not in accordance with previous
findings (31,32). This difference may be due to the
inclusion in the present study of patients with first-degree
relatives who had breast cancer, and/or ethnicity differences. In
addition, BRCA1 expression in the FBC group was associated with
lymphatic invasion and TNM stage, which was consistent with
previous findings (26,27). A negative association was observed
between ER status and BRCA1 expression in the FBC group, as
previously demonstrated by Tazzite et al (26). However, BRCA1 expression was not
associated with these same factors in the SBC group. Previous
studies have reported that BRCA1 expression is upregulated in BC
tissues compared with that in benign breast tissues (33,34),
which was also demonstrated in the present study.
The present study demonstrated that larger tumor
size, lymphatic invasion, higher TNM stage, negative ER expression
and positive BRCA1 expression were associated with poor prognosis
in patients with FBC. Scully and Livingston (35) reported that BRCA1 overexpression
inhibits ER activation and that FBC cases are associated with
negative ER expression. These findings suggest that BRCA1 may exert
its tumor inhibition activity via ER. To test this hypothesis,
univariable and multivariable analyses were performed in the
present study, and results confirmed that BRCA1 expression was an
independent prognostic factor for FBC.
Exogenous and endogenous factors, including ionizing
radiation and chemical exposure, can lead to various types of DNA
damage, although a DNA repair system aids in maintaining the
stability and integrity of the human genome (36). Cross-linking is a common type of DNA
damage that requires a complex repair process that mainly involves
the FA pathway. Ubiquitination of FANCD2 is recognized as an
important activation step in the FA pathway for DNA damage repair.
Lyakhovich and Surralles (37)
reported that inhibition of FANCD2 expression increases tumor cells
sensitivity to mitomycin and γ rays, and that tumor cells with
FANCD2 deletion have a significantly reduced ability to relapse. In
sporadic ovarian cancer, Wysham et al (38) reported a high FANCD2 expression level
in patients with early recurrence, and suggested that high FANCD2
expression is positively associated with early ovarian cancer risk.
The present study revealed that FANCD2 expression was associated
with tumor size, TNM stage and ER expression in the SBC group.
These findings were in agreement with those from the study by van
der Groep et al (39). Hölzel
et al (40) similarly
reported that the highest FANCD2 expression is observed in mature
spermatocytes and fetal oocytes, which rapidly become proliferating
germ cells. In addition, a high Ki-67 index typically reflects
highly proliferative cells and rapid tumor progression (41). Furthermore, FANCD2 and Ki-67
co-localize in BC cells, which suggests that FANCD2 serves a role
in the DNA repair of proliferating cells. Results from the present
study demonstrated the positive association between FANCD2 and
Ki-67 expression in the SBC group (40). Zhang et al (41) reported that BC tissues exhibit a
significantly lower proportion of FANCD2-positive cells compared
with healthy breast tissue; however, the present study did not
demonstrate similar results, which may be due to the low number of
benign cases included.
In the present study, high FANCD2 expression could
independently predict a poor prognosis in the SBC group. These
results were similar to those reported in previous studies
(19,42). We hypothesize that high FANCD2
expression may elevate the risk of early recurrence and distant
metastasis, since it induces increased tolerability of the cancer
cells to chemotherapy and radiotherapy. Radiotherapy and
chemotherapy cause DNA damage that might be stabilized by
upregulated DNA damage repair in tumor cells, which would result in
a relatively poor prognosis (39,40).
Pejovic et al (43) reported
that FANCD2-knockdown in mice stimulates ovarian cancer
development; however, the manner in which FANCD2 affects the
development of breast and ovarian cancer remains unclear.
Monoubiquitination of FANCD2 allows its
translocation to the DNA repair complex through BRCA1 (44). FANCD2 monoubiquitination is therefore
an important step that drives chromatin-associated complex assembly
(45,46) in response to DNA damage (47) during the S-phase of the normal cell
cycle or during replicative stress (48,49). The
present study demonstrated that high FANCD2 expression was
associated with a poor prognosis. The L/S ratio was used to examine
the prognostic value of FANCD2 monoubiquitination status. In
patients with SBC, a low L/S ratio independently predicted a poor
prognosis; however, this ratio had no prognostic value in patients
with FBC.
The FA/BRCA pathway involves two of the most
important BC susceptibility genes, which encode BRCA1 and
FANCD1/BRCA2 (50). BRCA1
participates in the repair process with FANCD2. In the present
study, a positive association was found between FANCD2 and BRCA1
expression in patients with FBC. Kais et al (51) reported that BRCA1-deficient cells
upregulate FANCD2 expression, which is crucial for cell survival
and the maintenance of genomic stability, whereas FANCD2
downregulation inhibits BRCA1-deficient cells survival. Lyakhovich
and Surralles (37) revealed that
FANCD2 gene expression is strongly associated with the repopulation
ability of cancer cells, and that FANCD2 depletion in these cells
decreases their recurrence ability. Li et al (52) suggested that increasing the
specificity of the mitoxantrone cytotoxic agent may locally target
the tumors and the BRCA1/2 network to induce the cellular
sensitivity of tumors with homologous recombination deficiencies.
Taniguchi et al reported that mutations of FA-related genes
(FANCA, FANCC, FANCD2, FANCE, FANCF and FANCG) without BRCA1
mutations are rare among patients with SBC and their family members
(53). In addition, the present
study demonstrated that lower FANCD2 ubiquitination level and poor
prognosis of patients with SBC may be due to the suppressed
conversion of FANCD2-S into FANCD2-L, which may be associated with
abnormal function of the E3 ubiquitination ligase complex. Wu et
al (54) reported that the
product of BRCA1 expression has E3 ubiquitin ligase activity and
catalyzes the ubiquitination of various substrate proteins (e.g.,
FANCD2, NPM and RNAPII). BRAC1 therefore aids in the regulation of
cell life processes and is closely associated with tumor occurrence
and development.
The main limitation to the present study was that
only the association between patient clinical characteristics and
BC prognosis was analyzed. The specific mechanisms of the BRCA1 and
FANCD2 genes with regard to prognosis, and the reasons behind the
differences in their expression in FBC and SBC were not
investigated. Additional experiments using breast cancer cells and
animal model are required in future investigations.
In conclusion, the present study revealed that high
BRCA1 expression was associated with a poor prognosis in patients
with FBC. In addition, high FANCD2 expression and low FANCD2
ubiquitination were associated with a poor prognosis in patients
with SBC. These results suggested that BRCA1 and FANCD2 expression
and FANCD2 ubiquitination status may be considered as crucial
markers that may assist in conducting pathogenesis research and
risk assessment, forming an early diagnosis and developing gene
therapy. Targeting the FA/BRCA pathway may represent a novel
therapeutic option, which could improve the prognosis of patients
with BC.
Supplementary Material
Supporting Data
Acknowledgements
Not applicable.
Funding
This study was partially supported by the Natural
Science Foundation of Liaoning Province, P.R. China (grant no.
81773163) and the Liaoning Province Doctoral Research Startup Fund
(grant no. 20170520404).
Availability of data and materials
The datasets used and/or analyzed during the present
study are available from the corresponding author on reasonable
request.
Authors' contributions
LF and FJ drafted the manuscript. LF assisted with
immunohistochemistry and western blot analysis. FJ contributed to
statistical analysis. All authors have read and approved the final
manuscript.
Ethics approval and consent to
participate
The present study was approved by the Ethics
Committee of The First Affiliated Hospital of China Medical
University, Shenyang, China (no. 2016-109-2). All patients enrolled
in the present study signed informed consent.
Patient consent for publication
Not applicable.
Competing interests
The authors declare that they have no competing
interests.
References
|
1
|
Wendt C, Lindblom A, Arver B, von
Wachenfeldt A and Margolin S: Tumour spectrum in non-brca
hereditary breast cancer families in sweden. Hered Cancer Clin
Pract. 13:152015. View Article : Google Scholar : PubMed/NCBI
|
|
2
|
Stratton MR and Rahman N: The emerging
landscape of breast cancer susceptibility. Nat Genet. 40:17–22.
2008. View Article : Google Scholar : PubMed/NCBI
|
|
3
|
Rebbeck TR, Mitra N, Wan F, Sinilnikova
OM, Healey S, McGuffog L, Mazoyer S, Chenevix-Trench G, Easton DF,
Antoniou AC, et al: Association of type and location of BRCA1 and
BRCA2 mutations with risk of breast and ovarian cancer. JAMA.
313:1347–1361. 2015. View Article : Google Scholar : PubMed/NCBI
|
|
4
|
Bhattacharjee S and Nandi S: DNA damage
response and cancer therapeutics through the lens of the Fanconi
Anemia DNA repair pathway. Cell Commun Signal. 15:412017.
View Article : Google Scholar : PubMed/NCBI
|
|
5
|
Dong H, Nebert DW, Bruford EA, Thompson
DC, Joenje H and Vasiliou V: Update of the human and mouse Fanconi
anemia genes. Hum Genomics. 9:322015. View Article : Google Scholar : PubMed/NCBI
|
|
6
|
Garcia-Higuera I, Taniguchi T, Ganesan S,
Meyn MS, Timmers C, Hejna J, Grompe M and D'Andrea AD: Interaction
of the Fanconi anemia proteins and BRCA1 in a common pathway. Mol
Cell. 7:249–262. 2001. View Article : Google Scholar : PubMed/NCBI
|
|
7
|
Smogorzewska A, Matsuoka S, Vinciguerra P,
McDonald ER III, Hurov KE, Luo J, Ballif BA, Gygi SP, Hofmann K,
D'Andrea AD and Elledge SJ: Identification of the FANCI protein, a
monoubiquitinated FANCD2 paralog required for DNA repair. Cell.
129:289–301. 2007. View Article : Google Scholar : PubMed/NCBI
|
|
8
|
Kee Y and D'Andrea AD: Molecular
pathogenesis and clinical management of Fanconi anemia. J Clin
Invest. 122:3799–3806. 2012. View
Article : Google Scholar : PubMed/NCBI
|
|
9
|
Timmers C, Taniguchi T, Hejna J, Reifsteck
C, Lucas L, Bruun D, Thayer M, Cox B, Olson S, D'Andrea AD, et al:
Positional cloning of a novel Fanconi anemia gene, FANCD2. Mol
Cell. 7:241–248. 2001. View Article : Google Scholar : PubMed/NCBI
|
|
10
|
Zhu J, Su F, Mukherjee S, Mori E, Hu B and
Asaithamby A: FANCD2 influences replication fork processes and
genome stability in response to clustered DSBs. Cell Cycle.
14:1809–1822. 2015. View Article : Google Scholar : PubMed/NCBI
|
|
11
|
Crossan GP and Patel KJ: The Fanconi
anaemia pathway orchestrates incisions at sites of crosslinked DNA.
J Pathol. 226:326–337. 2012. View Article : Google Scholar : PubMed/NCBI
|
|
12
|
Bunting SF and Nussenzweig A: Dangerous
liaisons: Fanconi anemia and toxic nonhomologous end joining in DNA
crosslink repair. Mol Cell. 39:164–166. 2010. View Article : Google Scholar : PubMed/NCBI
|
|
13
|
Schlacher K, Wu H and Jasin M: A distinct
replication fork protection pathway connects Fanconi anemia tumor
suppressors to RAD51-BRCA1/2. Cancer Cell. 22:106–116. 2012.
View Article : Google Scholar : PubMed/NCBI
|
|
14
|
Ali AM, Pradhan A, Singh TR, Du C, Li J,
Wahengbam K, Grassman E, Auerbach AD, Pang Q and Meetei AR: FAAP20:
A novel ubiquitin-binding FA nuclear core-complex protein required
for functional integrity of the FA-BRCA DNA repair pathway. Blood.
119:3285–3294. 2012. View Article : Google Scholar : PubMed/NCBI
|
|
15
|
Domchek SM, Tang J, Stopfer J, Lilli DR,
Hamel N, Tischkowitz M, Monteiro AN, Messick TE, Powers J, Yonker
A, et al: Biallelic deleterious BRCA1 mutations in a woman with
early-onset ovarian cancer. Cancer Discov. 3:399–405. 2013.
View Article : Google Scholar : PubMed/NCBI
|
|
16
|
Gradishar WJ, Anderson BO, Balassanian R,
Blair SL, Burstein HJ, Cyr A, Elias AD, Farrar WB, Forero A,
Giordano SH, et al: NCCN guidelines insights: Breast cancer,
version 1.2017. J Natl Compr Canc Netw. 15:433–451. 2017.
View Article : Google Scholar : PubMed/NCBI
|
|
17
|
Wen T, Wang Z, Li Y, Che X, Fan Y, Wang S,
Qu J, Yang X, Hou K, Zhou W, et al: A four-factor immunoscore
system that predicts clinical outcome for stage II/III gastric
cancer. Cancer Immunol Res. 5:524–534. 2017. View Article : Google Scholar : PubMed/NCBI
|
|
18
|
Madjd Z, Karimi A, Molanae S and
Asadi-Lari M: BRCA1 protein expression level and CD44(+)phenotype
in breast cancer patients. Cell J. 13:155–162. 2011.PubMed/NCBI
|
|
19
|
Rudland PS, Platt-Higgins AM, Davies LM,
de Silva Rudland S, Wilson JB, Aladwani A, Winstanley JH,
Barraclough DL, Barraclough R, West CR and Jones NJ: Significance
of the Fanconi anemia FANCD2 protein in sporadic and metastatic
human breast cancer. Am J Pathol. 176:2935–2947. 2010. View Article : Google Scholar : PubMed/NCBI
|
|
20
|
Ling C, Ishiai M, Ali AM, Medhurst AL,
Neveling K, Kalb R, Yan Z, Xue Y, Oostra AB, Auerbach AD, et al:
FAAP100 is essential for activation of the Fanconi
anemia-associated DNA damage response pathway. EMBO J.
26:2104–2114. 2007. View Article : Google Scholar : PubMed/NCBI
|
|
21
|
Virts EL, Jankowska A, Mackay C, Glaas MF,
Wiek C, Kelich SL, Lottmann N, Kennedy FM, Marchal C, Lehnert E, et
al: AluY-mediated germline deletion, duplication and somatic stem
cell reversion in UBE2T defines a new subtype of Fanconi anemia.
Hum Mol Genet. 24:5093–5108. 2015. View Article : Google Scholar : PubMed/NCBI
|
|
22
|
Huang Z, Duan H and Li H: Identification
of gene expression pattern related to breast cancer survival using
integrated TCGA datasets and genomic tools. Biomed Res Int.
2015:8785462015. View Article : Google Scholar : PubMed/NCBI
|
|
23
|
Tang Z, Li C, Kang B, Gao G, Li C and
Zhang Z: GEPIA: A web server for cancer and normal gene expression
profiling and interactive analyses. Nucleic Acids Res. 45:W98–W102.
2017. View Article : Google Scholar : PubMed/NCBI
|
|
24
|
Chavez-MacGregor M, Mittendorf EA, Clarke
CA, Lichtensztajn DY, Hunt KK and Giordano SH: Incorporating tumor
characteristics to the American Joint Committee on cancer breast
cancer staging system. Oncologist. 22:1292–1300. 2017. View Article : Google Scholar : PubMed/NCBI
|
|
25
|
Collaborative Group on Hormonal Factors in
Breast Cancer, . Familial breast cancer: Collaborative reanalysis
of individual data from 52 epidemiological studies including 58209
women with breast cancer and 101986 women without the disease.
Lancet. 358:1389–1399. 2001. View Article : Google Scholar : PubMed/NCBI
|
|
26
|
Tazzite A, Jouhadi H, Saiss K, Benider A
and Nadifi S: Relationship between family history of breast cancer
and clinicopathological features in Moroccan patients. Ethiop J
Health Sci. 23:150–157. 2013.PubMed/NCBI
|
|
27
|
Aleskandarany M, Caracappa D, Nolan CC,
Macmillan RD, Ellis IO, Rakha EA and Green AR: DNA damage response
markers are differentially expressed in BRCA-mutated breast
cancers. Breast Cancer Res Treat. 150:81–90. 2015. View Article : Google Scholar : PubMed/NCBI
|
|
28
|
Troudi W, Uhrhammer N, Ben Romdhane K,
Sibille C, Mahfoudh W, Chouchane L, Ben Ayed F, Bignon YJ and Ben
Ammar Elgaaied A: Immunolocalization of BRCA1 protein in tumor
breast tissue: Prescreening of BRCA1 mutation in Tunisian patients
with hereditary breast cancer? Eur J Histochem. 51:219–226.
2007.PubMed/NCBI
|
|
29
|
Sun X, Gong Y, Rao MS and Badve S: Loss of
BRCA1 expression in sporadic male breast carcinoma. Breast Cancer
Res Treat. 71:1–7. 2002. View Article : Google Scholar : PubMed/NCBI
|
|
30
|
Kenemans P, Verstraeten RA and Verheijen
RH: Oncogenic pathways in hereditary and sporadic breast cancer.
Maturitas. 49:141–150. 2008. View Article : Google Scholar
|
|
31
|
Russo A, Herd-Smith A, Gestri D, Bianchi
S, Vezzosi V, Rosselli Del Turco M and Cardona G: Does family
history influence survival in breast cancer cases? Int J Cancer.
99:427–430. 2002. View Article : Google Scholar : PubMed/NCBI
|
|
32
|
Tsuchiya A, Kanno M, Nomizu T, Hatakeyama
Y, Kimijima I and Abe R: Clinical characteristics of breast cancer
patients with family history. Fukushima J Med Sci. 44:35–41.
1998.PubMed/NCBI
|
|
33
|
Esteller M, Silva JM, Dominguez G, Bonilla
F, Matias-Guiu X, Lerma E, Bussaglia E, Prat J, Harkes IC, Repasky
EA, et al: Promoter hypermethylation and BRCA1 inactivation in
sporadic breast and ovarian tumors. J Natl Cancer Inst. 92:564–569.
2000. View Article : Google Scholar : PubMed/NCBI
|
|
34
|
Walsh T, Casadei S, Coats KH, Swisher E,
Stray SM, Higgins J, Roach KC, Mandell J, Lee MK, Ciernikova S, et
al: Spectrum of mutations in BRCA1, BRCA2, CHEK2, and TP53 in
families at high risk of breast cancer. JAMA. 295:1379–1388. 2006.
View Article : Google Scholar : PubMed/NCBI
|
|
35
|
Scully R and Livingston DM: In search of
the tumour-suppressor functions of BRCA1 and BRCA2. Nature.
408:429–432. 2000. View Article : Google Scholar : PubMed/NCBI
|
|
36
|
Sakaguchi C, Morishita T, Shinagawa H and
Hishida T: Essential and distinct roles of the F-box and helicase
domains of Fbh1 in DNA damage repair. BMC Mol Biol. 9:272008.
View Article : Google Scholar : PubMed/NCBI
|
|
37
|
Lyakhovich A and Surralles J: FANCD2
depletion sensitizes cancer cells repopulation ability in vitro.
Cancer Lett. 256:186–195. 2007. View Article : Google Scholar : PubMed/NCBI
|
|
38
|
Wysham WZ, Mhawech-Fauceglia P, Li H, Hays
L, Syriac S, Skrepnik T, Wright J, Pande N, Hoatlin M and Pejovic
T: BRCAness profile of sporadic ovarian cancer predicts disease
recurrence. PLoS One. 7:e300422012. View Article : Google Scholar : PubMed/NCBI
|
|
39
|
van der Groep P, Hoelzel M, Buerger H,
Joenje H, de Winter JP and van Diest PJ: Loss of expression of
FANCD2 protein in sporadic and hereditary breast cancer. Breast
Cancer Res Treat. 107:41–47. 2008. View Article : Google Scholar
|
|
40
|
Hölzel M, van Diest PJ, Bier P, Wallisch
M, Hoatlin ME, Joenje H and de Winter JP: FANCD2 protein is
expressed in proliferating cells of human tissues that are cancer
prone in Fanconi anaemia. J Pathol. 201:198–203. 2003. View Article : Google Scholar : PubMed/NCBI
|
|
41
|
Zhang B, Chen R, Lu J, Shi Q, Zhang X and
Chen J: Expression of FANCD2 in sporadic breast cancer and
clinicopathological analysis. J Huazhong Univ Sci Technolog Med
Sci. 30:322–325. 2010. View Article : Google Scholar : PubMed/NCBI
|
|
42
|
Fagerholm R, Sprott K, Heikkinen T,
Bartkova J, Heikkilä P, Aittomäki K, Bartek J, Weaver D, Blomqvist
C and Nevanlinna H: Overabundant FANCD2, alone and combined with
NQO1, is a sensitive marker of adverse prognosis in breast cancer.
Ann Oncol. 24:2780–2785. 2013. View Article : Google Scholar : PubMed/NCBI
|
|
43
|
Pejovic T, Yates JE, Liu HY, Hays LE,
Akkari Y, Torimaru Y, Keeble W, Rathbun RK, Rodgers WH, Bale AE, et
al: Cytogenetic instability in ovarian epithelial cells from women
at risk of ovarian cancer. Cancer Res. 66:9017–9025. 2006.
View Article : Google Scholar : PubMed/NCBI
|
|
44
|
Vandenberg CJ, Gergely F, Ong CY, Pace P,
Mallery DL, Hiom K and Patel KJ: BRCA1-independent ubiquitination
of FANCD2. Mol Cell. 12:247–254. 2003. View Article : Google Scholar : PubMed/NCBI
|
|
45
|
Montes de Oca R, Andreassen PR, Margossian
SP, Gregory RC, Taniguchi T, Wang X, Houghtaling S, Grompe M and
D'Andrea AD: Regulated interaction of the Fanconi anemia protein,
FANCD2, with chromatin. Blood. 105:1003–1009. 2005. View Article : Google Scholar : PubMed/NCBI
|
|
46
|
Park WH, Margossian S, Horwitz AA, Simons
AM, D'Andrea AD and Parvin JD: Direct DNA binding activity of the
Fanconi anemia D2 protein. J Biol Chem. 280:23593–23598. 2005.
View Article : Google Scholar : PubMed/NCBI
|
|
47
|
Hussain S, Wilson JB, Medhurst AL, Hejna
J, Witt E, Ananth S, Davies A, Masson JY, Moses R, West SC, et al:
Direct interaction of FANCD2 with BRCA2 in DNA damage response
pathways. Hum Mol Genet. 13:1241–1248. 2004. View Article : Google Scholar : PubMed/NCBI
|
|
48
|
Taniguchi T, Garcia-Higuera I, Andreassen
PR, Gregory RC, Grompe M and D'Andrea AD: S-phase-specific
interaction of the Fanconi anemia protein, FANCD2, with BRCA1 and
RAD51. Blood. 100:2414–2420. 2002. View Article : Google Scholar : PubMed/NCBI
|
|
49
|
Rothfuss A and Grompe M: Repair kinetics
of genomic interstrand DNA cross-links: Evidence for DNA
double-strand break-dependent activation of the Fanconi anemia/BRCA
pathway. Mol Cell Biol. 24:123–134. 2004. View Article : Google Scholar : PubMed/NCBI
|
|
50
|
Wang W: Emergence of a DNA-damage response
network consisting of Fanconi anaemia and BRCA proteins. Nat Rev
Genet. 8:735–748. 2007. View Article : Google Scholar : PubMed/NCBI
|
|
51
|
Kais Z, Rondinelli B, Holmes A, O'Leary C,
Kozono D, D'Andrea AD and Ceccaldi R: FANCD2 maintains fork
stability in BRCA1/2-deficient tumors and promotes alternative
end-joining DNA repair. Cell Rep. 15:2488–2499. 2016. View Article : Google Scholar : PubMed/NCBI
|
|
52
|
Li Y, Zhao L, Sun H, Yu J, Li N, Liang J,
Wang Y, He M, Bai X, Yu Z, et al: Gene silencing of FANCF
potentiates the sensitivity to mitoxantrone through activation of
JNK and p38 signal pathways in breast cancer cells. PLoS One.
7:e442542012. View Article : Google Scholar : PubMed/NCBI
|
|
53
|
Barroso E, Milne RL, Fernández LP, Zamora
P, Arias JI, Benítez J and Ribas G: FANCD2 associated with sporadic
breast cancer risk. Carcinogenesis. 27:1930–1937. 2006. View Article : Google Scholar : PubMed/NCBI
|
|
54
|
Wu W, Koike A, Takeshita T and Ohta T: The
ubiquitin E3 ligase activity of BRCA1 and its biological functions.
Cell Div. 3:12008. View Article : Google Scholar : PubMed/NCBI
|