Introduction
Pituitary adenomas are one of the most common types
of intracranial tumor after meningiomas and gliomas, and they
account for 15% of all intracranial tumor cases (1). The adenomas are also the most common
tumors in the sellar regions of the brain and can be classified as
macroadenoma or microadenoma on the basis of their size.
Microadenomas account for 60–80% of cases of pituitary adenomas
(2,3). Numerous subtypes of microadenomas exist
that secrete different hormones, including prolactin,
adrenocorticotropic hormones and growth hormones (4). The correct clinical diagnosis of
microadenoma and subtype is crucial.
Contrast-enhanced magnetic resonance imaging
(CE-MRI) provides richer information on lesion structure and
function than conventional MRI. CE-MRI has considerably improved
the accuracy of pituitary adenoma diagnosis (5,6).
However, the qualitative analysis of CE-MRI images is dependent on
scanning devices and protocol parameters. This dependence may
weaken repeatability, thus precluding comparisons among multicenter
and large-scale studies. Therefore, the recognition and evaluation
of pituitary adenomas through dynamic CE-MRI (DCE-MRI) may
encounter several difficulties (7).
The quantitative analysis of DCE-MRI images is based
on functional MRI and requires the use of specific pharmacokinetic
models to evaluate the microvascular density and permeability of
tumor lesions (8,9). The present study aimed to diagnose
pituitary microadenomas and distinguish microadenoma subtypes on
the basis of pharmacokinetic parameters derived from DCE-MRI
images. Analysis of variance (ANOVA) tests were employed in the
identification of pharmacokinetic parameters. Receiver-operator
characteristic (ROC) curves were also used to assess the diagnostic
efficiency and optimal cut-off value. The method described in the
present study could lead to the development of a clinical
microadenoma diagnostic test.
Materials and methods
Patients
The present study was approved by the Institutional
Review Board of The First Affiliated Hospital of Wannan Medical
College (Wuhu, Anhui, China). Written consent was obtained prior to
MRI examination. The present study involved 76 patients (58 female
and 18 male; age range, 14–61 years; mean age, 41.3±12.5 years)
with pituitary microadenomas. Of these 76 cases, 38 patients had
prolactin (PRL)-producing tumors, 17 patients had
adrenocorticotropic hormone (ACTH) adenoma and 21 patients had
somatotropinoma, characterized by excess growth hormone (GH)
production. The diagnoses of all the patients were confirmed on the
basis of pathology and follow-up outcomes. The diagnoses of 40
patients were confirmed following surgical treatment. The remaining
36 patients were diagnosed on the basis of clinical manifestation
and hormone level, as well as through diagnostic treatments and
other comprehensive approaches. A total of 20 normal controls (15
female and 5 male; age range, 21–60 years; mean age, 44.9±13.3
years) were also recruited for this study.
All patients with suspected pituitary microadenoma
were followed up prior to and following MRI scans. Tumor
characteristics and secretion types were determined through a
combination of clinical examination and pathological results of
therapy or surgery.
MRI examination
A GE Signa HDxt 3.0T MR Scanner with HD8 channel for
skull-phased array coils was used in the present study (GE
Healthcare Life Sciences, Shanghai, China). Patients were scanned
in the supine position. The sagittal view of the sellar region was
scanned using the fast spin echo T1-weighted imaging (FSE
T1WI) method with the following parameters: Repetition
time/echo time/number of excitations (TR/TE/NEX), 4; 40 msec/20
msec/2; thickness, 2.5 mm; layer spacing, 0.5 mm; field of view
(FOV), 20×20 cm; matrix, 320×224; and echo train length (ETL), 5.
The coronal view of the sellar region was scanned using the FSE
T1WI method with the following parameters: TR/TE/NEX,
500 msec/20 msec/2; thickness, 2.0 mm; layer spacing, 0.5 mm; FOV,
22×22 cm; matrix, 320×92; and ETL, 8. The sellar region was then
scanned using the FSE T2WI method in coronal view with
the following parameters: TR/TE/NEX, 2,000 msec/125 msec/2;
thickness, 2.0 mm; layer spacing, 0.5 mm; FOV, 22×22 cm; matrix,
320×256; and ETL, 8. A total of 10 scanning slices were obtained.
The scanning plane was parallel to the pituitary stalk in the
sagittal view and was perpendicular to the major axis of the
hypophysis in the coronal view.
For DCE-MRI scanning, Omniscan (gadodiamide; GE
Healthcare Life Sciences, Chicago, IL, USA) was intravenously
injected using a high-pressure injector. The T1WI
conventional CE-MRI scan was simultaneously conducted in sagittal
and coronal views under the same settings as aforementioned.
Conventional CE-MRI was conducted following DCE-MRI scans. DCE-MRI
scans were obtained in the coronal view with T1WI
3-dimensional spoiled gradient recalled acquisition in steady state
series. Multi-flip angle protocols with flip angles of 3, 6, 9, 12
and 15° were first applied for T1 mapping. The DCE-MRI protocol was
as follows: TR/TE/NEX, 5.9 msec/1.0 msec/1; thickness, 2.5 mm;
layer spacing, 0 mm; FOV, 22×22 cm; matrix, 320×256; and time
resolution, 8 sec. The central frequency was kept constant through
auto pre-scan. The contrast agent (0.1 mmol/kg) was injected at the
rate of 2 ml/sec into the elbow venous following three phase scans,
and then flushed with physiological saline solution (20 ml) at the
same rate. The scan was triggered by the injection. Dynamic
scanning was performed with the same parameters of the multi-flip
angle protocol at 12°. A total of 40 phases were obtained.
Image postprocessing and analysis
DCE-MRI examination was completed by 2 radiology
specialists with 14 and 10 years of experience, respectively, using
visual observation routine scan, conventional enhanced and dynamic
enhanced imaging. Other clinical examination results were used for
the independent auxiliary analysis of MR images by the 2 experts,
although they were blinded to the clinical symptoms of the
patients, experimental standards and other imaging results.
Disagreements between the reviewers were resolved through
consensus.
All DCE-MRI images were processed by the
pharmacokinetics software Omni-Kinetics (version 1; GE Healthcare
Life Sciences). Arterial input function (AIF) was placed at the
center of the sinus with a size of ~10 mm2. A
two-compartment extended Tofts linear model was used to calculate
tumor permeability parameters, including volume transfer constant
(Ktrans), rate constant (Kep) and
extracellular extravascular volume fraction (Ve). The 3
most representative regions of interest of solid lesions with sizes
of 20–50 mm2 were selected on MRI images, and the mean
value of the 3 regions of interest was exported as the final
result.
Statistical analysis
All data were processed and analyzed with SPSS
software (version 19.0, IBM Corp., Armonk, NY, USA). Measurements
are expressed as the mean ± standard deviation. An ANOVA was
conducted to identify the significance of differences between
normal controls and patients with microadenoma. An ANOVA was also
conducted to identify differences among microadenoma subtypes.
Pairwise comparisons were then performed using the
Student-Newman-Keuls algorithm. Enumeration data was analyzed by
χ2 test. ROC curves were obtained for the calculation of
the area under the curve (AUC), sensitivity and specificity.
P<0.05 was considered to indicate a statistically significant
difference. The max Youden index was employed to determine the
sensitivity, specificity and optimal cut-off points
Results
Patient population
The present study involved 20 normal controls and 76
patients with pituitary microadenoma (Table I). In general, pituitary tumors were
more prevalent among women compared with men. The prevalence of
pituitary tumors was not associated with age distribution. The
results of χ2 testing demonstrated that the sexes and
ages of the patient and control groups were not significantly
different. Moreover, secretion types did not significantly differ
between the groups.
 | Table I.Patient information. |
Table I.
Patient information.
|
|
| Sex, n |
|
|---|
|
|
|
|
|
|---|
| Group | Cases, n | Female | Male | Age range,
years |
|---|
| Normal
pituitary | 20 | 15 | 5 | 21–60 |
| Microadenoma | 76 | 58 | 18 | 14–61 |
| PRL tumor | 38 | 30 | 8 | 25–57 |
| ACTH tumor | 17 | 12 | 5 | 28–61 |
| GH tumor | 21 | 16 | 5 | 14–53 |
| χ2
testing |
| P>0.05 |
| P>0.05 |
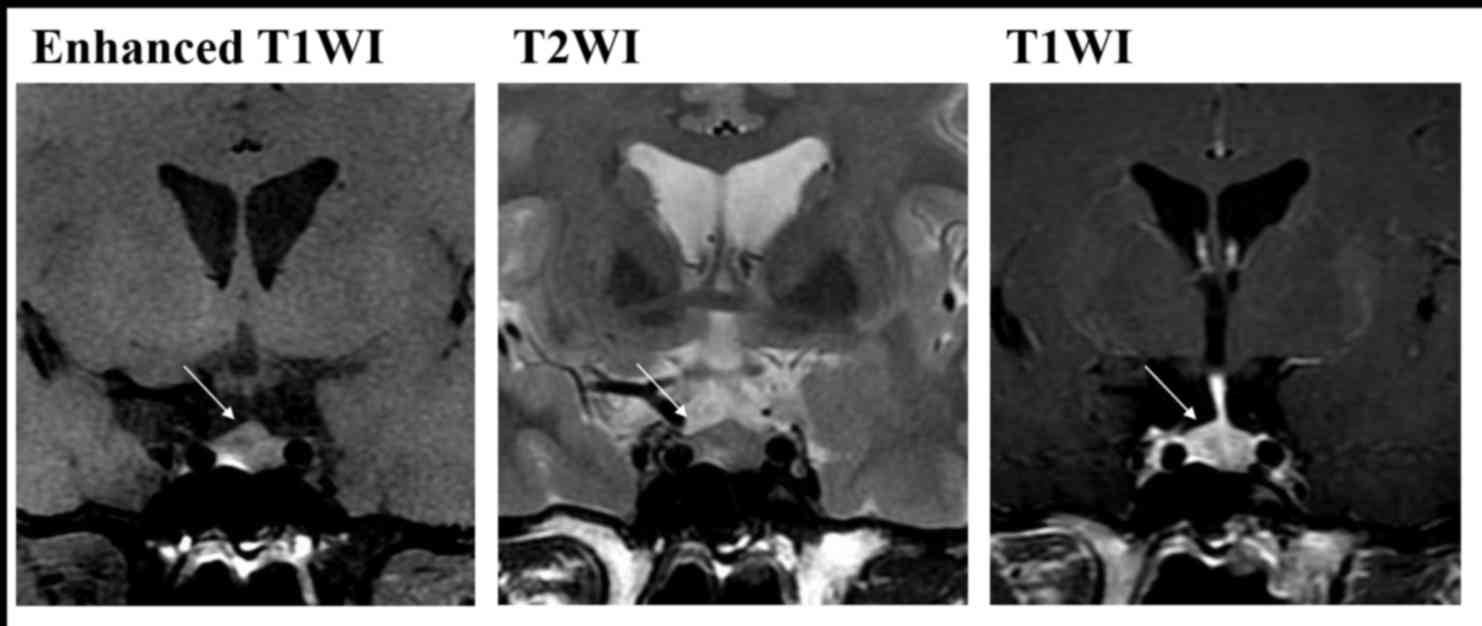
Conventional MRI combined with DCE-MRI
and image observation
All 76 patients with solitary pituitary
microadenomas underwent conventional MRI and DCE-MRI (Fig. 1). Routine MRI easily diagnosed 30 out
of 76 patients with pituitary microadenoma, with lesion sizes of
3–10 mm. A total of 17 cases exhibited weak T1WI
signals, 10 cases had strong signals and 3 cases showed equal
T1WI signals. By contrast, 19 cases exhibited equal or
strong T2WI signals, and the remaining 11 cases had
equal or weak signals. Other patients were diagnosed through the
comprehensive analysis of MR images.
Comparing the comprehensive evaluations of
microadenoma and normal pituitary tissues revealed that the
sensitivity and specificity of microadenoma diagnosis were 80.3%
(61/76 patients) and 100%, respectively (Table II).
| Table II.Diagnosis by conventional MRI. |
Table II.
Diagnosis by conventional MRI.
|
| Gold standard,
n |
|
|---|
|
|
|
|
|---|
| MRI conventional
methods | With
microadenoma | Without
microadenoma | Total, n |
|---|
| With
microadenoma | 61 | 0 | 61 |
| Without
microadenoma | 15 | 20 | 35 |
| Total | 76 | 20 | 96 |
Quantitative analysis
Comparison between normal and
pituitary microadenomas
Pharmacokinetic parameters derived from DCE-MRI
demonstrated that the Ktrans and Kep of
normal pituitary tissues were significantly higher compared with
those of the microadenomas (P<0.05). However, the normal and
disease groups did not exhibit significantly different
Ve (Table III).
| Table III.Comparison of quantitative parameters
between the patient group and control group. |
Table III.
Comparison of quantitative parameters
between the patient group and control group.
| Group | Cases, n |
Ktrans/min |
Kep/min | Ve |
|---|
| Controls | 20 | 0.902±0.238 | 1.208±0.599 | 0.928±0.378 |
| Patients | 76 | 0.472±0.292 | 0.765±0.359 | 0.792±0.345 |
| t |
| 6.07 | 3.16 | 1.55 |
| P-value |
| <0.05 | <0.05 | >0.05 |
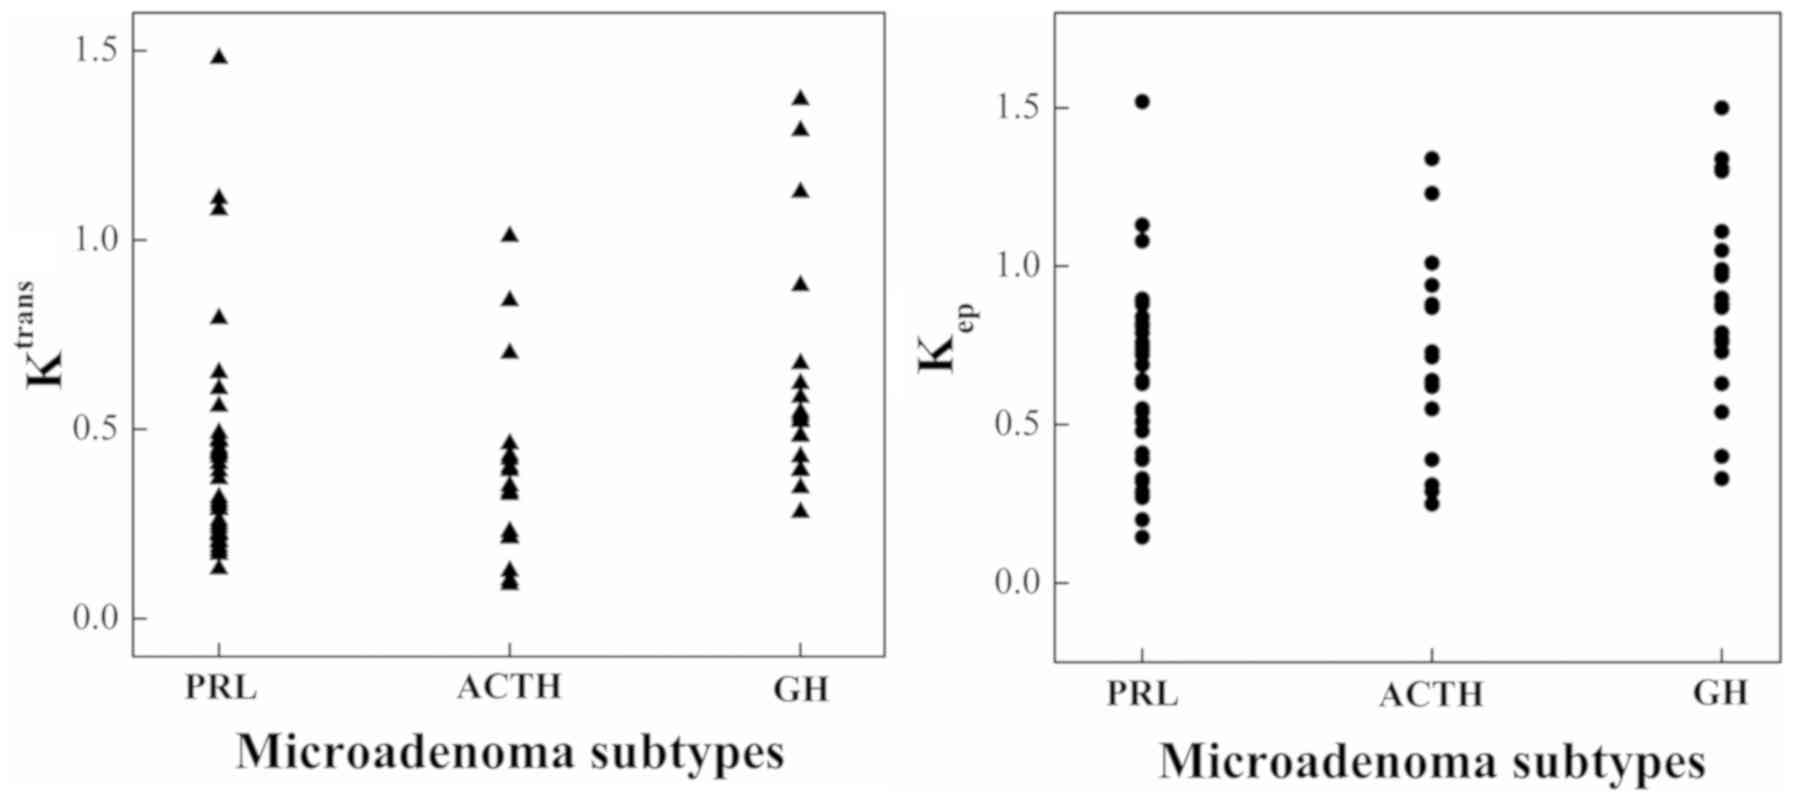
Comparison among different pituitary
microadenoma subtypes
Comparisons among different pituitary microadenoma
subtypes provided different results. The Ktrans values
of the GH tumors were significantly higher compared with those of
the PRL and ACTH tumors (P<0.05). The Ktrans values
of the ACTH and PRL tumors were not significantly different. The
Kep values of the GH tumors were higher compared with
those of the PRL and ACTH tumors (P<0.05). The results are
provided in Table IV and Fig. 2. However, the Kep values
of ACTH tumors and PRL tumors were not significantly different. The
Ve values of the three groups did not significantly
differ.
| Table IV.Comparison of quantitative parameters
between microadenoma subtypes. |
Table IV.
Comparison of quantitative parameters
between microadenoma subtypes.
| Group | Cases, n |
Ktrans/min |
Kep/min | Ve |
|---|
| PRL tumor | 38 | 0.428±0.282 | 0.675±0.316 | 0.772±0.310 |
| ACTH tumor | 17 | 0.391±0.252 | 0.713±0.312 | 0.689±0.297 |
| GH tumor | 21 | 0.617±0.299 | 0.968±0.398 | 0.911±0.415 |
| F |
| 3.988 | 5.270 | 2.168 |
| P-value |
| 0.023 | 0.007 | 0.097 |
Summary of comparisons
Fig. 3 shows a normal
pituitary gland. In Fig. 3, the blue
color indicates the lowest blood perfusion and permeability, the
yellow color indicates a higher perfusion and permeability, and the
red indicates the highest blood perfusion and permeability. A
relatively higher perfusion and permeability was observed in the
gland compared with that in the surrounding issues.
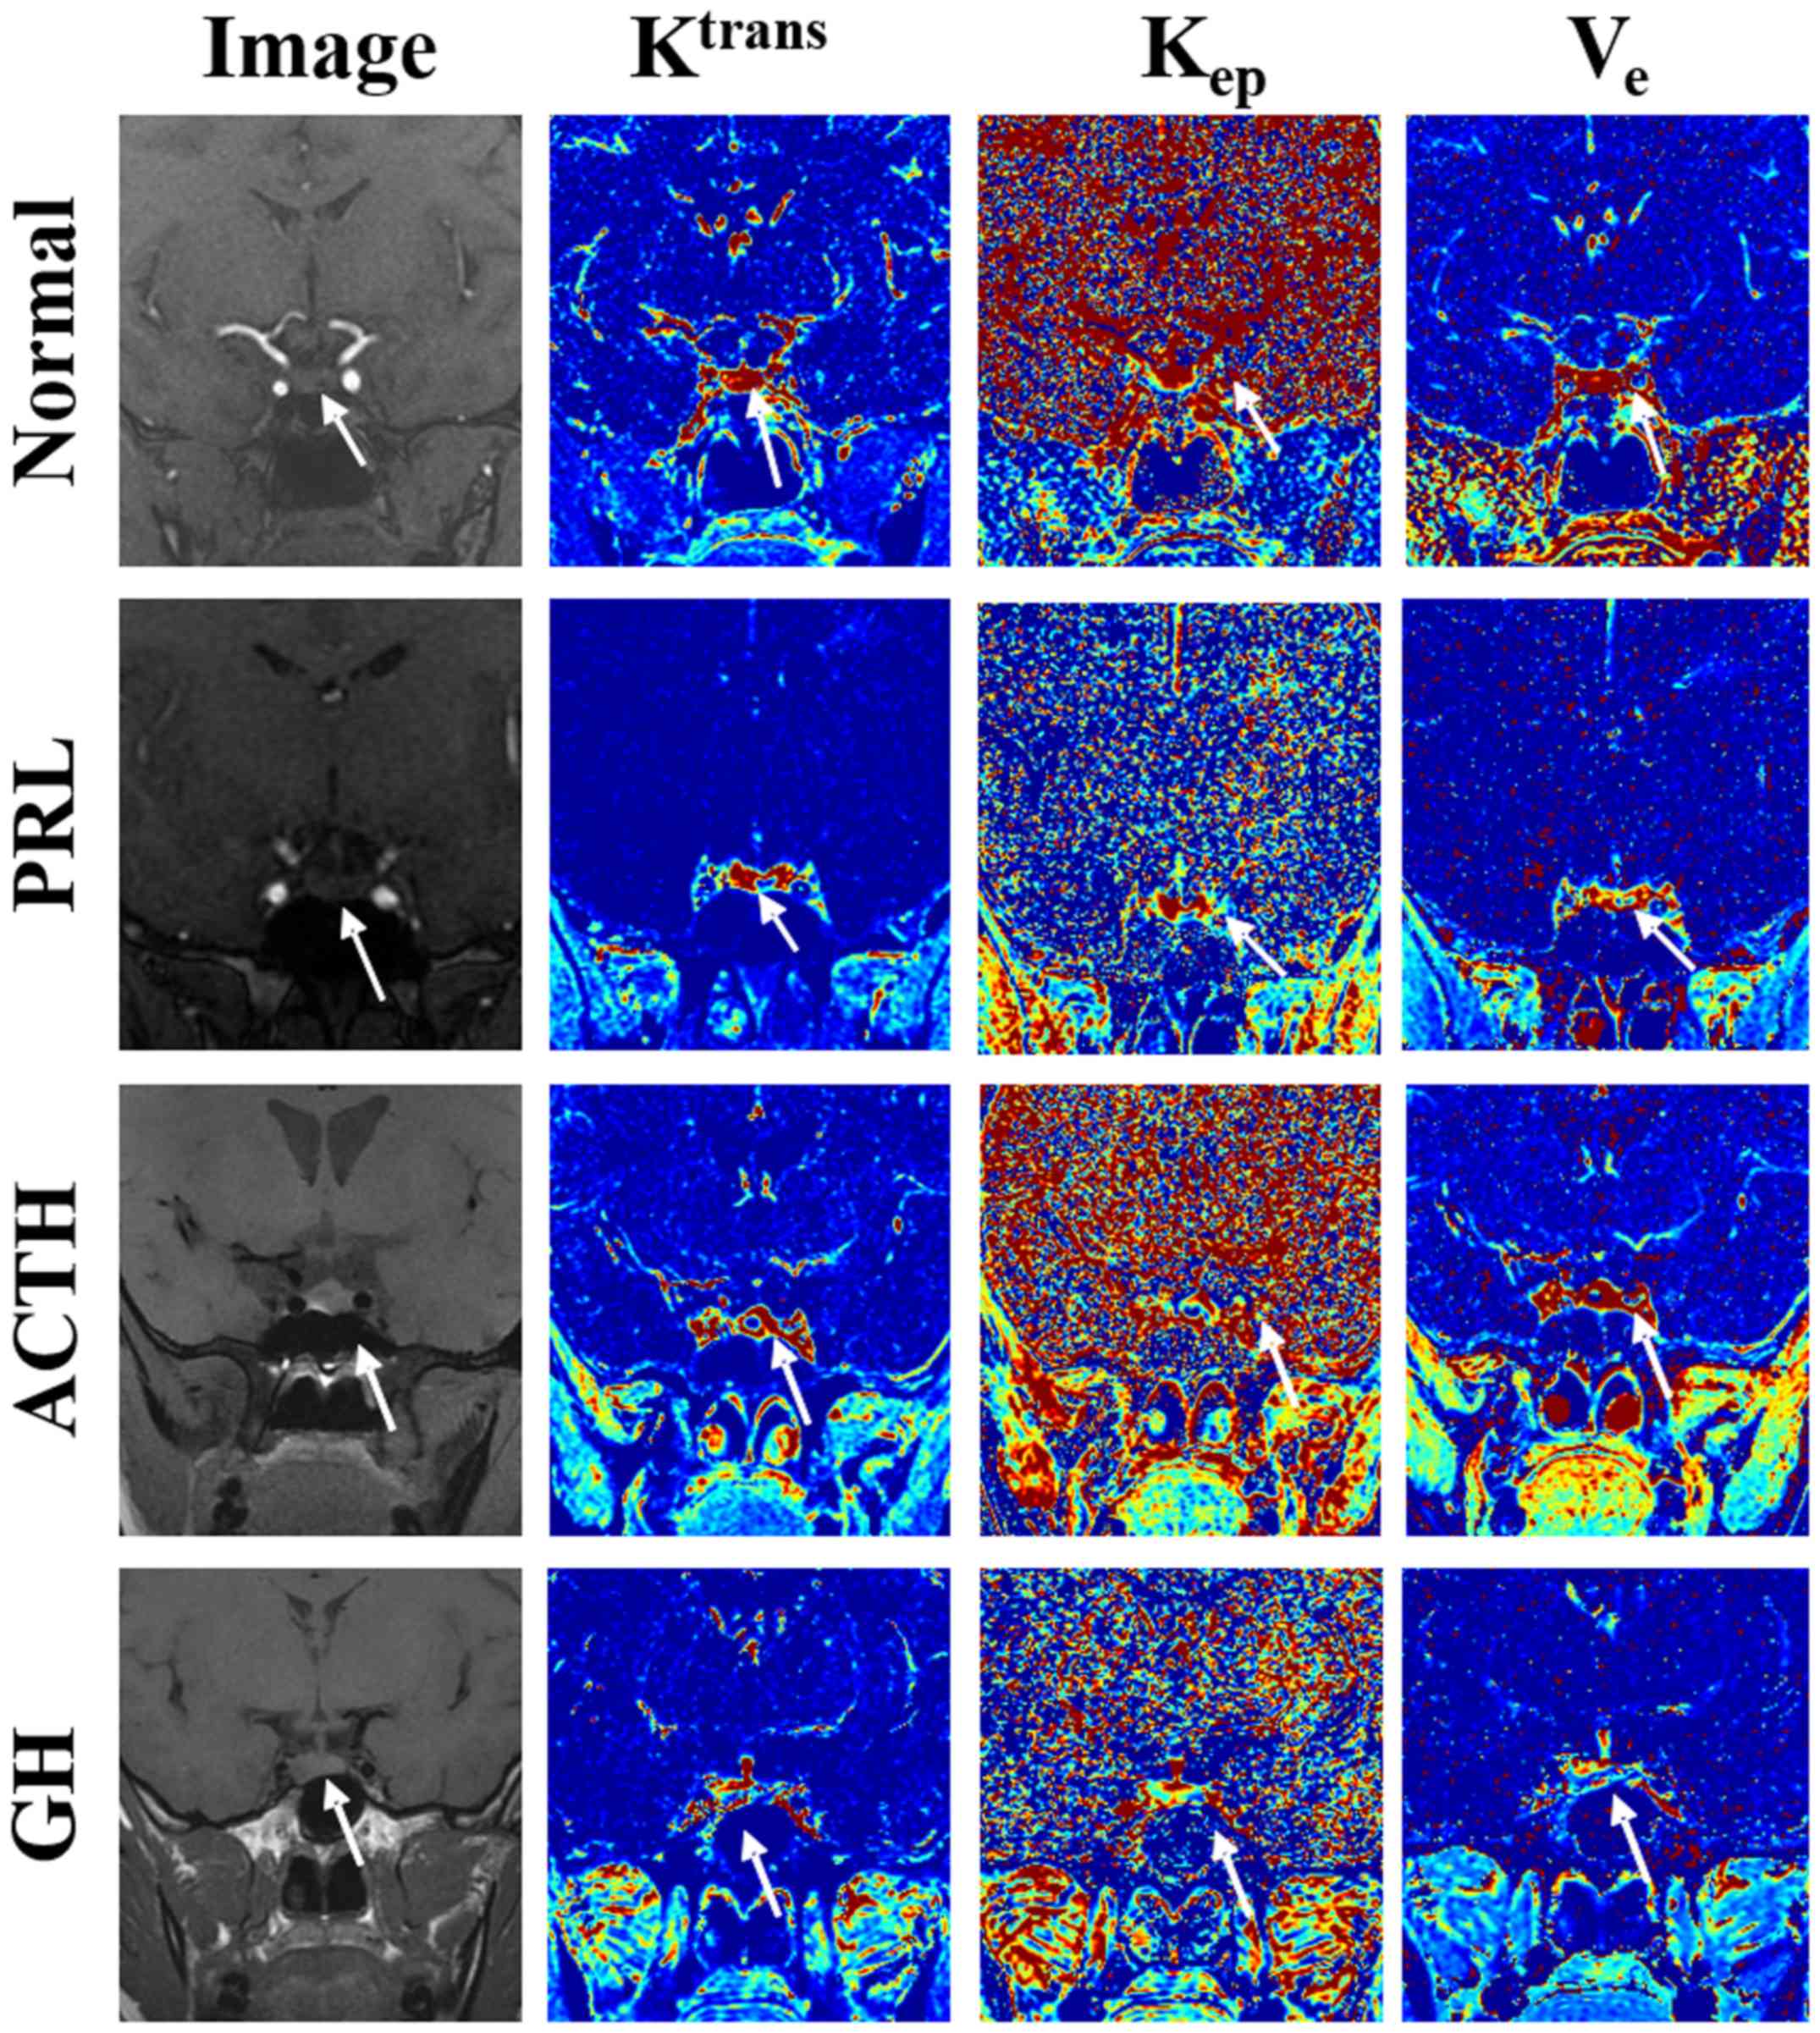 | Figure 3.Original setting plans and the color
maps of the Ktrans, Kep, and Ve of
normal tissue, PRL tumor, ACTH tumor and GH tumor are represented.
Ktrans, volume transfer constant; Kep, rate
constant; Ve, extracellular extravascular volume
fraction; PRL, prolactin; ACTH, adrenocorticotropic hormone; GH,
growth hormone. |
The PRL tumor shown in Fig. 3 was located at the bottom-left of the
adenohypophysis. Regions colored blue in the color maps of
Ktrans and Kep (low value) indicate areas
that were affected by microadenoma, and red regions represent
normal pituitary tissue on the opposite side (high value). The
Ve map shows mixed colors. The Ktrans,
Kep and Ve values of the lesion area were
0.422/min, 0.689/min and 0.741, respectively.
The ACTH tumor was located in the center of the
adenohypophysis. Fig. 3 shows the
Ktrans, Kep and Ve of the lesion
area. Blue regions in the color maps of Ktrans,
Kep and Ve represent areas that were affected
by microadenomas. The Ktrans, Kep and
Ve values were 0.387/min, 0.689/min and 0.677,
respectively.
The GH tumor was located at the bottom-right of the
adenohypophysis. Fig. 3 shows the
Ktrans, Kep and Ve of the lesion
area. Blue regions in the color maps of Ktrans,
Kep and Ve indicate microadenoma-affected
areas and provide values of 0.603/min, 0.959/min and 0.906,
respectively.
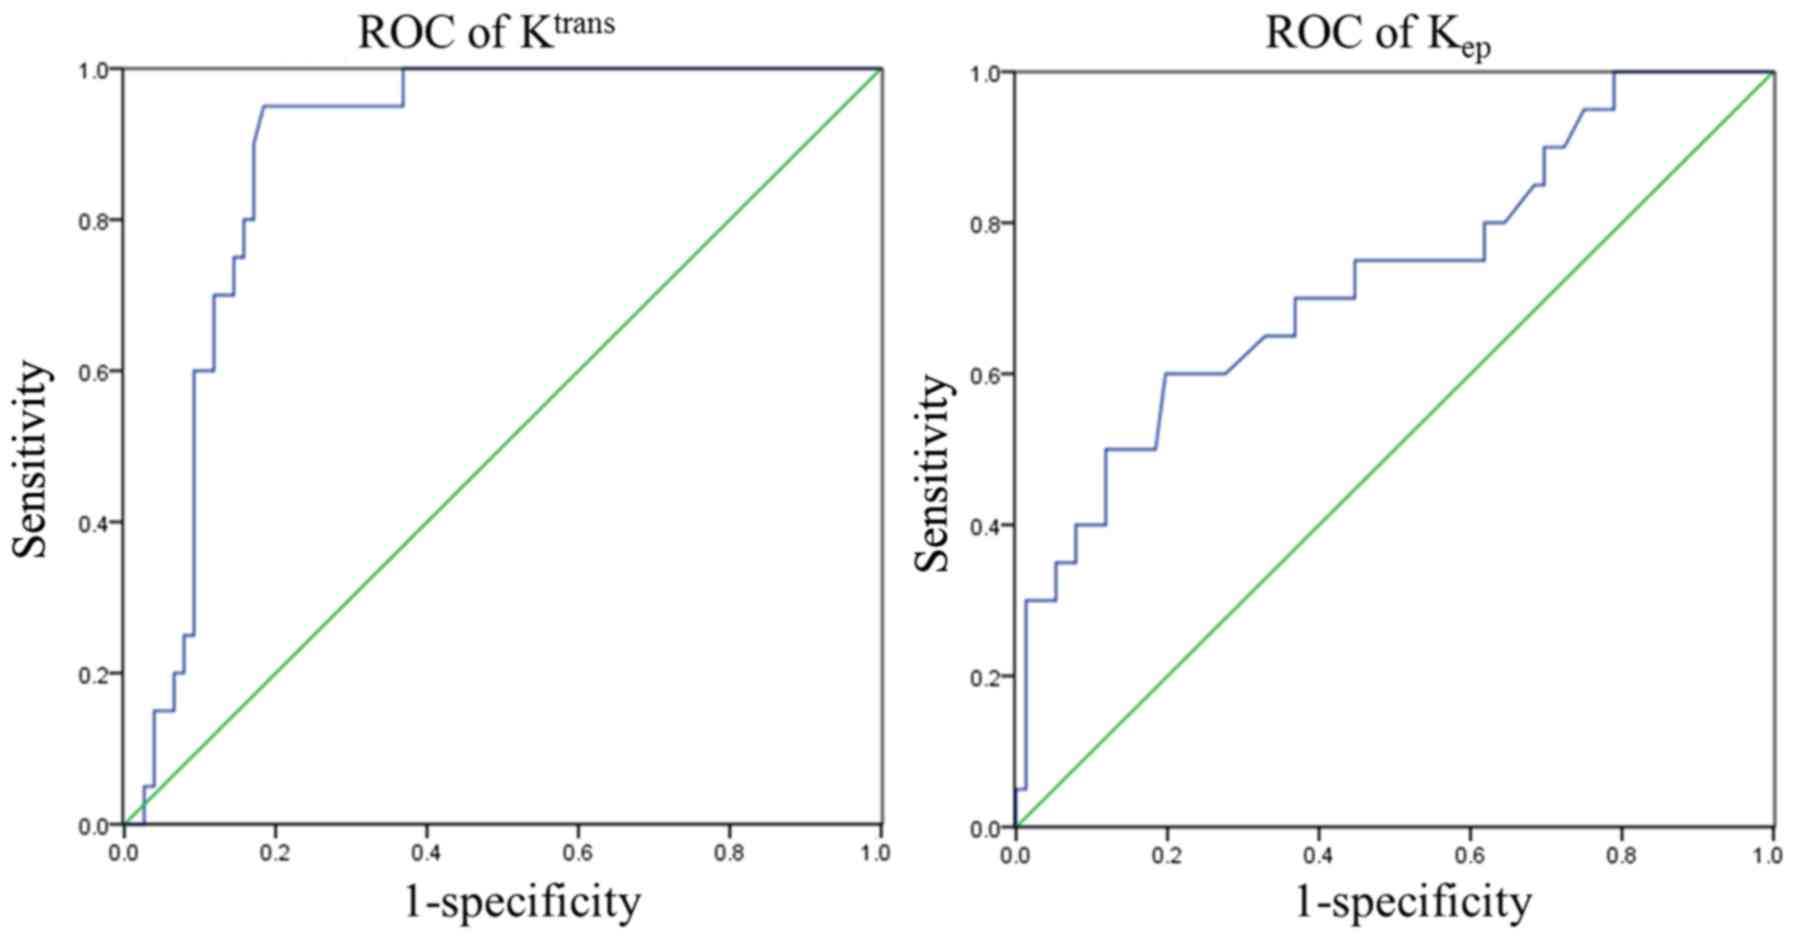
ROC analysis of quantitative
parameters
The ROC curves of Ktrans and
Kep were drawn in accordance with pathology and
follow-up results. The AUC values of Ktrans and
Kep were 0.884 and 0.728, respectively. The max Youden
index was computed on the basis of the ROC curve to determine the
sensitivity, specificity and optimal cut-off points, which are
shown in Table V and Fig. 4.
| Table V.Receiver-operator characteristic
curve of Ktrans and Kep. |
Table V.
Receiver-operator characteristic
curve of Ktrans and Kep.
| Parameter | Area under the
curve | Optimal cut
point | Sensitivity | Specificity |
|---|
|
Ktrans/min | 0.884 | 0.614 | 0.950 | 0.826 |
|
Kep/min | 0.728 | 0.985 | 0.600 | 0.813 |
Discussion
The difficulty in locating a pituitary microadenoma
and identifying its subtypes complicates the diagnosis of pituitary
microadenomas through clinical examination and conventional MRI.
The present results demonstrated that Ktrans and
Kep calculated from the MRI of patients with pituitary
microadenomas were lower compared with those values calculated from
the MRI of normal controls. This result contradicts the results
obtained for other tumors, including breast, prostate, cervical and
esophageal cancer (10,11).
Highly differentiated tumor is associated with high
Ktrans and Kep values (12,13).
Tumor permeability is determined by the levels of vascular
endothelium growth factor (VEGF), which increases the number of
vascular endothelial cells and promotes angiogenesis and capillary
permeability. Furthermore, VEGF mRNA and protein are overexpressed
in tumor cells (14). Microvascular
density (MVD) could also reflect the number of capillaries in the
tumor and is a key factor that influences tumor permeability.
Therefore, in certain tumors, the expression level of VEGF and the
value of MVD are strongly correlated with the values of
Ktrans and Kep (15,16).
However, immunohistochemical studies have
demonstrated that the oversecretion of certain hormones by
pituitary microadenomas decreases VEGF levels relative to those in
normal pituitary tissue; this effect may further decrease the MVD
value of pituitary microadenomas (17,18).
Therefore, the permeability of pituitary microadenomas is lower
compared with that of normal pituitary tissue. The present study
demonstrated that the pathophysiological changes exhibited by
pituitary microadenomas contradict those characteristics of other
types of tumors.
The Ve values of patients with pituitary
microadenoma were not significantly lower compared with those of
the controls. The value of Ve is inconsistent (19), which may be associated with the
presence of edema in tissues that surround pathological regions.
Kep and Ve are less effective than
Ktrans in distinguishing between healthy and diseased
mammary glands (20). In the study,
Ve could not be used to distinguish benign or malignant
pituitary tissues. The results may also be affected by the selected
AIF (21), which strongly affects
the accuracy of the quantitative parameters (22). The vessels of the pathological tissue
or the aorta around the pathological tissue must be supplied to
reflect the bloodstream in diabetic microangiopathy (23). Therefore, the internal carotid, which
surrounds the sellar region, was regarded as the standard AIF and
applied in data processing. In addition, the difference in
Ve values may be associated with the different arrival
and peak times of the contrast in the vessels. This difference may
be attributed to the individual characteristics of the
patients.
Radiology specialists have stated that misdiagnosis
and overdiagnosis of pituitary microadenoma have become a key
problem. The present study demonstrated that the quantitative
parameter Ktrans increases the sensitivity of pituitary
microadenoma detection, thus increasing diagnostic accuracy.
Moreover, determination of the optimal cut-off points also provides
quantitative indexes for diagnosis, thus increasing the objectivity
of the results. The present study expanded the application of
quantitative analysis in the diagnosis of pituitary microadenomas
through DCE-MRI. This approach enables comparisons among different
niduses and among large-scale and multi-nidus studies.
Previous histopathological studies and
radioimmunoassay studies have shown that the level of
cyclooxygenase 2 reflects the degree of vascularization (24) and that the level of hematopoietic
progenitor cell antigen CD34 (25),
an endothelial cell marker, varies in different microadenoma
subtypes. The MVD values of ACTH and PRL tumors are lower compared
with those of other pituitary microadenoma subtypes and
non-functioning adenoma. Moreover, the MVD values of PRL tumors are
lower compared with those of pituitary macroadenoma (26). Other types of pituitary microadenoma
do not exhibit this characteristic. However, in a systematic study
on the degree of vascularization, Jugenburg et al (27) revealed that PRL tumors exhibited the
highest MVD values, whereas GH tumors exhibited the lowest MVD
values. Nevertheless, the difference between the two values was not
statistically significant given the small size of the study sample.
ACTH tumors exhibited the highest MVD values and lowest capillary
volume, whereas PRL tumors had the highest capillary value
(28). These two tumor subtypes have
different VEGF levels. Lloyd et al (18) concluded that VEGF expression levels
in GH tumors were the highest, those in PRL tumors were the lowest
and those in ACTH tumors or non-functioning adenomas were
moderate.
Therefore, referring to previous pathology and
radioimmunoassay studies, different types of secretory pituitary
microadenoma exhibit different pharmacokinetic vascular
permeability values. The present study demonstrated that the
Ktrans and Kep of GH tumors were the highest,
and those of ACTH and PRL tumors were the lowest. The
Ktrans and Kep of different tumor types,
except for those of PRL and ACTH tumors, significantly varied. This
result is in accordance with the physiological and pathological
variation exhibited by different secretory types (26). These variations may be attributed to
the different characteristics of the tumor types. The PRL tumor is
the most common tumor, and exhibits slow growth and a small size;
it rarely develops into macroadenoma or invades its surrounding
tissue. In fact, one-third of patients with PRL tumors tend to
experience self-remission (29).
ACTH tumors are more invasive than PRL tumors (30), but have lower MVD values and VEGF
levels compared with other pituitary microadenoma subtypes. Another
factor may cause this behavior. The markers of control cells,
including p-27, would decrease the degree of microvascularization
(31). Otherwise, dexamethasone
inhibits VEGF expression in ACTH tumor cells. Therefore, ACTH
tumors secrete excess glucocorticoids that would inhibit VEGF
expression (32). These factors
would decrease microvessel degree and VEGF expression in ACTH
tumors relative to those in other pituitary microadenoma
subtypes.
The MVD of GH microadenoma is associated with age.
Young people are at an increased risk of GH macroadenoma compared
with individuals aged ≥40 years (24). The sellar region and its surroundings
are easily invaded by adenomas. All the aforementioned factors
would increase MVD values and VEGF expression levels. In the
present study, the group with GH microadenomas was younger compared
with other groups. However, no statistical significance was
revealed. Theoretically, the quantitative parameter values of
various pituitary microadenoma secretory types may differ and the
microvascular permeability of GH tumors is higher compared with
that of PRL and ACTH tumors. This phenomenon validates the
difference among various pituitary microadenoma secretory types
confirmed with histopathology.
The present study demonstrated that quantitative
DCE-MRI analysis can be used to classify pituitary microadenomas
into different secretory types despite the small sample size. The
classification of pituitary microadenomas and the difference in
histopathology among various pituitary microadenoma subtypes could
be evaluated from pharmacokinetic parameters derived from DCE-MRI.
Such an approach could not be achieved through conventional
MRI.
The present results indicate that quantitative
DCE-MRI analysis could be feasibly applied in the detection of
pituitary microadenoma. The quantitative parameters
Ktrans and Kep could be used to detect and
classify pituitary microadenomas. Ktrans could reflect
the differences in microcirculation among patients with pituitary
microadenoma and its subtypes. The comprehensive evaluation of
DCE-MRI is worth adopting over conventional MRI.
At present, the quantitative analysis of DCE-MRI for
the diagnosis of pituitary microadenoma remains in the exploration
stage. However, the DCE-MRI diagnostic method overcomes the
limitations of conventional MRI diagnostic methods and has higher
stability and repeatability given that it is independent of machine
and scanning parameters. Given the majority of studies have
improved protocol settings, optimized postprocessing models and
large samples, DCE-MRI could provide highly stable quantitative
parameters for the objective diagnosis of pituitary microadenomas.
The technique could also be used to examine the difference in
pathophysiological changes among various types of secretory tumors.
In addition, the quantitative parameters used in the present study
could be regarded as biological markers for monitoring the
responses of pituitary microadenomas to pharmacotherapy in clinical
settings.
Acknowledgements
Not applicable.
Funding
No funding was received.
Availability of data and materials
The data analysis methods used in this study are
available from the corresponding author upon reasonable
request.
Authors' contributions
JZ, QZ and WZ designed the study and drafted the
manuscript, and were responsible for the MRI scanning. JW and XZ
performed the statistical analysis, researched the literature and
revised the manuscript. All authors read and approved the final
version of the manuscript
Ethics approval and consent to
participate
This study was approved by the Institutional Review
Board of The First Affiliated Hospital of Wannan Medical College
(Wuhu, Anhui, China). Written consent was provided by all
patients.
Patient consent for publication
Not applicable.
Competing interests
The authors declare that they have no competing
interests.
References
|
1
|
Daly AF, Rixhon M, Adam C, Dempegioti A,
Tichomirowa MA and Beckers A: High prevalence of pituitary
adenomas: A cross-sectional study in the province of Liege,
Belgium. J Clin Endocrinol Metab. 91:4769–4775. 2006. View Article : Google Scholar : PubMed/NCBI
|
|
2
|
Lieb JM and Ahlhelm FJ: Tumors of the
sellar region. Radiologe. 57:740–747. 2017.(In German). View Article : Google Scholar : PubMed/NCBI
|
|
3
|
Stacey RJ and Powell MP: Sellar and
Parasellar Tumors. Neurosurgery. 187–204. 2006.PubMed/NCBI
|
|
4
|
Scheithauer BW, Horvath E, Kovacs K, Laws
ER Jr, Randall RV and Ryan N: Plurihormonal pituitary adenomas.
Semin Diagn Pathol. 3:69–82. 1986.PubMed/NCBI
|
|
5
|
Shah S, Waldman AD and Mehta A: Advances
in pituitary imaging technology and future prospects. Best Pract
Res Clin Endocrinol Metab. 26:35–46. 2012. View Article : Google Scholar : PubMed/NCBI
|
|
6
|
Rand T, Lippitz P, Kink E, Huber H,
Schneider B, Imhof H and Trattnig S: Evaluation of pituitary
microadenom as with dynamic MR imaging. Eur J Radiol. 41:131–135.
2002. View Article : Google Scholar : PubMed/NCBI
|
|
7
|
Kopczak A, Renner U and Karl Stalla G:
Advances in understanding pituitary tumors. F1000Prime Rep.
6:52014. View
Article : Google Scholar : PubMed/NCBI
|
|
8
|
Murase K: Efficient method for calculating
kinetic parameters using T1-weighted dynamic contrast-enhanced
magnetic resonance imaging. Magn Reson Med. 51:858–862. 2004.
View Article : Google Scholar : PubMed/NCBI
|
|
9
|
Yankeelov TE, Lepage M, Chakravarthy A,
Broome EE, Niermann KJ, Kelley MC, Meszoely I, Mayer IA, Herman CR,
McManus K, et al: Integration of quantitative DCE-MRI and ADC
mapping to monitor treatment response in human breast cancer:
Initial results. Magn Reson Imaging. 25:1–13. 2007. View Article : Google Scholar : PubMed/NCBI
|
|
10
|
Zhijun Z: Research of DCE-MRI quantitative
analysis value in cervical squamous cell carcinomas microvascular
permeability. Chin J CT MRI. 13:71–73. 2015.(In Chinese).
|
|
11
|
Lei J, Tian Y, Zhu SC, Han Q, Wei Y, Yang
S and Shi DP: Preliminary study of IVIM-DWI and DCE-MRI in early
diagnosis of esophageal cancer. Eur Rev Med Pharmacol Sci.
19:3345–3350. 2015.PubMed/NCBI
|
|
12
|
Zhao LY, Zhou CW, Zhang RZ, et al:
Correlation of quantitative parameters of dynamic contrast-enhanced
MRI with subtypes of breast carcinoma. Chin J Med Imaging Technol.
29:1126–1130. 2013.(In Chinese).
|
|
13
|
Zhao J, Yang ZY, Luo BN, Yang JY and Chu
JP: Quantitative evaluation of diffusion and dynamic
contrast-enhanced MR in tumor parenchyma and peritumoral area for
distinction of brain tumors. PLoS One. 10:e01385732015. View Article : Google Scholar : PubMed/NCBI
|
|
14
|
Yuan A, Lin CY, Chou CH, Shih CM, Chen CY,
Cheng HW, Chen YF, Chen JJ, Chen JH, et al: Functional and
structural characteristics of tumor angiogenesis in lung cancers
overexpressing different VEGF isoforms assessed by DCE- and
SSCE-MRI. PLoS One. 6:e160622011. View Article : Google Scholar : PubMed/NCBI
|
|
15
|
Jia ZZ, Geng DY, Liu Y, Chen XR and Zhang
J: Microvascular permeability of brain astrocytoma with
contrast-enhanced magnetic resonance imaging: Correlation analysis
with histopathologic grade. Chin Med J (Engl). 126:1953–1956.
2013.PubMed/NCBI
|
|
16
|
Jia ZZ, Gu HM, Zhou XJ, Shi JL, Li MD,
Zhou GF and Wu XH: The assessment of immature microvascular density
in brain gliomas with dynamic contrast-enhanced magnetic resonance
imaging. Eur J Radiol. 84:1805–1809. 2015. View Article : Google Scholar : PubMed/NCBI
|
|
17
|
Takada K, Yamada S and Teramoto A:
Correlation between tumor vascularity and clinical findings in
patients with pituitary adenomas. Endocr Pathol. 15:131–139. 2004.
View Article : Google Scholar : PubMed/NCBI
|
|
18
|
Lloyd RV, Scheithauer BW, Kuroki T, Vidal
S, Kovacs K and Stefaneanu L: Vascular endothelial growth factor
(VEGF) expression in human pituitary adenomas and carcinomas.
Endocr Pathol. 10:229–235. 1999. View Article : Google Scholar : PubMed/NCBI
|
|
19
|
Tofts PS: Modeling tracer kinetics in
dynamic Gd-DTPA MR imaging. J Magn Reson Imaging. 7:91–101. 1997.
View Article : Google Scholar : PubMed/NCBI
|
|
20
|
Ruimin L, Yajia G, Jian M, et al: Research
of benign and malignant breast lesions differentiation using
quantitative DCE-MRI. Chin J Radiol. 45:164–169. 2011.(In
Chinese).
|
|
21
|
Wang Y, Huang W, Panicek DM, Schwartz LH
and Koutcher JA: Feasibility of using limited population-based
arterial input function for pharmacokinetic modeling of
osteosarcoma dynamic contrast-enhanced MRI data. Magn Reson Med.
59:1183–1189. 2008. View Article : Google Scholar : PubMed/NCBI
|
|
22
|
Yankeelov TE, Cmn GO, Addison CL, Wallace
JC, Wilkins RC, Pappas BA, Santyr GE and Gore JC: Comparison of a
reference region model with direct measurement of an AIF in the
analysis of DCE-MRI data. Magn Reson Med. 57:353–361. 2007.
View Article : Google Scholar : PubMed/NCBI
|
|
23
|
Vidal S, Kovacs K, Horvath E, Scheithauer
BW, Kuroki T and Lloyd RV: Microvessel density in pituitary
adenomas and carcinomas. Virchows Arch. 438:595–602. 2001.
View Article : Google Scholar : PubMed/NCBI
|
|
24
|
Turner HE, Nagy Z, Gatter KC, Esiri MM,
Harris AL and Wass JA: Angiogenesis in pituitary
adenomas-relationship to endocrine function, treatment and outcome.
J Endocrinol. 165:475–481. 2000. View Article : Google Scholar : PubMed/NCBI
|
|
25
|
Onguru O, Casey MB, Kajita S, Nakamura N
and Lloyd RV: Cyclooxygenase-2 and thromboxane synthase in
non-endocrine and endocrine tumors: A review. Endocr Pathol.
16:253–277. 2005. View Article : Google Scholar : PubMed/NCBI
|
|
26
|
Turner HE, Nagy Z, Gatter KC, Esiri MM,
Harris AL and Wass JA: Angiogenesis in pituitary adenomas and the
normal pituitary gland. J Clin Endocrinol Metab. 85:1159–1162.
2000. View Article : Google Scholar : PubMed/NCBI
|
|
27
|
Jugenburg M, Kovacs K, Stefaneanu L and
Scheithauer BW: Vasculature in nontumorous hypophyses, pituitary
adenomas, and carcinomas: A quantitative morphological study.
Endocr Pathol. 6:115–124. 1995. View Article : Google Scholar : PubMed/NCBI
|
|
28
|
Jasek E, Furgal-Borzych A, Lis GJ, Litwin
JA, Rzepecka-Wozniak E and Trela F: Microvessel density and area in
pituitary microadenomas. Endocr Pathol. 20:221–226. 2009.
View Article : Google Scholar : PubMed/NCBI
|
|
29
|
Jeffcoate WJ, Pound N, Sturrock ND and
Lambourne J: Long-term follow-up of patients with
hyperprolactinaemia. Clin Endocrinol (Oxf). 45:299–303. 1996.
View Article : Google Scholar : PubMed/NCBI
|
|
30
|
Juneau P, Schoene W C and Black P:
Malignant tumors in the pituitary gland. Arch Neurol. 49:555–558.
1992. View Article : Google Scholar : PubMed/NCBI
|
|
31
|
Lidhar K, Korbonits M, Jordan S, Khalimova
Z, Kaltsas G, Lu X, Clayton RN, Jenkins PJ, Monson JP, Besser GM,
et al: Low expression of the cell cycle inhibitor p27Kip1 in normal
corticotroph cells, corticotroph tumors, and malignant pituitary
tumors. J Clin Endocrinol Metab. 84:3823–3830. 1999. View Article : Google Scholar : PubMed/NCBI
|
|
32
|
Lohrer P, Gloddek J, Hopfner U, Losa M,
Uhl E, Pagotto U, Stalla GK and Renner U: Vascular endothelial
growth factor production and regulation in rodent and human
pituitary tumor cells in vitro. Neuroendocrinology. 74:95–105.
2001. View Article : Google Scholar : PubMed/NCBI
|