Introduction
Acute myeloid leukemia (AML) is predominantly a
fatal hematopoietic malignancy characterized by the clonal
proliferation of myeloid blasts with tissue infiltration (1). It may occur at any age, with an
incidence of 2–3/100,000 per annum in children <14 years old,
and ~15/100,000 per annum in adults >60 years old globally
(2). Despite advances in therapeutic
strategies, including intensive chemotherapy and hematopoietic stem
cell transplantation (HSCT), the clinical outcome of AML remains
poor, particularly in older patients (>60 years old) (3–5).
Considering the clonal complexity of AML, there has been increasing
interest in improving the prognosis and treatment of AML through
the more extensive biological profiling of cytogenetic and
molecular tumor heterogeneity (6–10). The
Cancer Genome Atlas Research Network has reported that ~70% of AML
cases have mutations in genes encoding epigenetic modifiers
(11,12). Notably, novel data has demonstrated
that DNA methylation heterogeneity (epialleles) may occur with
distinct kinetics and patterns that are likely to affect clinical
outcomes. These may be hallmarks of AML and may be independent of
the genetic landscape (13,14). Accordingly, differences in epigenetic
diversity may function as molecular biomarkers to independently
evaluate AML prognosis.
Long non-coding RNAs (lncRNAs) are a class of RNAs
that are >200 nucleotides in length (15–17).
Gene expression regulated by lncRNAs is regarded as one of the most
notable types of epigenetic control (18,19).
Recurrent mutations and/or epigenetic alterations in the regulatory
non-coding genome may broadly affect lncRNA expression in numerous
malignant tumor types, serving as signals for carcinogenesis, in
addition to providing information for prognosis and therapeutic
options in patients with cancer (20). Notably, the expression of a small
subset of lncRNAs, including nuclear paraspeckle assembly
transcript 1, have been strongly associated with treatment response
and survival in cytogenetically normal older patients with AML
(21). In particular, a range of
lncRNAs, including HOXA transcript antisense RNA, myeloid-specific
1 and HOX transcript antisense intergenic RNA myeloid 1 (HOTAIR),
may exert pivotal effects not only on hematopoietic stem cells
during normal hematopoiesis, but also on the cancer phenotype
during the process of leukemogenesis (22–25).
lncRNAs are categorized into antisense,
bidirectional, intronic, intergenic and overlapping lncRNAs, based
on their chromosomal location (26,27).
Antisense lncRNAs are initially transcribed from the opposite
strand of a protein-coding counterpart, functioning as fast
regulatory mediators in self-regulatory circuits to modulate global
and/or specific transcriptional outputs (28–32).
Certain antisense lncRNAs, including IGF1R antisense imprinted
non-protein coding RNA, are downregulated in patients with
high-risk AML, resulting in the promotion of cell growth through
long-range chromatin interactions with insulin like growth factor 1
receptor (33,34). Using the Affymetrix Human LncRNA
microarray analysis, it was has been demonstrated that the
expression of the lncRNA zinc finger E-box binding homeobox 2
(ZEB2) antisense RNA 1 (ZEB2-AS1) is abnormally overexpressed in
patients with AML (as yet unpublished). A previous study indicated
that a natural antisense transcript, overlapping the 5′ splice site
in the intron of the ZEB2 gene, may prevent splicing of the
5′-untranslated region to increase ZEB2 translation and
consequently downregulate the expression of E-cadherin, which in
turn induces epithelial-mesenchymal transition (EMT) in a tumor
(35). However, the prognostic value
of ZEB2-AS1 in AML and its function in leukemogenesis remains to be
elucidated.
In the present study, 62 de novo patients
with AML were retrospectively analyzed to determine if ZEB2-AS1
lncRNA may function as a biomarker to evaluate AML prognosis. Thus,
the specific aim of the present study was to assess the association
between ZEB2-AS1 lncRNA expression and the clinical features of
patients with AML. Additionally, the potential regulation of
leukemic phenotypes by ZEB2-AS1 lncRNA was investigated. As such,
the clinical and biological importance of ZEB2-AS1 lncRNA were
evaluated.
Materials and methods
Patients and tissue specimens
A total of 62 eligible patients with de novo
AML were enrolled retrospectively in the present study. Patients
were diagnosed and classified according to the World Health
Organization (36) criteria at the
First Affiliated Hospital of Soochow University (Jiangsu, China)
between May 2007 and June 2014. The clinicopathological
characteristics of this cohort are summarized in Table I. Modified Medical Research Council
(MRC) or European Leukemia Net (ELN) recommendations were applied
for risk stratification (37–39). The
62 bone marrow specimens were collected from the pretreated
patients and were frozen and archived for the following
experiments. For comparison, 10 eligible bone marrow specimens were
collected from patients without hematopoietic malignancies and were
selected as the non-malignant hemotopathy group (Table II). Clinical outcome data were
updated as of April 2016. The present research was ethically
approved by the Institutional Review Board of the First Affiliated
Hospital of Soochow University.
 | Table I.Clinical, pathological and genetic
characteristics of patients with AML. |
Table I.
Clinical, pathological and genetic
characteristics of patients with AML.
|
|
| ZEB2-AS1
expression |
|
|---|
|
|
|
|
|
|---|
|
Characteristics | Patients | Low level | High level | P-value |
|---|
| Age (years) |
|
|
| 0.552 |
| Median
(range) | 39 (8–80) | 39 (8–80) | 34 (14–67) |
|
| Sex |
|
|
| 0.537 |
|
Male | 32 (51.6%) | 24 | 8 |
|
|
Female | 30 (48.4%) | 25 | 5 |
|
| FAB Subtypes |
|
|
| 0.006 |
| M0 | 1
(1.6%) | 0 | 1 |
|
| M1 | 1
(1.6%) | 1 | 0 |
|
| M2 | 27 (43.6%) | 25 | 2 |
|
| M3 | 9
(14.5%) | 9 | 0 |
|
| M4 | 10 (16.1%) | 5 | 5 |
|
| M5 | 14 (22.6%) | 9 | 5 |
|
| Karyotype |
|
|
| <0.001 |
| Normal
karyotype | 16 (25.8%) | 14 | 2 |
|
|
t(15;17) | 9
(14.5%) | 9 | 0 |
|
|
t(8;21) | 13 (21.0%) | 12 | 1 |
|
| inv
(16) | 7
(11.3%) | 5 | 2 |
|
|
t(6;9) | 5
(8.0%) | 5 | 0 |
|
|
11q23 | 8
(12.9%) | 4 | 4 |
|
| Complex
karyotype | 4
(6.5%) | 0 | 4 |
|
| White blood cell
(×109/l; non-M3) |
|
|
| 0.046 |
| Median
(range) | 24.3
(1.0–190.5) | 13.5
(1.0–140.2) | 52.1
(1.3–190.3) |
|
| Hemoglobin (g/l;
non-M3) |
|
|
| 0.372 |
| Median
(range) | 84.0
(37.0–149.0) | 84.0
(37.0–149.0) | 88.0
(38.0–116.0) |
|
| Platelets
(×109/l; non-M3) |
|
|
| 0.044 |
| Median
(range) | 40 (8.0–414.0) | 31 (8–414) | 71.5 (20–410) |
|
| Blasts in bone
marrow (%; non-M3) |
|
|
| 0.569 |
| Median
(range) | 56.5
(20.5–98.0) | 57 (20.5–95.5) | 56.5
(25.0–98.0) |
|
| Mutated gene
(non-M3) |
|
|
| 0.474 |
|
Negative | 15 | 12 | 3 |
|
|
CEBPA | 2 | 2 | 0 |
|
|
NPM1 | 1 | 1 | 0 |
|
|
FLT3-ITD | 1 | 1 | 0 |
|
|
FLT3-TKD | 1 | 1 | 0 |
|
|
DNMT3A | 1 | 1 | 0 |
|
|
C-kit | 4 | 1 | 3 |
|
|
C-kit/CEBPA | 2 | 2 | 0 |
|
|
NPM1/FLT3-TKD | 1 | 1 | 0 |
|
|
FLT3-ITD/CEBPA | 1 | 1 | 0 |
|
|
NPM1/DNMT3A | 1 | 1 | 0 |
|
|
DNMT3A/NPM1/FLT3-ITD | 2 | 1 | 1 |
|
| Modified MRC risk
stratification |
|
|
| 0.002 |
|
Favorable | 29 (46.8%) | 26 | 3 |
|
|
Intermediate | 28 (45.1%) | 22 | 6 |
|
|
Adverse | 5
(8.1%) | 1 | 4 |
|
| ELN risk
stratification (non-M3) |
|
|
| 0.028 |
|
Favorable | 27 | 24 | 3 |
|
|
Intermediate I and II | 13 | 8 | 5 |
|
|
Adverse | 10 | 5 | 5 |
|
| Recovery from
induction chemotherapy (non-M3) |
|
|
| 0.031 |
| CR | 24 | 21 | 3 |
|
|
Non-CR | 15 | 7 | 8 |
|
| Table II.Characteristics of 10 non-malignant
hemotopathy cases. |
Table II.
Characteristics of 10 non-malignant
hemotopathy cases.
| Sex | Number | Age | Number |
|---|
| Male | 3 | ≥60 | 2 |
| Female | 7 | <60 | 8 |
| WBC | 5.585
(2.6–9.18)×109/l | Diagnosed | Number |
| HGB | 74.5
(57–156)g/l |
IDA | 8 |
| PLT | 281
(10–324)×109/l |
ITP | 2 |
AML cell line
Using the Affymetrix Human LncRNA microarray
analysis, it has been demonstrated that ZEB2-AS1 lncRNA is
predominantly overexpressed in patients with AML with a karyotype
of 11q23. In addition, the expression of ZEB2-AS1 lncRNA in THP-1
cells, also with a karyotype of 11q23, is significantly higher
compared with that of other AML cell lines, including AP1060, NB4
and FKH-1 (P=0.0020). Thus, THP-1 cells were selected for the
present study and cultured in RPMI-1640 medium (GE Healthcare Life
Sciences, Hyclone, Logan, UT, USA) supplemented with 10%
heat-inactivated fetal bovine serum (FBS; Sigma-Aldrich; Merck
KGaA, Darmstadt, Germany) in humidified 37°C incubator containing
5% CO2.
Patient treatment
A total of 39 patients with de novo AML,
excluding those diagnosed as the M3 subtype, received front-line
induction chemotherapy, including the idarubicin and cytarabine
regimen, as follows: Idarubicin 8–12 mg/m2 (days 1–3)
and cytarabine 100 mg/m2 (days 1–7); or the daunorubicin
and cytarabine regimen, as follows: Daunorubicin 60–90
mg/m2 (days 1–3) and cytarabine 100 mg/m2
(days 1–7). Subsequent to achieving first complete remission (CR,
n=24), patients received post-remission therapy of either several
consolidation courses (n=12) or allogeneic HSCT (allo-HSCT;
n=12).
For the treatment of AML with allo-HSCT, patients
received an initial conditioning regimen with lomustine (250
mg/m2/day on day −10), cytarabine (2 or 4
g/m2/day; days −9 to −8), busulfan (3.2 mg/kg/day; days
−7 to −5) and cyclophosphamide (1.8 g/m2/day; days −4 to
−3). Due to advanced patient age or the presence of other
comorbidities, patients with poor responses to myeloablative
conditioning received a regimen with lomustine (250
mg/m2/day; day −10), fludarabine (30 mg/m2;
days −10 to −6), cytarabine (1.5 g/m2/day; days −10 and
−6) and busulfan (3.2 mg/kg/day; days −5 to −3). To effectively
prevent graft-versus-host disease (GVHD), cyclosporine (3
mg/kg/day) was infused to achieve a target blood concentration
between 200–300 ng/ml, starting on day −9 or −1 until patients
switched to oral administration. For unrelated or haploidentical
transplantation, mycophenolate mofetil (30 mg/kg/day) and rabbit
anti-thymocyte globulin (2.5 mg/kg/day; days −5 to −2) were
additionally administered to prevent GVHD. In addition,
methotrexate was separately administered on days +1, +3, +6, and
+11, at doses of 15, 10, 10 and 10 mg/m2,
respectively.
Cytogenetic and molecular genetic
analysis
In the cytogenetic analyses, bone marrow specimens
from patients with de novo AML were processed in standard
un-stimulated cultures for 24 h. With standard techniques of ISCN
2016 (40) for chromosome R-banding
and fluorescence in situ hybridization, the different
karyotypes in patients with AML were routinely determined. If
available, at least 20 metaphases were analyzed for every bone
marrow sample. For analyzing mutations in patients with de
novo AML, a Purelink™ Genomic DNA mini kit (Invitrogen; Thermo
Fisher Scientific, Inc., Waltham, MA, USA) was used to extract
genomic DNA from the 62 patients bone marrow mononuclear cells,
according to the manufacturer's protocol. The coding regions of
mutated genes were either partially or entirely amplified using a
polymerase chain reaction (PCR) in order to identify these
mutations. The genomic DNA was extracted from the 62 patients bone
marrow mononuclear cells. The thermo cycling conditions were as
follows 95°C 5 min, total 35 cycles of 95°C 30 sec and 58°C 30 sec
and 72°C 1 min, then 72°C 10 min. Direct bidirectional DNA
sequencing was subsequently performed. In the present study, a
range of acute leukemia-associated mutations were evaluated,
including fms related tyrosine kinase 3 (FLT3)-internal tandem
duplication (FLT3-ITD, forward, 5′-CAATTTAGGTATGAAAGCC-3′ and
reverse, 5′-GTACCTTTCAGCATTTTGAC-3′), DNA methyltransferase 3α
(DNMT3A, forward, 5′-CTGCTGTGTGGTTAGACG-3′ and reverse,
5′-TATTTCCGCCTCTGTGGTTT-3′), FLT3-tyrosine kinase domain (FLT3-TKD,
forward, 5′-CCAGGAACGTGCTTGTCA-3′ and reverse,
5′-TCAAAAATGCACCACAGTGAG-3′), C-kit (forward,
5′-CTCCCTGAAAGCAGAAAC-3′ and reverse,
5′-CAGAAAGATAACACCAAAATAG-3′), CCAAT enhancer binding protein α
(CEBPA, forward, 5′-GGCGAGCAGGGTCTCCGGGT-3′ and reverse,
5′-TGTGCTGGAACAGGTCGGCCA-3′) and nucleophosmin 1 (NPM1, forward,
5′-TTAACTCTCTGGTGGTAGAATGAA-3′ and reverse,
5′-TGTTACAGAAATGAAATAAGACGG-3′).
RNA extraction and reverse
transcription-quantitative (RT-q)PCR
Total RNA was extracted from patient bone marrow
mononuclear cells using TRIzol (Invitrogen; Thermo Fisher
Scientific, Inc.). RT and first strand cDNA synthesis was
subsequently performed using MMLV-RT reverse transcriptase (Promega
Corporation, Madison, WI, USA 37°C 60 min, 95°C 5 min). RT-qPCR
analysis was employed to detect levels of ZEB2-AS1. GAPDH was used
as an internal reference gene. The primer sequences used were as
follows: ZEB2-AS1 forward, 5′-GGCTGGATAGCAAAGGAC-3′ and reverse,
5′-ACACTCTTGGCGAGGT-3′; ZEB2 forward, 5′-GTCCATGCGAACTGCCATCT-3′
and reverse, 5′-ATCTGTCCCTGGCTTGTGTG-3′; E-cadherin forward,
5′-TGCCCAGAAAATGAAAAAGG-3′ and reverse, 5′-GTGTATGTGGCAATGCGTTC-3′;
GAPDH forward, 5′-CAAGGTCATCCATGACAACTTTG-3′, and reverse,
5′-GTCCACCACCCTGTTGCTGTAG-3′. SYBR Green (Taraka, Japan) RT-qPCR
was performed and the relative threshold cycle value normalized to
the reference GAPDH gene was obtained (ABI 7500; Thermo Fisher
Scientific, Inc.) The thermo cycling conditions were as follows
50°C 2 min, 95°C 10 min, 95°C 15 sec, 60°C 1 min, for a total of 40
cycles. Following this, 2−ΔΔCq was calculated to
determine relative abundance of target gene expression between the
groups (41).
RNA interference
Gene-specific small interfering RNAs (siRNAs)
against ZEB2-AS1 (siZEB2-AS1; sense, 5′-CACCUUUGGUUACCUGAAUTT-3′
and antisense, 5′-AUUCAGGUAACCAAAGGUGTT-3′) and negative control
(NC) siRNA (sense, 5′-UUCUCCGAACGUGUCACGUTT-3′ and antisense,
5′-ACGUGACACGUUCGGAGAATT-3′) were commercially designed (Shanghai
GenePharma Co., Ltd., Shanghai, China). On the day of transfection,
THP-1 cells were plated at a low density of 2 × 10⁵ on
the culture vessel (Corning, Corning, NY, USA) and subsequently
transfected with 40 nM on-target siRNA using Lipofectamine™ 2000
(Invitrogen; Thermo Fisher Scientific, Inc.) according to the
manufacturer's protocol cells were incubated with siRNA for 24–48
h. NC siRNA was used as a transfection control in all experiments.
Each experiment was independently repeated at least three
times.
Analyses of biological phenotype
To analyze cell migration, 1×10⁵ THP-1
cells (siZEB2-AS1 and NC groups) were plated into the upper chamber
of Transwell cell culture inserts (24-well; pore size, 8 µm;
Corning) in serum-free DMEM media (GE Healthcare Life Sciences).
The lower chamber medium was supplemented with 20% FBS. To assess
cell invasion, 1×10⁵ THP-1 cells (siZEB2-AS1 and NC
groups) were seeded into the upper chamber of Transwell cell
culture inserts (24-well; pore size, 8 µm; Corning) coated with
Matrigel. The lower chamber medium contained 20% FBS. Following
incubation at 37°C for 24 h, the upper layer of THP-1 cells was
removed with cotton wool, and THP-1 cells on the lower surface were
fixed with 95% ethanol for 20 min in room temperature. Invaded or
migrated cells were subsequently stained with 0.1% crystal violet
for 30 min at 37°C and observed under an IX71 inverted microscope
at ×200 magnification (Olympus Corporation, Tokyo, Japan). Five
microscopic fields were counted per insert. Triplicate inserts were
used for each individual experiment, and each experiment was
independently repeated at least three times.
To assess cell proliferation, THP-1 cell lines
(siZEB2-AS1 and NC groups) were seeded onto 96-well cell culture
cluster plates (Corning) at a concentration of 5×10⁴
cells/well in volumes of 100 µl. A total of 10 µl Cell Counting
Kit-8 reagent (Dojindo, Kumamoto, Japan) was added to each well at
the indicated time points (24, 48, 72, 96 h, 5, 7 days) and
incubated in the dark at 37°C for a further 4 h. The absorbency was
subsequently measured at the wavelength of 450 nm with the
Varioskan Flash Multimode Reader (Thermo Fisher Scientific, Inc.).
Each experiment was independently repeated at least three
times.
To detect cell apoptosis, 10X binding buffer
(eBioscience; Thermo Fisher Scientific, Inc.) was initially diluted
to 1X using distilled water (1 ml 10X binding buffer + 9 ml
distilled water). Cells were washed once in phosphate buffered
saline and once in 1X binding buffer, prior to cell resuspension in
1X binding buffer to 1–5×10⁶/ml. A total of 5 µl
fluorochrome-conjugated Annexin V (eBioscience; Thermo Fisher
Scientific, Inc.) was added to 100 µl cell suspension and incubated
for 10–15 min at room temperature. Cells were washed in 1X binding
buffer and resuspended in 200 µl 1X binding buffer. A total of 5 µl
7-Aminoactinomycin D viability staining solution (2-8°C)
(eBioscience; Thermo Fisher Scientific, Inc.) was added (stained
within 4 h and stored at 2–8°C in the dark). Cells were analyzed
using 5-color flow cytometry (type FC500, Beckman Coulter company,
Fullerton, CA, USA). Each experiment was independently repeated at
least three times.
Statistical analysis
All continuous data were expressed as the mean ±
standard error of the mean. One-way analysis of variance with
Bonferroni's correction post-hoc test for multiple comparisons were
performed. Survival probabilities were estimated using the
Kaplan-Meier method and differences between survival distributions
were evaluated using the log-rank test. Cox's proportional hazards
model was applied to estimate the hazard ratio for disease-free
survival (DFS) and overall survival (OS) rates. For all analyses,
the P-values were two-tailed and the confidence interval was 95%.
P<0.05 was considered to indicate a statistically significant
difference. SPSS statistical software version 18 (SPSS, Inc.,
Chicago, IL, USA) was used to perform all statistical analyses.
Results
Clinical, cytogenetic and molecular
features of patients with AML
The clinical features of the 62 AML cases enrolled
in the present study were summarized in Table I. Based on the modified MRC
classification, patients were categorized into a favorable risk
group (n=29), an intermediate risk group (n=28) and an adverse risk
group (n=5). According to ELN recommendations (12 cases missed the
required mutation data and were not classified), patients were
categorized into a favorable risk group (n=27), an intermediate
I/II risk group (n=13) and an adverse risk group (n=10; Table I). The respective values of median OS
and DFS rates, regarding different risk tiers and treatment
approaches, were summarized in Table
III.
| Table III.Clinical outcomes of patients with
AML. |
Table III.
Clinical outcomes of patients with
AML.
|
| OS rate
(months) | DFS rate
(months) |
|---|
|
|
|
|
|---|
| Groups | Median (95%
CI) | P-value | Median (95%
CI) | P-value |
|---|
| Age (years) |
| 0.187 |
| 0.199 |
|
<60 | 35.0
(30.33–43.89) | | 29.0
(27.42–41.72) |
|
|
≥60 | 27.0
(16.47–42.73) |
| 24.0
(12.98–41.82) |
|
| Sex |
| 0.254 |
| 0.246 |
|
Male | 25.0
(23.99–42.01) | | 24.0
(20.66–39.97) |
|
|
Female | 40.0
(30.15–47.59) |
| 39.0
(27.44–45.60) |
|
| White blood cell
(×109/l; non-M3) |
| 0.443 |
| 0.403 |
|
<Median | 35.0
(27.74–51.39) | | 28.0
(24.48–48.77) |
|
|
≥Median | 25.0
(21.86–41.55) |
| 24.0
(17.79–39.27) |
|
| Hemoglobin (g/l;
non-M3) |
| 0.988 |
| 0.924 |
|
<Median | 28.0
(25.22–39.14) | | 27.0
(21.53–6.35) |
|
|
≥Median | 39.5
(25.00–53.12) |
| 38.5
(21.40–50.98) |
|
| Platelets
(×109/l; non-M3) |
| 0.199 |
| 0.262 |
|
<Median | 40.0
(30.38–47.31) | | 39.0
(26.65–44.62) |
|
|
≥Median | 23.0
(16.93–45.07) |
| 21.0
(13.29–43.00) |
|
| Blasts in bone
marrow (%; non-M3) |
| 0.590 |
| 0.512 |
|
<Median | 33.0
(24.59–49.41) | | 25.5
(20.41–46.34) |
|
|
≥Median | 32.0
(24.53–43.71) |
| 29.0
(21.31–41.87) |
|
| MRC risk
stratification |
| 0.005 |
| 0.003 |
|
Favorable | 38.0
(32.36–45.91) |
| 29.0
(30.32–44.20) |
|
|
Intermediate | 27.0
(20.92–45.32) |
| 24.0
(17.24–43.11) |
|
|
Adverse | 29.0
(12.02–45.98) |
| 23.0
(5.13–40.88) |
|
| ELN risk
stratification (non-M3) |
| 0.003 |
| 0.003 |
|
Favorable | 40.0
(32.29–53.18) |
| 39.0
(29.52–51.01) |
|
|
Intermediate I/II | 25.0
(15.25–37.35) |
| 22.0
(10.43–35.37) |
|
|
Adverse | 19.5
(11.51–36.99) |
| 15.5
(6.1732.33) |
|
| Treatment
approaches (non-M3) |
| 0.113 |
| 0.166 |
|
Chemotherapy | 29.5
(23.15–41.05) |
| 26.5
(19.84–38.56) |
|
|
Allo-HSCT | 31.5
(23.80–47.77) |
| 25.5
(19.23–44.91) |
|
| ZEB2-AS1 level |
| 0.036 |
| 0.039 |
| Low
level | 36.5
(30.98–44.40) |
| 31.5
(28.55–42.50) |
|
| High
level | 22.0
(10.55–44.12) |
| 20.0
(3.98–41.74) |
|
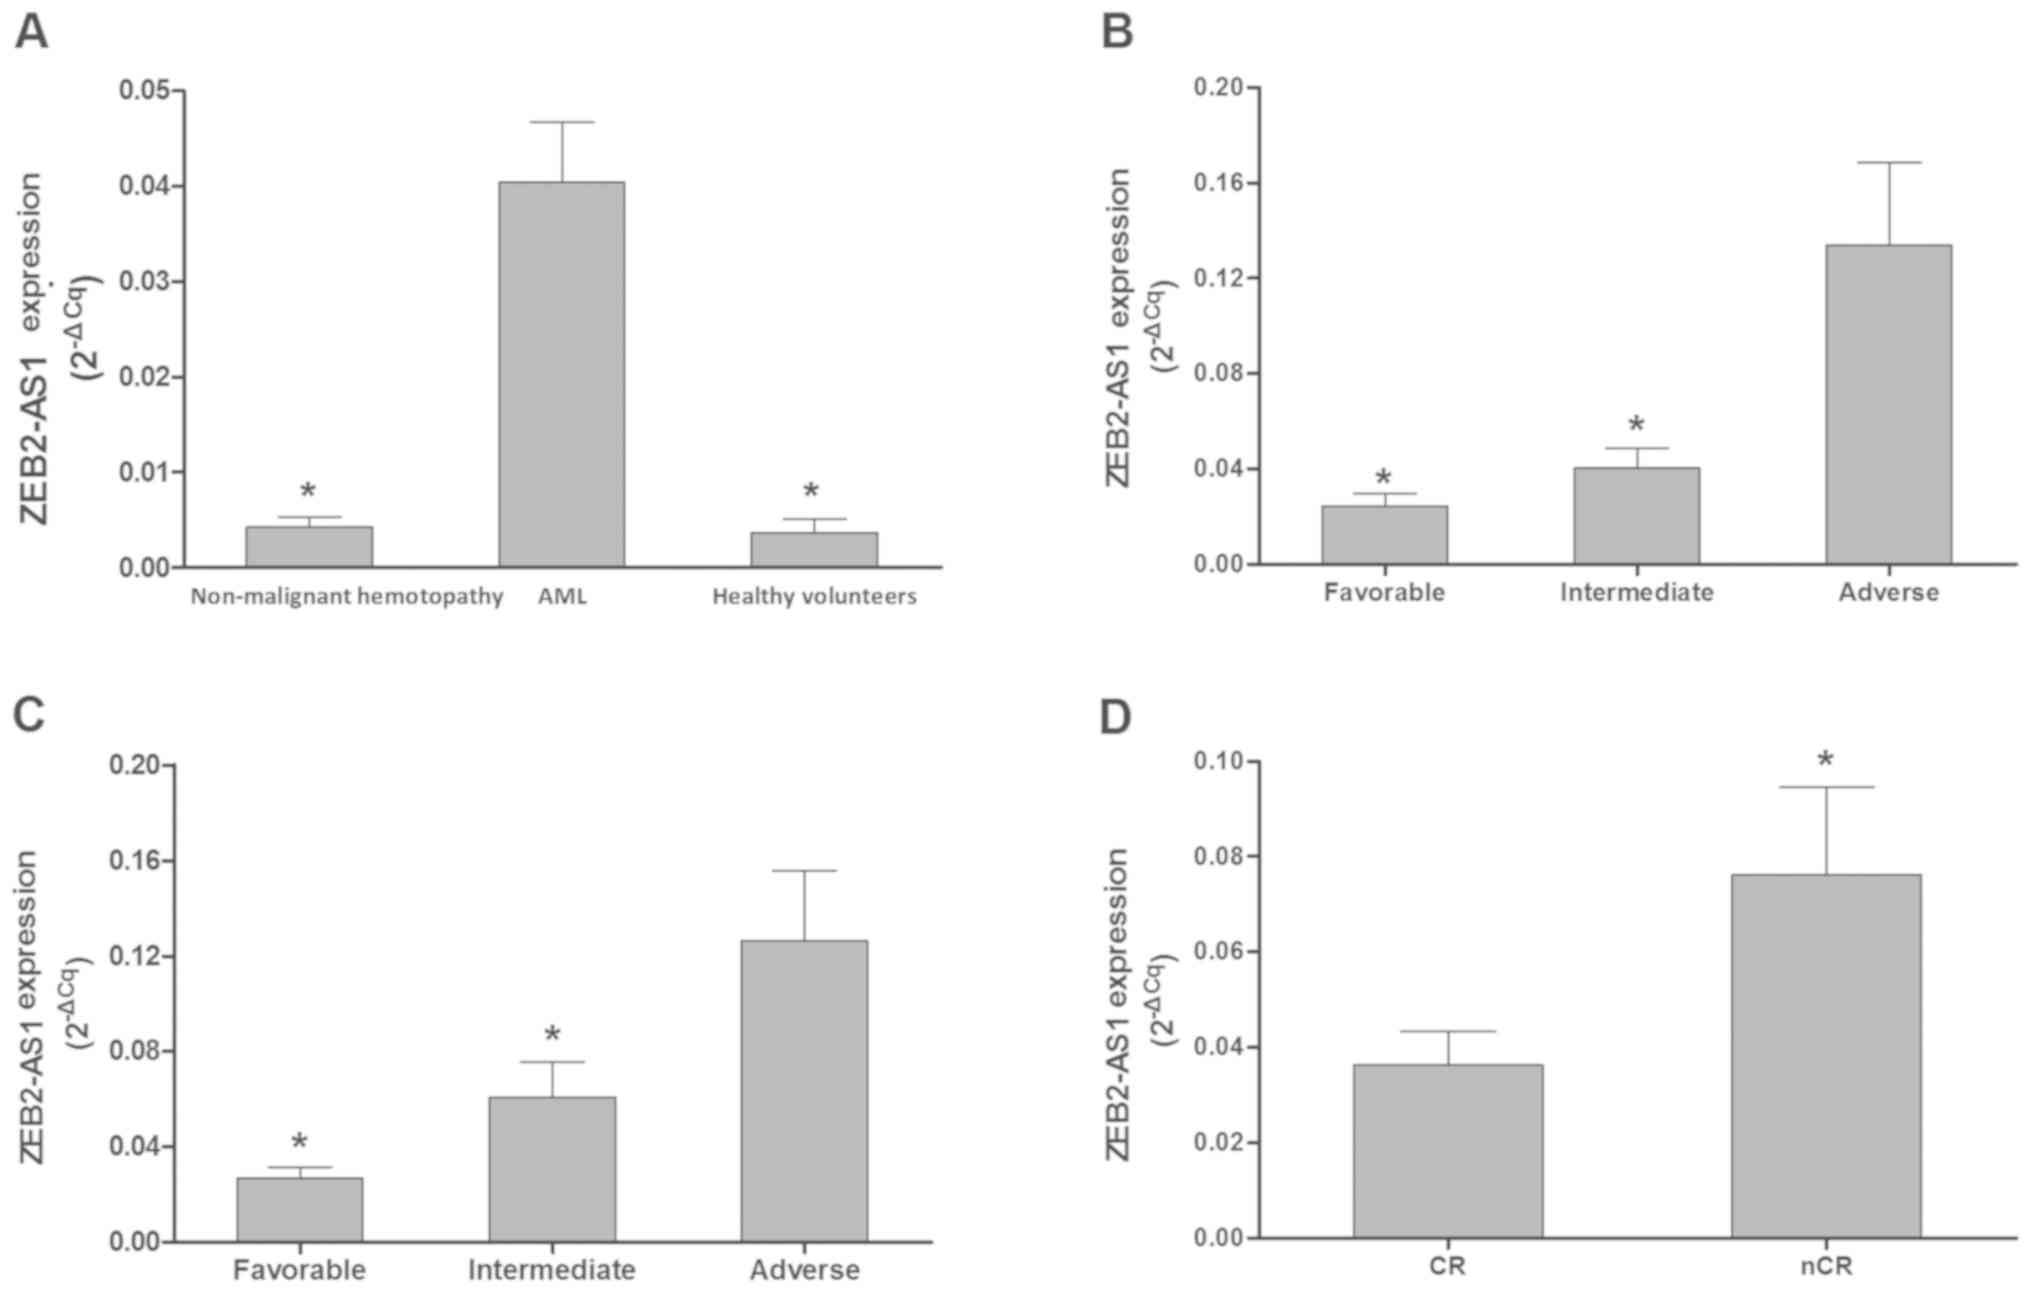
Expression of ZEB2-AS1 lncRNA in
patients with AML
Using the Affymetrix Human LncRNA microarray, dozens
of abnormally expressed lncRNAs were identified in patients with
AML. ZEB2-AS1 lncRNA was identified to be substantially
overexpressed in patients with AML with a karyotype of 11q23 when
compared with karyotypes such as t(15;17), t(8;21) and inv
(16). Therefore, the ZEB-AS1 lncRNA
was selected for further analysis in the following experiments. To
further confirm the microarray results, RT-qPCR was performed; the
results revealed that the expression levels of ZEB-AS1 lncRNA in
the AML group (n=62) were significantly higher compared with that
of the patients with non-malignant hemotopathy (n=10; P<0.001;
Fig. 1A) and healthy volunteers
(n=4; P=0.010; Fig. 1A). In
addition, the expression levels of ZEB-AS1 lncRNA were positively
associated with increasing AML risk levels, according to modified
MRC and ELN recommendations (Fig. 1B and
C). Furthermore, the expression levels of ZEB-AS1 lncRNA were
significantly higher in patients with AML that had not achieved CR
(n=15) compared with those who had (n=24) subsequent to the first
induction of chemotherapy (P=0.042; Fig.
1D).
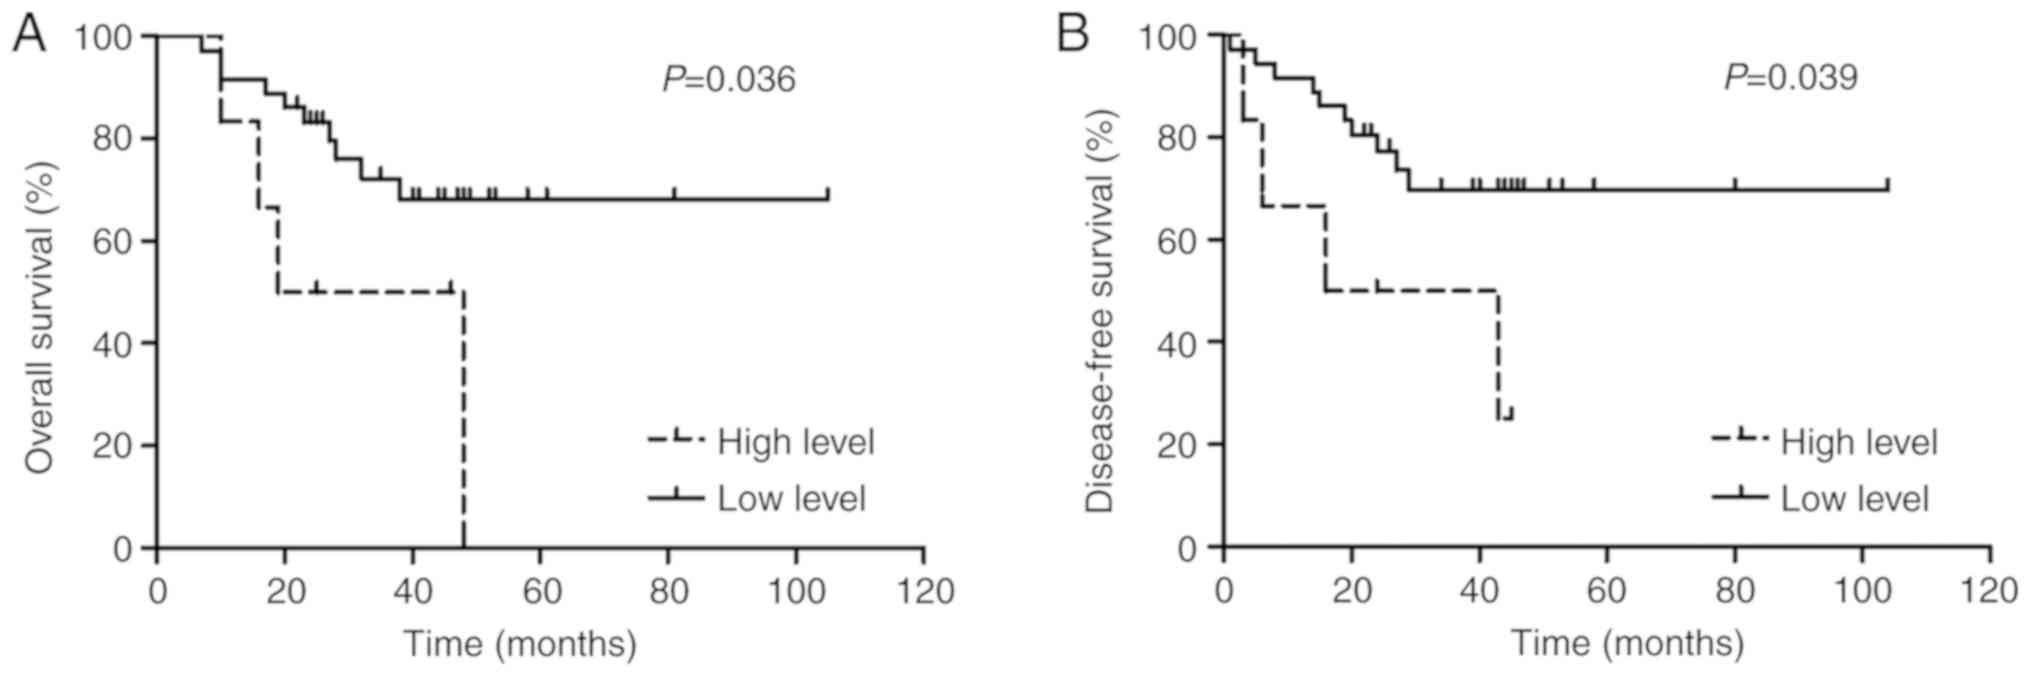
ZEB2-AS1 lncRNA expression and AML
clinical outcomes
In the present study, ZEB2-AS1 lncRNA expression
levels greater than the 75th percentile were considered to be high
expression levels whereas those below were considered to be low,
respectively. Overall, 42 AML cases had available survival data. As
presented in Fig. 2, Kaplan-Meier
survival plots indicated that patients with AML with high ZEB2-AS1
lncRNA expression (n=6) had significantly shorter OS (3-year OS,
0.0 vs. 68.2%; P=0.036) and lower DFS rates (3-year DFS, 25.0 vs.
69.8%; P=0.039) compared with that of the low expression subgroup
(n=36). Additionally, according to the modified MRC risk
stratification, in the favorable/intermediate risk group, patients
with AML with low ZEB2-AS1 lncRNA expression (n=36) had
significantly longer OS (3-year OS, 68.2 vs. 33.3%; P=0.026) and
higher DFS rates (3-year DFS, 69.8 vs. 33.3%; P=0.038) compared
with that of the high expression subgroup (n=3; Fig. 3A). Furthermore, according to the ELN
risk stratification, in the favorable/intermediate I/II risk
groups, patients with AML with low ZEB2-AS1 lncRNA expression
(n=23) had significantly longer OS (3-year OS, 69.9 vs. 50.0%;
P=0.034) and higher DFS rates (3-year DFS, 71.1 vs. 50.0%; P=0.034)
compared with that of the high expression subgroup (n=2; Fig. 3B). The expression levels of ZEB2-AS1
lncRNA in the adverse risk group were all comparatively high.
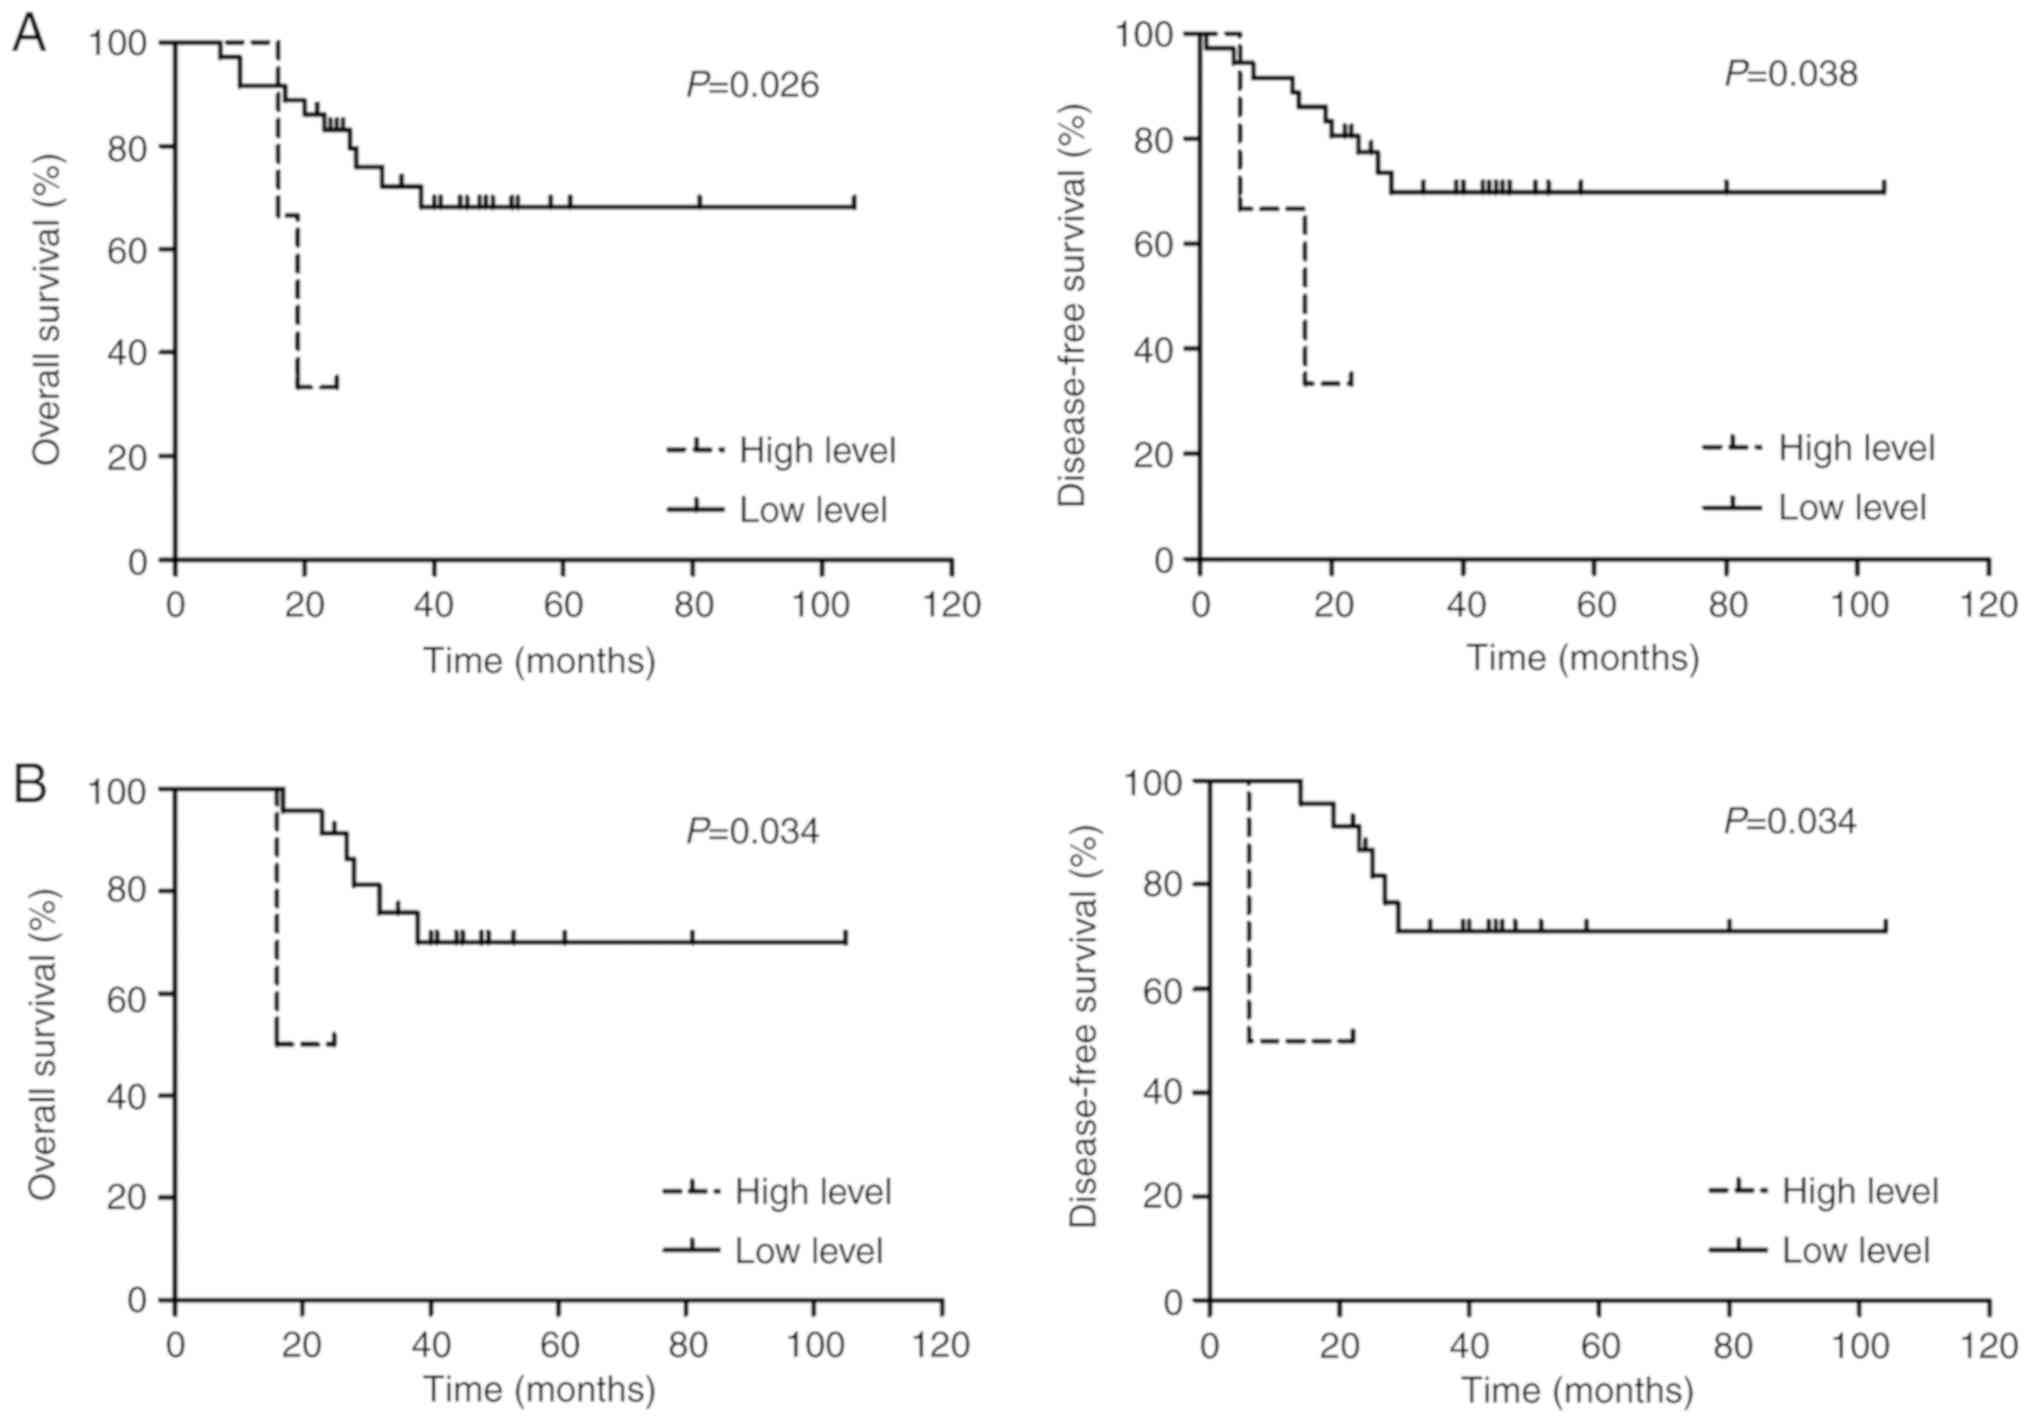 | Figure 3.Comparison of OS and DFS rates for
patients with AML in favorable/intermediate risk groups. (A)
According to the modified Medical Research Council risk
stratification recommendation, in the favorable/intermediate risk
group, patients with AML with a high expression of ZEB2-AS1 lncRNA
exhibited significantly shorter OS (3-year OS, 33.3 vs. 68.2%;
P=0.026) and DFS (3-year DFS, 33.3 vs. 69.8%; P=0.038) rates
compared with that of the low expression of ZEB2-AS1 lncRNA group.
(B) According to the European Leukemia Net risk stratification
recommendation, in the favorable/intermediate risk group, patients
with AML with a high expression of ZEB2-AS1 lncRNA demonstrated
significantly shorter OS (3-year OS, 50.0 vs. 69.9%; P=0.034) and
DFS (3-year DFS, 50.0 vs. 71.1%; P=0.034) rates compared with that
of the low expression of ZEB2-AS1 lncRNA group. OS, overall
survival; DFS, disease-free survival; AML, acute myeloid leukemia;
ZEB2-AS1, zinc finger E-box binding homeobox 2 antisense RNA 1;
lncRNA, long non-coding RNA. |
In the multivariate analyses, subsequent to
controlling for confounding variables in modified MRC
(favorable/intermediate vs. adverse) and ELN risk stratification
(favorable/intermediate I/II vs. adverse) groups, high ZEB2-AS1
lncRNA expression was determined to not be significantly associated
with adverse patient outcomes, including reduced OS (P=0.976) and
DFS rates (P=0.725; Table IV)
compared with the low ZEB2-AS1 lncRNA expression group.
| Table IV.Analysis of 3-year OS and 3-year DFS
rates in patients with AML. |
Table IV.
Analysis of 3-year OS and 3-year DFS
rates in patients with AML.
|
| 3-Year OS | 3-Year DFS |
|---|
|
|
|
|
|---|
|
| Univariate | Multivariate | Univariate | Multivariate |
|---|
|
|
|
|
|
|
|---|
| Factors | HR (95% CI) | P-value | HR (95% CI) | P-value | HR (95% CI) | P-value | HR (95% CI) | P-value |
|---|
| MRC: F/I vs.
adverse | 4.04
(1.06–227.70) | 0.047 | 0.51
(0.05–4.78) | 0.600 | 4.48
(1.33–373.10) | 0.031 | 0.68
(0.08–6.18) | 0.927 |
| ELN: F/I I/II vs.
adverse | 3.95
(1.78–66.90) | 0.011 | 4.07
(1.25–13.22) | 0.020 | 4.39
(2.17–95.66) | 0.006 | 4.52
(1.40–14.69) | 0.012 |
| ZEB2-AS1 level: low
vs. high | 3.20
(1.15–32.24) | 0.036 | 1.28
(0.24–6.89) | 0.976 | 3.17
(1.10–30.42) | 0.039 | 1.04
(0.19–5.75) | 0.725 |
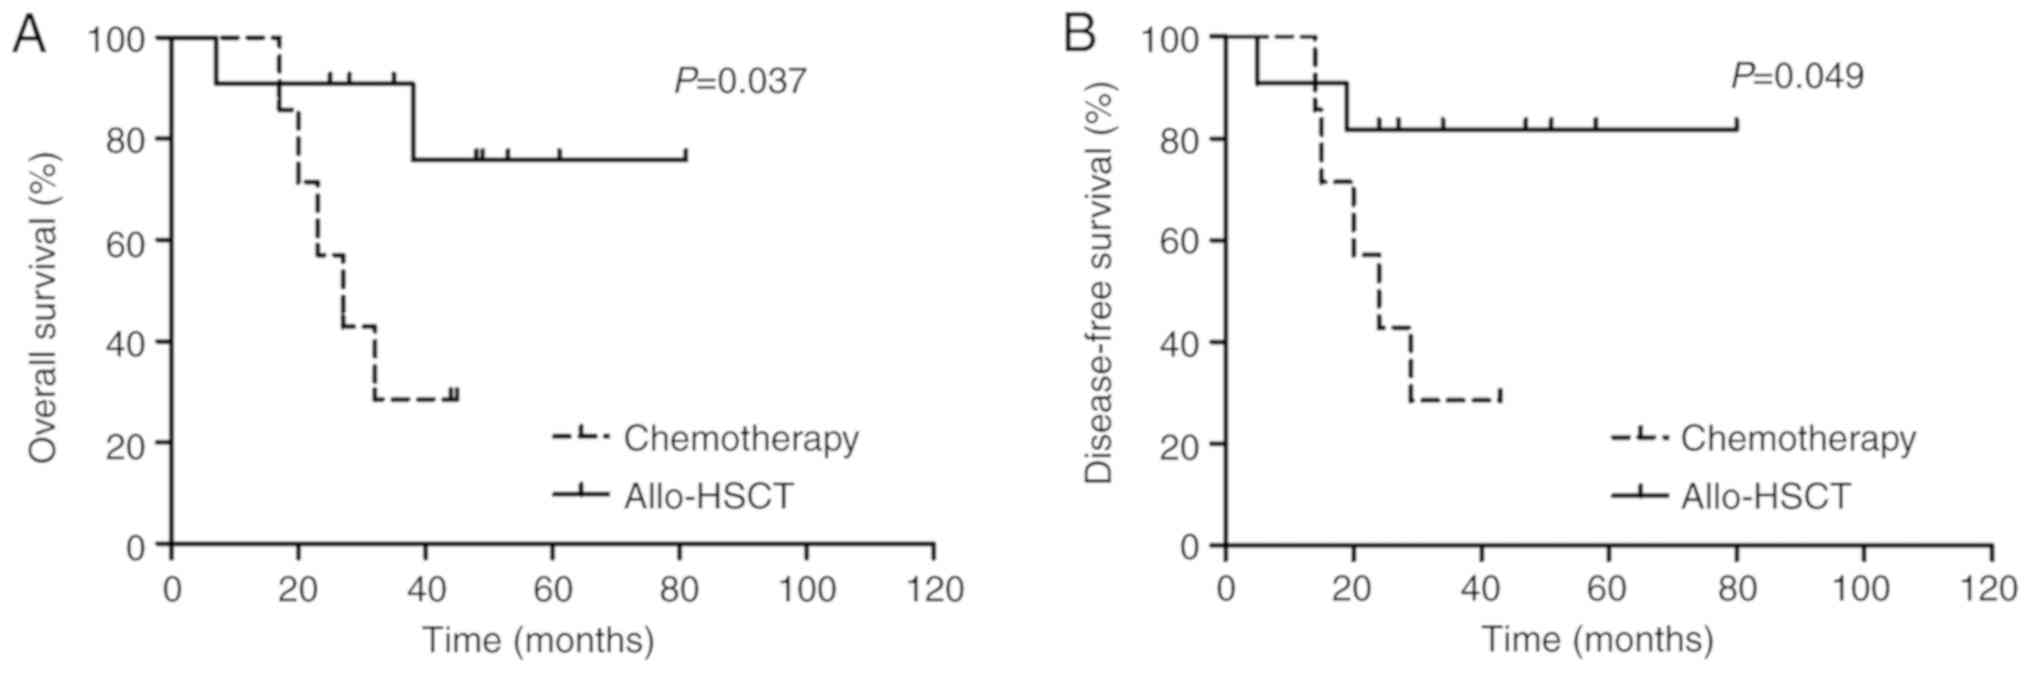
ZEB2-AS1 lncRNA expression and AML
treatment response
Patients with AML with high ZEB2-AS1 lncRNA
expression, excluding those classed as the M3 subtype, had a
significantly lower CR rate compared with that of the low
expression subgroup (P=0.031; Table
I). However, differences between the OS and DFS rates in the
consolidation chemotherapy (n=10) and allo-HSCT treatment groups
(n=14) were not significantly different (P>0.05; Table III). Using the stratification
method to control for confounding variables, as presented in
Fig. 4, it was demonstrated that
patients with a low ZEB2-AS1 lncRNA expression within the allo-HSCT
treatment group (n=11) had significantly longer OS (3-year OS, 75.8
vs. 28.6%; P=0.037) and DFS rates (3-year DFS, 81.8 vs. 28.6%;
P=0.049) compared with that of the chemotherapy group (n=7).
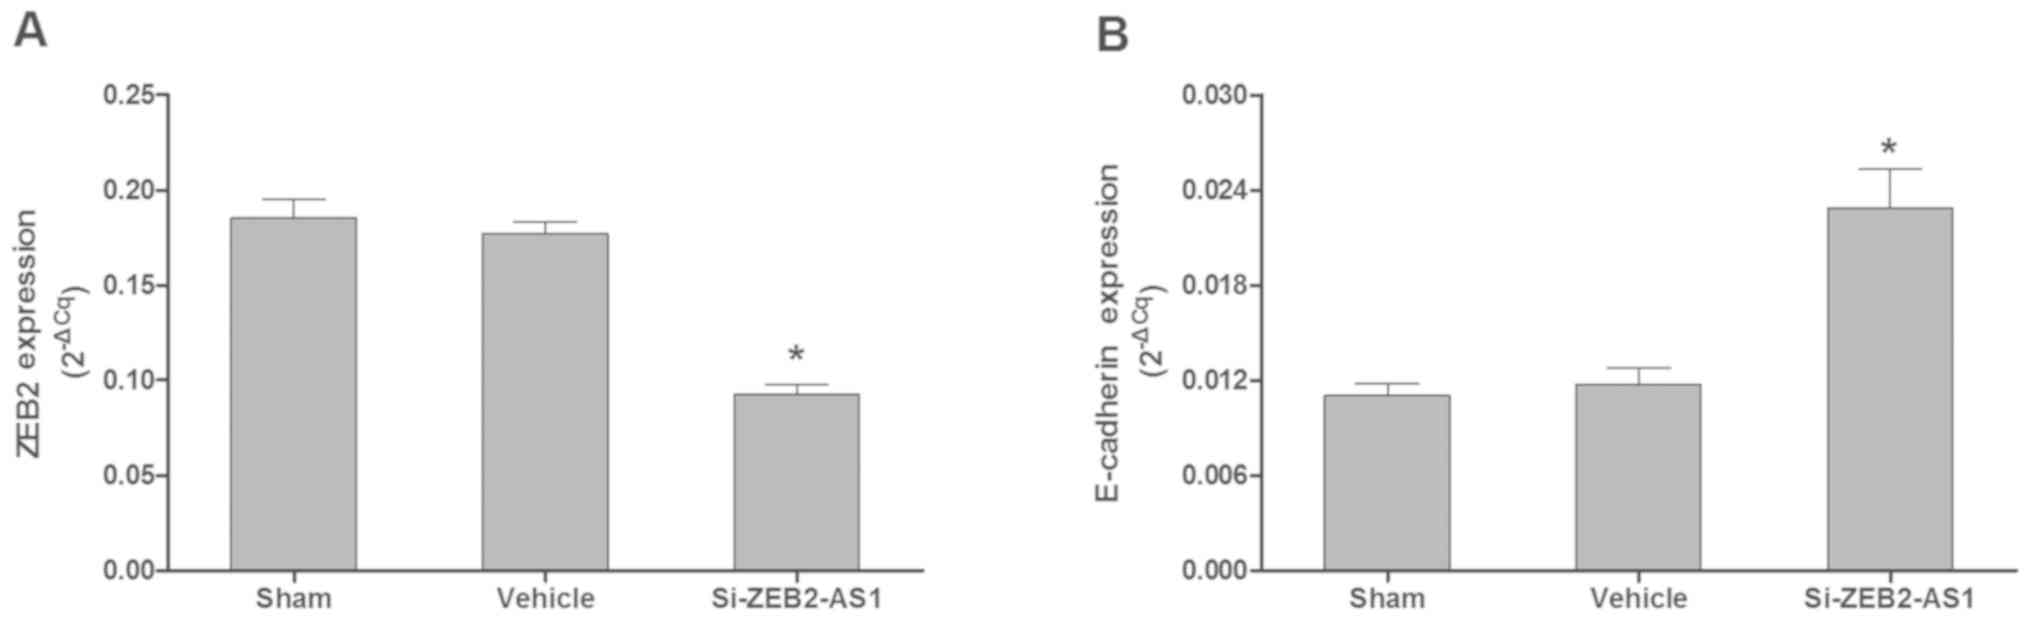
ZEB2-AS1 lncRNA expression and AML
cell biological phenotype
Knockdown of ZEB2-AS1 lncRNA by siRNA in THP-1 cells
significantly inhibited the mRNA expression levels of ZEB2 (n=4;
P<0.05) and stimulated the mRNA expression levels of E-cadherin
(n=4; P<0.05) compared with the sham and vehicle groups
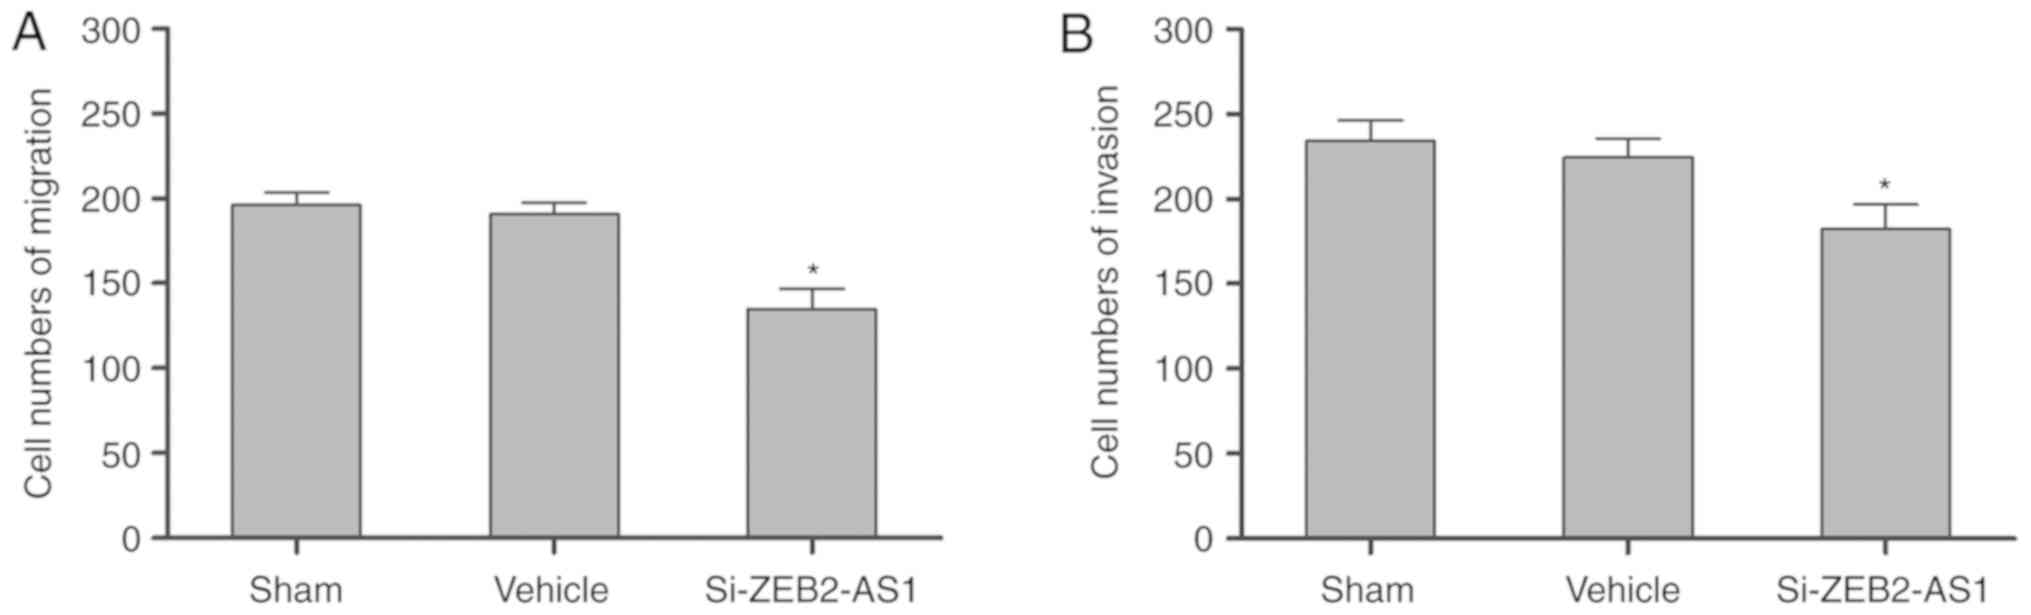
(Fig. 5A and B). As presented in
Fig. 6A and B, the migration (n=4)
and invasion (n=4) of THP-1 cells, respectively, were significantly
inhibited by the knockdown of ZEB2-AS1 lncRNA compared with the
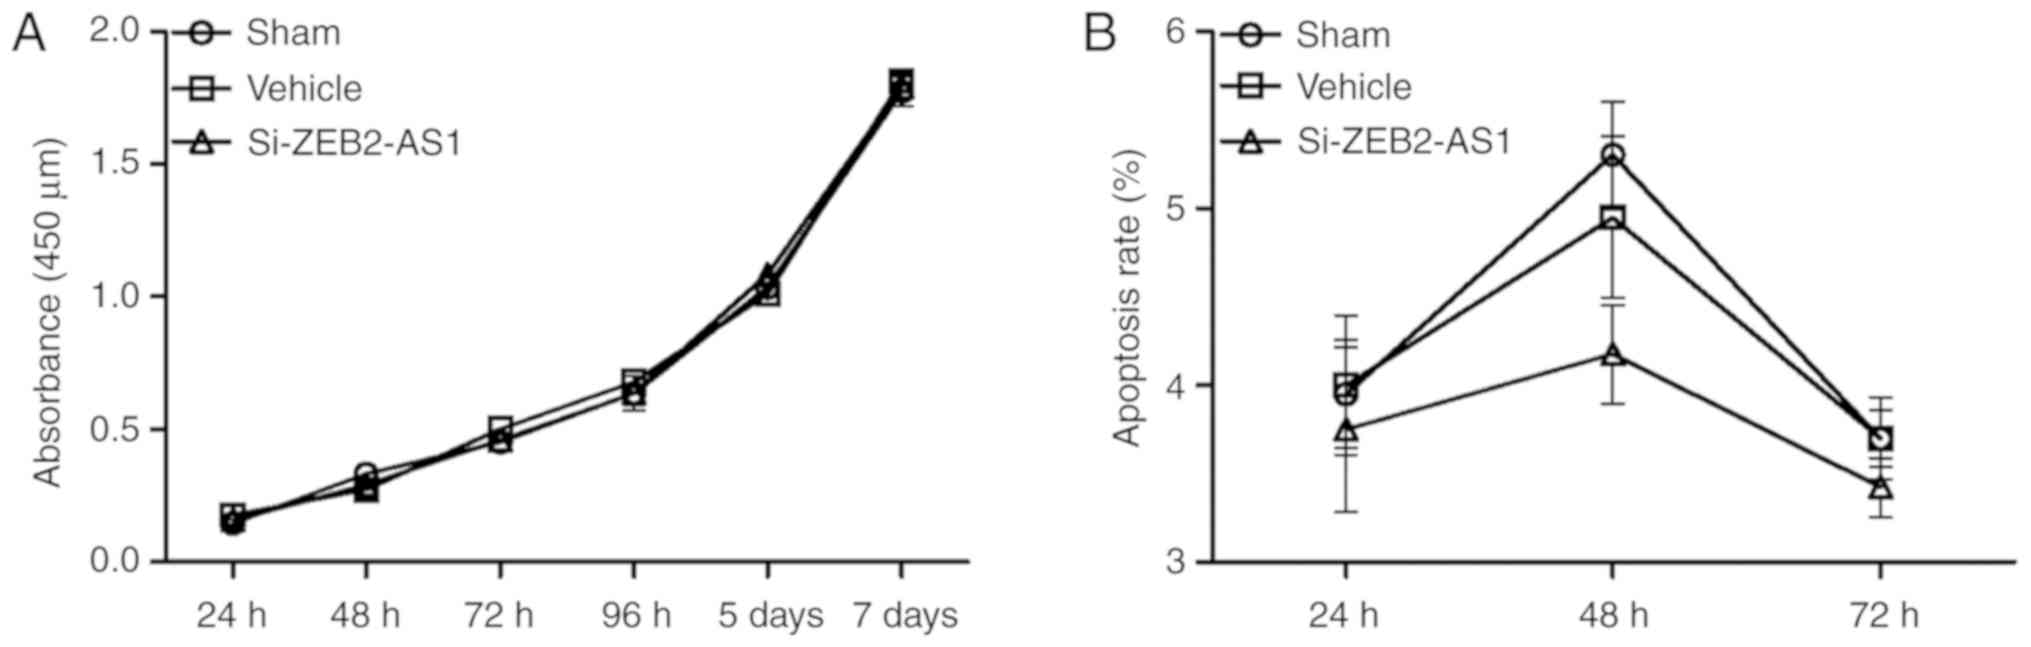
sham and vehicle groups (P<0.05). THP-1 cell proliferation (n=4)
and apoptosis (n=4) were not significantly different following the
knockdown of ZEB2-AS1 lncRNA compared with the sham and vehicle
groups (Fig. 7A and B).
Discussion
In the present study, it was proposed that the
abnormal overexpression of ZEB2-AS1 lncRNA may be closely
associated with adverse outcomes in patients with AML, and may
exert functional roles in regulating biological behaviors. By
retrospectively analyzing 62 patients with de novo AML, the
present study contributed novel results to the literature,
demonstrating that the expression of ZEB2-AS1 lncRNA was abnormally
elevated and may have potential as an epigenetic biomarker for
evaluating the clinical outcomes of AML. Furthermore, it was
revealed that ZEB2-AS1 lncRNA effectively modulated leukemic
phenotypes including the invasion and migration of an AML cell
line.
The association between ZEB2-AS1 lncRNA expression
and a series of clinical features, cytogenetic characteristics,
somatic mutations and clinical outcomes in patients with AML was
initially investigated. The results revealed that the expression of
ZEB2-AS1 lncRNA was significantly higher in the AML group compared
with that of a non-malignant group (P<0.001, Fig. 1A). This indicated that the
overexpression of ZEB2-AS1 lncRNA may function as a cancer-specific
molecular signal in leukemogenesis. With respect to the identified
karyotype and recurrent mutations, according to either the modified
MRC or ELN risk stratification recommendations (37–39), the
expression levels of ZEB2-AS1 lncRNA had a significant stepwise
increase from the favorable to adverse risk group (all P<0.05,
Fig. 1B and C). Additionally, the
high expression of ZEB2-AS1 lncRNA was associated with adverse
patient outcomes compared with the low expression of ZEB2-AS1
lncRNA (Table I). This suggests that
the overexpression of ZEB2-AS1 lncRNA is closely associated with a
higher risk in AML.
Accumulating evidence has revealed that numerous
lncRNAs may independently predict the prognosis for patients with
cancer (23,42–44).
Notably, previous research has indicated that lncRNAs expression
profiles have the potential to independently predict clinical
outcomes in AML (21). Novel studies
have further demonstrated that, due to its extensive oncogenic
functions, the overexpression of HOTAIR lncRNA predicts poor
clinical outcomes in AML and may be a potential therapeutic target
(25). In the present study, to
evaluate the potential of its prognostic application, the impact of
ZEB2-AS1 lncRNA overexpression on OS and DFS rates in patients with
AML was measured. Univariate analyses revealed that patients with
high ZEB2-AS1 lncRNA expression had significantly shorter OS and
DFS rates compared with the low ZEB2-AS1 lncRNA expression group
(all P<0.05, Table III;
Fig. 2). However, using the method
of multivariate analyses to control for confounding variables, the
adjusted 3-year OS and DFS rates were not significantly different
between patients with AML with different expression levels (high
vs. low) of ZEB2-AS1 lncRNA (Table
IV). Furthermore, it was demonstrated that in the
favorable/intermediate risk group, patients with a higher
expression of ZEB2-AS1 lncRNA exhibited significantly shorter OS
and DFS rates compared with those with a lower expression (all
P<0.05, Fig. 3). Therefore, it
was proposed that although its independent prognostic value for
survival was not rigorously ascertained, the expression levels of
ZEB2-AS1 lncRNA may function as a complementary factor to further
improve conventional risk stratification models in AML.
Treatment responses in AML are notably heterogeneous
and affected by various demographic and biological factors
(45–47). To minimize influences of different
treatment approaches on clinical outcome interpretation, patients
enrolled in the present cohort were treated with an identical
induction chemotherapy regimen. It was revealed that the expression
levels of ZEB2-AS1 lncRNA were significantly higher in patients who
did not achieve initial CR compared with those who did (P=0.042,
Fig. 1D). In addition, patients with
a high expression of ZEB2-AS1 lncRNA had a significantly lower CR
rate compared with those with a low expression of ZEB2-AS1 lncRNA
(P=0.031, Table I). This
demonstrated that the overexpression of ZEB2-AS1 lncRNA may be
closely associated with chemotherapy resistance. Following
front-line induction chemotherapy, patients with AML received
either consolidation chemotherapy or allo-HSCT. The results
revealed that differences between the 3-year OS and DFS rates in
the consolidation chemotherapy and allo-HSCT treatment groups were
not significantly different (Table
III). Furthermore, using stratification to control for
confounding variables, patients with low ZEB2-AS1 lncRNA expression
in the allo-HSCT-treated group had a significantly longer OS and
DFS compared with that of the chemotherapy group (all P<0.05,
Fig. 4). This suggested that
patients with AML with a low expression of ZEB2-AS1 lncRNA may be
more sensitive to allo-HSCT therapy. In comparison with the
relatively static genetic landscape, epigenetic status, including
DNA methylation, is altered during different phases of AML
(13). However, dynamic changes in
ZEB2-AS1 lncRNA expression in this retrospective cohort could not
be evaluated, and the association of ZEB2-AS1 lncRNA with treatment
responses requires further consolidation by future prospective
studies.
The limitations of the present clinical study should
be considered carefully. From a clinical point of view, therapeutic
strategies for AML have improved in previous years (47). Additionally, cytogenetic/molecular
risk stratification systems remain controversial and require
further improvement (7,9,11). These
all affect the prognostic importance of ZEB2-AS1 lncRNA in AML to
varying degrees. Furthermore, from a statistical point of view, the
retrospective cohort size in the present study was relatively
small, which may have affected the multivariate analysis results.
Thus, a future study with a large cohort must be retrospectively
and/or prospectively analyzed to further assess the prognostic
value of ZEB2-AS1 lncRNA for patient survival and treatment
response in AML, independent of various approved clinical
factors.
Increasing evidence has demonstrated that various
lncRNAs serve essential functions in not only in intrinsic cellular
regulatory networks, but also in intercellular communications
during tumorigenesis (23). Multiple
lncRNAs have been confirmed to function as original drivers and/or
downstream targets in circuits involving almost all hallmarks of
cancer, including proliferation, viability, immortality, motility,
angiogenesis and tumor suppression (23,48).
Previously, it has been reported that a natural antisense
transcript of ZEB2 may regulate the EMT in different tumor types,
including colon adenocarcinoma (35). The highly-conserved zinc-finger
structure of ZEB2 binds to E-boxes located in the promoter regions
of certain target genes including E-cadherin, so as to further
regulate EMT in cancer progression (49,50).
Novel results have demonstrated that abnormal expression of ZEB1
may promote cellular proliferation and tumor growth in mantle cell
lymphoma (51). Furthermore, ZEB1
expression is controlled by growth arrest specific 5-AS1 lncRNA to
modulate cell migration and invasion in non-small cell lung cancer
(52). Notably, a novel ZEB2-BAF
chromatin remodeling complex subunit BCL11B fusion gene has been
identified in patients with AML with karyotype of t(2;14)(q22;q32),
which may be a potential leukemogenic regulator in tumorigenesis
(53). In the present study, the
results revealed that the knockdown of ZEB2-AS1 lncRNA in THP-1
cells effectively downregulated the mRNA expression of ZEB2
(Fig. 5A), which was consistent with
the results of a previous study (35). In addition, the knockdown of ZEB2-AS1
lncRNA in THP-1 cells significantly increased the mRNA expression
of E-cadherin compared with the sham/vehicle groups (all P<0.05,
Fig. 5B), and the repression of
E-cadherin has been demonstrated to trigger the EMT in cancer
progression (54). In addition, it
was revealed that cellular migration and invasion were
significantly inhibited in THP-1 cells following ZEB2-AS1 lncRNA
downregulation by si-ZEB2-AS1 (all P<0.05, Fig. 6). However, the knockdown of ZEB2-AS1
lncRNA in THP-1 cells had no apparent effects on proliferation and
apoptosis (Fig. 7). Accordingly, it
was proposed that ZEB2-AS1 lncRNA may have upregulated ZEB2
expression, which in turn enhanced the motility phenotype of THP-1
cells, including their invasion and migration abilities in
vitro. These results suggested that chemotherapy resistance in
patients with a high expression of ZEB2-AS1 lncRNA may be closely
associated with enhanced cellular migration and invasion during
leukemic progression. This would be consistent with the results of
a previous study that demonstrated that ZEB family protein
expression may predict differential responses to various
chemotherapy drugs in hematopoietic malignancies, including mantle
cell lymphoma (51).
In conclusion, to the best of our knowledge, the
present study was the first to evaluate the prognostic value of
ZEB2-AS1 lncRNA in AML. The results demonstrated that the
overexpression of ZEB2-AS1 lncRNA was associated with poor clinical
outcomes in AML. Although the independent prognostic prediction for
survival was not rigorously researched in the present study, the
overexpression of ZEB2-AS1 lncRNA may function as a candidate gene
to improve cytogenetic/somatic mutation risk stratification systems
in AML. Furthermore, it was discovered that ZEB2-AS1 lncRNA
effectively modulated the leukemic phenotypes of invasion and
migration, which may be associated with the differential responses
to treatment strategies. Finally, another question must be
addressed-why is ZEB2-AS1 lncRNA overexpressed in AML? It was noted
that the expression levels of ZEB2-AS1 lncRNA in the AML group
exhibit high heterogeneity, with greater variability compared with
that of the non-malignant group. Furthermore, in patients with AML
with a karyotype of 11q23, ZEB2-AS1 lncRNA expression was notably
high. AML pathogenesis with a 11q23 karyotype involves the abnormal
rearrangement of the mixed lineage leukemia gene, which is an
epigenetic modifier involved in histone methylation (55). It was hypothesized that the
overexpression of ZEB2-AS1 lncRNA may not be a key event during
leukemogenesis, but a downstream target of other key oncogenic
events. As previously mentioned, the expression profiling of
lncRNAs is able to independently evaluate survival in older
patients with cytogenetically normal AML (21). A novel study revealed that the
combination of >1 lncRNA (i.e. a six-lncRNA signature) may be
strongly associated with survival in diffuse large B-cell lymphoma
(44). This suggests that one lncRNA
alone may be not sufficient in independently predicting the
survival of patients with AML. These key problems require thorough
investigation in the future.
Acknowledgements
Not applicable.
Funding
This work was supported by the Priority Academic
Program Development of Jiangsu Higher Education Institutions, the
National Clinical Key Subject Project, the Innovation Capability
Development Project of Jiangsu Province (grant no. BM2015004), the
Natural Science Foundation of China (grant nos. 81570139 and
81270617), the Jiangsu Provincial Special Program of Medical
Science (grant no. BL2012005), Jiangsu Province's Key Medical
Center (grant no. ZX201102), the Jiangsu Province Natural Science
Fund (grant no. BE2015639), the Project of Natural Science
Foundation of Jiangsu Province (grant no. BK20141201) and the
National Natural Science Foundation of China Youth Fund Project
(grant no. 81300424).
Availability of data and materials
The datasets used and analyzed during the current
study are available from the corresponding author on reasonable
request.
Authors' contributions
XS finished all the experiments, analyzed and
interpreted the patient data, and was a major contributor in
writing the manuscript. JL finished most of the experiments. LM,
LW, QW and HY performed some experiments. CR and DW had substantial
contributions to the conception and design of the work. XZ and SC
designed the study and took final responsibility. All authors read
and approved the final manuscript.
Ethics approval and consent to
participate
The present study was approved by the Institutional
Review Board of the First Affiliated Hospital of Soochow University
Written informed consent was obtained from all participants for the
use of bone marrow specimens and clinical information.
Patient consent for publication
Not applicable.
Competing interests
The authors declare that they have no competing
interests.
References
|
1
|
Döhner H, Weisdorf DJ and Bloomfield CD:
Acute myeloid leukemia. N Engl J Med. 373:1136–1152. 2015.
View Article : Google Scholar : PubMed/NCBI
|
|
2
|
Polednak AP: Recent improvement in
completeness of incidence data on acute myeloid leukemia in US
cancer registries. J Registry Manag. 41:77–84. 2014.PubMed/NCBI
|
|
3
|
Tawfik B, Pardee TS, Isom S, Sliesoraitis
S, Winter A, Lawrence J, Powell BL and Klepin HD: Comorbidity, age,
and mortality among adults treated intensively for acute myeloid
leukemia (AML). J Geriatr Oncol. 7:24–31. 2016. View Article : Google Scholar : PubMed/NCBI
|
|
4
|
Almeida AM and Ramos F: Acute myeloid
leukemia in the older adults. Leuk Res Rep. 6:1–7. 2016.PubMed/NCBI
|
|
5
|
Percival ME, Tao L, Medeiros BC and Clarke
CA: Improvements in the early death rate among 9,380 patients with
acute myeloid leukemia after initial therapy: A SEER database
analysis. Cancer. 121:2004–2012. 2015. View Article : Google Scholar : PubMed/NCBI
|
|
6
|
Bhatnagar B and Garzon R: The use of
molecular genetics to refine prognosis in acute myeloid leukemia.
Curr Hematol Malig Rep. 9:148–157. 2014. View Article : Google Scholar : PubMed/NCBI
|
|
7
|
Stölzel F, Mohr B, Kramer M, Oelschlägel
U, Bochtler T, Berdel WE, Kaufmann M, Baldus CD, Schäfer-Eckart K,
Stuhlmann R, et al: Karyotype complexity and prognosis in acute
myeloid leukemia. Blood Cancer J. 6:e3862016. View Article : Google Scholar : PubMed/NCBI
|
|
8
|
Mrózek K and Bloomfield CD: Chromosome
aberrations, gene mutations and expression changes, and prognosis
in adult acute myeloid leukemia. Hematology Am Soc Hematol Educ
Program. 2006:169–177. 2006. View Article : Google Scholar
|
|
9
|
Papaemmanuil E, Gerstung M, Bullinger L,
Gaidzik VI, Paschka P, Roberts ND, Potter NE, Heuser M, Thol F,
Bolli N, et al: Genomic classification and prognosis in acute
myeloid leukemia. N Engl J Med. 374:2209–2221. 2016. View Article : Google Scholar : PubMed/NCBI
|
|
10
|
Byun JM, Kim YJ, Yoon HJ, Kim SY, Kim HJ,
Yoon J, Min YH, Cheong JW, Park J, Lee JH, et al: Cytogenetic
profiles of 2,806 patients with acute myeloid leukemia-a
retrospective multicenter nationwide study. Ann Hematol.
95:1223–1232. 2016. View Article : Google Scholar : PubMed/NCBI
|
|
11
|
Li S, Mason CE and Melnick A: Genetic and
epigenetic heterogeneity in acute myeloid leukemia. Curr Opin Genet
Dev. 36:100–106. 2016. View Article : Google Scholar : PubMed/NCBI
|
|
12
|
Cancer Genome Atlas Research Network, ;
Ley TJ, Miller C, Ding L, Raphael BJ, Mungall AJ, Robertson A,
Hoadley K, Triche TJ Jr, Laird PW, et al: Genomic and epigenomic
landscapes of adult de novo acute myeloid leukemia. N Engl J Med.
368:2059–2074. 2013. View Article : Google Scholar : PubMed/NCBI
|
|
13
|
Li S, Garrett-Bakelman FE, Chung SS,
Sanders MA, Hricik T, Rapaport F, Patel J, Dillon R, Vijay P, Brown
AL, et al: Distinct evolution and dynamics of epigenetic and
genetic heterogeneity in acute myeloid leukemia. Nat Med.
22:792–799. 2016. View
Article : Google Scholar : PubMed/NCBI
|
|
14
|
Sasca D and Huntly BJ: Independence of
epigenetic and genetic diversity in AML. Nat Med. 22:708–709. 2016.
View Article : Google Scholar : PubMed/NCBI
|
|
15
|
Mattick JS and Makunin IV: Non-coding RNA.
Hum Mol Genet 15 Spec No. 1:R17–R29. 2006. View Article : Google Scholar
|
|
16
|
Morris KV and Mattick JS: The rise of
regulatory RNA. Nat Rev Genet. 15:423–437. 2014. View Article : Google Scholar : PubMed/NCBI
|
|
17
|
Djebali S, Davis CA, Merkel A, Dobin A,
Lassmann T, Mortazavi A, Tanzer A, Lagarde J, Lin W, Schlesinger F,
et al: Landscape of transcription in human cells. Nature.
489:101–108. 2012. View Article : Google Scholar : PubMed/NCBI
|
|
18
|
Iyer MK, Niknafs YS, Malik R, Singhal U,
Sahu A, Hosono Y, Barrette TR, Prensner JR, Evans JR, Zhao S, et
al: The landscape of long noncoding RNAs in the human
transcriptome. Nat Genet. 47:199–208. 2015. View Article : Google Scholar : PubMed/NCBI
|
|
19
|
Goff LA and Rinn JL: Linking RNA biology
to lncRNAs. Genome Res. 25:1456–1465. 2015. View Article : Google Scholar : PubMed/NCBI
|
|
20
|
Ling H, Vincent K, Pichler M, Fodde R,
Berindan-Neagoe I, Slack FJ and Calin GA: Junk DNA and the long
non-coding RNA twist in cancer genetics. Oncogene. 34:5003–5011.
2015. View Article : Google Scholar : PubMed/NCBI
|
|
21
|
Garzon R, Volinia S, Papaioannou D,
Nicolet D, Kohlschmidt J, Yan PS, Mrózek K, Bucci D, Carroll AJ,
Baer MR, et al: Expression and prognostic impact of lncRNAs in
acute myeloid leukemia. Proc Natl Acad Sci USA. 111:18679–18684.
2014. View Article : Google Scholar : PubMed/NCBI
|
|
22
|
Morlando M, Ballarino M and Fatica A: Long
non-coding RNAs: New players in hematopoiesis and leukemia. Front
Med (Lausanne). 2:232015.PubMed/NCBI
|
|
23
|
Schmitt AM and Chang HY: Long noncoding
RNAs in cancer pathways. Cancer Cell. 29:452–463. 2016. View Article : Google Scholar : PubMed/NCBI
|
|
24
|
Zhang X, Lian Z, Padden C, Gerstein MB,
Rozowsky J, Snyder M, Gingeras TR, Kapranov P, Weissman SM and
Newburger PE: A myelopoiesis-associated regulatory intergenic
noncoding RNA transcript within the human HOXA cluster. Blood.
113:2526–2534. 2009. View Article : Google Scholar : PubMed/NCBI
|
|
25
|
Xing CY, Hu XQ, Xie FY, Yu ZJ, Li HY,
Bin-Zhou, Wu JB, Tang LY and Gao SM: Long non-coding RNA HOTAIR
modulates c-KIT expression through sponging miR-193a in acute
myeloid leukemia. FEBS Lett. 589:1981–1987. 2015. View Article : Google Scholar : PubMed/NCBI
|
|
26
|
Ma L, Bajic VB and Zhang Z: On the
classification of long non-coding RNAs. RNA Biol. 10:925–933. 2013.
View Article : Google Scholar : PubMed/NCBI
|
|
27
|
Mattick JS and Rinn JL: Discovery and
annotation of long noncoding RNAs. Nat Struct Mol Biol. 22:5–7.
2015. View Article : Google Scholar : PubMed/NCBI
|
|
28
|
Khorkova O, Myers AJ, Hsiao J and
Wahlestedt C: Natural antisense transcripts. Hum Mol Genet.
23:R54–R63. 2014. View Article : Google Scholar : PubMed/NCBI
|
|
29
|
Katayama S, Tomaru Y, Kasukawa T, Waki K,
Nakanishi M, Nakamura M, Nishida H, Yap CC, Suzuki M, Kawai J, et
al: Antisense transcription in the mammalian transcriptome.
Science. 309:1564–1566. 2005. View Article : Google Scholar : PubMed/NCBI
|
|
30
|
ENCODE Project Consortium. An integrated
encyclopedia of DNA elements in the human genome. Nature.
489:57–74. 2012. View Article : Google Scholar : PubMed/NCBI
|
|
31
|
Su WY, Xiong H and Fang JY: Natural
antisense transcripts regulate gene expression in an epigenetic
manner. Biochem Biophys Res Commun. 396:177–181. 2010. View Article : Google Scholar : PubMed/NCBI
|
|
32
|
Wight M and Werner A: The functions of
natural antisense transcripts. Essays Biochem. 54:91–101. 2013.
View Article : Google Scholar : PubMed/NCBI
|
|
33
|
Ebralidze AK, Guibal FC, Steidl U, Zhang
P, Lee S, Bartholdy B, Jorda MA, Petkova V, Rosenbauer F, Huang G,
et al: PU.1 expression is modulated by the balance of functional
sense and antisense RNAs regulated by a shared cis-regulatory
element. Genes Dev. 22:2085–2092. 2008. View Article : Google Scholar : PubMed/NCBI
|
|
34
|
Sun J, Li W, Sun Y, Yu D, Wen X, Wang H,
Cui J, Wang G, Hoffman AR and Hu JF: A novel antisense long
noncoding RNA within the IGF1R gene locus is imprinted in
hematopoietic malignancies. Nucleic Acids Res. 42:9588–9601. 2014.
View Article : Google Scholar : PubMed/NCBI
|
|
35
|
Beltran M, Puig I, Peña C, García JM,
Alvarez AB, Peña R, Bonilla F and de Herreros AG: A natural
antisense transcript regulates Zeb2/Sip1 gene expression during
Snail1-induced epithelial-mesenchymal transition. Genes Dev.
22:756–769. 2008. View Article : Google Scholar : PubMed/NCBI
|
|
36
|
Arber DA, Orazi A, Hasserjian R, Thiele J,
Borowitz MJ, Le Beau MM, Bloomfield CD, Cazzola M and Vardiman JW:
The 2016 revision to the World Health Organization classification
of myeloid neoplasms and acute leukemia. Blood. 127:2391–2405.
2016. View Article : Google Scholar : PubMed/NCBI
|
|
37
|
Metzeler KH, Herold T, Rothenberg-Thurley
M, Amler S, Sauerland MC, Görlich D, Schneider S, Konstandin NP,
Dufour A, Bräundl K, et al: Spectrum and prognostic relevance of
driver gene mutations in acute myeloid leukemia. Blood.
128:686–698. 2016. View Article : Google Scholar : PubMed/NCBI
|
|
38
|
Grimwade D, Hills RK, Moorman AV, Walker
H, Chatters S, Goldstone AH, Wheatley K, Harrison CJ and Burnett
AK; National Cancer Research Institute Adult Leukaemia Working
Group, : Refinement of cytogenetic classification in acute myeloid
leukemia: Determination of prognostic significance of rare
recurring chromosomal abnormalities among 5876 younger adult
patients treated in the United Kingdom Medical Research Council
trials. Blood. 116:354–365. 2010. View Article : Google Scholar : PubMed/NCBI
|
|
39
|
Röllig C, Bornhäuser M, Thiede C, Taube F,
Kramer M, Mohr B, Aulitzky W, Bodenstein H, Tischler HJ, Stuhlmann
R, et al: Long-term prognosis of acute myeloid leukemia according
to the new genetic risk classification of the European LeukemiaNet
recommendations: Evaluation of the proposed reporting system. J
Clin Oncol. 29:2758–2765. 2011. View Article : Google Scholar : PubMed/NCBI
|
|
40
|
McGowan-Jordan J, Simons A and Schmid M:
An International System for Human Cytogenomic Nomenclature (2016).
Cytogenetic and Genome Research. 149:1–2. 2016.
|
|
41
|
Livak KJ and Schmittgen TD: Analysis of
relative gene expression data using real-time quantitative PCR and
the 2(−Delta Delta C(T)) method. Methods. 25:402–408. 2001.
View Article : Google Scholar : PubMed/NCBI
|
|
42
|
Wang KC and Chang HY: Molecular mechanisms
of long noncoding RNAs. Mol Cell. 43:904–914. 2011. View Article : Google Scholar : PubMed/NCBI
|
|
43
|
Bhan A and Mandal SS: lncRNA HOTAIR: A
master regulator of chromatin dynamics and cancer. Biochim Biophys
Acta. 1856:151–164. 2015.PubMed/NCBI
|
|
44
|
Sun J, Cheng L, Shi H, Zhang Z, Zhao H,
Wang Z and Zhou M: A potential panel of six-long non-coding RNA
signature to improve survival prediction of diffuse large-B-cell
lymphoma. Sci Rep. 6:278422016. View Article : Google Scholar : PubMed/NCBI
|
|
45
|
Schlenk RF, Dohner K, Krauter J, Fröhling
S, Corbacioglu A, Bullinger L, Habdank M, Späth D, Morgan M, Benner
A, et al: Mutations and treatment outcome in cytogenetically normal
acute myeloid leukemia. N Engl J Med. 358:1909–1918. 2008.
View Article : Google Scholar : PubMed/NCBI
|
|
46
|
Xu Y, Sun Y, Shen H, Ding L, Yang Z, Qiu
H, Sun A, Chen S and Wu D: Allogeneic hematopoietic stem cell
transplantation could improve survival of cytogenetically normal
adult acute myeloid leukemia patients with DNMT3A mutations. Am J
Hematol. 90:992–997. 2015. View Article : Google Scholar : PubMed/NCBI
|
|
47
|
Dombret H and Gardin C: An update of
current treatments for adult acute myeloid leukemia. Blood.
127:53–61. 2016. View Article : Google Scholar : PubMed/NCBI
|
|
48
|
Hanahan D and Weinberg RA: Hallmarks of
cancer: The next generation. Cell. 144:646–674. 2011. View Article : Google Scholar : PubMed/NCBI
|
|
49
|
Vandewalle C, Van Roy F and Berx G: The
role of the ZEB family of transcription factors in development and
disease. Cell Mol Life Sci. 66:773–787. 2009. View Article : Google Scholar : PubMed/NCBI
|
|
50
|
Hill L, Browne G and Tulchinsky E:
ZEB/miR-200 feedback loop: At the crossroads of signal transduction
in cancer. Int J Cancer. 132:745–754. 2013. View Article : Google Scholar : PubMed/NCBI
|
|
51
|
Sánchez-Tilló E, Fanlo L, Siles L,
Montes-Moreno S, Moros A, Chiva-Blanch G, Estruch R, Martinez A,
Colomer D, Győrffy B, et al: The EMT activator ZEB1 promotes tumor
growth and determines differential response to chemotherapy in
mantle cell lymphoma. Cell Death Differ. 21:247–257. 2014.
View Article : Google Scholar : PubMed/NCBI
|
|
52
|
Wu Y, Lyu H, Liu H, Shi X, Song Y and Liu
B: Downregulation of the long noncoding RNA GAS5-AS1 contributes to
tumor metastasis in non-small cell lung cancer. Sci Rep.
6:310932016. View Article : Google Scholar : PubMed/NCBI
|
|
53
|
Torkildsen S, Gorunova L, Beiske K,
Tjonnfjord GE, Heim S and Panagopoulos I: Novel ZEB2-BCL11B fusion
gene identified by RNA-sequencing in acute myeloid leukemia with
t(2;14)(q22;q32). PLoS One. 10:e01327362015. View Article : Google Scholar : PubMed/NCBI
|
|
54
|
Schmalhofer O, Brabletz S and Brabletz T:
E-cadherin, beta-catenin, and ZEB1 in malignant progression of
cancer. Cancer Metastasis Rev. 28:151–166. 2009. View Article : Google Scholar : PubMed/NCBI
|
|
55
|
Stein EM and Tallman MS: Mixed lineage
rearranged leukaemia: Pathogenesis and targeting DOT1L. Curr Opin
Hematol. 22:92–96. 2015. View Article : Google Scholar : PubMed/NCBI
|