Introduction
Glioma is a common malignant brain tumor that
threatens human health and accounts for approximately 42% of all
primary adult central nervous system tumors (1). Multiple cerebral glioma (MCG) is
relatively rare in clinic and has a low incidence, which is less
than 10% of the total number of gliomas (2). MCG can be divided into multicentric and
multifocal glioma by histopathology. Multifocal glioma infiltrates
adjacent parenchyma through cerebrospinal fluid (CSF), meninges and
white matter fiber tracts, and a large number of tumor cell
infiltration can be found in the lesion tissues (3). While multicentric glioma is a kind of
independent glioma, which is far away from partial or both cerebral
hemispheres. There is no relationship between the lesions under a
microscope, and their histological type can be the same or
different (4). The main clinical
treatment of MCG is surgery, but because of the invasive growth of
the tumors and no obvious boundary between the tumors and brain
tissues, resection cannot be performed in most patients, except
that the early MCG patients with tumors located in the appropriate
part can be completely removed (5).
Therefore, it is necessary to make timely diagnosis,
radiochemotherapy after surgery and other combined therapy to
improve the effect of clinical treatment.
Primary central nervous system lymphoma (PCNSL) is
an aggressive lymphoid neoplasm that can be seen in human cranial
nerves, meninges, spinal cord and eyes, with an incidence
accounting for approximately 1% of all non-Hodgkin lymphoma and
2–3% of brain tumors (6). Moreover,
its incidence in patients with low and normal immunity has
increased in recent years (7).
Chemotherapy is the main treatment for PCNSL, it can significantly
improve the overall survival rate of patients, and can even
completely eliminate lesions in some patients after treatment
(8).
MCG and PCNSL have the common characteristics of
infiltrative growth, high cell density and multiple lesions.
Therefore, there are a large overlap and some crossed cases
examined with conventional magnetic resonance imaging (MRI), which
makes it more difficult to differentiate them (9,10).
However, it is difficult to judge the invasion of surrounding
tissues by tumor cells according to the edema extent of lesions and
enhancement characteristics, and the treatment measures of the two
diseases are completely different. Therefore, accurate
identification before surgery is of great significance for the
follow-up treatment. The purpose of this study was to investigate
the diagnostic value and differential significance of MRI in MCG
and PCNSL patients by observing their MRI manifestations.
Patients and methods
General clinical data
A total of 21 patients with MCG diagnosed clinically
and pathologically in Zhangzhou Affiliated Hospital of Fujian
Medical University (Zhangzhou, China) from March 2016 to April 2017
were selected as group A, including 12 males and 9 females, aged
32–75 years with an average age of 56.13±12.82 years. Main clinical
symptoms: 16 cases of headache, 11 of dizziness, 7 of nausea, 5 of
speech disorder, 3 of limb weakness and 2 of slow reaction. Another
30 patients with PCNSL diagnosed in Zhangzhou Affiliated Hospital
of Fujian Medical University during the same period were selected
as group B, including 13 males and 17 females, aged 31–73 years
with an average age of 57.69±11.96 years. Main clinical symptoms:
25 cases of headache, 18 of dizziness, 11 of nausea, 5 of speech
disorder, 7 of limb weakness and 5 of slow reaction.
Inclusion and exclusion criteria
Inclusion criteria were: i) patients with MCG and
PCNSL confirmed by pathology and histology (11,12); ii)
patients with no previous history of chemotherapy, hormone therapy,
radiotherapy or craniocerebral surgery; and iii) patients with
normal immune function. Exclusion criteria were: i) patients in
pregnancy and lactation; ii) patients with other neoplasms, severe
liver and kidney dysfunction, connective tissue diseases, endocrine
metabolic diseases, hematopoietic disorders, infectious diseases;
and iii) patients with mental illness or a family history of mental
illness.
This study was approved by the Ethics Committee of
Zhangzhou Affiliated Hospital of Fujian Medical University.
Patients who participated in this research had complete clinical
data. The signed informed consents were obtained from the patients
or the guardians.
Instruments and testing methods
Ingenia 3.0T MR scanner (Philips Healthcare,
Amsterdam, Holland). Patients received plain MRI, enhanced MRI and
diffusion weighted imaging (DWI) in supine position, with the
middle of the head up, well fixed, bilateral zygomorphic and the
head coil being standard. Plain scan parameters: Axial, sagittal T1
weighted imaging (T1WI): TR/TE = 272 msec/2.3 msec; T2 weighted
imaging (T2WI): TR/TE = 3,000 msec/80 msec; FLAIR sequences: TR/TE
= 4,800 msec/320 msec; SE-EPI-DWI: TR/TE = 2,815 msec/82 msec,
section thickness = 5 mm, interval gap = 1 mm. Enhanced MRI scan:
the contrast agent was Gd-DTPA (Jinan Hongfangde Medical Technology
Co., Ltd., Jinan, China) at a dose of 0.2 mmol/kg, intravenous
injection rate of 3–3.0 ml/sec for 3–5 sec. Axial, coronal,
sagittal enhanced scan, T1WI: TR/TE = 400 msec/20 msec. SE-EPI was
used for DWI, sequence: TR/TE = 5,000 msec/65 msec, 8 times
acquisition, b value = 0 and 1,000 sec/mm2. The matrix
was 205×256, the field of vision (FOV) was 38×38 cm, the section
thickness was 5.0 mm and the interval gap was 1.0 mm. The maximum
diameter level of the lesion was selected and the corresponding
apparent diffusion coefficient (ADC) was measured in the target
area where the lesion was significantly enhanced. The ADC value of
the corresponding normal white matter area was measured as a
reference. Measurements were repeated 3 times and the mean values
were obtained.
Statistical analysis
SPSS18.0 (SPSS, Inc., Chicago, IL, USA) was used to
carry out statistical analysis. The counting data were expressed as
n (%), and the measurement data were expressed as mean ± standard
deviation. Chi-square test was used to compare counting data among
groups, t-test was used to compare measurement data among groups.
The diagnostic efficacy of ADC on MCG and PCNSL was evaluated by
the receiver operating characteristic (ROC) curve. P<0.05 was
considered to indicate a statistically significant difference.
Results
General data in the two groups
There was no statistically significant difference
between groups A and B in general clinic data of sex, age, body
mass index (BMI), smoking history, drinking history, clinical
manifestations, blood glucose (Glu), alanine aminotransferase
(ALT), aspartate aminotransferase (AST), carcinoembryonic antigen
(CEA), lactate dehydrogenase (LDH), carbohydrate antigen 125
(CA125) or β2-microglobulin (β2-MG) (P>0.05; Table I).
 | Table I.General data in groups A and B [n
(%)/(mean ± SD)]. |
Table I.
General data in groups A and B [n
(%)/(mean ± SD)].
| Items | Group A (n=21) | Group B (n=30) | t/χ2 | P-value |
|---|
| Sex |
|
| 0.943 | 0.332 |
|
Female | 12 (57.14) | 13 (43.33) |
|
|
| Male | 9
(42.86) | 17 (56.67) |
|
|
| Age (years) |
56.13±12.82 |
57.69±11.96 | 0.445 | 0.658 |
| BMI
(kg/m2) | 18.23±4.16 | 19.54±3.08 | 1.293 | 0.202 |
| Smoking history |
|
| 0.264 | 0.607 |
| Yes | 7
(33.33) | 8
(26.67) |
|
|
| No | 14 (66.67) | 22 (73.33) |
|
|
| Drinking history |
|
| 0.199 | 0.656 |
| Yes | 9
(42.86) | 11 (36.67) |
|
|
| No | 12 (57.14) | 19 (63.33) |
|
|
| Clinical
manifestation |
|
| 0.148 | 0.706 |
|
Headache | 16 (76.19) | 25 (83.33) |
|
|
|
Dizziness | 11 (52.38) | 18 (60.00) |
|
|
|
Nausea | 7
(33.33) | 11 (36.67) |
|
|
| Speech
disorder | 5
(23.81) | 5
(16.67) |
|
|
| Limb
weakness | 3
(14.29) | 7
(23.33) |
|
|
| Slow
reaction | 2 (9.52) | 5
(16.67) |
|
|
| Glu (mmol/l) |
6.01±0.49 | 5.93±0.28 | 0.740 | 0.463 |
| ALT (U/l) | 25.63±8.48 | 23.58±9.69 | 0.782 | 0.438 |
| AST (U/l) | 18.03±6.57 | 19.25±7.01 | 0.628 | 0.533 |
| CEA (mg/l) |
7.41±3.56 |
9.13±3.18 | 1.810 | 0.077 |
| LDH (U/l) | 301.52±56.38 | 298.84±57.31 | 0.165 | 0.869 |
| CA125 (U/ml) | 28.59±8.69 |
29.56±10.85 | 0.340 | 0.735 |
| β2-MG (µg/ml) |
3.82±1.86 |
2.94±1.45 | 1.898 | 0.064 |
Location and number of lesions in
groups A and B
A total of 62 lesions were detected in group A,
including 13 cases in hippocampus (16 lesions), 10 cases in
parietal and frontal lobe (21 lesions), 7 cases in insular and
temporal lobe (9 lesions), 4 cases in thalamus (7 lesions), 2 cases
in corpus callosum (6 lesions), 1 case in occipital lobe (1
lesion), 1 case in cerebellum (2 lesions). A total of 76 lesions
were detected in group B, including 1 case in hippocampus (2
lesions), 10 cases in parietal and frontal lobe (25 lesions), 2
cases in insular and temporal lobe (5 lesions), 7 cases in thalamus
(13 lesions), 3 cases in corpus callosum (7 lesions), 1 case in
occipital lobe (3 lesions), 8 cases in basal ganglia (16 lesions)
and 2 cases in cerebellum (5 lesions). The incidence of hippocampus
lesions in group A was significantly higher than that in group B
(P<0.05), and the incidence of basal ganglia lesions was
significantly lower than that in group B (P<0.05; Table II).
| Table II.Comparison of location and number of
lesions between groups A and B [n (%)]. |
Table II.
Comparison of location and number of
lesions between groups A and B [n (%)].
| Location | Group A (n=62) | Group B (n=76) | χ2 | P-value |
|---|
| Hippocampus | 16 (25.81) | 2 (2.63) | 16.170 | <0.001 |
| Parietal lobe | 11 (17.74) | 17 (22.37) |
0.452 |
0.672 |
| Frontal lobe | 10 (16.13) | 8
(10.53) |
0.945 |
0.331 |
| Insular lobe | 4 (6.45) | 2 (2.63) |
1.198 |
0.274 |
| Temporal lobe | 5 (8.06) | 3 (3.95) |
1.060 |
0.303 |
| Thalamus | 7
(11.29) | 13 (17.11) |
0.932 |
0.334 |
| Corpus
callosum | 6 (9.68) | 7 (9.21) |
0.008 |
0.926 |
| Occipital lobe | 1 (1.61) | 3 (3.95) |
0.661 |
0.416 |
| Basal ganglia | 0 (0.00) | 16 (21.05) | 14.760 | <0.001 |
| Cerebellum | 2 (3.23) | 5 (6.58) |
0.797 |
0.371 |
Characteristics of plain MRI signal in
groups A and B
In group A (62 lesions), there were 32 mass lesions,
22 patchy lesions and 8 cystic lesions. A total of 35 lesions
showed homogeneous signal, with low or equal T1WI signal, high or
slightly high T2WI signal and 25 lesions showed heterogeneous
signal, with low T1WI signal and high T2WI signal. In group B,
there were 65 mass lesions and 11 patchy lesions. The signal of 62
lesions was homogeneous, 14 lesions were heterogeneous, with low or
equal T1WI signal and equal or slightly high T2WI signal. Mass
lesions in group A were significantly less than those in group B
(P<0.05), and the patchy and cystic lesions were significantly
higher than those in group B (P<0.05). The heterogeneous signal
of plain scan in group A was significantly higher than that in
group B (P<0.05; Table
III).
| Table III.Characteristics of plain MRI signal
in groups A and B [n (%)]. |
Table III.
Characteristics of plain MRI signal
in groups A and B [n (%)].
| Characteristics of
plain MRI signal | Group A (n=62) | Group B (n=76) | χ2 | P-value |
|---|
| Lesion shape |
|
|
|
|
|
Mass | 32 (51.61) | 65 (85.53) | 18.800 | <0.001 |
|
Patchy | 22 (35.48) | 11 (14.47) |
8.284 |
0.004 |
|
Cystic | 8
(12.90) | 0 (0.00) | 10.410 |
0.001 |
| Characteristics of
plain scan signal |
|
|
|
|
|
Homogeneous | 35 (56.45) | 62 (81.58) |
0.005 |
0.940 |
|
Heterogeneous | 27 (43.55) | 14 (18.42) | 10.320 |
0.001 |
Features of enhanced MRI in groups A
and B
Enhanced MRI scan in groups A and B showed that, in
group A, 40 of 62 lesions were shaped as wreaths or rings, 12
lesions showed patchy or mass enhancements, and 10 lesions had no
significant change. The intensity of enhancement was inconsistent
in 17 cases and consistent in 4 cases. In group B, 65 of 72 lesions
were homogeneous masses and nodules with obvious enhancements, and
42 of them showed sharp angle signs or fist clenching signs. There
were 9 lesions with irregular or annular enhancements and 2 lesions
with no obvious enhancement.
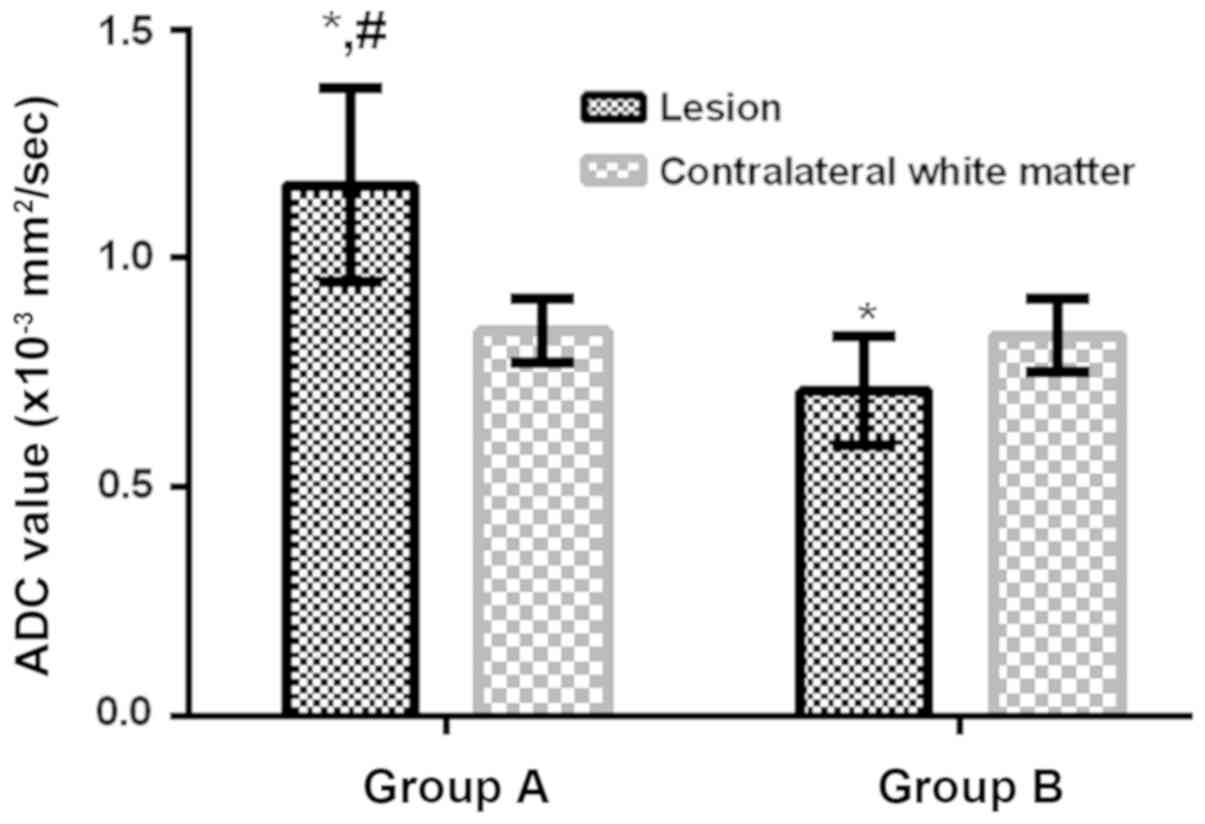
DWI findings in groups A and B
In group A, 27 of 62 lesions showed equal, slightly
high or high signals in DWI and slightly high or high signals in
ADC color map, 25 lesions showed equal signals in DWI and high
signals in ADC color map and 10 lesions showed low signals in DWI
and slightly high in ADC color map. In group B, 63 of 76 lesions
showed slightly high or high signals in DWI and slightly low or low
signals in ADC color map and 13 lesions showed equal signals in DWI
and ADC color map. The ADC value of the lesions in group A was
significantly higher than that in the contralateral normal white
matter (P<0.05), the ADC value in group B was significantly
lower than that in contralateral normal white matter (P<0.05),
so the ADC value in group A was significantly higher than that in
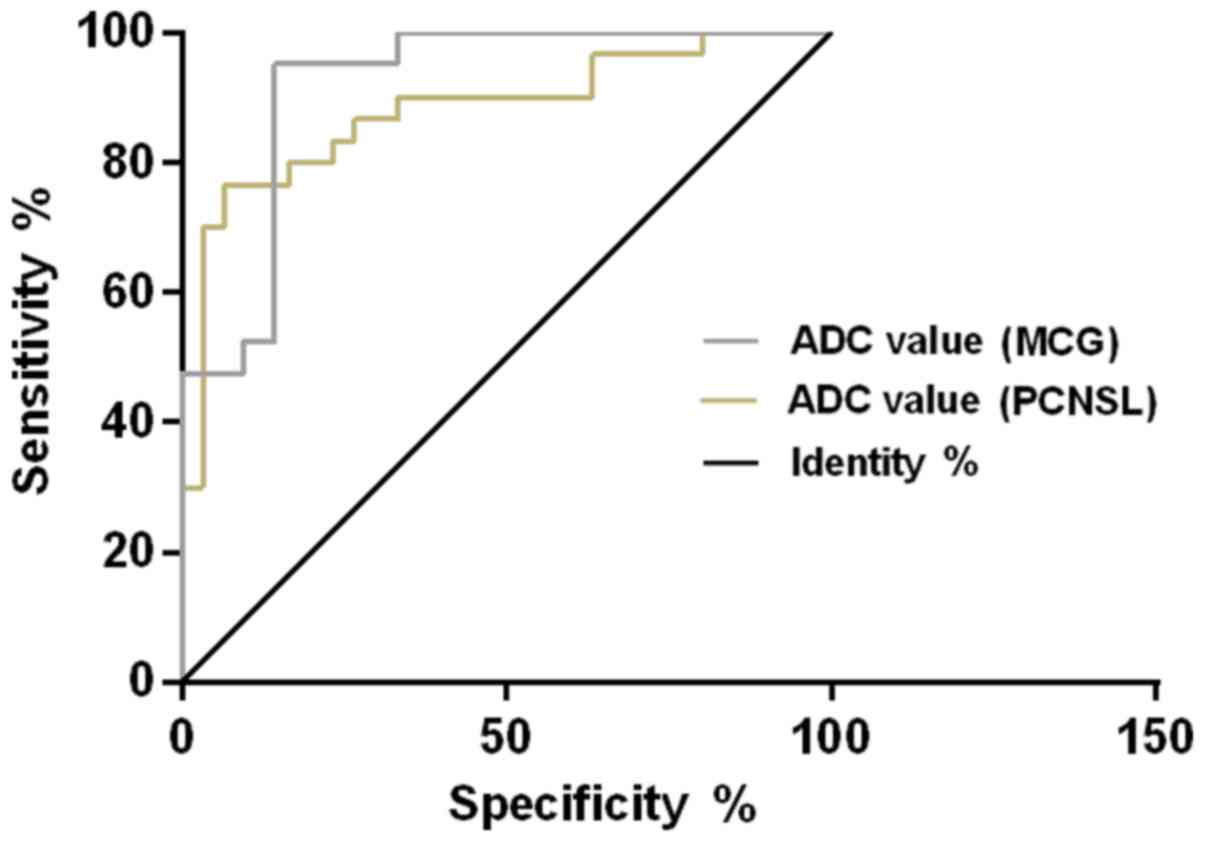
group B (P<0.05; Fig. 1). The ROC
curve of ADC value for diagnosing MCG and PCNSL showed that, the
AUC of ADC value for diagnosing MCG was 0.883 (95% CI:
0.790–0.969), the cut-off value was 1.094×10⁻³
mm2/sec, the diagnostic sensitivity was 85.71% and the
specificity was 80.00%; the AUC of ADC value for diagnosing PCNSL
was 0.918 (95% CI: 0.833–0.973), the cut-off value was
0.774×10⁻³ mm2/sec, the diagnostic
sensitivity was 83.33% and the specificity was 86.67% (Table IV and Fig. 2).
| Table IV.Diagnostic value of ADC for MCG and
PCNSL. |
Table IV.
Diagnostic value of ADC for MCG and
PCNSL.
| Diagnostic
index | AUC | 95% CI | Standard error | Cut-off value
(×10−3 mm2/sec) | Sensitivity
(%) | Specificity
(%) |
|---|
| ADC value for
diagnosing MCG | 0.883 | 0.790–0.969 | 0.046 | 1.094 | 85.71 | 80.00 |
| ADC value for
diagnosing PCNSL | 0.918 | 0.833–0.973 | 0.044 | 0.774 | 83.33 | 86.67 |
Discussion
MCG has the characteristics of rapid development,
different degree of lesion differentiation, short course of disease
and its main clinical treatment is surgical resection, followed by
radiochemotherapy for comprehensive treatment, whereas PCNSL is
sensitive to radiochemotherapy (13). MCG and PCNSL are completely different
in clinically preferred treatment options. Therefore, the early
preoperative differential diagnosis of them is of great
significance to the prognosis of patients.
The pathogenesis of MCG has not been clarified, and
its lesions can occur simultaneously, or at intervals of months or
even years. It was previously believed that MCG may be derived from
the the differentiation of primordial cells displaced during the
development of the central nervous system, or the multiple lesions
formed by the local metastasis of gliomas through CSF, blood and
nerve fibers (14,15). Hartmann et al (16) showed that MCG mostly occurred in the
hippocampus, accounting for 70%, followed by temporal lobe, insular
lobe, corpus callosum, parietal lobe, frontal lobe and thalamus.
Because most of the PCNSL cells originate from mononuclear
phagocytes in the perivascular, and the space near the surface of
internal brain and the paraventricular vessels are more obvious,
most tumors occur in the deep brain tissue near the midline. The
invasive and infiltrative growth of tumor cells is conducted from
the center to the periphery, so the tumor is more common in the
frontal and parietal lobe, corpus callosum, basal ganglia and
periventricular region (17). In
this study, MCG tumors mostly occurred in hippocampus, frontal
lobe, insular lobe, temporal lobe, thalamus and corpus callosum,
PCNSL tumors mostly occurred in frontal and parietal lobe,
thalamus, corpus callosum, and basal ganglia. The incidence of
hippocampus lesions in group A was significantly higher than that
in group B, and the incidence of basal ganglia lesions was
significantly lower than that in group B. Therefore, there is a
certain difference between MCG and PCNSL in the location of
tumorigenesis. Mass lesions in group A were significantly less than
those in group B, and the patchy and cystic lesions were
significantly higher than those in group B. The heterogeneous
signal of plain scan in group A was significantly higher than that
in group B. These results indicated that the shape and signal
uniformity of MCG are significantly different from those of PCNSL.
Enhanced MRI showed that the enhancement characteristic of MCG was
mostly shaped as wreaths or rings, which may be caused by the rapid
development of MCG, prone to cystic degeneration, necrosis and
hemorrhage, rich blood volume of tumors, more neovascularization,
and obvious proliferation of vascular smooth muscle cells and
vascular endothelial cells in the lesions (18). The enhancement of PCNSL was mainly
characterized by sharp angle sign or fist clenching sign, which may
be that PCNSL cells show infiltration-like pathological changes
which damage vascular endothelium and the barrier between blood and
CSF. And when performing an enhanced scan, the contrast agent can
infiltrate into the extracellular space of the tissue through the
blood vessels to obviously enhance the the lesion tissues.
Moreover, lymphoma grows fast and infiltrates rapidly, and tumor
cells can infiltrate along the surrounding brain parenchyma
(19).
The DWI signal intensity of different gliomas is
different because high grade gliomas are characterized by high cell
density and high proliferation, while low grade gliomas by slow
invasive growth (20). PCNSL cells
are numerous and dense, with less extracellular space and higher
intracellular water viscosity, which can limit the diffusion of
water molecules in tumor tissues. Therefore, the lesions show a
high signal in DWI and a decreased ADC value (21). In this study, the PCNSL patients
showed slightly high or high signal intensity in DWI, and slightly
low or low signal intensity in ADC color map, the ADC value of
lesions in group B was significantly lower than that in
contralateral normal white matter. The intensity of DWI signal in
MCG patients was different, the ADC value of the lesion in group A
was significantly higher than that in the contralateral normal
white matter, and the contradictory phenomenon of high DWI signal
and increased ADC value appeared. Guo et al (22) suggested that it was due to the
penetrating effect of T2, not the limitation of tissue diffusion.
ADC value can reflect the diffusion of tumor tissue by eliminating
the anisotropy, diffusion sensitivity gradient and penetration
effect of T2 (21).
Recent studies have shown that MRI findings and ADC
values are valuable in the diagnosis of PCNSL and glioma (23,24). The
results of this study showed that the ADC value of lesions in group
A was significantly higher than that in group B, indicating that
the diffusion limitation of tumor lesion in PCNSL is higher than
that in MCG. The ROC curve of ADC value for diagnosis of MCG and
PCNSL found that, for MCG, cut-off value was 1.094×10⁻³
mm2/sec, the diagnostic sensitivity was 85.71% and the
specificity was 80.00%; while for PCNSL, the cut-off value was
0.774×10⁻³ mm2/sec, the diagnostic
sensitivity was 83.33% and the specificity was 86.67%, suggesting
that ADC value has certain diagnostic value for MCG and PCNSL. This
is similar to the study of Ahn et al (25), which suggested that ADC value was
helpful in differentiating and diagnosing central nervous system
lymphoma and glioblastoma. Therefore, ADC value may become an
important auxiliary diagnostic method for MCG and PCNSL.
The subjects in this study were screened strictly
according to the exclusion criteria. There was no significant
difference in sex, age, BMI, smoking history, drinking history,
clinical manifestation, Glu, ALT, AST, CEA, LDH, CA125 or β2-MG
between groups A and B, which ensures the reliability of the
investigation. However, the gold criteria for the diagnosis of MCG
and PCNSL need to be histopathologically diagnosed. There were some
limitations in this study, MCG and PCNSL patients were not
classified by pathology, and the MRI signs were not known. In
future research, pathological histology should be combined to
explore MRI signs of MCG and PCNSL with different types.
In conclusion, the location, lesion shape and signal
characteristics of MCG and PCNSL have their own specificity; there
are significant differences in DWI signal and ADC color map signal
intensity of the lesions; ADC value has certain diagnostic value
for MCG and PCNSL; the differential diagnosis of MCG from PCNSL by
MRI is of great significance.
Acknowledgements
Not applicable.
Funding
No funding was received.
Availability of data and materials
The datasets used and/or analyzed during the present
study are available from the corresponding author on reasonable
request.
Authors' contributions
YC drafted, wrote the manuscript and analyzed MRI
results. AZ collected and analyzed general data of patients. Both
authors read and approved the final manuscript.
Ethics approval and consent to
participate
This study was approved by the Ethics Committee of
Zhangzhou Affiliated Hospital of Fujian Medical University
(Zhangzhou, China). Patients who participated in this research had
complete clinical data. The signed informed consents were obtained
from the patients or the guardians.
Patient consent for publication
Not applicable.
Competing interests
The authors declare that they have no competing
interests.
References
|
1
|
Salvati M, Caroli E, Orlando ER, Frati A,
Artizzu S and Ferrante L: Multicentric glioma: our experience in 25
patients and critical review of the literature. Neurosurg Rev.
26:275–279. 2003. View Article : Google Scholar : PubMed/NCBI
|
|
2
|
Yin L and Zhang L: Correlation between MRI
findings and histological diagnosis of brainstem glioma. Can J
Neurol Sci. 40:348–354. 2013. View Article : Google Scholar : PubMed/NCBI
|
|
3
|
Nakhl F, Chang EM, Shiau JS, Alastra A,
Wrzolek M, Odaimi M, Raden M and Juliano JE: A patient with
multiple synchronous gliomas of distinctly different grades and
correlative radiographic findings. Surg Neurol Int. 1:482010.
View Article : Google Scholar : PubMed/NCBI
|
|
4
|
di Russo P, Perrini P, Pasqualetti F,
Meola A and Vannozzi R: Management and outcome of high-grade
multicentric gliomas: a contemporary single-institution series and
review of the literature. Acta Neurochir (Wien). 155:2245–2251.
2013. View Article : Google Scholar : PubMed/NCBI
|
|
5
|
Nassiri M, Byrne GE, Whitcomb CC and
Byrnes JJ: Synchronous null-cell anaplastic large cell lymphoma and
multiple myeloma. Ann Hematol. 88:923–925. 2009. View Article : Google Scholar : PubMed/NCBI
|
|
6
|
Fine HA and Mayer RJ: Primary central
nervous system lymphoma. Ann Intern Med. 119:1093–1104. 1993.
View Article : Google Scholar : PubMed/NCBI
|
|
7
|
Viaccoz A, Ducray F, Tholance Y, Barcelos
GK, Thomas-Maisonneuve L, Ghesquières H, Meyronet D, Quadrio I,
Cartalat-Carel S, Louis-Tisserand G, et al: CSF neopterin level as
a diagnostic marker in primary central nervous system lymphoma.
Neuro Oncol. 17:1497–1503. 2015. View Article : Google Scholar : PubMed/NCBI
|
|
8
|
Hoang-Xuan K, Bessell E, Bromberg J,
Hottinger AF, Preusser M, Rudà R, Schlegel U, Siegal T, Soussain C,
Abacioglu U, et al European Association for Neuro-Oncology Task
Force on Primary CNS Lymphoma, : Diagnosis and treatment of primary
CNS lymphoma in immunocompetent patients: guidelines from the
European Association for Neuro-Oncology. Lancet Oncol.
16:e322–e332. 2015. View Article : Google Scholar : PubMed/NCBI
|
|
9
|
Wang K, Zhao X, Chen Q, Fan D, Qiao Z, Lin
S, Jiang T, Dai J and Ai L: A new diagnostic marker for
differentiating multicentric gliomas from multiple intracranial
diffuse large B-cell lymphomas on 18F-FDG PET images. Medicine
(Baltimore). 96:e77562017. View Article : Google Scholar : PubMed/NCBI
|
|
10
|
Nagashima H, Sasayama T, Tanaka K, Kyotani
K, Sato N, Maeyama M, Kohta M, Sakata J, Yamamoto Y, Hosoda K, et
al: Myo-inositol concentration in MR spectroscopy for
differentiating high grade glioma from primary central nervous
system lymphoma. J Neurooncol. 136:317–326. 2018. View Article : Google Scholar : PubMed/NCBI
|
|
11
|
Huang J, Yu J and Peng Y: Association
between dynamic contrast enhanced MRI imaging features and WHO
histopathological grade in patients with invasive ductal breast
cancer. Oncol Lett. 11:3522–3526. 2016. View Article : Google Scholar : PubMed/NCBI
|
|
12
|
Sugita Y, Muta H, Ohshima K, Morioka M,
Tsukamoto Y, Takahashi H and Kakita A: Primary central nervous
system lymphomas and related diseases: Pathological characteristics
and discussion of the differential diagnosis. Neuropathology.
36:313–324. 2016. View Article : Google Scholar : PubMed/NCBI
|
|
13
|
Ferreri AJ, Reni M, Foppoli M, Martelli M,
Pangalis GA, Frezzato M, Cabras MG, Fabbri A, Corazzelli G,
Ilariucci F, et al International Extranodal Lymphoma Study Group
(IELSG), : High-dose cytarabine plus high-dose methotrexate versus
high-dose methotrexate alone in patients with primary CNS lymphoma:
a randomised phase 2 trial. Lancet. 374:1512–1520. 2009. View Article : Google Scholar : PubMed/NCBI
|
|
14
|
Lee JS, Jung TY, Lee KH and Kim SK:
Primary central nervous system vasculitis mimicking a cortical
brain tumor: a case report. Brain Tumor Res Treat. 5:30–33. 2017.
View Article : Google Scholar : PubMed/NCBI
|
|
15
|
Weller RO, Galea I, Carare RO and Minagar
A: Pathophysiology of the lymphatic drainage of the central nervous
system: implications for pathogenesis and therapy of multiple
sclerosis. Pathophysiology. 17:295–306. 2010. View Article : Google Scholar : PubMed/NCBI
|
|
16
|
Hartmann M, Heiland S, Harting I, Tronnier
VM, Sommer C, Ludwig R and Sartor K: Distinguishing of primary
cerebral lymphoma from high-grade glioma with perfusion-weighted
magnetic resonance imaging. Neurosci Lett. 338:119–122. 2003.
View Article : Google Scholar : PubMed/NCBI
|
|
17
|
Haldorsen IS, Espeland A and Larsson EM:
Central nervous system lymphoma: Characteristic findings on
traditional and advanced imaging. AJNR Am J Neuroradiol.
32:984–992. 2011. View Article : Google Scholar : PubMed/NCBI
|
|
18
|
Rojiani AM and Dorovini-Zis K: Glomeruloid
vascular structures in glioblastoma multiforme: an
immunohistochemical and ultrastructural study. J Neurosurg.
85:1078–1084. 1996. View Article : Google Scholar : PubMed/NCBI
|
|
19
|
Fraser E, Gruenberg K and Rubenstein JL:
New approaches in primary central nervous system lymphoma. Chin
Clin Oncol. 4:112015.PubMed/NCBI
|
|
20
|
Kono K, Inoue Y, Nakayama K, Shakudo M,
Morino M, Ohata K, Wakasa K and Yamada R: The role of
diffusion-weighted imaging in patients with brain tumors. AJNR Am J
Neuroradiol. 22:1081–1088. 2001.PubMed/NCBI
|
|
21
|
Koubska E, Weichet J and Malikova H:
Central nervous system lymphoma: a morphological MRI study. Neuro
Endocrinol Lett. 37:318–324. 2016.PubMed/NCBI
|
|
22
|
Guo AC, Cummings TJ, Dash RC and
Provenzale JM: Lymphomas and high-grade astrocytomas: comparison of
water diffusibility and histologic characteristics. Radiology.
224:177–183. 2002. View Article : Google Scholar : PubMed/NCBI
|
|
23
|
Choi YS, Lee HJ, Ahn SS, Chang JH, Kang
SG, Kim EH, Kim SH and Lee SK: Primary central nervous system
lymphoma and atypical glioblastoma: differentiation using the
initial area under the curve derived from dynamic contrast-enhanced
MR and the apparent diffusion coefficient. Eur Radiol.
27:1344–1351. 2017. View Article : Google Scholar : PubMed/NCBI
|
|
24
|
Gadda D, Mazzoni LN, Pasquini L, Busoni S,
Simonelli P and Giordano GP: Relationship between apparent
diffusion coefficients and MR spectroscopy findings in high-grade
gliomas. J Neuroimaging. 27:128–134. 2017. View Article : Google Scholar : PubMed/NCBI
|
|
25
|
Ahn SJ, Shin HJ, Chang JH and Lee SK:
Differentiation between primary cerebral lymphoma and glioblastoma
using the apparent diffusion coefficient: Comparison of three
different ROI methods. PLoS One. 9:e1129482014. View Article : Google Scholar : PubMed/NCBI
|