Introduction
Lung cancer is one of the most common cancer types
occurring in both men and women. According to the American
Institute for Cancer Research (AICR), approximately 2 million new
cases of lung cancer were reported in the year 2018 (1,2). As per
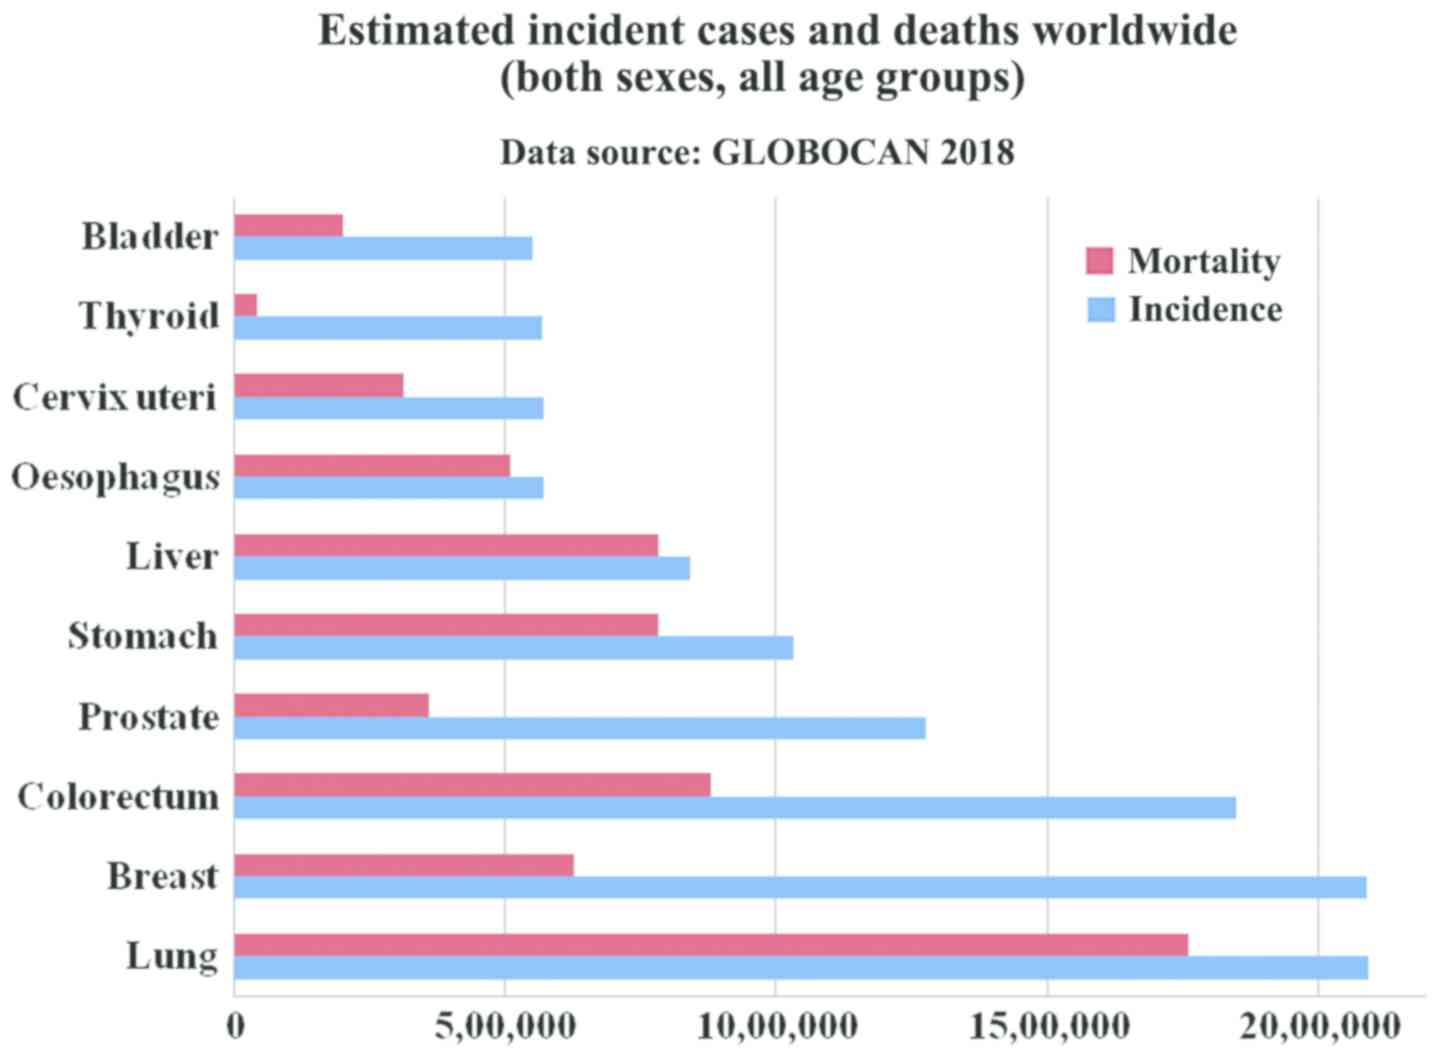
the GLOBOCAN report of 2018, lung and breast cancer have the
highest incidence rate, with lung cancer (Fig. 1) being the leading cause of mortality
(2) consistent with other reports
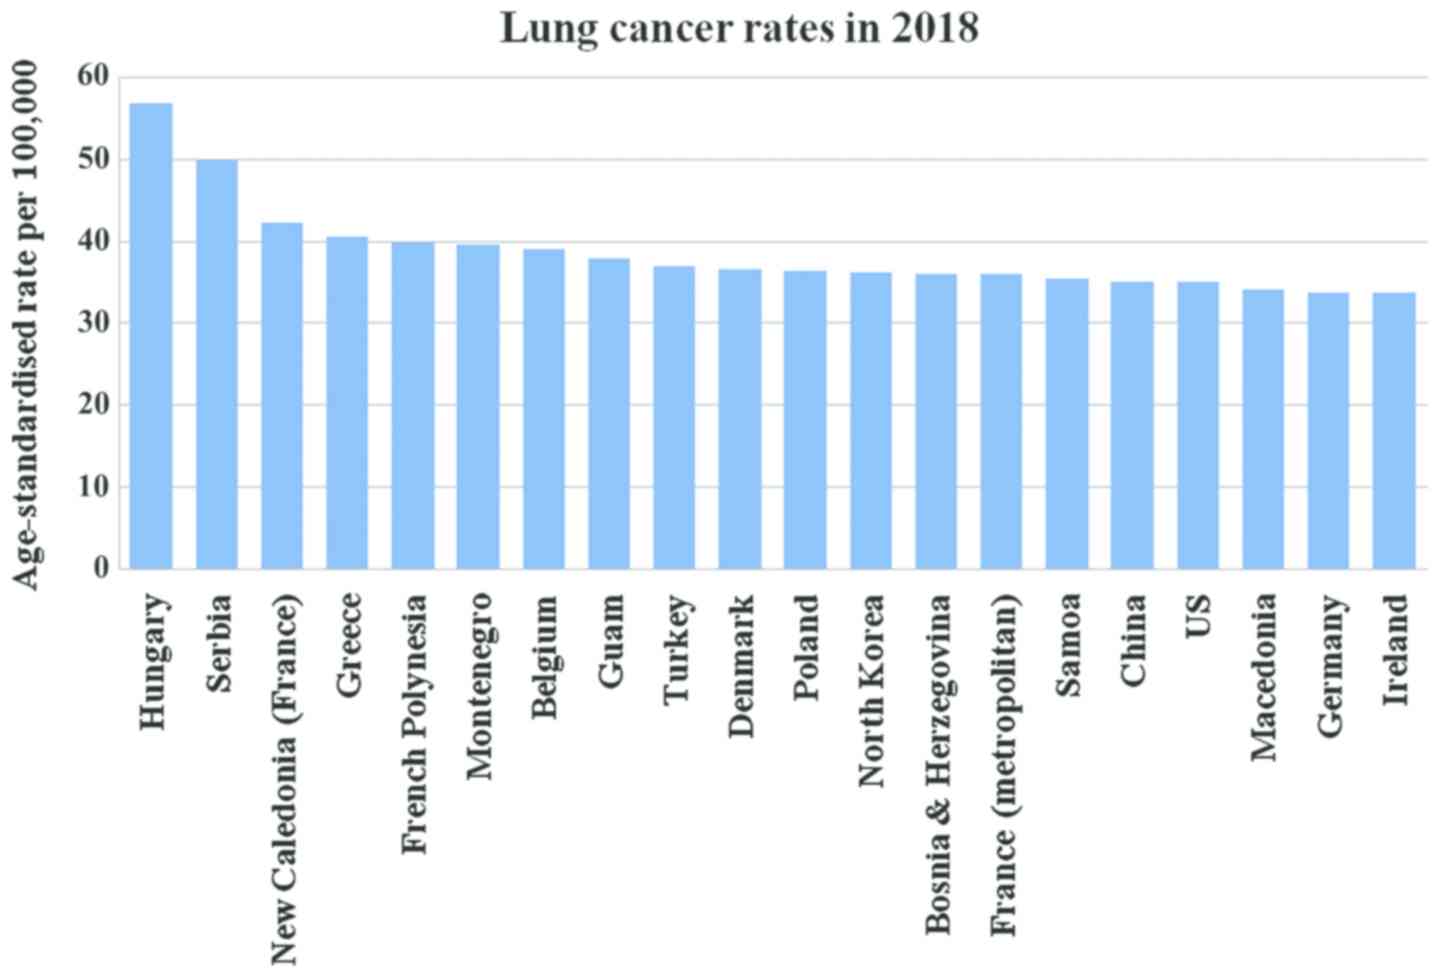
(3,4,5). A list
of the top 20 countries with the highest rate of lung cancer in
2018 is presented in Fig. 2
(1). Strong evidence suggests that
arsenic-containing drinking water and high-dose of beta-carotene
augment the risk of lung cancer. In addition, consuming red meat
and alcoholic may increase the risk (6). Lung cancer begins in the lungs as a
mutation in oncogenes and proliferates as primary tumor and may
spread to lymph nodes or other organs in the body by metastases. It
is classified as small cell lung cancer (SCLC) and non-small cell
lung cancer (NSCLC). Of the two, NSCLSC accounts for approximately
85% among all the lung cancer cases. The major subtypes of NSCLC
are adenocarcinoma (40%), squamous cell carcinoma (30%), and large
cell carcinoma (15%) (7). Smoking is
the main causative agent of lung cancer. For a non-smoker, exposure
to passive smoking also causes lung cancer. In general, exposure to
a carcinogen increases the risk of developing lung cancer, which
includes asbestos, arsenic, chromium, nickel, radon, tobacco,
benzene, cadmium, formaldehyde and crystalline silica (8). It has been reported that there is
approximately 16% chance for 5-year survival (9).
As far as lung cancer is concerned, the chronic
obstructive pulmonary disease (COPD) is a significant risk factor
which can be associated with the patient's susceptibility to
cigarette smoking. In fact, severe inflammation induced due to
toxic gases trigger COPD and lung cancer (10). The most common COPD are emphysema and
chronic bronchitis. Bronchitis is inflammation of the bronchi.
Emphysema causes damage to the alveoli, the air sacs in the lungs.
The walls of the damaged alveoli become stretched out and make it
difficult for diffusion. COPD is primarily caused by smoking and
long-term exposure and contact with harmful pollutants that include
certain chemicals, dust, or fumes and rarely, by
alpha-1-antitrypsin and deficiency or a genetic condition.
COPD is measured by spirometry grading systems and
one of them is GOLD classification. The GOLD classification is used
for determining COPD severity and helps in prognosis and treatment
plan. Based on spirometry testing, COPD and is graded as: mild
(grade 1), moderate (grade 2), severe (grade 3) and very severe
(grade 4). It is dependent on the result of the spirometry test of
a patient's FEV1, i.e., the volume of air one may breathe out of
the lungs in the first one second of a forced expiration. As FEV1
decreases, the severity increases. With the progress in time, the
patient is more susceptible to various complications, including
respiratory infections, heart problems, high blood pressure in lung
arteries (pulmonary hypertension), flu, colds, pneumonia,
depression, anxiety, and lung cancer.
In fact, COPD and lung cancer are linked in a number
of ways, one being that smoking is the most common risk factor;
others include passive smoke or exposure to chemicals or other
fumes in the workplace. It has been estimated that between 40 and
70% of individuals with lung cancer also have COPD and it is
concluded that COPD is a risk factor for lung cancer (11,12). By
contrast, a study by Durham and Adcock (9) suggested that COPD is a driving factor
in lung cancer. COPD is the leading cause of mortality projected to
rank 3rd in 2020 (13) and comes
under the environmental factors such as smoking (14). Exacerbation of COPD exhibits various
symptoms that include cough, production of sputum or shortness of
breath. It can be caused either by bacterial or viral infections or
inhaled particles. The genetic factor can also be helpful in
determining the frequency of this disease (15).
Gene expression studies are an important tool for
transcriptomic analysis of an organism that helps to quantify
expression level genes in both disease and normal conditions. Gene
expression profiles of two different conditions (disease versus
normal) can be compared to reveal potential key regulators or
differentially expressed genes (DEGs), or co-regulated genes,
either up- or downregulated (16).
The key regulators or DEGs may be possible gene biomarker
responsible for the disease condition (17,18). A
few gene expression studies on COPD and lung cancer (14,15) are
available; however, our aim is to identify DEGs and determine their
functional analysis. The present study presents a systems biology
perspective to decipher DEGs in lung cancer using microarray gene
expression profiles and determine their functional analysis.
Materials and methods
Datasets
In order to identify DEGs, i.e., key gene
biomarkers, two types of samples with multiple replicas were
required: lung cancer tissue samples and healthy lung tissue
samples. On studying these samples, factors that could be the
reason for COPD or lung cancer were identified. These factors were
genetic or environmental. COPD may be an emphysema type. In
emphysema, air sacs are damaged and the patient does not get the
oxygen required. Exacerbation of COPD can be diagnosed on the basis
of symptoms including cough, shortness of breath, and generation of
sputum.
In the present study, publicly available gene
expression profiles were obtained from Gene Expression Omnibus (GEO
accession no. GSE1650) where data referable to patients were
properly anonymized by submitters and informed consent was obtained
by the investigators during the original data collection. The
following information labels were available and collected for each
sample: sample GSM number, status (public on month/day/year), title
(number letter) sample type (RNA), source name (lung tissue),
organism (Homo sapiens), extracted molecule (total RNA), and
description (lung tissue and resected lung taken from smokers).
Of the 30 patients, 18 samples belong to severe
emphysema patients and the remaining 12 samples belong to patients
having mild or no emphysema. A comparison was made of the
expression profiles of severely emphysematous tissue and
normal/mildly emphysematous lung tissue from smokers with nodules
suspicious of lung cancer. The comparison provides insights into
the pathogenetic mechanisms of COPD.
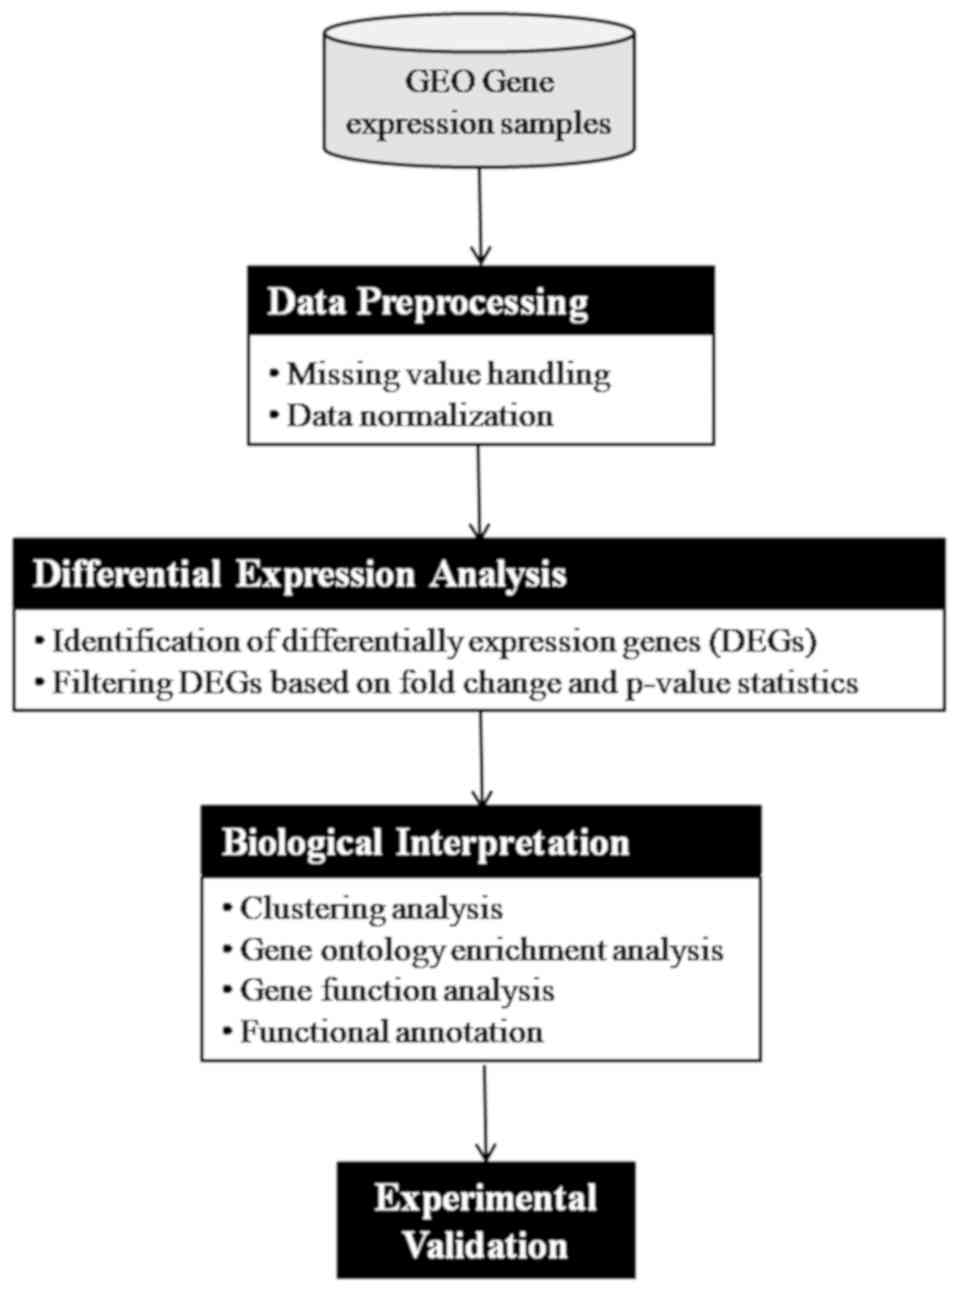
Methodology
The adopted methodologies are presented in Fig. 3 and described as follows:
Data preprocessing: the microarray data were
originally available as a CEL file, which is quantified and
converted to gene expression values. After conversion into gene
expression values, it is further quality checked and normalized to
reduce variance among the data.
Differential expression analysis: the analysis of
DEGs was performed using GEO2R tool available at NCBI-GEO. It is a
user-friendly and interactive web-based tool that helps the
researcher to compare groups of samples for the purpose of
identifying DEGs across experimental conditions. We used adjusted
P-value with Benjamini and Hochberg (19) false discovery rate and log
fold-change as statistical metrics for evaluation purpose.
Results and Discussion
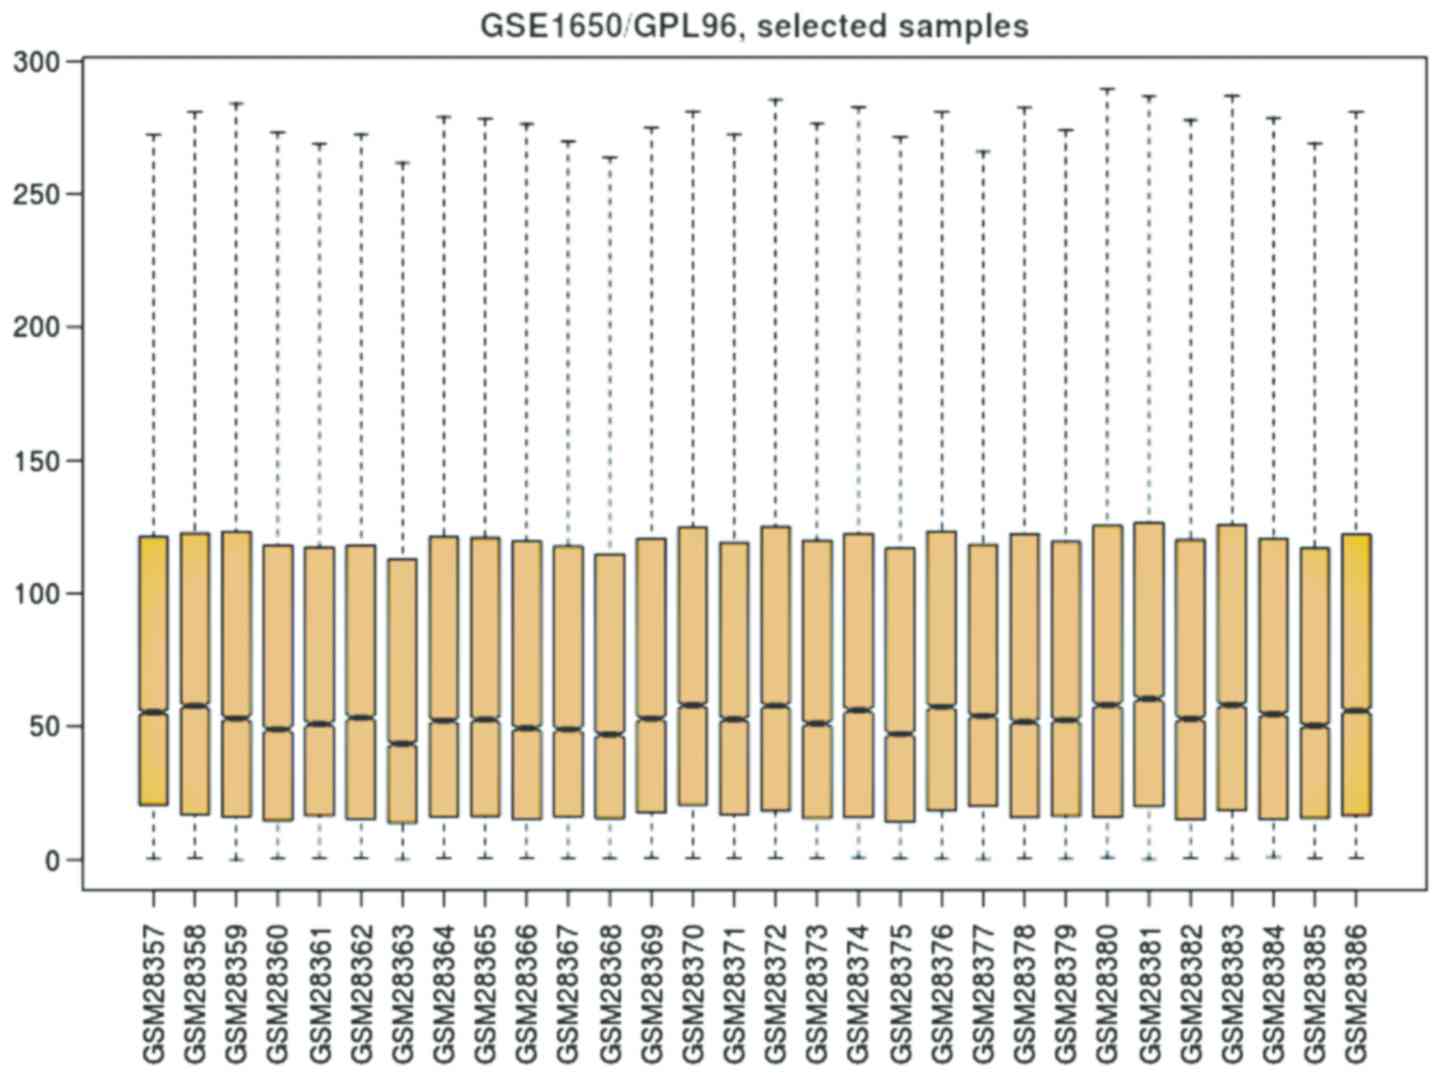
The considered datasets comprising 30 patients, out
of which 18 samples belong to severe emphysematous tissue and 12
patients have normal/mildly emphysematous lung tissue from smokers
suspicious of lung cancer. In order to understand the distribution
of gene expression data among these two groups of samples, we
depicted boxplot as shown in Fig. 4.
It is observed from the boxplot (Fig.
4) that the values of gene expression lie between 0 and 300,
while their 2nd quartile (mean) fluctuates around 50. Thus, the
gene expression data are uniformly distributed.
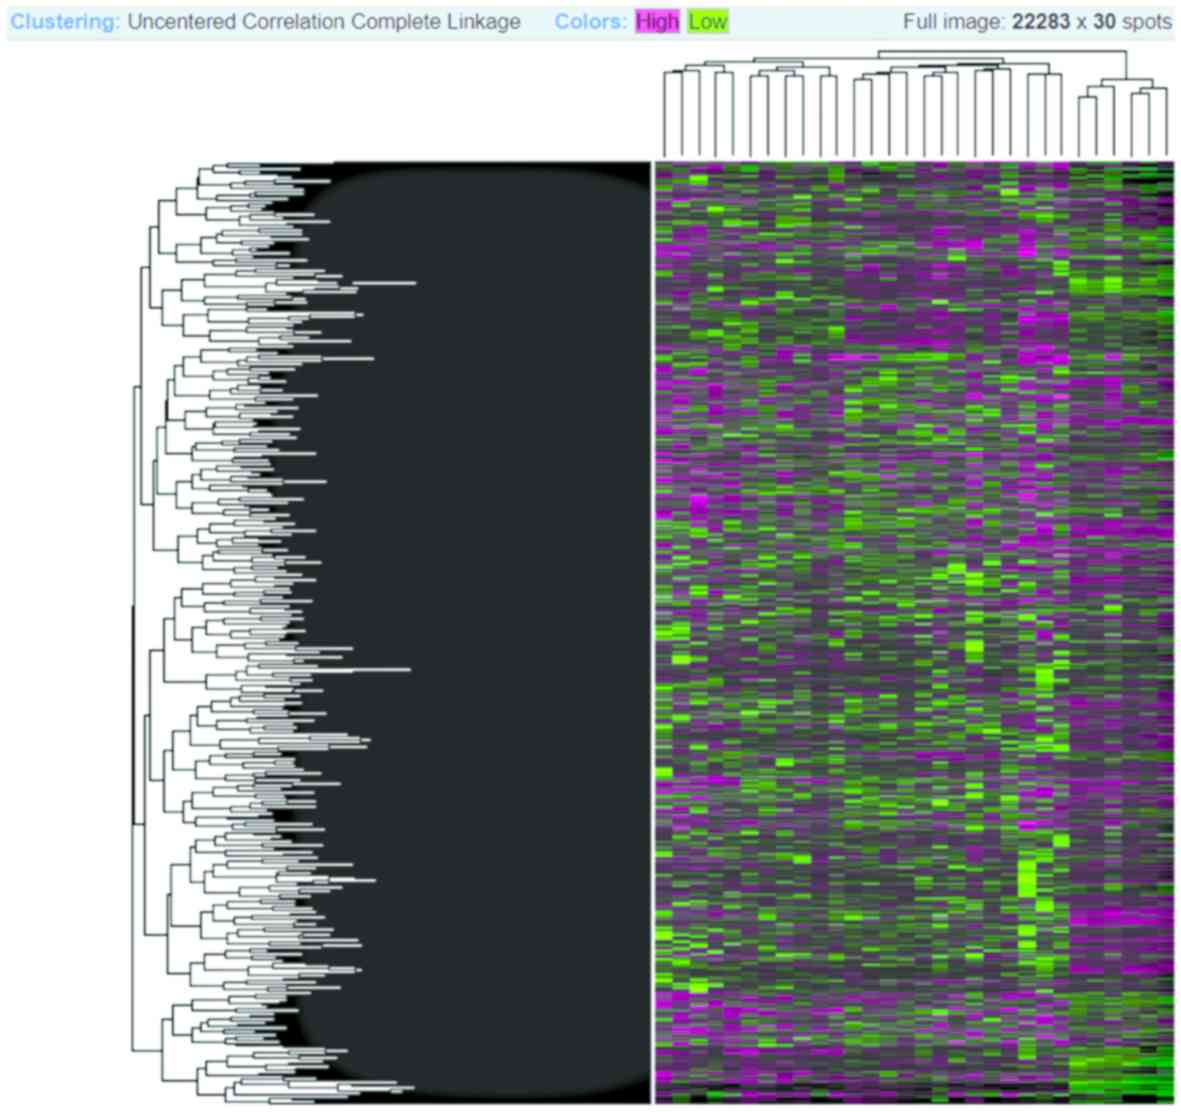
The Heatmap diagram shows the combined with
clustering group genes and/or samples based on gene expression
similarity pattern, which is helpful for the identification of
commonly regulated genes, or gene signature associated with a
disease. The heatmap diagram of our considered dataset is shown in
Fig. 5, where rows represent genes
and column represents samples. The changes of gene expression are
depicted as color intensity; for instance, green color represents
downregulated genes, red presents upregulated genes, and black
represents no changes in the expression. It is observed from
Fig. 5 that the majority of the
genes are regulated, either down- or up-regulated.
Differential expression analysis. We performed the
differential expression analysis (DEGs) between the two samples,
i.e., between severe emphysematous lung tissue and normal/mildly
emphysematous from smokers suspicious of lung cancer. We filtered
DEGs with a significance level of 5% (P-value < =0.05) and had
fold-change (FC) ≥2. In this way, we obtained 623 DEGs which had FC
≥2 in the expression level between the two samples. Out of 623
DEGs, 6 genes have a 4-fold change in the expression level, while
47 DEGs have a 3-fold change in their expression level (Fig. 6). The list of DEGS show 3- and 4-fold
change in the expression level, along with other statistics such as
adjusted P-value, P-value, moderated t-statistics, B-statistics,
log FC and FC (Table I).
 | Table I.List of differentially expressed genes
along with their various scores. |
Table I.
List of differentially expressed genes
along with their various scores.
| Gene name | Adjusted P-value | P-value | t-statistics | B-statistics | logFC | FC | Gene description |
|---|
| NKTR | 0.1544 | 0.0002 | 4.1685 | 0.4851 | 2.1583 | 4.4639 | Natural killer cell
triggering receptor |
| PLGLB1/PLGLB2 | 0.2440 | 0.0019 | 3.4003 | −1.2650 | 2.1000 | 4.2872 | Plasminogen-like
B1/B2 |
| CHI3L1 | 0.1384 | 0.0002 | −4.2923 | 0.7747 | −2.0635 | 4.1801 | Chitinase 3 like
1 |
| IL17A | 0.1264 | 0.0001 | 4.5501 | 1.3809 | 2.0311 | 4.0873 | Interleukin 17A |
| C5AR2 | 0.1885 | 0.0005 | 3.8610 | −0.2268 | 2.0277 | 4.0775 | Complement component
5a receptor 2 |
| HAPLN1 | 0.1953 | 0.0008 | 3.7205 | −0.5476 | 2.0119 | 4.0332 | Hyaluronan and
proteoglycan link protein 1 |
| LOXL1 | 0.1264 | 0.0001 | −4.5643 | 1.4142 | −1.9436 | 3.8466 | Lysyl oxidase like
1 |
| BRF1 | 0.1895 | 0.0007 | 3.7798 | −0.4127 | 1.9285 | 3.8067 | BRF1, RNA polymerase
III transcription initiation factor 90 kDa subunit |
| CSF3 | 0.3087 | 0.0046 | 3.0529 | −2.0141 | 1.9089 | 3.7552 | Colony stimulating
factor 3 |
| PPM1A | 0.1885 | 0.0004 | 3.9522 | −0.0170 | 1.9064 | 3.7487 | Protein phosphatase,
Mg2+/Mn2+ dependent 1A |
| UBR2 | 0.1351 | 0.0001 | −4.3783 | 0.9764 | −1.8816 | 3.6849 | Ubiquitin protein
ligase E3 component n-recognin 2 |
| CLCA3P | 0.2905 | 0.0031 | 3.2114 | −1.6766 | 1.8733 | 3.6637 | Chloride channel
accessory 3, pseudogene |
| MYH7/MYH6 | 0.1885 | 0.0006 | 3.8079 | −0.3485 | 1.8698 | 3.6549 | Myosin, heavy chain
7, cardiac muscle, beta/myosin heavy chain 6 |
| ZNF214 | 0.2418 | 0.0018 | 3.4102 | −1.2431 | 1.8664 | 3.6462 | Zinc finger protein
214 |
| PCSK1 | 0.1544 | 0.0002 | 4.2011 | 0.5612 | 1.8579 | 3.6248 | Proprotein convertase
subtilisin/kexin type 1 |
| PTGER3 | 0.1885 | 0.0006 | 3.8053 | −0.3544 | 1.8309 | 3.5575 | Prostaglandin E
receptor 3 |
| GYS2 | 0.2458 | 0.0020 | 3.3823 | −1.3045 | 1.8290 | 3.5530 | Glycogen synthase
2 |
| BCAN | 0.2188 | 0.0014 | 3.5128 | −1.0156 | 1.8263 | 3.5462 | Brevican |
| KIF23 | 0.2012 | 0.0010 | 3.6177 | −0.7803 | 1.8148 | 3.5181 | Kinesin family member
23 |
| HTR2B | 0.1923 | 0.0007 | −3.7608 | −0.4560 | −1.7822 | 3.4396 | 5-hydroxytryptamine
receptor 2B |
| BMP2K | 0.343 | 0.0087 | 2.8034 | −2.5282 | 1.7688 | 3.4077 | BMP2 inducible
kinase |
| CHIT1 | 0.1544 | 0.0002 | −4.1743 | 0.4987 | −1.7674 | 3.4044 | Chitinase 1 |
| TNIP3 | 0.1885 | 0.0006 | 3.8506 | −0.2507 | 1.7650 | 3.3988 | TNFAIP3 interacting
protein 3 |
| PHLPP1 | 0.3203 | 0.0056 | 2.9788 | −2.1690 | 1.7485 | 3.3601 | PH domain and
leucine rich repeat protein phosphatase 1 |
| POSTN | 0.2692 | 0.0026 | 3.2736 | −1.5422 | 1.7481 | 3.3592 | Periostin |
| CCL20 | 0.3597 | 0.0126 | 2.6482 | −2.8359 | 1.7446 | 3.3511 | C-C motif chemokine
ligand 20 |
| SMARCA2 | 0.3332 | 0.0074 | 2.8663 | −2.4007 | 1.7365 | 3.3323 | SWI/SNF related,
matrix associated, actin dependent regulator of chromatin,
subfamily a, member 2 |
| TSC22D2 | 0.3475 | 0.0111 | 2.7019 | −2.7306 | 1.7225 | 3.3001 | TSC22 domain family
member 2 |
| FOSB | 0.4467 | 0.0368 | 2.1818 | −3.6944 | 1.7159 | 3.2850 | FosB
proto-oncogene, AP-1 transcription factor subunit |
| GGA2 | 0.262 | 0.0024 | 3.3140 | −1.4542 | 1.7134 | 3.2793 | Golgi associated,
gamma adaptin ear containing, ARF binding protein 2 |
| KYNU | 0.3263 | 0.0067 | 2.9063 | −2.3189 | 1.7128 | 3.2779 | Kynureninase |
| CCDC88C | 0.3197 | 0.0053 | 3.0028 | −2.1190 | 1.7090 | 3.2693 | Coiled-coil domain
containing 88C |
| MCF2 | 0.343 | 0.0087 | 2.8022 | −2.5305 | 1.7089 | 3.2692 | MCF.2 cell line
derived transforming sequence |
| PAICS | 0.3197 | 0.0054 | 2.9931 | −2.1393 | 1.7001 | 3.2491 |
Phosphoribo-sylaminoimidazole carboxylase;
phosphoribosyla-minoimidazolesuccinocarbo-xamide synthase |
| CREBZF | 0.3047 | 0.0045 | 3.0666 | −1.9851 | 1.6783 | 3.2004 | CREB/ATF bZIP
transcription factor |
| AFF2 | 0.2458 | 0.0019 | 3.3904 | −1.2868 | 1.6748 | 3.1927 | AF4/FMR2 family
member 2 |
| XIST | 0.3861 | 0.0182 | −2.4926 | −3.1341 | −1.6726 | 3.1880 | X inactive specific
transcript (non-protein coding) |
| BPESC1 | 0.3735 | 0.0153 | 2.5674 | −2.9922 | 1.6687 | 3.1793 | Blepharophimosis,
epicanthus inversus and ptosis, candidate 1 (non-protein
coding) |
| KRT17/JUP | 0.2473 | 0.0021 | −3.3627 | −1.3476 | −1.6661 | 3.1736 | Keratin 17/junction
plakoglobin |
| CALCRL | 0.2458 | 0.0020 | 3.3835 | −1.3019 | 1.6656 | 3.1724 | Calcitonin receptor
like receptor |
| SALL1 | 0.3352 | 0.0079 | 2.8388 | −2.4566 | 1.6603 | 3.1609 | Spalt like
transcription factor 1 |
| GRIK2 | 0.3457 | 0.0100 | 2.7456 | −2.6440 | 1.6533 | 3.1455 | Glutamate
ionotropic receptor kainate type subunit 2 |
| KLK13 | 0.2347 | 0.0017 | 3.4334 | −1.1918 | 1.6488 | 3.1358 | Kallikrein-related
peptidase 13 |
| NOL4 | 0.1885 | 0.0005 | −3.9187 | −0.0943 | −1.6357 | 3.1073 | Nucleolar protein
4 |
| KCNV1 | 0.2012 | 0.0010 | 3.6356 | −0.7400 | 1.6335 | 3.1027 | Potassium
voltage-gated channel modifier subfamily V member 1 |
| GTSE1 | 0.2692 | 0.0025 | 3.2897 | −1.5071 | 1.6184 | 3.0703 | G2 and S-phase
expressed 1 |
| SPON1 | 0.1885 | 0.0004 | −3.9605 | 0.0023 | −1.6153 | 3.0637 | Spondin 1 |
| CST1 | 0.1264 | 0.0001 | −4.6287 | 1.5662 | −1.6132 | 3.0593 | Cystatin SN |
| TSPAN2 | 0.456 | 0.0406 | 2.1368 | −3.7713 | 1.6114 | 3.0556 | Tetraspanin 2 |
| PLD1 | 0.2628 | 0.0024 | 3.3081 | −1.4670 | 1.6076 | 3.0473 | Phospholipase
D1 |
| CDHR5 | 0.2692 | 0.0026 | 3.2810 | −1.5259 | 1.5982 | 3.0276 | Cadherin related
family member 5 |
| SULF1 | 0.2188 | 0.0014 | −3.5003 | −1.0433 | −1.5974 | 3.0260 | Sulfatase 1 |
| SLC12A4 | 0.2922 | 0.0035 | 3.1634 | −1.7797 | 1.5933 | 3.0175 | Solute carrier
family 12 member 4 |
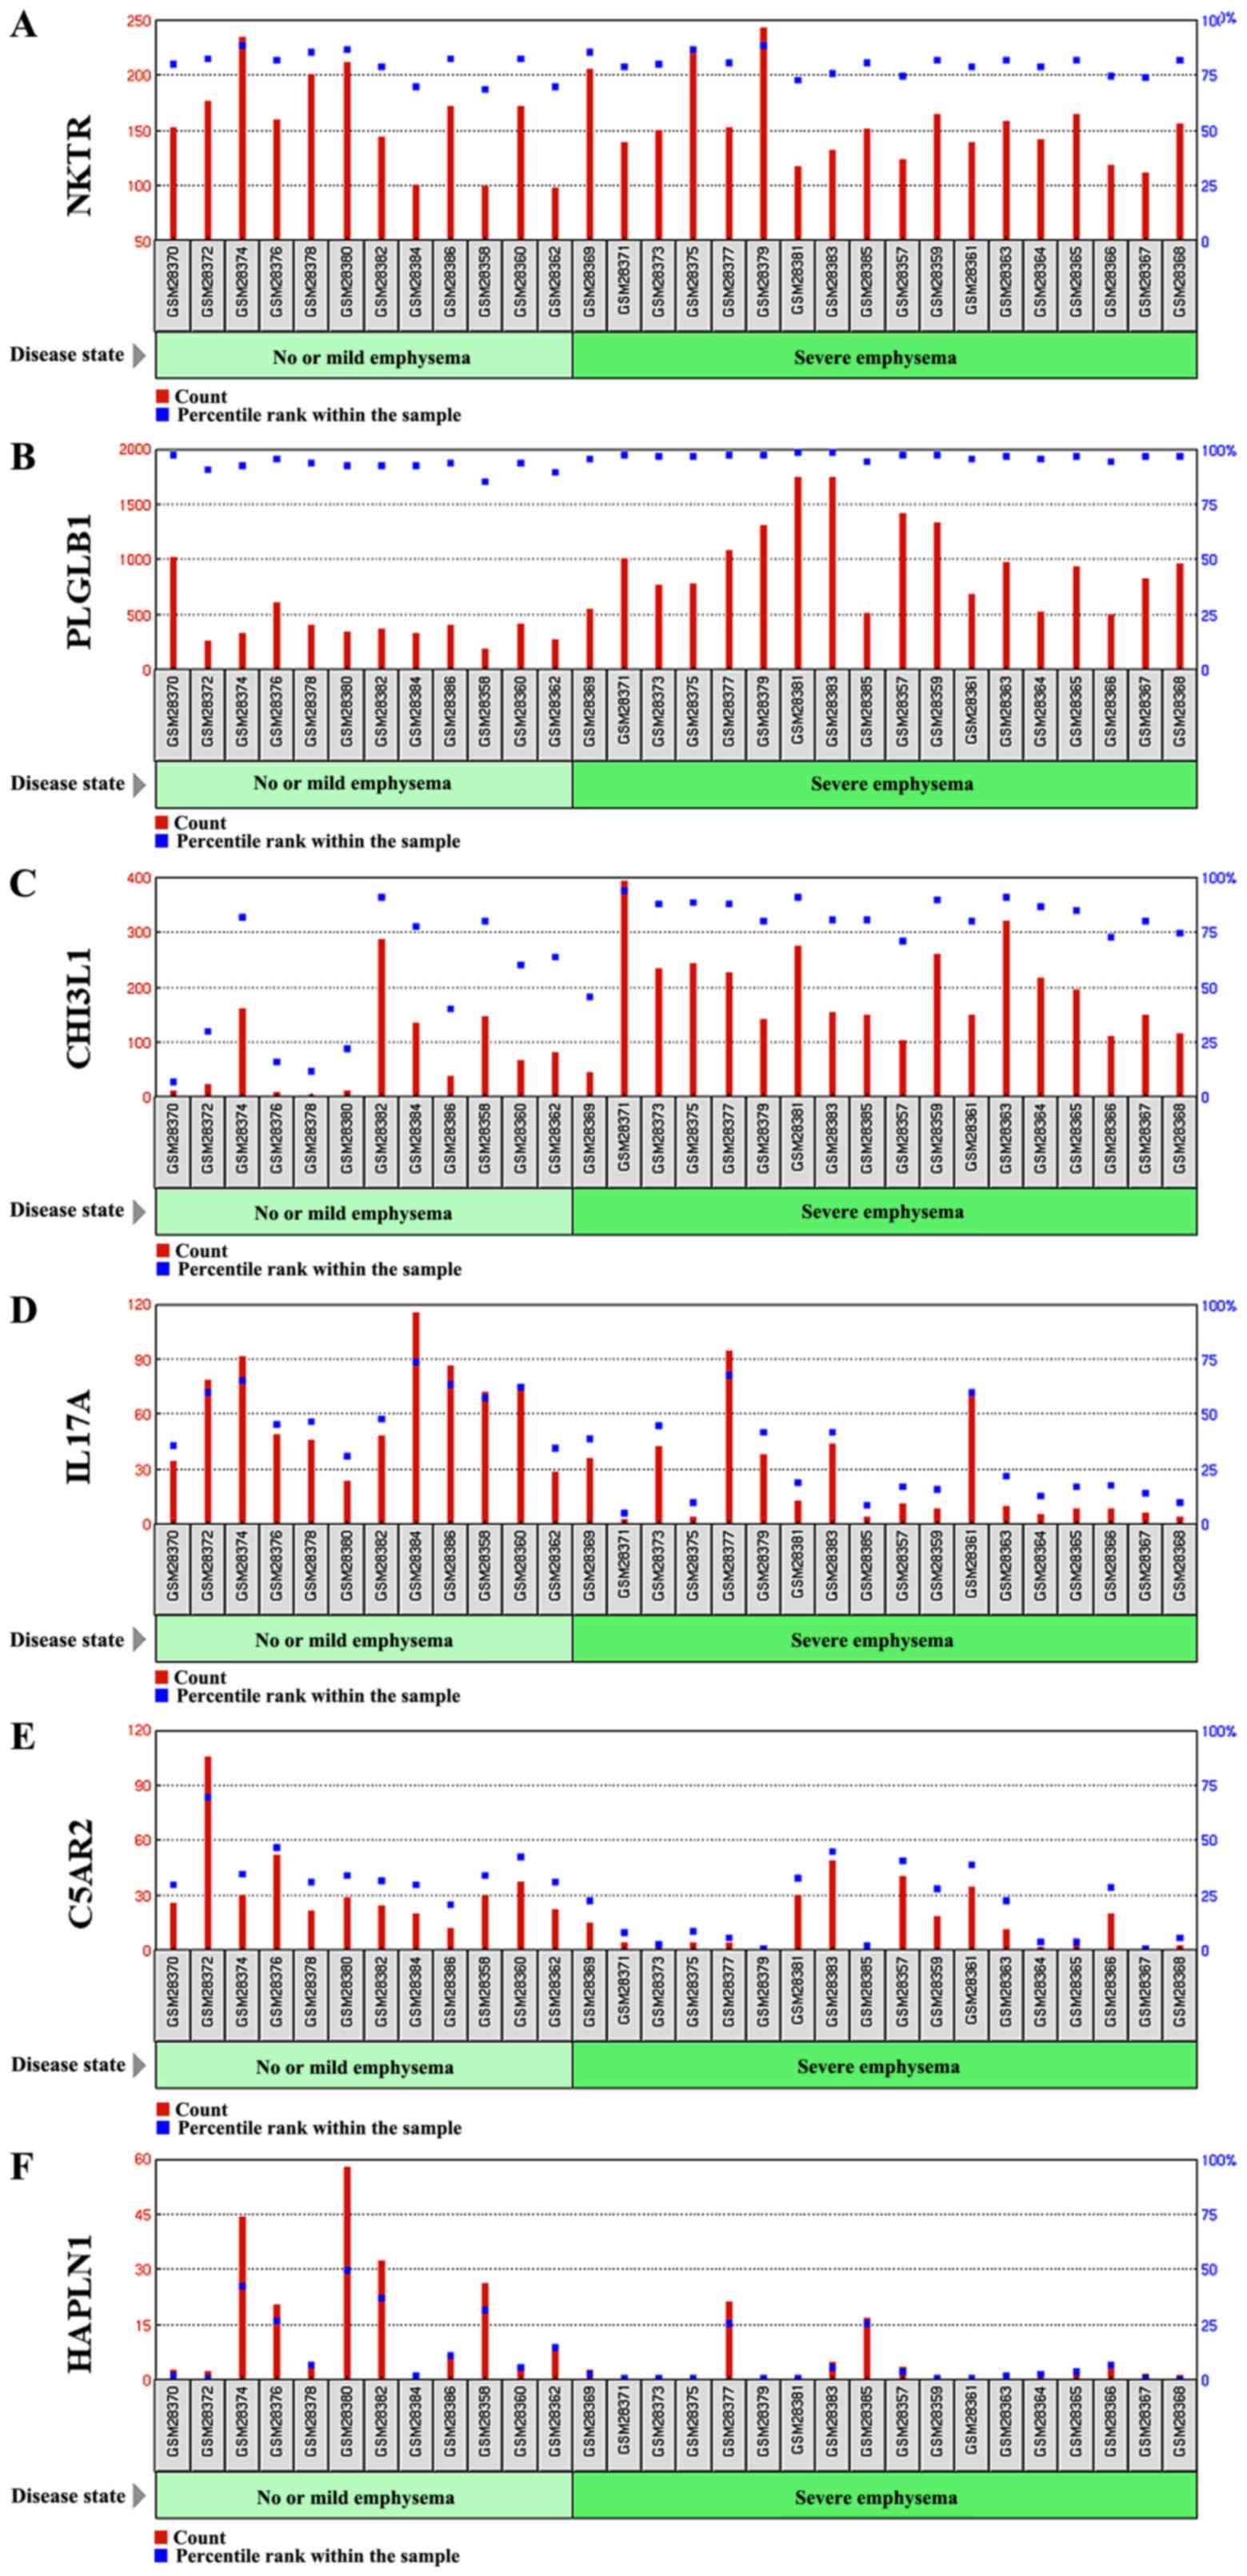
We further performed the Gene Ontology (GO)
functional enrichment analysis of six DEGs found to have a 4-fold
change in their expression (Table
II). From our DEGs analysis, it can be inferred that the NKTR
gene was upregulated 4-fold. This gene is expressed in natural
killer cells as a multi-domain structure (20) with a peptidyl-prolyl cis-trans
isomerase activity in oligopeptides assisting protein folding
(21) and a putative
tumor-recognition complex participating in NK cells function
(20). PLGLB1 is a 4-fold
upregulated gene expressed a plasminogen-like protein B found to
bind to lysine binding sites present in the kringle structures of
plasminogen (22). Similarly, CHI3L1
expression by approximately 4-fold plays an important role in
tissue remodeling, and helps to cope with the changes in
environment, T-helper cell type 2 inflammatory response and
interleukin-3 induced inflammation, as well as inflammatory cell
apoptosis (23,24).
| Table II.GO enrichment analysis of six
differentially expressed genes. |
Table II.
GO enrichment analysis of six
differentially expressed genes.
| Gene name | GO molecular
function | GO biological
process | Cellular
component | PMID |
|---|
| NKTR | Cyclosporin A
binding, peptidyl-prolyl cis-trans isomerase activity, unfolded
protein binding | Protein
peptidyl-prolyl isomerization, protein refolding | Cytosol,
mitochondrion, nucleoplasm | 20676357, 20676357,
21873635 |
| PLGLB1/PLGLB2 | –– | –– | Extracellular
region | UniProt |
| CHI3L1 | Carbohydrate
binding, chitin binding, extracellular matrix structural
constituent | Apoptotic process,
carbohydrate metabolic process, cartilage development, cellular
response to tumor necrosis factor, lung development | Endoplasmic
reticulum | 12775711, 9492324,
8245017, 18403759, 16234240 |
| IL17A | Cytokine
activity | Apoptotic process,
cell-cell signalling, cell death, cytokine- mediated signalling
pathway, immune response, inflammatory response | Extracellular
region, extracellular space | 7499828,
8390535 |
| C5AR2 | Complement
component C5a receptor activity, G protein-coupled receptor
activity | Chemotaxis,
complement receptor mediated signaling pathway, inflammatory
response, negative regulation of tumor necrosis factor
production | Basal plasma
membrane, plasma membrane | 21873635, 16204243,
22960554 |
| HAPLN1 | Extracellular
matrix structural constituent conferring compression resistance,
hyaluronic acid binding | Cell adhesion,
central nervous system development, extracellular matrix
organization, skeletal system development | Collagen-containing
extracellular matrix, extracellular matrix | 20551380, 21873635,
23979707 |
In conclusion, COPD is a lung disease ranked third
as a reason for mortality worldwide (13) This disease is influenced by both
genetic and environmental factors. Cigarette smokers are the
topmost risk factor in the western world. COPD constitutes the
leading cause of mortality related to environmental factors such as
smoking. Exacerbation of COPD exhibits various symptoms that
include cough, production of sputum or shortness of breath. It can
be caused either by bacterial or viral infections or inhaled
particles. The genetic factor can also be helpful in determining
the frequency of this disease. In this study, we performed
differential gene expression analysis of 30 samples belonging to
two different tissue types - severe emphysematous tissue and
normal/mildly emphysematous lung tissue from smokers suspicious of
lung cancer. We identified approximately 623 DEGs having 2- or more
fold-change in their expression level, out of which 6 genes have
4-fold change, and 47 genes have a 3-fold change in the expression.
We also performed GO enrichment analysis which uncovers fruitful
knowledge that can be further validated from wet lab.
Acknowledgements
Not applicable
Funding
No funding was received.
Availability of data and materials
The datasets used and/or analyzed during the current
study are available from the corresponding author on reasonable
request.
Authors' contributions
GJ conceived and designed the study. MB provided
study materials or patients and was responsible for the collection
and assembly of data, data analysis and interpretation. Both
authors were involved in writing the manuscript. Both authors read
and approved the final manuscript.
Ethics approval and consent to
participate
Ethics review submission for approval is not
required for this work. There is no identifiable more than minimal
risk for the following reasons: i) This study does not contain
human participants or animals procedures performed by any of the
authors; ii) the data were taken from publicly available resource
(GEO Datasets) where data referable to patients were properly
anonymized by submitters and informed consent was obtained by the
investigators during the original data collection; and iii) any
active dissemination, in addition to the intention to submit
findings for publication is purely an academic discussion of the
study topic, i.e., method vis-à-vis analysis of gene
expression.
Patient consent for publication
Not applicable
Competing interests
The authors declare that they have no competing
interests.
References
|
1
|
AICR, . American Institute for Cancer
Research, World Cancer Research Fund: Lung Cancer Statistics.
https://www.wcrf.org/dietandcancer/cancer-trends/lung-cancer-statistics2018
February. 2019
|
|
2
|
Bray F, Ferlay J, Soerjomataram I, Siegel
RL, Torre LA and Jemal A: Global cancer statistics 2018: GLOBOCAN
estimates of incidence and mortality worldwide for 36 cancers in
185 countries. CA Cancer J Clin. 68:394–424. 2018. View Article : Google Scholar : PubMed/NCBI
|
|
3
|
Cronin KA, Lake AJ, Scott S, Sherman RL,
Noone AM, Howlader N, Henley SJ, Anderson RN, Firth AU, Ma J, et
al: Annual report to the nation on the status of cancer, part I:
National cancer statistics. Cancer. 124:2785–2800. 2018. View Article : Google Scholar : PubMed/NCBI
|
|
4
|
Fitzmaurice C, Akinyemiju TF, Al Lami FH,
Alam T, Alizadeh-Navaei R, Allen C, Alsharif U, Alvis-Guzman N,
Amini E, Anderson BO, et al Global Burden of Disease Cancer
Collaboration, : Global, regional, and national cancer incidence,
mortality, years of life lost, years lived with disability, and
disability-adjusted life-years for 29 cancer groups, 1990 to 2016:
A systematic analysis for the global burden of disease study. JAMA
Oncol. 4:1553–1568. 2018. View Article : Google Scholar : PubMed/NCBI
|
|
5
|
Pilleron S, Sarfati D, Janssen-Heijnen M,
Vignat J, Ferlay J, Bray F and Soerjomataram I: Global cancer
incidence in older adults, 2012 and 2035: A population-based study.
Int J Cancer. 144:49–58. 2019. View Article : Google Scholar : PubMed/NCBI
|
|
6
|
AICR, . American Institute for Cancer
Research, World Cancer Research Fund. Continuous Update Project
Report: Lung Cancer. http://www.aicr.org/continuous-update-project/lung-cancer.html2018
February. 2019
|
|
7
|
Zappa C and Mousa SA: Non-small cell lung
cancer: Current treatment and future advances. Transl Lung Cancer
Res. 5:288–300. 2016. View Article : Google Scholar : PubMed/NCBI
|
|
8
|
Field RW and Withers BL: Occupational and
environmental causes of lung cancer. Clin Chest Med. 33:681–703.
2012. View Article : Google Scholar : PubMed/NCBI
|
|
9
|
Durham AL and Adcock IM: The relationship
between COPD and lung cancer. Lung Cancer. 90:121–127. 2015.
View Article : Google Scholar : PubMed/NCBI
|
|
10
|
Sekine Y, Katsura H, Koh E, Hiroshima K
and Fujisawa T: Early detection of COPD is important for lung
cancer surveillance. Eur Respir J. 39:1230–1240. 2012. View Article : Google Scholar : PubMed/NCBI
|
|
11
|
Dai J, Yang P, Cox A and Jiang G: Lung
cancer and chronic obstructive pulmonary disease: From a clinical
perspective. Oncotarget. 8:18513–18524. 2017.PubMed/NCBI
|
|
12
|
Ytterstad E, Moe PC and Hjalmarsen A: COPD
in primary lung cancer patients: Prevalence and mortality. Int J
Chron Obstruct Pulmon Dis. 11:625–636. 2016. View Article : Google Scholar : PubMed/NCBI
|
|
13
|
Vestbo J, Hurd SS, Agustí AG, Jones PW,
Vogelmeier C, Anzueto A, Barnes PJ, Fabbri LM, Martinez FJ,
Nishimura M, et al: Global strategy for the diagnosis, management,
and prevention of chronic obstructive pulmonary disease: GOLD
executive summary. Am J Respir Crit Care Med. 187:347–365. 2013.
View Article : Google Scholar : PubMed/NCBI
|
|
14
|
Chen ZH, Kim HP, Ryter SW and Choi AM:
Identifying targets for COPD treatment through gene expression
analyses. Int J Chron Obstruct Pulmon Dis. 3:359–370. 2008.
View Article : Google Scholar : PubMed/NCBI
|
|
15
|
Morrow JD, Qiu W, Chhabra D, Rennard SI,
Belloni P, Belousov A, Pillai SG and Hersh CP: Identifying a gene
expression signature of frequent COPD exacerbations in peripheral
blood using network methods. BMC Med Genomics. 8:12015. View Article : Google Scholar : PubMed/NCBI
|
|
16
|
Raza K: Analysis of microarray data using
artificial intelligence based techniques. In: Computational
Intelligence Applications in Bioinformatics. Dash S and Subudhi B
(eds). IGI Global. (Pennsylvania, PA). 216–239. 2016.
|
|
17
|
Jabeen A, Ahmad N and Raza K: Differential
expression analysis of ZIKV infected human RNA sequence reveals
potential biomarkers. bioRxiv. 4982952018.
|
|
18
|
Raza K: Reconstruction, topological and
gene ontology enrichment analysis of cancerous gene regulatory
network modules. Curr Bioinform. 11:243–258. 2016. View Article : Google Scholar
|
|
19
|
Benjamini Y and Hochberg Y: Controlling
the false discovery rate: A practical and powerful approach to
multiple testing. J R Stat Soc B. 57:289–300. 1995.
|
|
20
|
Anderson SK, Gallinger S, Roder J, Frey J,
Young HA and Ortaldo JR: A cyclophilin-related protein involved in
the function of natural killer cells. Proc Natl Acad Sci USA.
90:542–546. 1993. View Article : Google Scholar : PubMed/NCBI
|
|
21
|
Davis TL, Walker JR, Campagna-Slater V,
Finerty PJ, Paramanathan R, Bernstein G, MacKenzie F, Tempel W,
Ouyang H, Lee WH, et al: Structural and biochemical
characterization of the human cyclophilin family of peptidyl-prolyl
isomerases. PLoS Biol. 8:e10004392010. View Article : Google Scholar : PubMed/NCBI
|
|
22
|
Weissbach L and Treadwell BV: A
plasminogen-related gene is expressed in cancer cells. Biochem
Biophys Res Commun. 186:1108–1114. 1992. View Article : Google Scholar : PubMed/NCBI
|
|
23
|
Renkema GH, Boot RG, Au FL, Donker-Koopman
WE, Strijland A, Muijsers AO, Hrebicek M and Aerts JM:
Chitotriosidase, a chitinase, and the 39-kDa human cartilage
glycoprotein, a chitin-binding lectin, are homologues of family 18
glycosyl hydrolases secreted by human macrophages. Eur J Biochem.
251:504–509. 1998. View Article : Google Scholar : PubMed/NCBI
|
|
24
|
Lee CG, Hartl D, Lee GR, Koller B,
Matsuura H, Da Silva CA, Sohn MH, Cohn L, Homer RJ, Kozhich AA, et
al: Role of breast regression protein 39 (BRP-39)/chitinase
3-like-1 in Th2 and IL-13-induced tissue responses and apoptosis. J
Exp Med. 206:1149–1166. 2009. View Article : Google Scholar : PubMed/NCBI
|