Introduction
Esophageal squamous cell carcinoma (ESCC) is the
eighth most common type of cancer globally. A total of 456,000 new
cases were diagnosed during 2014, in addition to ~400,000 deaths
worldwide (1); however, the
incidence of ESCC in different countries varies considerably, with
approximately half of the newly diagnosed cases occurring in China
(1). Early-stage ESCC frequently
exhibits a number of non-specific symptoms, which the majority of
patients do not act on; therefore due to late-stage diagnosis,
patient outcome is often poor, with a 5-year survival rate of
13–18%. Although the diagnosis and treatment of ESCC have improved,
the overall mortality and annual incidence rates continue to
increase (1,2).
ESCC is a heterogeneous disease that involves
multiple complex pathways. The Wnt signaling (3), epidermal growth factor receptor
(4), T cell factor (5) and tissue factor (6) pathways are commonly dysregulated during
the initiation, progression and metastasis of ESCC; therefore, in
order to devise individualized diagnosis and treatment approaches,
the abnormalities in these molecular pathways require further
investigation. Extensive research has focused on the identification
of molecular markers for ESCC; however, only limited success has
been achieved when researching gene mutations or single proteins
(7). Gene expression profiles are an
effective means to determine tumor type and to evaluate patient
prognosis (8). Using the systemic
immune-inflammation index (9), the
expression of cancer/testis antigens (10) and determining progression markers
(11) in ESCC has been demonstrated
to effectively improve diagnosis and treatment. However, due to the
heterogeneity of ESCC it is difficult to apply all of these
prognostic signatures at once.
In the majority of studies, relapse-free or
disease-free survival have been used to effectively identify
molecular markers or to determine the prognosis of patients;
however, overall survival (OS) is considered to be the most
reliable indicator of treatment success. Therefore, the aim of the
present study was to determine whether a robust gene signature was
an effective means for predicting the OS of patients with ESCC.
Using univariate survival analysis, 1,319 genes associated with OS
in patients with ESCC were selected from The Cancer Genome Atlas
(TCGA), and a five-gene signature was developed using a robust
likelihood-based survival modeling approach. Furthermore, the
five-gene signature was used to generate a prognostic model using
BRB-Array Tools; the prognostic value of this five-gene signature
was validated in another independent cohort. The results
demonstrated that the five-gene signature was able to identify
patients at high-risk of developing ESCC.
Materials and methods
Data sources
Data from the frozen tumor specimens (n=161) and
adjacent non-tumor tissues (n=11) of 172 patients with ESCC were
retrieved from TCGA (https://cancergenome.nih.gov/; date of access,
September 15, 2017). A total of 72 samples were randomly selected
as modeling data (70 tumor and 2 normal samples), and the data were
validated using the entire TCGA dataset. The GSE20347 dataset
(including 17 tumor and 17 matched samples) was downloaded from the
Gene Expression Omnibus (GEO) database on September 15, 2017
(12).
Gene expression microarray and data
analysis
Statistical analysis of the microarray data was
performed using R software (13).
The data were normalized and transformed in order to calculate
expression values using the MA function in the ‘affy’ library. The
signal values of all of the genes were subsequently transformed to
log base 2, and quantile normalization was conducted to determine
the tantamount distributions for the probe signal intensities.
Identification of gene signatures
A robust likelihood-based survival modeling approach
(14) was used to select the gene
signatures. Analysis was performed using the ‘rbsurv’ package in R.
The calculation algorithm was as follows: i) The samples were
divided into the training set with n*(1-p) random samples, and the
validation set with n*p samples, where p=1/3. A gene was fitted to
the training set and the parameter estimate of this gene was
calculated. Log likelihood was evaluated with the parameter
estimate and the validation set, and the evaluation of each gene
was repeated; ii) the aforementioned procedure was repeated 10
times in order to calculate 10 log likelihoods for each gene. The
best gene, g (1), was selected based
on the largest mean log likelihood; iii) the next best gene was
identified by evaluating every two-gene model. Subsequently, an
ideal gene-model was selected based on the largest mean log
likelihood; and iv) the forward gene selection procedure was
continued, resulting in a series of models. The Akaike information
criterion (AIC) was then calculated for all candidate models, and
the optimal model (with the smallest AIC) was selected.
Unsupervised hierarchical clustering
and Kaplan-Meier analysis
Unsupervised hierarchical clustering analysis
(15) was performed in R using the
‘hclust’ function with Euclidean distance. Kaplan-Meier curves were
plotted for two distinct groups of patients using the ‘survfit’
function, and the P-values (log-rank test) were calculated using
the ‘survdiff’ function (16).
Development and validation of the
five-gene survival risk score system
In order to calculate the regression coefficient for
each gene (based on the 72 training samples from TCGA), the five
genes were evaluated using BRB-Array Tools v4.6.0 Beta 2
(http://linus.nci.nih.gov/BRB-ArrayTools.html) with the
survival risk group prediction tool (17); the survival risk score is the sum of
the product of the expression level of a gene and the corresponding
regression coefficient. Patients were then divided into high- and
low-risk groups based on the 50th percentile, and the leave-one-out
cross-validation method was used to ascertain robustness. Using the
RMA function in R, the gene expression data with OS information
(n=100; TCGA) were used as the validation dataset.
The survival risk scores of an independent patient
cohort downloaded from the GEO (GSE20347; including 17 tumor and 17
normal samples) were calculated using the coefficient derived from
the training dataset, and receiver operating characteristic (ROC)
curve analyses were conducted for survival prediction.
Subsequently, the sensitivity and specificity of the gene signature
were evaluated to estimate the discriminatory power of the
prognostic gene expression signatures. The area under the curve
(AUC) was calculated and a bootstrap method was used to calculate
the associated 95% confidence internal. The optimal cut-off value
(obtained based on the ROC curves) was used to divide the patients
into high- and low-risk groups, and Kaplan-Meier curves were
plotted for both groups of patients using the ‘survfit’ function in
R.
Enrichment analysis of kyoto
encyclopedia of genes and genomes (KEGG) pathways
Genes associated with the patient OS were evaluated
using the Cox proportional hazard regression model. The genes were
subjected to KEGG pathway enrichment analysis using the Gene Set
Analysis Toolkit V2 (18,19), were a hypergeometric statistical test
and BH multiple adjustment test were employed. All human genes were
used as references, and the top eight pathways were considered to
be significantly enriched.
Statistical analysis
In order to ensure the integrity and comparability
of the analyzed datasets, the GEO gene chip data were normalized
and background-corrected using the gcrma package to eliminate
systematic errors between the chips (20). The R package limma (21) was used to identify the control group
and differentially expressed genes between the treated samples, and
those with log2 (fold change) >1 and P<0.05 were
screened.
The verification data consisted of the entire 172
samples from TCGA. The adjacent normal (n=11) and ESCC tissues
(n=161) are unpaired groups, and Mann-Whitney U tests were
performed to compare gene expression between these groups. All
statistical analyses were performed using GraphPad Prism 5.0
(GraphPad Software, Inc.,) and P<0.05 (two-tailed) was
considered to indicate a statistically significant difference.
Results
The Cox proportional hazard regression model and
forward selection method were used to identify a five-gene
signature to predict the OS of patients with ESCC. The datasets
were collected from TCGA and the GEO, and the performance of the
five-gene signature was subsequently evaluated.
Identification of genes associated
with the OS of patients with ESCC
Univariate survival analysis was initially performed
with the Cox proportional hazard regression model. The analysis was
based on 72 samples with observed survival time and censoring
status data, and the threshold was set to P<0.05. A total of
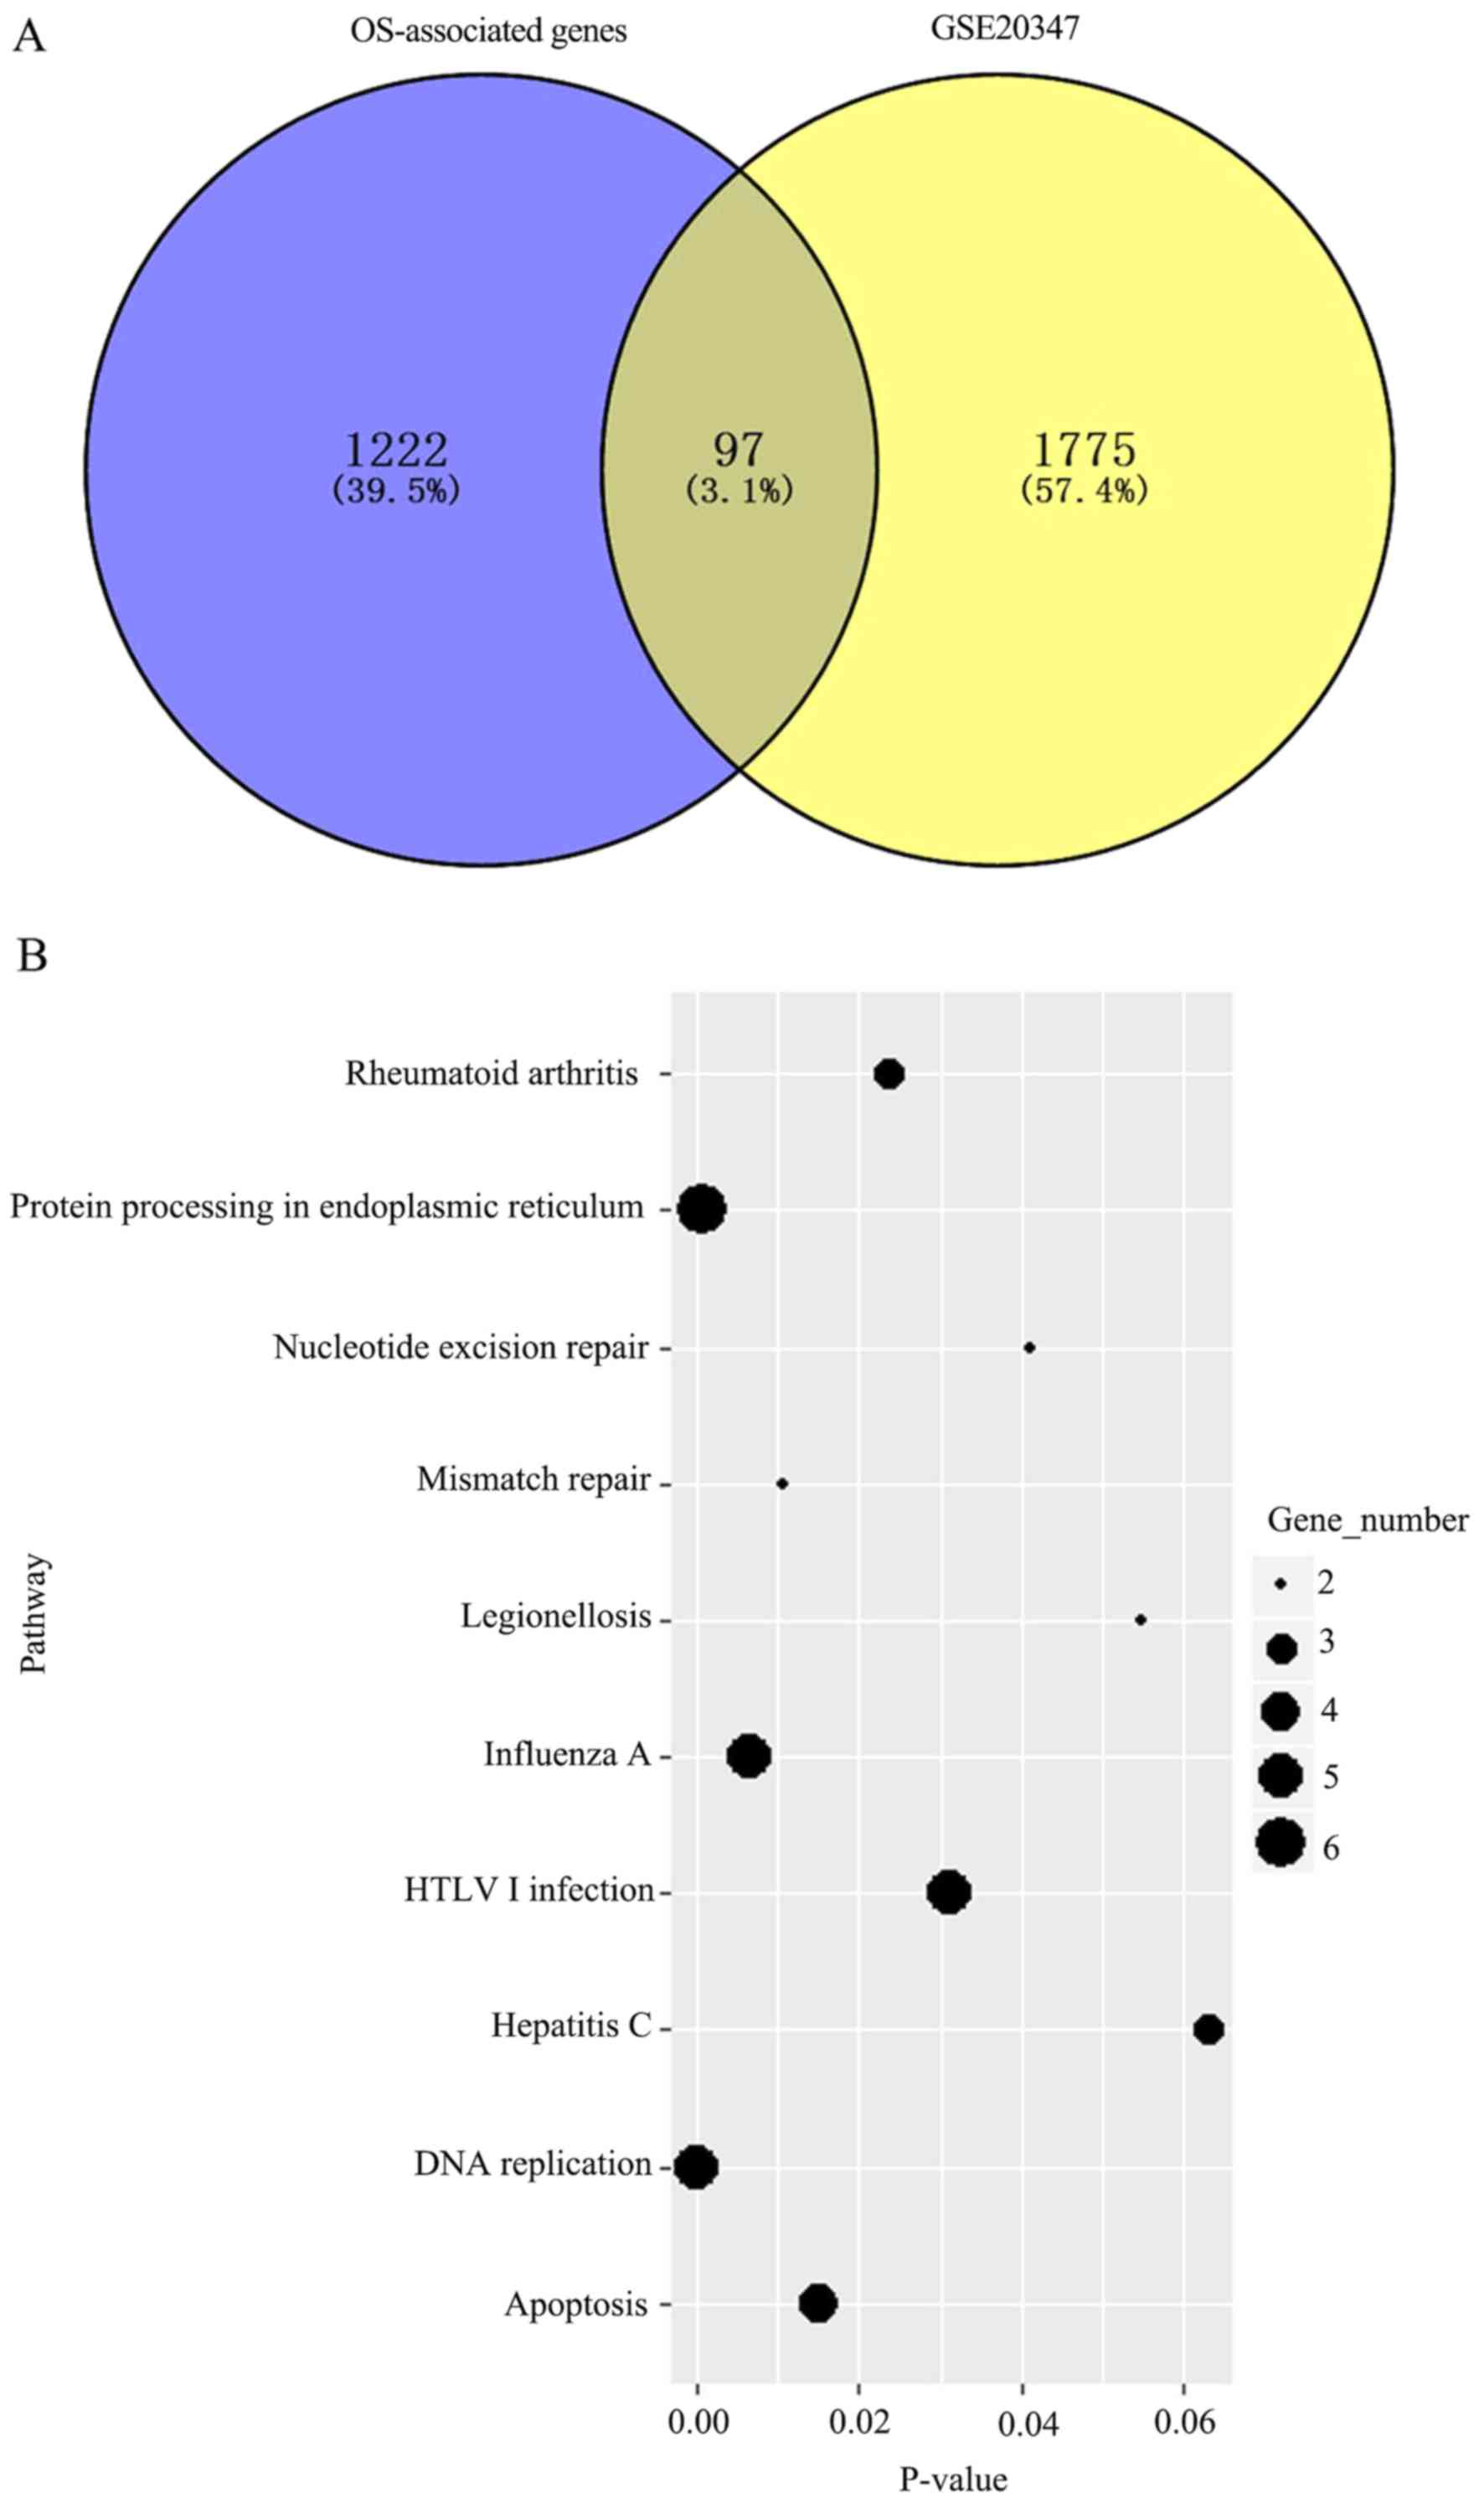
1,222 genes were determined to be associated with OS. Additionally,
the GSE20347 dataset (GEO) was analyzed and 1,775 differentially
expressed genes between tumor and normal tissues were determined; a
total of 97 intersecting genes were identified between these two
sets of results (Fig. 1A). KEGG
pathway enrichment analysis was subsequently performed for these 97
genes to determine key pathways associated with OS. The genes were
enriched in eight metabolic pathways (Fig. 1B), including DNA replication, protein
processing in endoplasmic reticulum and influenza A, which were the
most significant.
Screening of the five-gene
signature
Subsequently, the optimal survival-associated
signature genes were screened based on the Cox proportional hazard
regression model. In view of the large degree of variability in the
data, the cross-validation technique was used to divide the samples
into training and validation sets. Forward selection was employed
in order to generate a series of gene models, and the minimal AIC
was used to select the most suitable model (Table I). Ultimately, five genes were
selected for the signature: C-X-C motif chemokine ligand 8 (CXCL8),
DNA damage inducible transcript 3 (DDIT3), RAB27A, replication
factor C subunit 2 (RFC2) and elongation factor for RNA polymerase
II 2 (ELL2). This five-gene signature was able to optimally predict
the OS of patients with ESCC. Subsequently, unsupervised
hierarchical clustering analysis was performed and the patient
population was classified into Cluster 1 and 2 (Fig. 2A). The patients in Cluster 1 were
compared with those in Cluster 2, and the mortality risk was
revealed to be significantly reduced in patients in Cluster 1
(P=0.0003; Fig. 2B). Thus, the OS of
patients with ESCC was able to be predicted using the five-gene
signature.
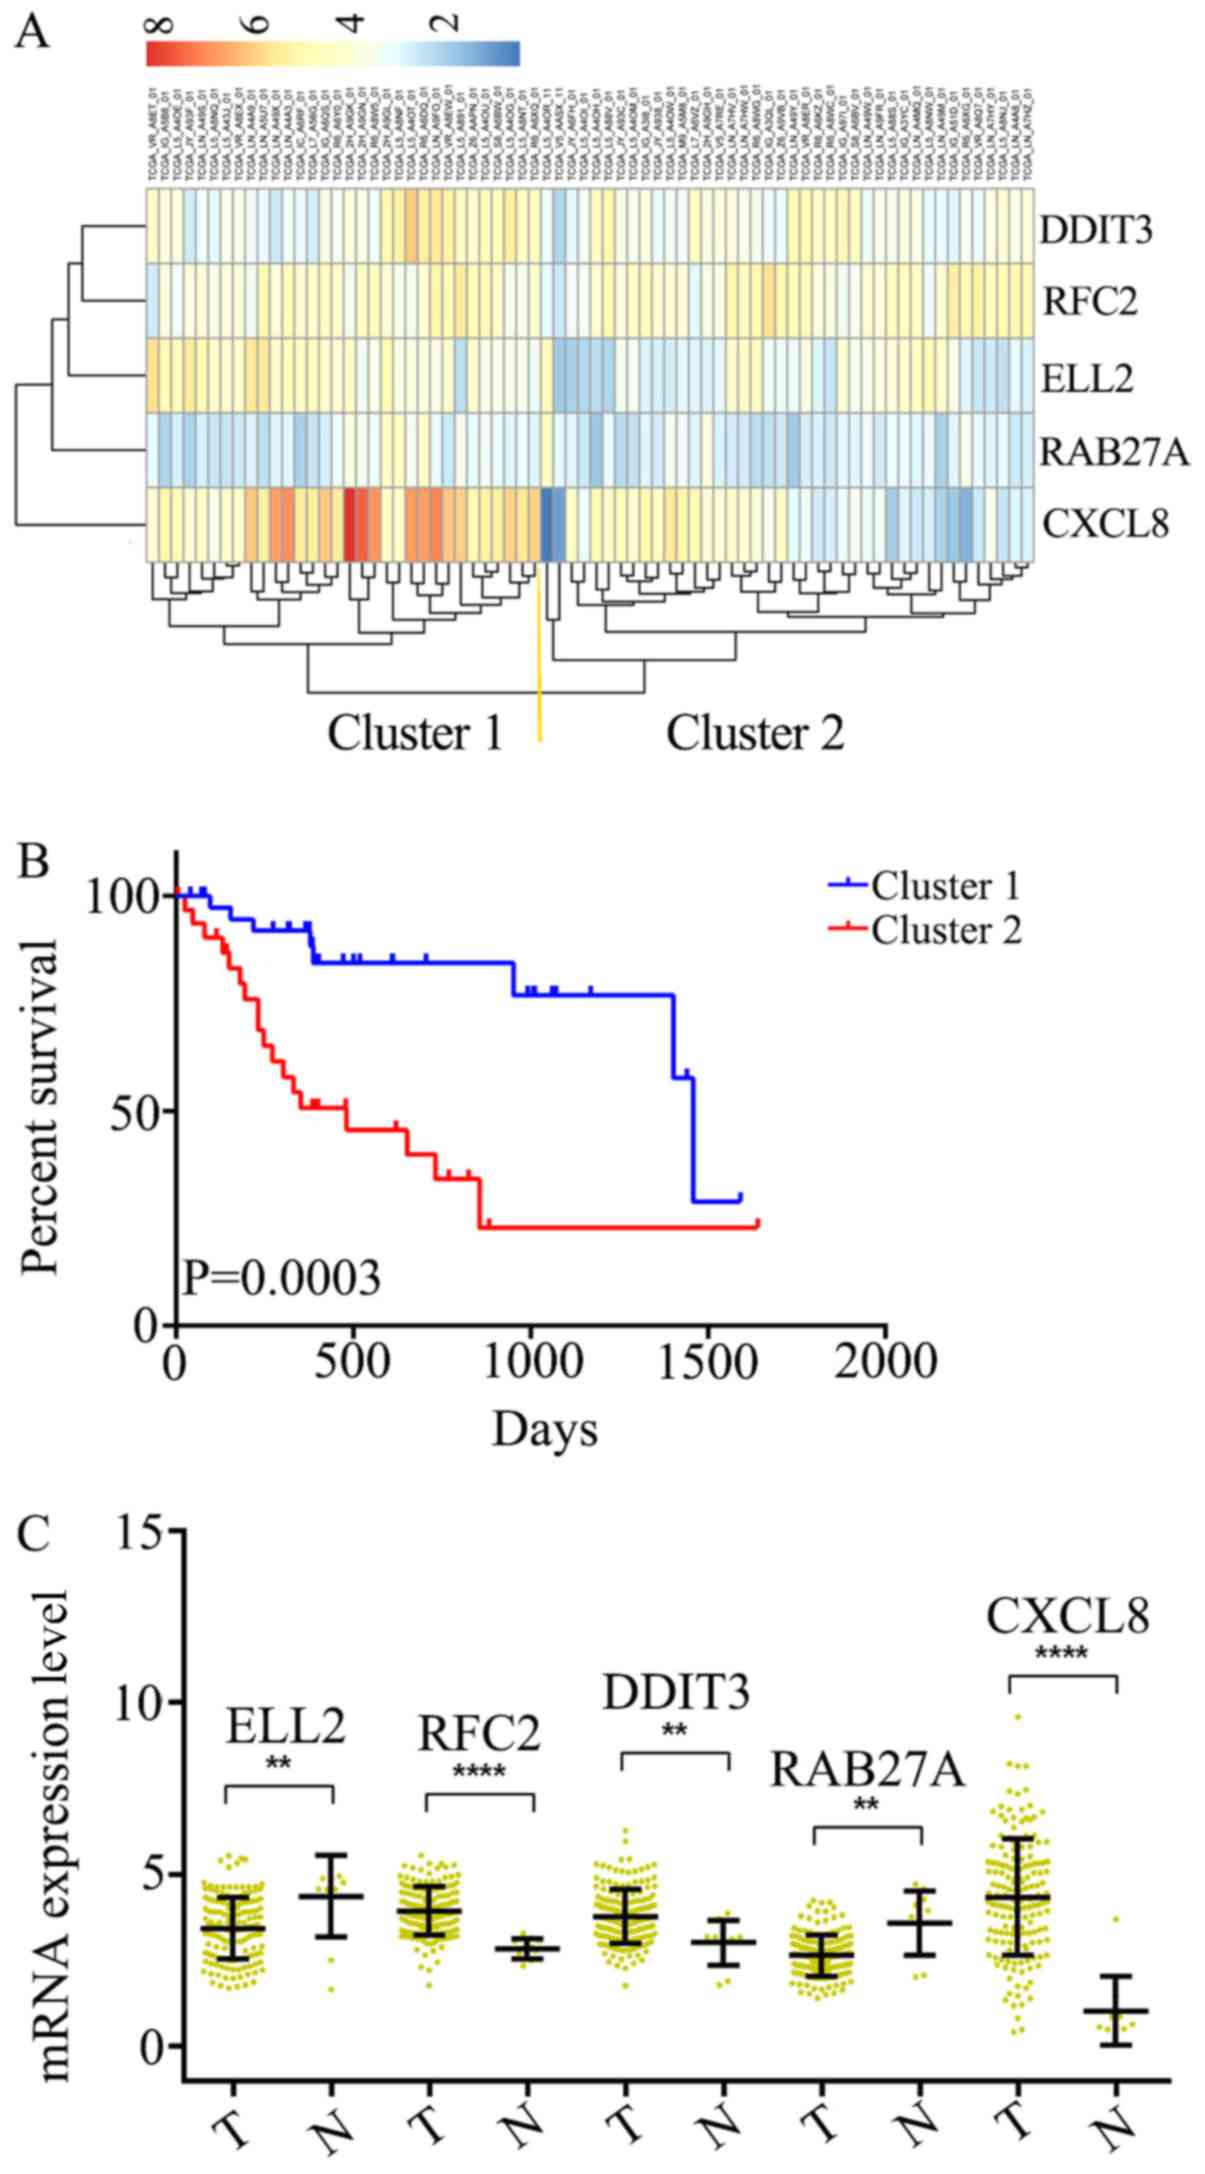 | Figure 2.Identification of an optimal gene
signature for overall survival prediction. (A) Unsupervised
hierarchical clustering analysis was performed with the five-gene
signature, which divided patients into two clusters, namely Cluster
1 and 2. (B) Kaplan–Meier curves for patients in different
clusters. (C) The mRNA expression of CXCL8, DDIT3, RAB27A, RFC2
andELL2 in 161 ESCC tissues and 11 adjacent normal tissues in TCGA
cohort. Data is represented by mean ± SD and P-values were obtained
by Mann–Whitney U test. (**P<0.01, ****P<0.0001). T, tumor
tissue; N, normal tissue; CXCL8, C-X-C motif chemokine ligand 8;
DDIT3, DNA damage inducible transcript 3; RFC2, replication factor
C subunit 2; ELL2, elongation factor for RNA polymerase II 2. |
 | Table I.Survival-associated gene signature
screening using forward selection. |
Table I.
Survival-associated gene signature
screening using forward selection.
| Gene | nLogLik | AIC |
|---|
| 0 | 93.1 | 186.21 |
| CXCL8a | 89.9 | 181.79 |
| DDIT3a | 86.31 | 176.62 |
| RAB27Aa | 84.72 | 175.43 |
| RFC2a | 81.95 | 171.9 |
| ELL2a | 76.79 | 163.57 |
| SAC3D1 | 76.34 | 164.67 |
| LMNB2 | 75.11 | 164.21 |
| PTDSS1 | 75.1 | 166.19 |
| ADORA2B | 74.16 | 166.32 |
| CDC45 | 73.71 | 167.43 |
| RPA1 | 73.09 | 168.18 |
| CAPN1 | 72.97 | 169.93 |
| ASF1B | 72.43 | 170.87 |
| CAPNS1 | 70.53 | 169.07 |
| SREBF1 | 70.35 | 170.7 |
Differential expression of the
five-gene signature in ESCC and adjacent normal tissues
The mRNA expression levels in ESCC (n=161) and
adjacent normal tissues (n=11) were analyzed among all of the 172
samples from TCGA. It was determined that RFC2, DDIT3 and CXCL8
were significantly overexpressed at the mRNA level in ESCC tissues,
compared with the adjacent normal tissues (Fig. 2C). Additionally, ELL2 and RAB27A were
found to be downregulated in ESCC tissues (Fig. 2C). Thus, these five genes were
considered to serve key roles as either tumor suppressors or
oncogenes in ESCC.
Construction of a survival risk score
system based on the five-gene signature
In order to generate the regression coefficient of
each gene, the five genes were assessed using BRB-Array Tools.
Subsequently, a survival risk scoring system was constructed based
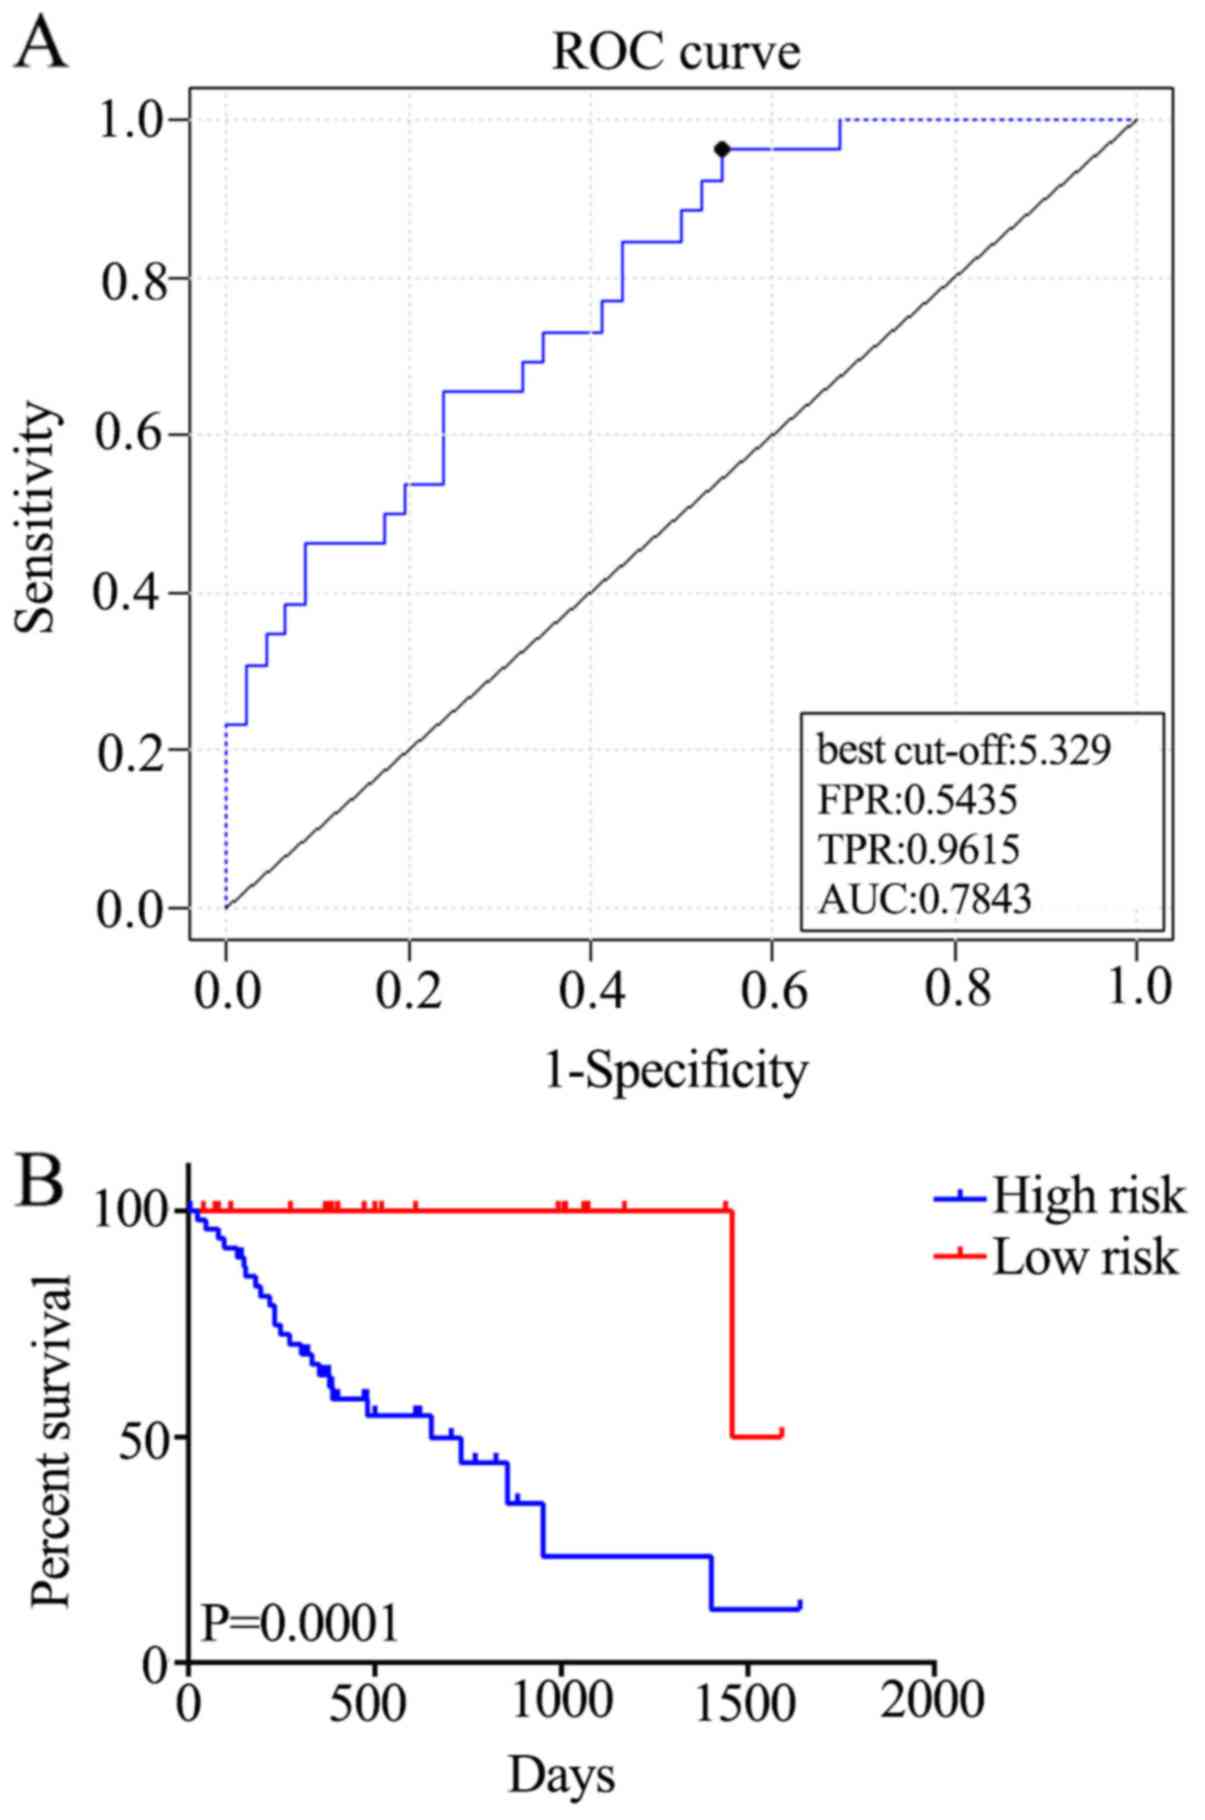
on 72 training samples. The survival risk score was calculated as
follows: Risk score=(844*ELL2)-(0.614*RFC2) + (0.88*DDIT3) +
(0.625*RAB27A) + (0.135*CXCL8); a higher survival risk score
equates to higher mortality risk in patients with ESCC. The total
AUC of the respective cross-validated time-dependent ROC curves was
0.7843 (Fig. 3A), which confirmed
the prediction accuracy of this model. Subsequently, the 72
patients with ESCC were categorized into high-(n=50) and low-risk
(n=22) groups, and the OS of the high-risk group was significantly
reduced compared with that of the low-risk group [hazard ratio
(HR)=16.37; P=0.0001; Fig. 3B].
External validation of the five-gene
signature
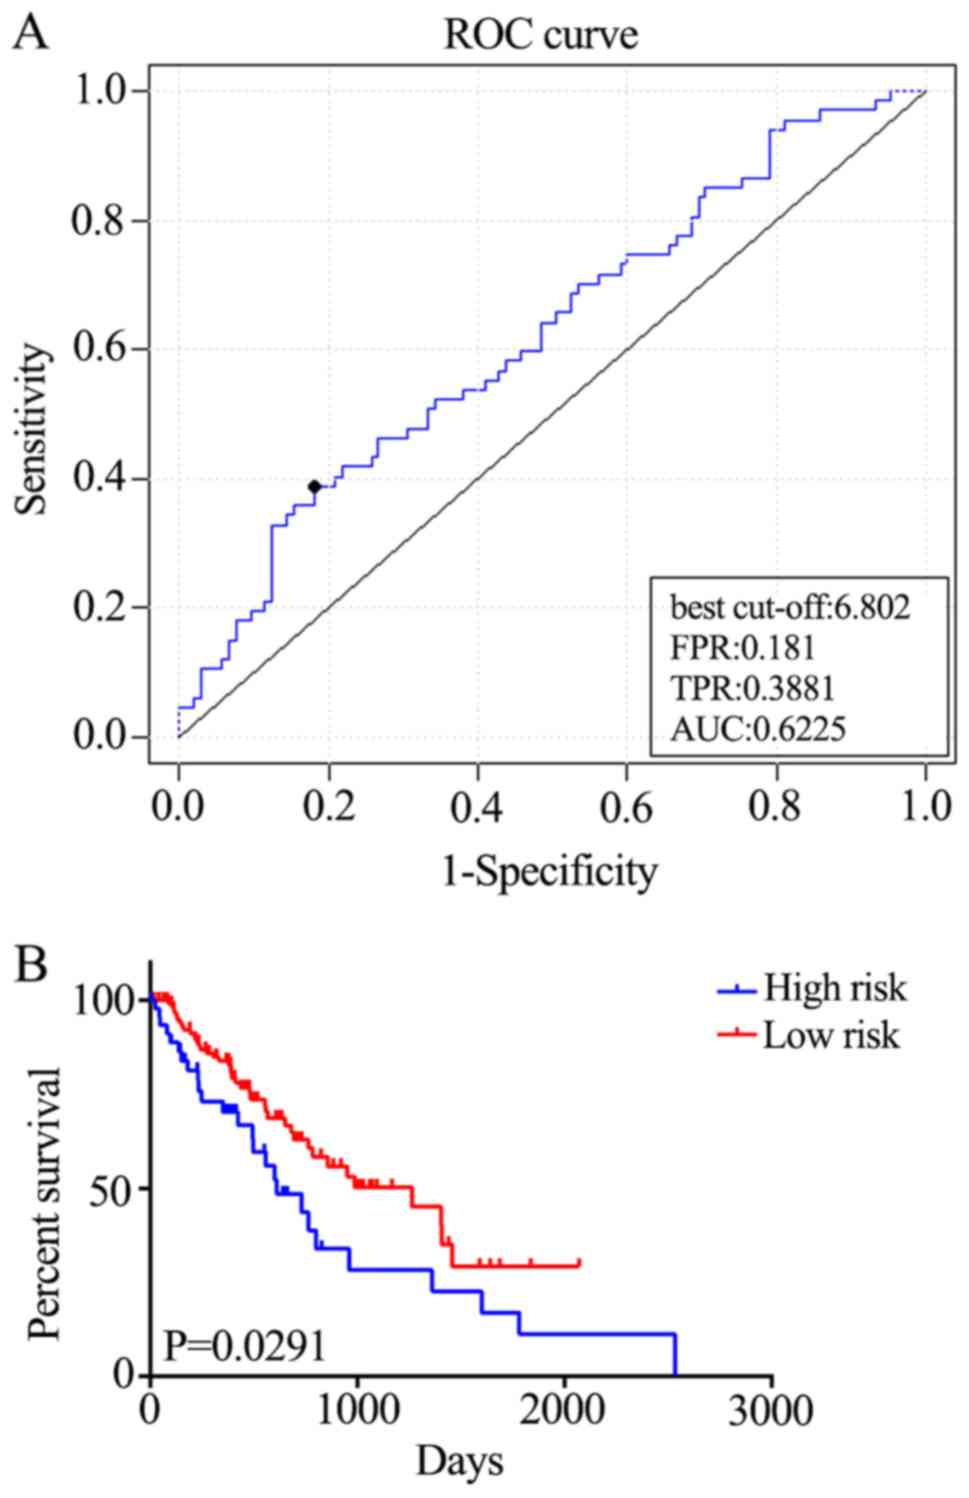
In order to assess the robustness and effectiveness
of the five-gene signature, the remaining samples (n=100) were used
as the validation dataset. ROC curve analyses demonstrated that the
five-gene signature was able to accurately predict the OS of
patients with ESCC (AUC=0.6225; Fig.
4A). Furthermore, the patients were divided into two risk
groups, based on the best cut-off risk scores, 126 (73.3%) patients
in the low-risk group and 46 (26.7%) in the high-risk group of the
validation dataset. Kaplan-Meier analysis demonstrated significant
differences in OS between the two groups (P=0.0291; Fig. 4B). Additionally, the five-gene
signature predicted the OS of patients with ESCC using univariate
analysis (Table II). Therefore, the
five-gene signature is an effective method for predicting the OS of
patients with ESCC as an independent prognostic factor.
| Table II.Univariate Cox regression analysis of
potential prognostic factors for patients with esophageal squamous
cell carcinoma. |
Table II.
Univariate Cox regression analysis of
potential prognostic factors for patients with esophageal squamous
cell carcinoma.
|
|
| Overall
survival |
|---|
|
|
|
|
|---|
|
Characteristics | Patients, n | HR (95% CI) | P-value |
|---|
| Sex |
|
| 0.0411 |
|
Female | 26 | 1 |
|
|
Male | 146 | 2.486
(1.032–3.728) |
|
| Age (years) |
|
| 0.7015 |
|
≥60 | 88 | 1 |
|
|
<60 | 84 | 1.097
(0.6811–1.775) |
|
| Stage (TNM) |
|
| <0.0001 |
|
I–II | 92 | 1 |
|
|
III–IV | 59 | 2.889
(2.048–6.533) |
|
| Risk |
|
| 0.0239 |
|
Low | 126 | 1 |
|
|
High | 46 | 1.69
(1.083–3.173) |
|
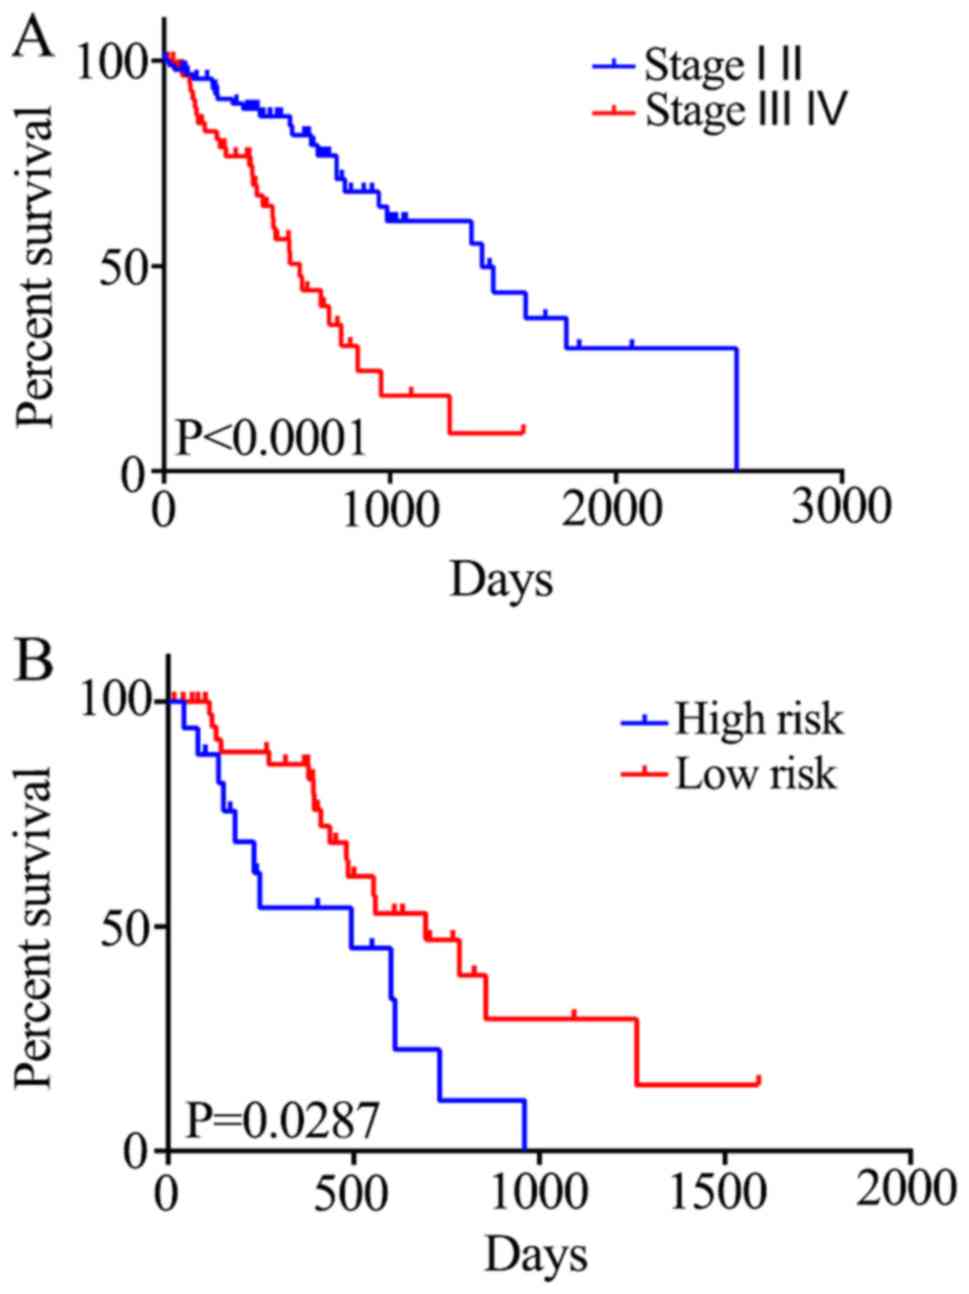
The association between the risk score and the
survival status of patients at different tumor stages was also
investigated. Stage I and II tumors were associated with a
significant increase in 5-year mortality rate compared with stage
III and IV tumors (HR=2.889; P<0.0001; Fig. 5A). Generally, there is a critical
time period for the treatment of stage III and IV ESCC; therefore,
it is crucial to evaluate the prognosis of the patients within this
period. Patients in the high-risk group exhibited reduced survival
compared with those in the low-risk group (HR=2.196; P=0.0287;
Fig. 5B). Therefore, the five-gene
signature may be able to predict the prognosis of patients with
stage III and IV ESCC.
Discussion
In the present study, a robust five-gene signature
to predict the prognosis of patients with ESCC was constructed and
validated. However, additional confounding factors should also be
considered, including the number of negative lymph nodes (22), metabolic tumor volume, total lesion
glycolysis, regional lymph node metastasis and concurrent
chemotherapy (23). Furthermore, the
included data were limited to two databases, thus the impact of
these confounding factors could not be fully elucidated.
Nonetheless, the five-gene signature highlighted the possibility of
predicting the OS of patients with ESCC. Additionally, high-risk
patients who may require targeted treatment interventions may be
identified with the five-gene signature.
Frozen tumor specimens and adjacent non-tumor tissue
of patients with ESCC were retrieved from TCGA, and a total of 72
samples were randomly selected as modeling data (70 tumor and 2
normal samples); 1,222 OS-associated genes were identified.
Furthermore, data from the GEO identified 1,775 genes associated
with OS. A venn diagram was constructed to intersect the two sets
of results, identifying a total of 97 genes associated with OS. A
number of genes were found to have prognostic value for patients
with ESCC, including FOS (24),
Adenosine Deaminase RNA Specific (25,26),
Karyopherin Subunit α 2 (27) and
Translocator protein (28). These
genes were enriched in a number of signaling pathways, including
DNA replication, protein processing in endoplasmic reticulum and
influenza, as demonstrated using KEGG analysis.
Activation of the Wnt signaling pathway frequently
(and critically) occurs during the development of ESCC, therefore
presents a therapeutic target for the disease (29). Additionally, the ubiquitin-proteasome
system is vital for apoptosis regulation and cell growth, and may
also represent a potential molecular target for the treatment and
prevention of cancer (30). In the
present study, the highlighted genes were condensed and the most
suitable five-gene signature (CXCL8, DDIT3, RAB27A, RFC2 and ELL2)
was selected for prognosis prediction. According to the National
Center for Biotechnology Information (https://www.ncbi.nlm.nih.gov/gene/), none of these
genes were associated with cancer research. However, when ESCC
tissues were compared with adjacent normal tissues, these five
genes were differentially expressed, demonstrating their potential
to promote or suppress the development of cancer. The prognostic
signature was also validated using 172 samples from TCGA, though
elucidation of the true function of these genes requires further
investigation.
In the present study, the OS of patients with ESCC
was predicted using the five-gene signature. In future studies,
comparison of high-risk patients with the entirety if the selected
cohort may indicate common responses to different therapy options.
Currently, treatment and prognosis of patients with ESCC are
primarily determined using the American Joint Committee on Cancer
Tumor-Node-Metastasis (TNM) staging system; however, the TNM system
is limited in clinical practice, and may not result in an accurate
prognosis. Currently, increased attention is focused on patients
with stage III and IV ESCC, as patients who received adjuvant
chemotherapy were indicated to have had improved outcomes (31–33).
Additionally, a number of clinical laboratory tests (including the
detection of tumor markers in the serum) have been developed to
predict the prognosis of patients with ESCC. These tests have been
evaluated in numerous validation cohorts, and are able to assist in
the application of personalized chemotherapy programs (34,35). In
the present study, the OS of patients with stage III and IV ESCC
was predicted using the five-gene signature, tough a larger sample
population may have been more beneficial to validate the prognostic
value of the five-gene signature in patients with stage III and IV
ESCC; further studies will be conducted to demonstrate whether the
five-gene signature can help to determine the benefit of adjuvant
chemotherapy for patients with stage III and IV ESCC.
In conclusion, the five-gene signature may represent
a novel biomarker for determining the prognosis of patients with
ESCC, and may also indicate potential therapeutic targets for
treating the disease.
Acknowledgements
Not applicable.
Funding
The present study was supported by the Sichuan
Science and Technology Program (grant no. 2019JDRC0076).
Availability of data and materials
All the data generated and analyzed in the present
study are available from the corresponding author on reasonable
request.
Authors' contributions
WH contributed to the study design, data acquisition
and analysis, and drafted the manuscript. QY was involved in
analyzing the data and drafting the manuscript. LF was involved in
GEO data and TCGA data acquisition. YH contributed to the study
design and revised it critically for important intellectual
content. All authors read and approved the final manuscript.
Ethics approval and consent to
participate
Not applicable.
Patient consent for publication
Not applicable.
Competing interests
The authors declare that they have no competing
interests.
References
|
1
|
McGuire S: World Cancer Report 2014.
Geneva, Switzerland: World Health Organization, International
Agency for Research on Cancer, WHO Press, 2015. Adv Nutr.
7:418–419. 2016. View Article : Google Scholar : PubMed/NCBI
|
|
2
|
Enzinger PC and Mayer RJ: Esophageal
cancer. N Engl J Med. 349:2241–2252. 2003. View Article : Google Scholar : PubMed/NCBI
|
|
3
|
Luo J, Wang W, Tang Y, Zhou D, Gao Y,
Zhang Q, Zhou X, Zhu H, Xing L and Yu J: mRNA and methylation
profiling of radioresistant esophageal cancer cells: The
involvement of Sall2 in acquired aggressive phenotypes. J Cancer.
8:646–656. 2017. View Article : Google Scholar : PubMed/NCBI
|
|
4
|
Zhang W, Pang Q, Yan C, Wang Q, Yang J, Yu
S, Liu X, Yuan Z, Wang P and Xiao Z: Induction of PD-L1 expression
by epidermal growth factor receptor-mediated signaling in
esophageal squamous cell carcinoma. Onco Targets Ther. 10:763–771.
2017. View Article : Google Scholar : PubMed/NCBI
|
|
5
|
Zhang W, Yan S, Liu M, Zhang G, Yang S, He
S, Bai J, Quan L, Zhu H, Dong Y and Xu N: Beta-catenin/TCF pathway
plays a vital role in selenium induced-growth inhibition and
apoptosis in esophageal squamous cell carcinoma (ESCC) cells.
Cancer Lett. 296:113–122. 2010. View Article : Google Scholar : PubMed/NCBI
|
|
6
|
Xiang J, Zang W, Che J, Chen K and Hang J:
Regulation network analysis in the esophageal squamous cell
carcinoma. Eur Rev Med Pharmacol Sci. 16:2051–2056. 2012.PubMed/NCBI
|
|
7
|
Ashktorab H, Kupfer SS, Brim H and
Carethers JM: Racial disparity in gastrointestinal cancer risk.
Gastroenterology. 153:910–923. 2017. View Article : Google Scholar : PubMed/NCBI
|
|
8
|
Quackenbush J: Microarray analysis and
tumor classification. N Engl J Med. 354:2463–2472. 2006. View Article : Google Scholar : PubMed/NCBI
|
|
9
|
Wang L, Wang C, Wang J, Huang X and Cheng
Y: A novel systemic immune-inflammation index predicts survival and
quality of life of patients after curative resection for esophageal
squamous cell carcinoma. J Cancer Res Clin Oncol. 143:2077–2086.
2017. View Article : Google Scholar : PubMed/NCBI
|
|
10
|
Salmaninejad A, Zamani MR, Pourvahedi M,
Golchehre Z, Hosseini Bereshneh A and Rezaei N: Cancer/testis
antigens: Expression, regulation, tumor invasion, and use in
immunotherapy of cancers. Immunol Invest. 45:619–640. 2016.
View Article : Google Scholar : PubMed/NCBI
|
|
11
|
Lin ZW, Gu J, Liu RH, Liu XM, Xu FK, Zhao
GY, Lu CL and Ge D: Genome-wide screening and co-expression network
analysis identify recurrence-specific biomarkers of esophageal
squamous cell carcinoma. Tumour Biol. 35:10959–10968. 2014.
View Article : Google Scholar : PubMed/NCBI
|
|
12
|
Barrett T, Troup DB, Wilhite SE, Ledoux P,
Rudnev D, Evangelista C, Kim IF, Soboleva A, Tomashevsky M and
Edgar R: NCBI GEO: Mining tens of millions of expression
profiles-database and tools update. Nucleic Acids Res 35 (Database
Issue). D760–D765. 2007. View Article : Google Scholar
|
|
13
|
James G, Witten D, Hastie T and Tibshirani
R: An introduction to statistical learning with applications in R.
Springer-Verlag New York; 2013
|
|
14
|
Cho HJ, Ami Y, Kim S, Kang J, Seung-Mo H
and Kang: Robust likelihood-based survival modeling with microarray
data. J Statist Software. 29:1–16. 2008.
|
|
15
|
Eisen MB, Spellman PT, Brown PO and
Botstein D: Cluster analysis and display of genome-wide expression
patterns. Proc Natl Acad Sci USA. 95:14863–14868. 1998. View Article : Google Scholar : PubMed/NCBI
|
|
16
|
Therneau T: A package for survival
analysis in S. R package version 2.37–7. 2014.
|
|
17
|
Simon R, Lam A, Li MC, Ngan M, Menenzes S
and Zhao Y: Analysis of gene expression data using BRB-ArrayTools.
Cancer Inform. 3:11–17. 2007. View Article : Google Scholar : PubMed/NCBI
|
|
18
|
Ogata H, Goto S, Sato K, Fujibuchi W, Bono
H and Kanehisa M: KEGG: Kyoto encyclopedia of genes and genomes.
Nucleic Acids Res. 27:29–34. 1999. View Article : Google Scholar : PubMed/NCBI
|
|
19
|
Wang J, Vasaikar S, Shi Z, Greer M and
Zhang B: WebGestalt 2017: A more comprehensive, powerful, flexible
and interactive gene set enrichment analysis toolkit. Nucleic Acids
Res 45 (W1). W130–W137. 2017. View Article : Google Scholar
|
|
20
|
Wu C, Irizarry R, MacDonald J and Gentry
J: gcrma: Background adjustment using sequence information.
2005.
|
|
21
|
Ritchie ME, Phipson B, Wu D, Hu Y, Law CW,
Shi W and Smyth GK: Limma powers differential expression analyses
for RNA-sequencing and microarray studies. Nucleic Acids Res.
43:e472015. View Article : Google Scholar : PubMed/NCBI
|
|
22
|
Wu H, Liu C, Xu M, Guo M, Xu S and Xie M:
Prognostic value of the number of negative lymph nodes in
esophageal carcinoma without lymphatic metastasis. Thorac Cancer.
9:1129–1135. 2018. View Article : Google Scholar : PubMed/NCBI
|
|
23
|
Yildirim BA, Torun N, Guler OC and Onal C:
Prognostic value of metabolic tumor volume and total lesion
glycolysis in esophageal carcinoma patients treated with definitive
chemoradiotherapy. Nucl Med Commun. 39:553–563. 2018. View Article : Google Scholar : PubMed/NCBI
|
|
24
|
Li JC, Zhao YH, Wang XY, Yang Y, Pan DL,
Qiu ZD, Su Y and Pan JJ: Clinical significance of the expression of
EGFR signaling pathway-related proteins in esophageal squamous cell
carcinoma. Tumour Biol. 35:651–657. 2014. View Article : Google Scholar : PubMed/NCBI
|
|
25
|
Qin YR, Qiao JJ, Chan TH, Zhu YH, Li FF,
Liu H, Fei J, Li Y, Guan XY and Chen L: Adenosine-to-inosine RNA
editing mediated by ADARs in esophageal squamous cell carcinoma.
Cancer Res. 74:840–851. 2014. View Article : Google Scholar : PubMed/NCBI
|
|
26
|
Zhang J, Chen Z, Tang Z, Huang J, Hu X and
He J: RNA editing is induced by type I interferon in esophageal
squamous cell carcinoma. Tumour Biol. 39:10104283177085462017.
View Article : Google Scholar : PubMed/NCBI
|
|
27
|
Sakai M, Sohda M, Miyazaki T, Suzuki S,
Sano A, Tanaka N, Inose T, Nakajima M, Kato H and Kuwano H:
Significance of karyopherin-{alpha} 2 (KPNA2) expression in
esophageal squamous cell carcinoma. Anticancer Res. 30:851–856.
2010.PubMed/NCBI
|
|
28
|
Yuan Y, Xue L and Fan F: Screening of
differentially expressed genes related to esophageal squamous cell
carcinoma and functional analysis with DNA microarrays. Int J
Oncol. 44:1163–1170. 2014. View Article : Google Scholar : PubMed/NCBI
|
|
29
|
Anastas JN and Moon RT: WNT signalling
pathways as therapeutic targets in cancer. Nat Rev Cancer.
13:11–26. 2013. View
Article : Google Scholar : PubMed/NCBI
|
|
30
|
McBride WH, Iwamoto KS, Syljuasen R,
Pervan M and Pajonk F: The role of the ubiquitin/proteasome system
in cellular responses to radiation. Oncogene. 22:5755–5773. 2003.
View Article : Google Scholar : PubMed/NCBI
|
|
31
|
Wang BY, Lin PY, Wu SC, Chen HS, Hsu PK,
Shih CS, Liu CY, Liu CC and Chen YL: Comparison of pathologic stage
in patients receiving esophagectomy with and without preoperative
chemoradiation therapy for esophageal SCC. J Natl Compr Canc Netw.
12:1697–1705. 2014. View Article : Google Scholar : PubMed/NCBI
|
|
32
|
Li L, Zhao L, Lin B, Su H, Su M, Xie D,
Jin X and Xie C: Adjuvant Therapeutic modalities following
three-field lymph node dissection for stage II/III esophageal
squamous cell carcinoma. J Cancer. 8:2051–2059. 2017. View Article : Google Scholar : PubMed/NCBI
|
|
33
|
Zhang L, Li W, Lyu X, Song Y, Mao Y, Wang
S and Huang J: Adjuvant chemotherapy with paclitaxel and cisplatin
in lymph node-positive thoracic esophageal squamous cell carcinoma.
Chin J Cancer Res. 29:149–155. 2017. View Article : Google Scholar : PubMed/NCBI
|
|
34
|
Tong Q, Wang XL, Li SB, Yang GL, Jin S,
Gao ZY and Liu XB: Combined detection of IL-6 and IL-8 is
beneficial to the diagnosis of early stage esophageal squamous cell
cancer: A preliminary study based on the screening of serum markers
using protein chips. Onco Targets Ther. 11:5777–5787. 2018.
View Article : Google Scholar : PubMed/NCBI
|
|
35
|
Kunizaki M, Hamasaki K, Wakata K, Tobinaga
S, Sumida Y, Hidaka S, Yasutake T, Miyazaki T, Matsumoto K,
Yamasaki T, et al: Clinical value of serum p53 antibody in the
diagnosis and prognosis of esophageal squamous cell carcinoma.
Anticancer Res. 38:1807–1813. 2018.PubMed/NCBI
|