Introduction
Colorectal cancer (CRC) is a common malignancy and a
main cause of cancer-associated mortalities globally (1,2).
Although significant progress has been achieved in understanding
the pathogenesis of CRC, current treatment regimens remain with a
low 5-year survival rate, particularly for patients diagnosed with
a late stage of the disease. The majority of patients with CRC are
diagnosed with an advanced stage of CRC, and thus further
improvements in the treatment of these patients are of the utmost
importance. Cytoskeleton regulation is a key mechanism that drives
invasiveness and metastasis in the majority of carcinoma cases
(3). Targeting driver genes may be
the most successful strategy for treating patients with malignancy
and to increase their rate of survival (4); therefore, further studies are required
to identify novel therapeutic markers for CRC.
MicroRNAs (miRNAs) are endogenous, small non-coding
RNA molecules that regulate the expression of target mRNA at a
post-transcriptional level by binding to complementary sites within
the 3′-untranslated region (5). It
is now known that ~60% of protein-coding genes are regulated by
miRNAs (5) and are involved in a
number of processes, involving proliferation, migration, invasion,
metastasis, angiogenesis and cytoskeleton disruption (6–9).
Recently, several hundred differentially expressed miRNAs have been
identified by multiple miRNA profiling studies using
high-throughput technologies, such as microarray and next
generation sequencing, and reported to serve a role in a number of
cellular processes, such as miR-200 suppressing CRC migration and
miR-106b promoting metastasis (10);
however, the mechanisms driving miRNAs in regulating CRC
progression remain unclear. Identification of aberrant miRNA
expression is the starting point in numerous studies for
investigating the influences of miRNAs in CRC. In the present
study, one miRNA was identified, miR-96-5p. miR-96-5p has been
demonstrated to serve a crucial role in the tumor progression of a
number of carcinoma types, including pancreatic carcinoma (11), prostate cancer (12) and hepatocellular carcinoma (13); however, its underlying mechanism in
carcinogenesis and progression in CRC remains unknown. Therefore,
the aim of the present study was to investigate the role of
miR-96-5p in in cell migration and invasion through in vitro
studies, and identify which regulatory cytoskeleton mRNA expression
are altered in miR-96-5p-inhibitor and mimic-transfected cells.
Materials and methods
Selection of candidate miRNAs
A PubMed (https://www.ncbi.nlm.nih.gov/) search was conducted on
CRC miRNA expression profiling studies published between January
2006 and December 2013. Only studies comparing miRNA expression of
CRC tissues with apparently normal adjacent tissues were
considered. Intersection analysis was performed using the Venn
Diagram software (https://www.venndiagram.net), available online
(14). Candidate colon
cancer-associated miRNAs were selected according to the following
criteria: i) The differentially expressed miRNA was reported in at
least two independent studies; ii) these upregulated or
downregulated miRNAs were grouped accordingly from independent
studies.
Tissue samples and detection of
miR-96-5p
A total of 26 archived paraffin-embedded CRC
specimens and paired apparently normal adjacent tissues collected
between January 2010 and December 2011 were provided by Kuala
Lumpur Hospital, Malaysia. Ethics approval was obtained from the
National Medical Ethics Board (approval no. NMRR-12-435-11565). The
demographic and clinicopathological data of 26 patients, from which
the CRC tissues were obtained, are detailed in Table I. The resected colon tissues were
histologically observed by hematoxylin and eosin staining, briefly,
(6 µm thickness) paraffin slice 60°C dried in an oven for 1 h then
conventional xylene, ethanol dewaxing to water, hematoxylin
staining for 3 min, flushed with running water to remove residual
colour, eosin staining for 30 sec, following 90% ethanol 30 sec,
95% ethanol 30 sec, 100% ethanol 30 sec twice, finally xylene fixed
30 sec, neutral gum sealed at room temperature, observed by Olympus
reverse microscope (Olympus Corporation, Tokyo, Japan). Sections of
4 µm thickness of CRC tumor tissue vs. normal adjacent
tissue as viewed under the microscope were manually cut from a
tissue wax block, mounted onto glass slides followed by
deparaffinization, miRNA extraction was performed with the miRNeasy
FFPE kit (cat. no. 217504; Qiagen GmbH, Hilden Germany), according
to manufacturer's protocols. cDNA was synthesized through
reverse-transcription using the Universal cDNA synthesis kit
(Exiqon; Qiagen), according to manufacturer's protocols. miR-96-5p
(cat. no. 204417) and U6 (cat. no. 203907) primers were purchased
from Exiqon (Qiagen). Due to Locked Nucleic Acid technology was
used in the primer synthesis and is covered by patents owned by
Exiqon (Qiagen), the sequences of the primers were not provided.
Quantitative polymerase chain reaction (qPCR) was conducted with a
Mastercycler EP realplex 4 (Eppendorf, Hamburg, Germany) using the
SYBR® Green master mix Universal RT kit (Exiqon;
Qiagen). qPCR parameters were set as follows: 10 min at 95°C, 40
amplification cycles of 10 sec at 95°C, and annealing and extension
for 1 min at 60°C. Each sample was run in triplicate. U6 was used
as the reference gene and the relative expression was calculated
using the standard curve method (15).
 | Table I.Clinical and pathological
characteristics of patients included in the present study. |
Table I.
Clinical and pathological
characteristics of patients included in the present study.
| Clinicopathological
parameters | Number of patients
(n=26) |
|---|
| Sex |
|
|
Male | 16 |
|
Female | 10 |
| Age at diagnosis
(years) |
|
|
≤60 | 5 |
|
>60 | 21 |
| Race |
|
|
Chinese | 12 |
|
Malay | 10 |
|
Indian | 2 |
| Stage at diagnosis
(56) |
|
| I | 10 |
| II | 8 |
|
III | 8 |
| Tumor site |
|
| Left
colon | 14 |
| Right
colon | 4 |
|
Rectum | 8 |
Cell culture and transfection
The human CRC cell lines HCT116, Caco2, HT29, SW480
and SW620 were purchased from American Type Culture Collection
(Manassas, VA, USA). All of the five cell lines were maintained in
RPMI-1640 medium supplemented with 10% fetal bovine serum (FBS)
(Gibco; Thermo Fisher Scientific, Inc., Waltham, MA, USA), 100
IU/ml penicillin and 100 mg/ml streptomycin, and incubated at 37°C
in a humidified chamber containing 5% CO2.
The miR-96-5p inhibitor, miRNA inhibitor negative
control oligos, miR-96-5p mimic and miRNA mimic negative control
oligos were purchased from Exiqon (Qiagen) and Cell Death small
interfering RNA (siRNA: siRNA-6 (cat. no. si00287448), siRNA-7(cat.
no. i00287455), which was used as positive control, was purchased
from Qiagen. HCT116 cells (2.1×10⁴/well), SW620 cells
(5.5×10⁴/well) and SW480 cells (5.5×10⁴/well)
were plated into 24-well plates. HCT116 cells and SW620 cells were
cultured in 400 µl RPMI-1640 medium containing 10% FBS, and SW480
cells were cultured in 500 µl RPMI-1640 medium supplemented with
10% FBS and penicillin and streptomycin for 24 h prior to
transfection at 37°C in a 5% CO2 incubator. HCT116 cells
and SW620 cells were transfected with Lipofectamine®
2000 (Invitrogen; Thermo Fisher Scientific, Inc.), and SW480 cells
were transfected with HiPerFect (Qiagen), according to
manufacturer's protocols. The corresponding transfection conditions
are described in Table II. Cells
were transferred into Transwell inserts for cell migration assay
and cell invasion assay 48 h after transfection.
| Table II.Optimal transfection conditions. |
Table II.
Optimal transfection conditions.
| Cell line | Complex | Total volume
(µl) |
|---|
| HCT116 | 0.75 µl LF+5 µl
miRNA | 100 |
| SW620 | 0.75 µl LF+5 µl
miRNA | 100 |
| SW480 | 6 µl
HF+6 µl miRNA | 100 |
Reverse-transcription-qPCR
(RT-qPCR)
For detection of miR-96-5p expression in CRC cell
lines, miRNAs were extracted using the miRNeasy Micro kit (Qiagen).
The total RNA was diluted to 500 ng/µl with nuclease free water.
The nuclease-free micro-centrifuge tube included 2 µl total RNA, 1
µl enzyme mix, 2 µl reaction buffer and 3 µl nuclease-free water.
All reagents were mixed and voted gently and finally incubated at
42°C for 60 min to synthesize first-strand cDNA. Then, the
nuclease-free tube was heated at 95°C for 5 min to inactivate the
reverse transcriptase prior to cooling on ice for 5 min. Real-time
PCR components mix included 2X SYBR Select Master Mix 5 µl, forward
and reverse primer 0.25 µl each, cDNA template 1 µl and 3.5 µl
RNase-free water. The thermocycling conditions were as follows:
95°C for 2 min, 40 cycles at 95°C for 15 sec, 60°C for 15 sec and
72°C for 60 sec. PCR reactions were performed in duplicate and
analyzed by standard curves to assess the amplification
specificity.
MTT assay
HCT116 cells (2.5×10³/well), SW620 cells
(8.4×10³/well) and SW480 cells (8.4×10³/well)
were plated in 96-well plates and transfected with miR-96-5p
inhibitor or mimics 96 h prior to the MTT assay according to the
previously described protocol. MTT solution (10 µl) was added into
each well and the cells were incubated with MTT for 4 h at 37°C in
the dark. The RPMI-1640 was replaced with 100 µl dimethylsulfoxide
(Amresco, LLC, Solon, OH, USA). The absorbance at 570 nm was
measured with a spectrophotometric microtiter plate reader (Dynex
Technologies, Inc., Chantilly, VA, USA). The same experiment was
repeated three times and each experiment was performed in
triplicate. The cell viability values were expressed as a
percentage of the control condition, which was considered as 100%
cell viability.
Transwell assay for cell migration and
invasion
The in vitro cell invasion and migration
assays were conducted utilizing Transwell inserts
(Falcon®; BD Biosciences, Franklin Lakes, NJ, USA). The
bottom of the Transwell insert is made of a polyethylene
terephthalate (PET) membrane with 8 µm pores, allowing cells to
pass through. Cell migration was considered positive when cells
were capable of moving from one site to another, whilst for cell
invasion, positive results were when cells invaded through the
basement membrane into an adjacent tissue or vasculature;
therefore, the PET membrane of Transwell insert used in cell
invasion experiment was coated with 5 mg/ml Matrigel Matrix (BD
Biosciences). The Transwell inserts were placed into 24-well cell
culture plates separating the wells into upper and lower chambers.
An invasive subpopulation called SW480-7 was derived from SW480
cell line in vitro, briefly, parental SW480 cells were
subjected to the Transwell Matrigel invasion assay, the cells that
invaded to the bottom of the membrane were detached with 0.25%
trypsin and cultured in a new cell culture flask filled with
RPMI-1640 medium. The cells were established via 7 sequential
passages through Matrigel-coated Transwells. SW480-7 cells were
transfected 48 h prior to the Transwell assay as performed by the
previously outlined protocol. Transfected cells were resuspended in
200 µl serum-free medium (RPMI-1640) and then seeded into the upper
chambers of Matrigel coated membranes (for cell invasion assay) or
uncoated membranes (for cell migration assay) at a density of
1×10⁵/well, and 700 µl RPMI-1640 medium containing 10%
FBS was added to the lower chamber to serve as a chemoattractant.
After 72 h of incubation in a humidified cell culture incubator,
the cells were fixed in cold 95% ethanol for 10 min. The cells that
remained on the upper side of the membranes were stained with 2
µg/ml DAPI (KPL, Inc., Gaithersburg, MD, USA) for 2 min, room
temperature and the invasive cells that had reached the lower side
of the membranes were stained with 1 µg/ml propidium iodide
(Sigma-Aldrich; Merck KGaA, Darmstadt, Germany) for 1 min. Cells in
12 different fields were counted under an inverted fluorescence
microscope at ×200 magnification connected to a digital camera with
which images were captured. In order to eliminate the influence of
non-specific factors, such as loading error, on the results of
Transwell assay, the cell invasive capacity was defined as the
ratio of invaded cell numbers to that of non-invaded cells, rather
than counting only the numbers of invaded cells at bottom surface
of the membrane. The experiments were repeated three times. The
invasive capacity of a treated sample was normalized to that of the
corresponding control. One-sample unpaired Student's t-test was
used to test the differences of normalized invasive capacities of
three independent experiments with the hypothetical value (set to
1).
Cytoskeleton Regulators RT2
Profiler PCR array
SW480-7 cells were plated in 6-well plates and
transfected with miR-96-5p inhibitor or miRNA inhibitor negative
control oligos 48 h prior to the PCR array. Total RNA was isolated
using GeneJET RNA Purification kit (cat. no. K0731; Thermo Fisher
Scientific, Inc.). The purity and concentration of total RNA were
determined with a Nanodrop 1000 spectrophotometer (Thermo Fisher
Scientific, Inc.), and RNA integrity was ascertained by agarose gel
electrophoresis. Genomic DNA was removed by treatment with DNase I
(cat.no. ED0521; Thermo Fisher Scientific), according to the
manufacturer's protocol. RNA was reverse-transcribed to cDNA using
RT2 First Strand kit (cat. no. 330401; Qiagen),
following the manufacturer's protocol. Subsequently, qPCR was
performed using a 96-well Cytoskeleton Regulators RT2
Profiler PCR array (cat. no. PAHS-088ZA; Qiagen). The PCR cycling
program was set as follows: Segment 1, denaturing at 95°C for 10
min; segment 2, 40 amplification cycles of annealing at 95°C for 15
sec and extension at 60°C for 1 min. mRNA expression was normalized
to the housekeeping gene GAPDH and the fold changes relative to the
negative control were calculated. All data from the PCR array was
analyzed by the Qiagen PCR Array Data Analysis Web Portal
(www.SABiosciences.com/pcrarraydataanalysis.php.) using
the ΔΔCq method (16).
Validation of the target genes
The six pairs of primers (Table III) were designed using the
primer-BLAST interface of NCBI database (https://blast.ncbi.nlm.nih.gov/Blast.cgi, BLAST+
2.8.1) and synthesized by Integrated DNA Technologies, Inc.
(Skokie, IL, USA). Firstly, RNA isolation and DNase treatment were
performed with the same protocols aforementioned. Then cDNA was
synthesized with: 2 µl DNA digested RNA (500 µg/µl) being mixed
with 0.5 µl oligo (dT)18 primer (0.5 µg/µl) (cat. no. S0131; Thermo
Fisher Scientific, Inc.) and 10 µl diethyl pyrocarbonate treated
water, then incubated at 65°C for 5 min and chilled on ice until
reaching room temperature. A Master Mix was prepared, which
contained 1 µl ReverAid Reverse transcriptase (200 U/µl) (cat. no.
EP0441; Thermo Fisher Scientific, Inc.) supplemented with 4 µl 5X
Reaction buffer (Qiagen), 0.5 µl Ribolock RNase inhibitor (40 U/µl;
cat. no. EO0381; Thermo Fisher Scientific, Inc.) and 2 µl dNTP (10
mM; cat. no. R0192; Thermo Fisher Scientific, Inc.). The
synthesized cDNA was incubated at −20°C until use. qPCR was
performed with SYBR Select Master Mix (cat. no. 4472908; Thermo
Fisher Scientific, Inc.). GAPDH was set as the reference gene
according to the aforementioned protocol. Finally, the gene
expression values of mRNAs were analyzed by normalizing with the
internal control, GAPDH, and relative quantitation values were
calculated (16).
| Table III.Sequences of primers used in reverse
transcription-quantitative polymerase chain reaction analysis. |
Table III.
Sequences of primers used in reverse
transcription-quantitative polymerase chain reaction analysis.
| Gene | Primer |
|---|
| IQGAP2 | Forward
5′-GCACACACTCACTCCTGTTG-3′ |
|
| Reverse
5′-GTCAACTGCTCCTTCCCCAA-3′ |
| CCNA1 | Forward
5′-CGACTTTCGGACTACCAGGAA-3′ |
|
| Reverse 5′-
GGTCTTAAGGTCAAAGGACGA-3′ |
| PHLDB2 | Foward
5′-CCAGGGAACGGGAAATGGAA-3′ |
|
| Reverse
5′-GGTAGCGTGTCAAAGGACGA-3′ |
| MYLK | Forward
5′-GAGGACCCTGGGAAGATAA-3′ |
|
| Reverse
5′-GAGCCAAGGCCCCAAGC-3′ |
| BAIAP2 | Forward
5′-GCCAGCGAGAGCCAGGGC-3′ |
|
| Reverse
5′-GGAGCAGAAGGTGGAGCTG-3′ |
| MACF1 | Forward
5′-ACAGCCAGGGAGGAGGAC-3 |
|
| Reverse
5′-AGAAACAGACTCCCAAAGA-3′ |
| GAPDH | Forward
5′-AATCCCATCACCATCTTCCA-3″ |
|
| Reverse
5′-TGGACTCCACGACGTACTCA-3′ |
Statistical analysis
Statistical analysis was performed using GraphPad
InStat version 3.05 for Windows (GraphPad Software, Inc., San
Diego, CA, USA), all data obtained in the RT-qPCR, viability,
invasion, and migration were calculated by one sample
t-test. Quantitative results were stated as the mean ±
standard deviation. A two-sided P<0.05 was considered to
indicate a statistically significant difference.
Results
Selection of aberrantly expressed
miRNA in CRC tissues
A total of nine independent miRNA profiling studies
in CRC (Table IV) were identified
using the PubMed search. Intersection analysis with a ‘Venn
Diagram’ demonstrated that four miRNAs were aberrantly expressed in
three independent studies. One of the miRNAs identified was
miR-96-5p, and studies with the remaining three miRNAs are
currently underway.
| Table IV.Summary of genome-wide microRNA
profiling studies on CRC. |
Table IV.
Summary of genome-wide microRNA
profiling studies on CRC.
| Reference | Year | Technique | Stage of CRC | (Refs.) |
|---|
| Brunet Vega et
al | 2013 | Microarray
analysis | Tx, N1-3 and
M0 | (22) |
| Hamfjord et
al | 2012 | Next generation
sequencing | T2-3, N0-3 and
Mx | (23) |
| Callari et
al | 2012 | Microarray
analysis | T2-4, Nx and
Mx | (24) |
| Arndt et
al | 2009 | Microarray
analysis | T1-4, N0-3 and
M0-1 | (50) |
| Motoyama et
al | 2009 | Microarray
analysis | T1-4, N0-1 and
M0 | (51) |
| Sarver et
al | 2009 | Microarray
analysis | T3-4, N0-3 and
M0-1 | (52) |
| Schepeler et
al | 2008 | Microarray
analysis | T3-4, N0 and
M0 | (53) |
| Schetter et
al | 2008 | Microarray
analysis | T1-4, N0-3 and
M0-1 | (54) |
| Bandres et
al | 2006 | qPCR | T3-4, N0-3 and
M0-1 | (55) |
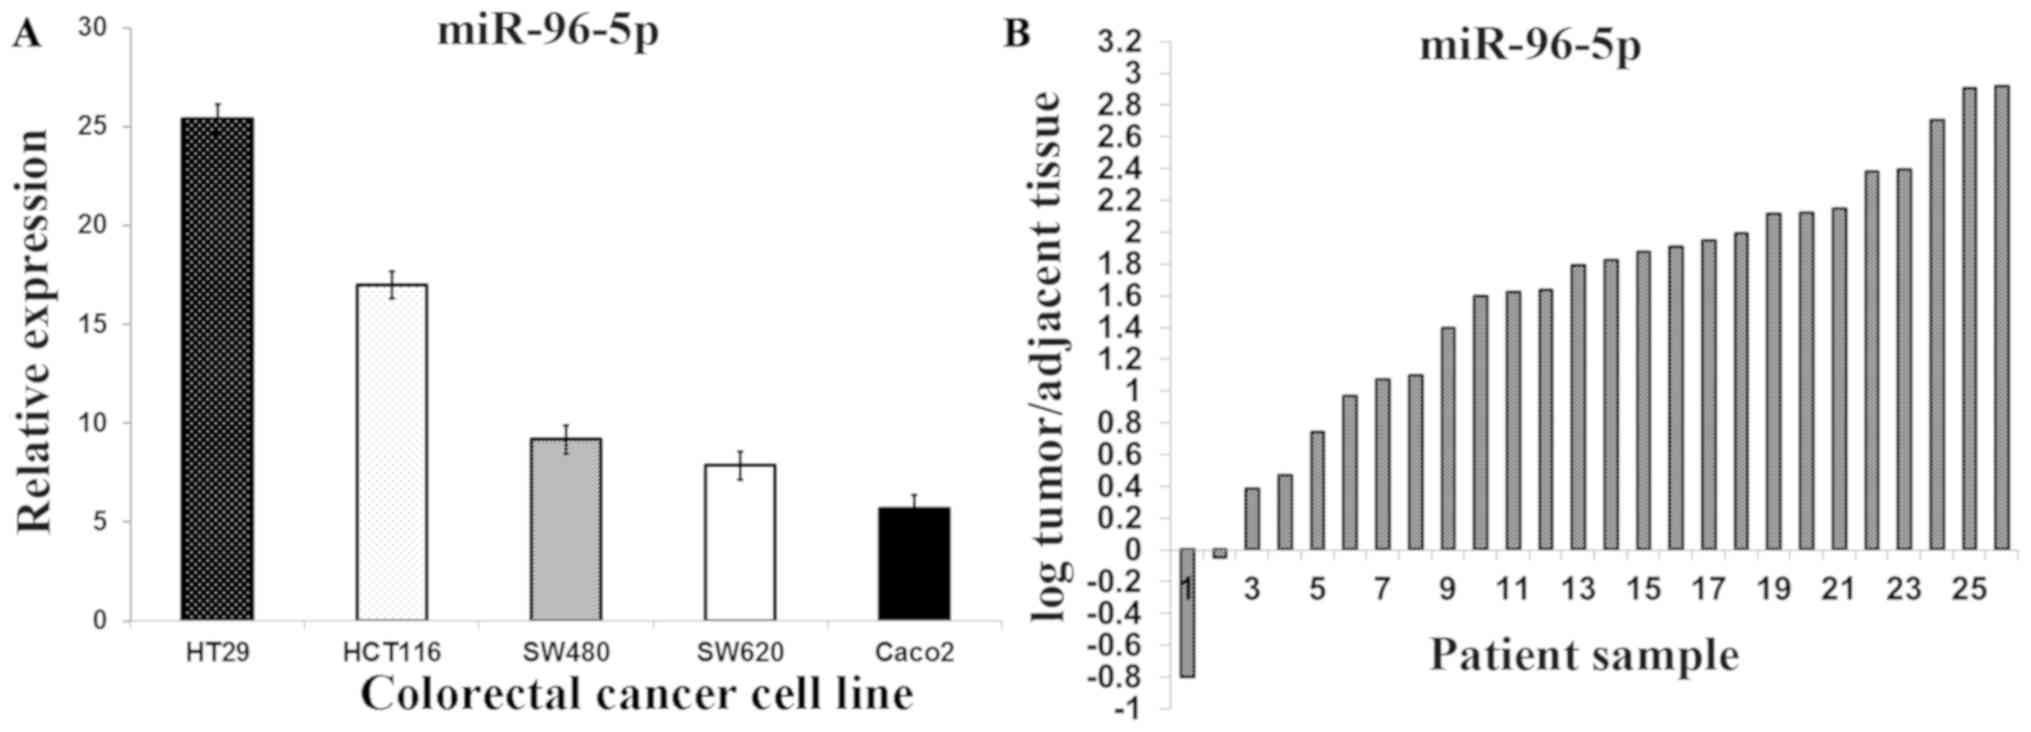
Expression of miR-96-5p in five CRC
cell lines and tissue samples
RT-qPCR studies of miR-96-5p in five CRC cell lines
demonstrated that its expression increased by 25.43-fold in the
HT29 cell line, 17.00-fold in the HCT116 cell line, 9.18-fold in
the SW480 cell line, 7.86-fold in the SW620 cell line and 5.67-fold
in the Caco2 cell line (Fig. 1A). A
significant increase in the miR-96-5p expression in 26 primary CRC
tissues, compared with apparently normal adjacent tissues, was also
determined (3.32±3.35 vs. 0.58±0.61; P=0.01; Fig. 1B)
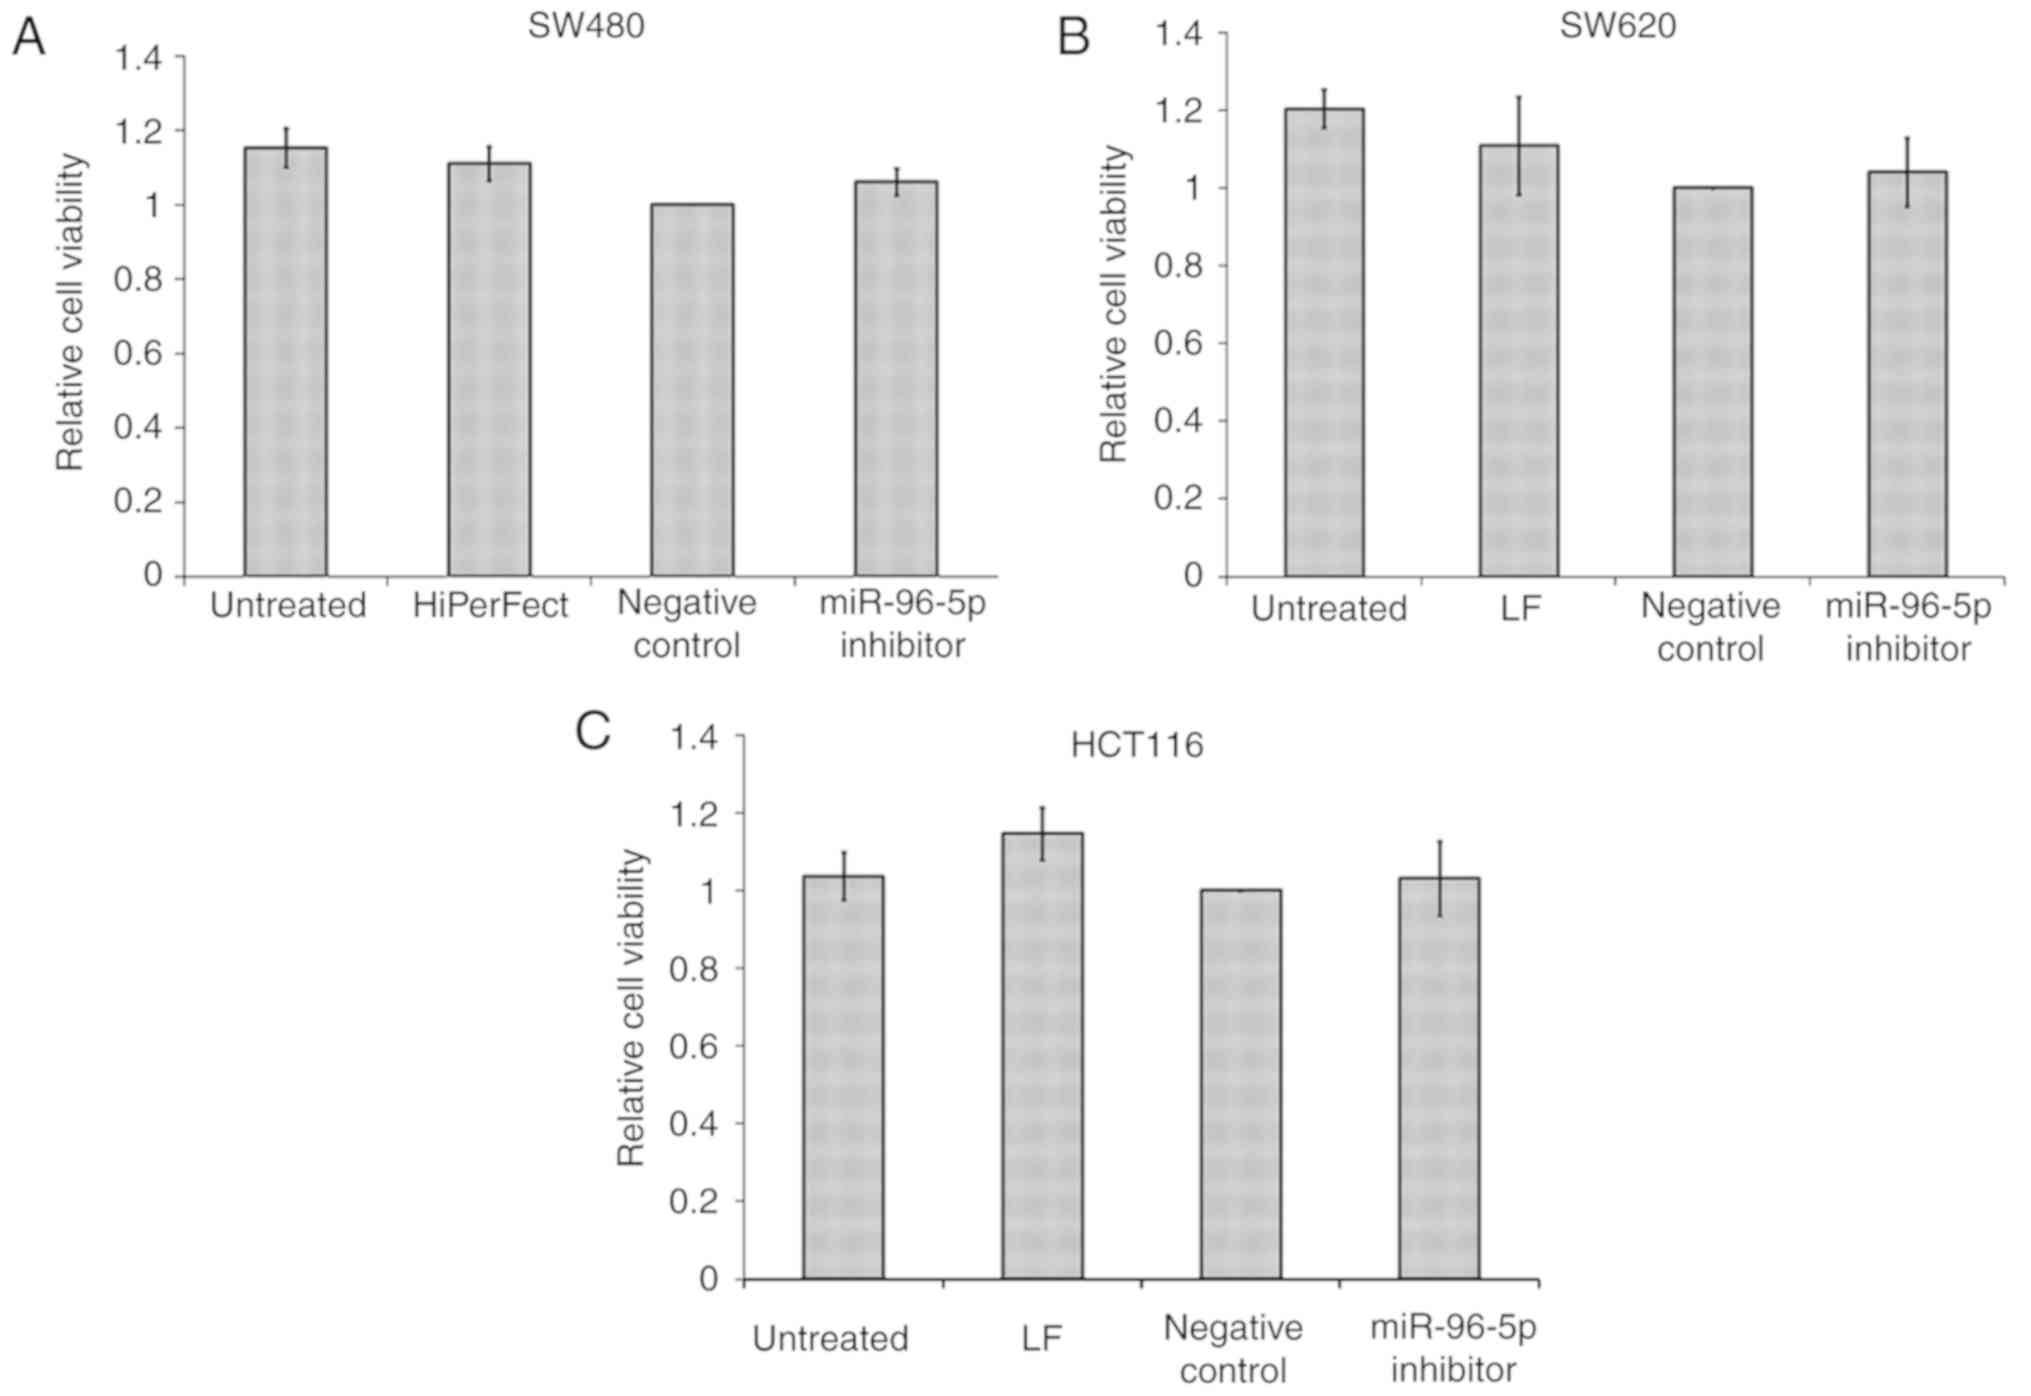
Effects of miR-96-5p inhibitor on the
viability of three CRC cell lines
Following transfection optimization, only three out
of the five CRC cell lines, HCT116, SW480 and SW620, were
successfully transfected. HCT116 and SW620 were successfully
transfected with Lipofectamine 2000 and SW480 with HiPerFect. HT29
and Caco2 could not be used for further experiments due to the
transfecting reagents being toxic to these cell lines. The majority
of HCT116, SW480 and SW620 cells died following transfection with
Cell Death siRNA (data not shown). As miR-96-5p was aberrantly
upregulated in CRC, CRC cells were transfected with the miR-96-5p
inhibitor 6 h prior to the MTT assay, which was performed to detect
cell viability (Fig. 2). The result
indicated that the miR-96-5p inhibitor had no significant effects
on the cell viability of the HCT116, SW480 and SW620 cell lines
(P>0.05).
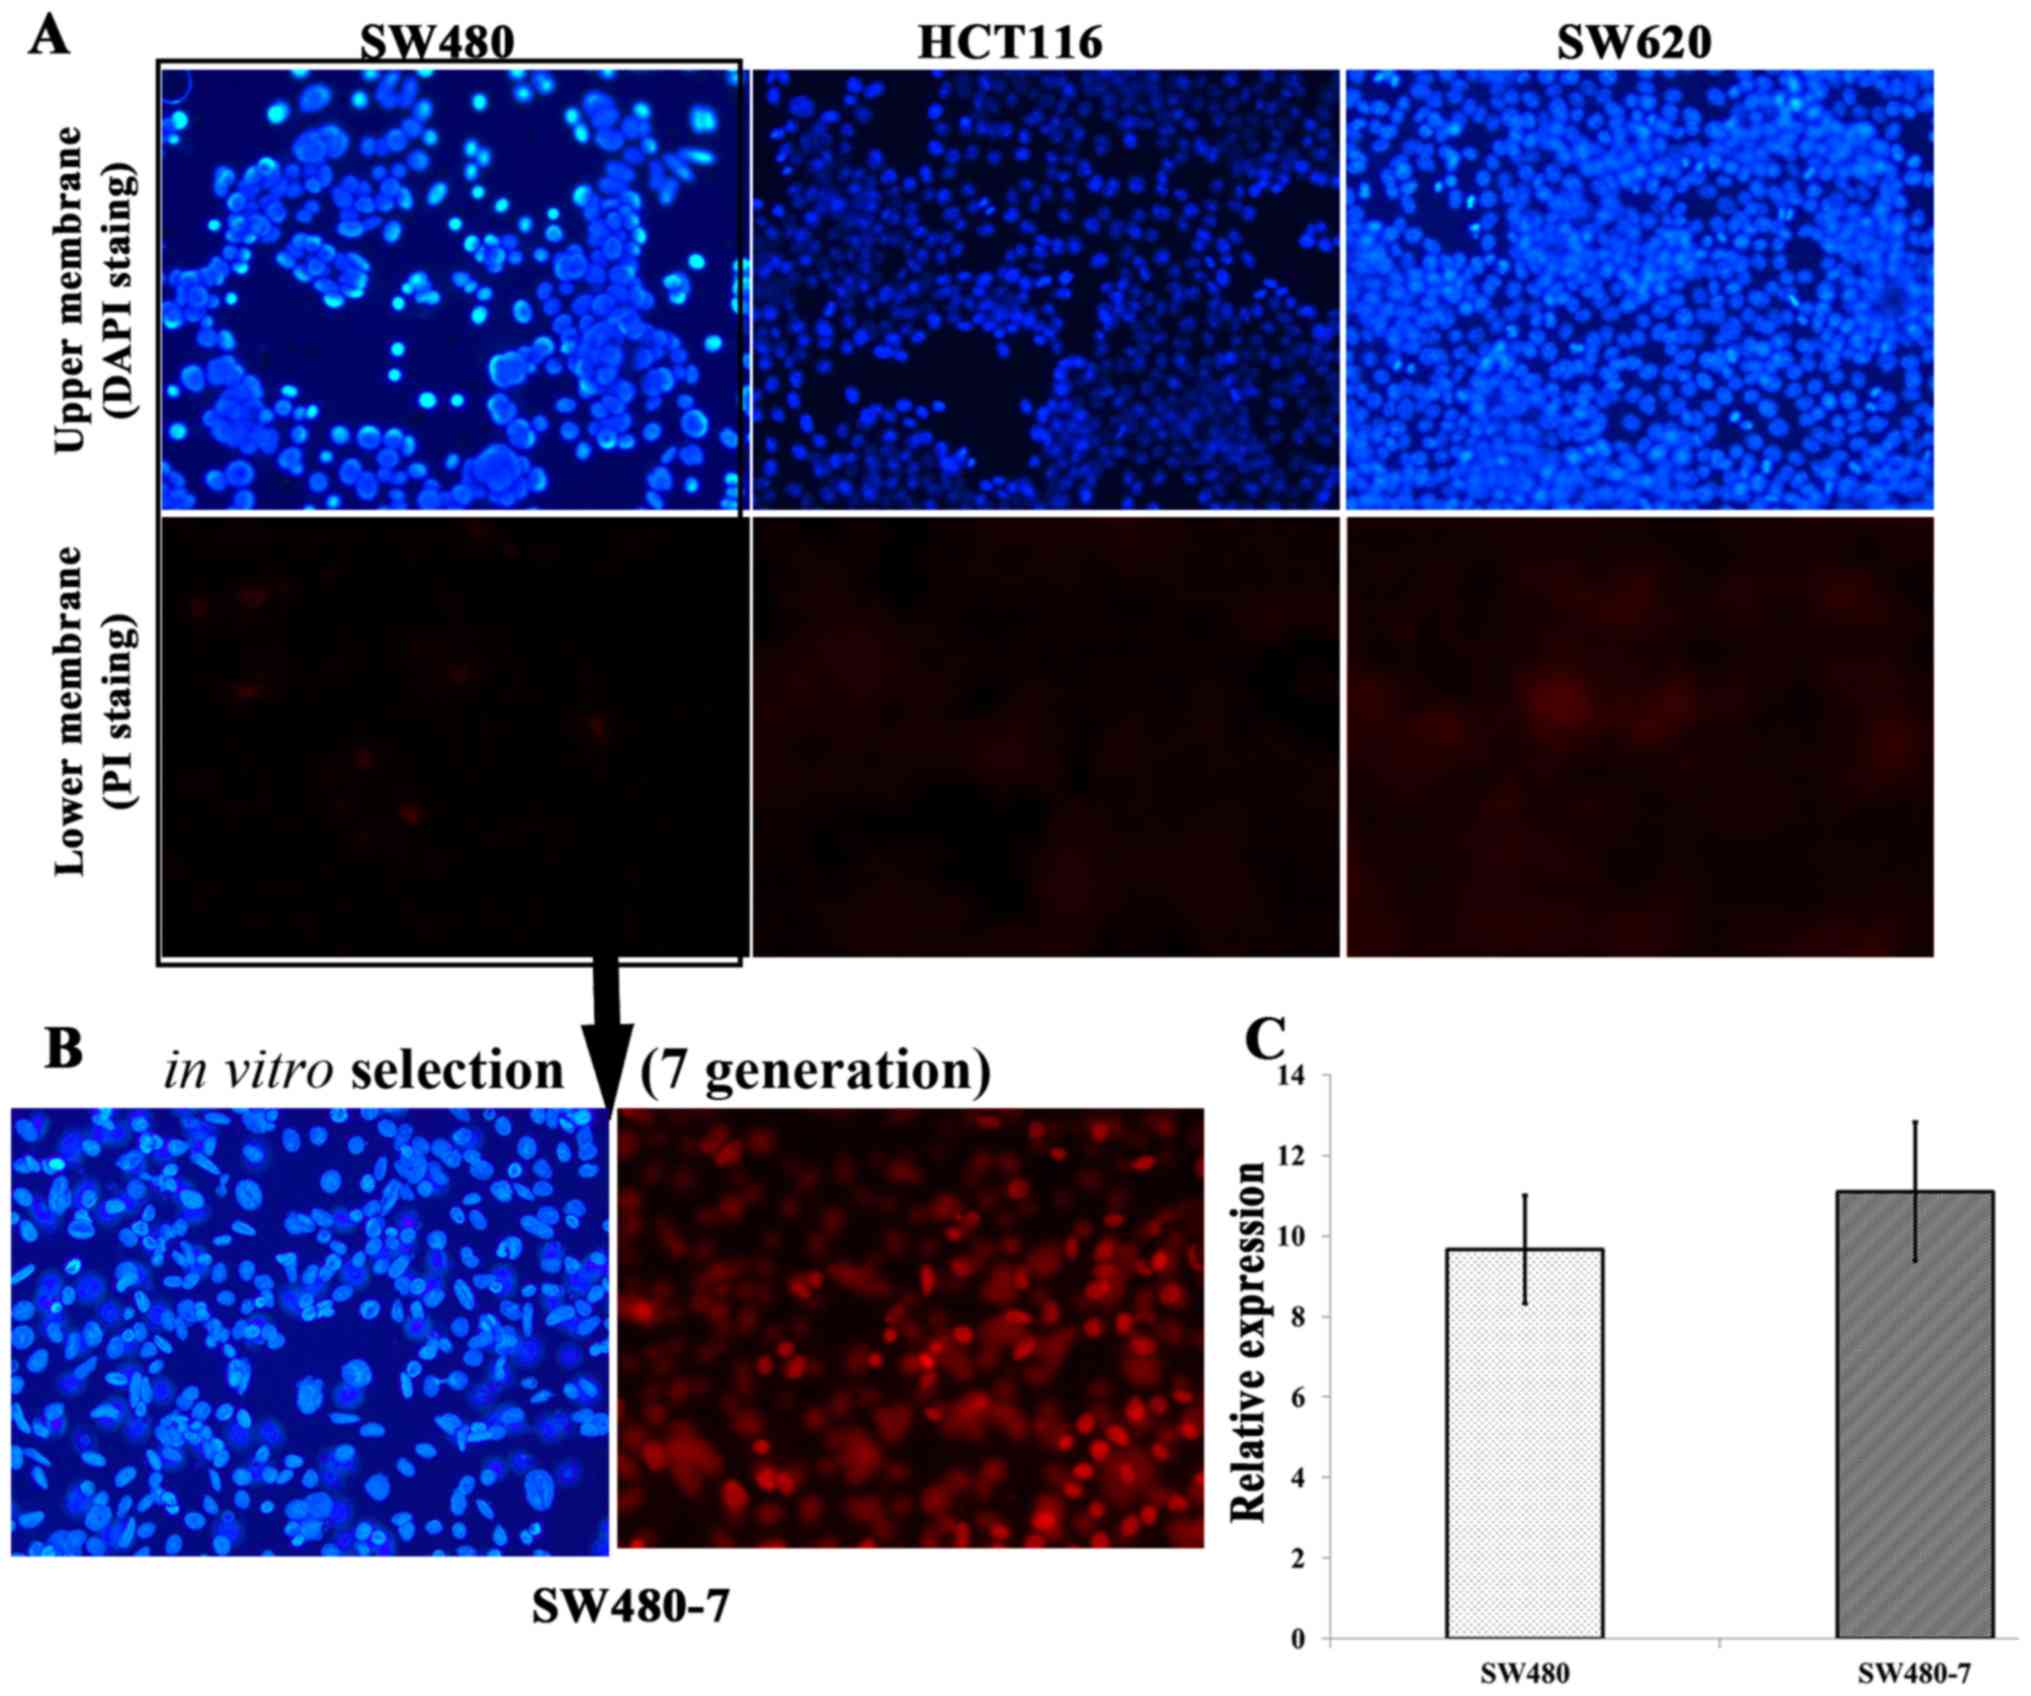
In vitro selection of invasive CRC
cells
A Matrigel invasion assay was conducted to determine
the intrinsic invasive capabilities of the three CRC cell lines
(Fig. 3). The result demonstrated
that none of the three cell lines were suitable for the Matrigel
invasion assay as there were there were no significant differences
between upper and lower membrane. For HCT116 and SW620, almost no
cells invaded through the Transwell inserts within 72 h; however,
for SW480, a limited number of cells invaded through the inserts
(Fig. 3A). The Matrigel invasion
assay system was used to select the invasive subpopulation from the
original SW480 cell line. Original SW480 cells were subjected to
serial passages through Matrigel-coated inserts and the invaded
cells were transferred to a new insert (Fig. 3A). An invasive subpopulation called
SW480-7 was derived in vitro by subjecting SW480 parental
cells to seven sequential passages through the Matrigel-coated 8.0
µm pore polycarbonate membrane (Fig.
3B). The average ratio of the invaded to non-invaded cell
numbers was calculated from 12 fields for each membrane.
Expression of miR-96-5p in SW480-7
cells
To determine whether the expression of miR-96-5p was
different in SW480-7 cells, compared with the parental SW480 cell
line, qPCR was conducted (Fig. 3C).
The results demonstrated no significant difference in the
expression of miR-96-5p between SW480 and SW480-7 cells (9.66±1h.34
vs. 11.10±1.73; P=0.3299). Statistical analysis was conducted with
the unpaired Student's t-test.
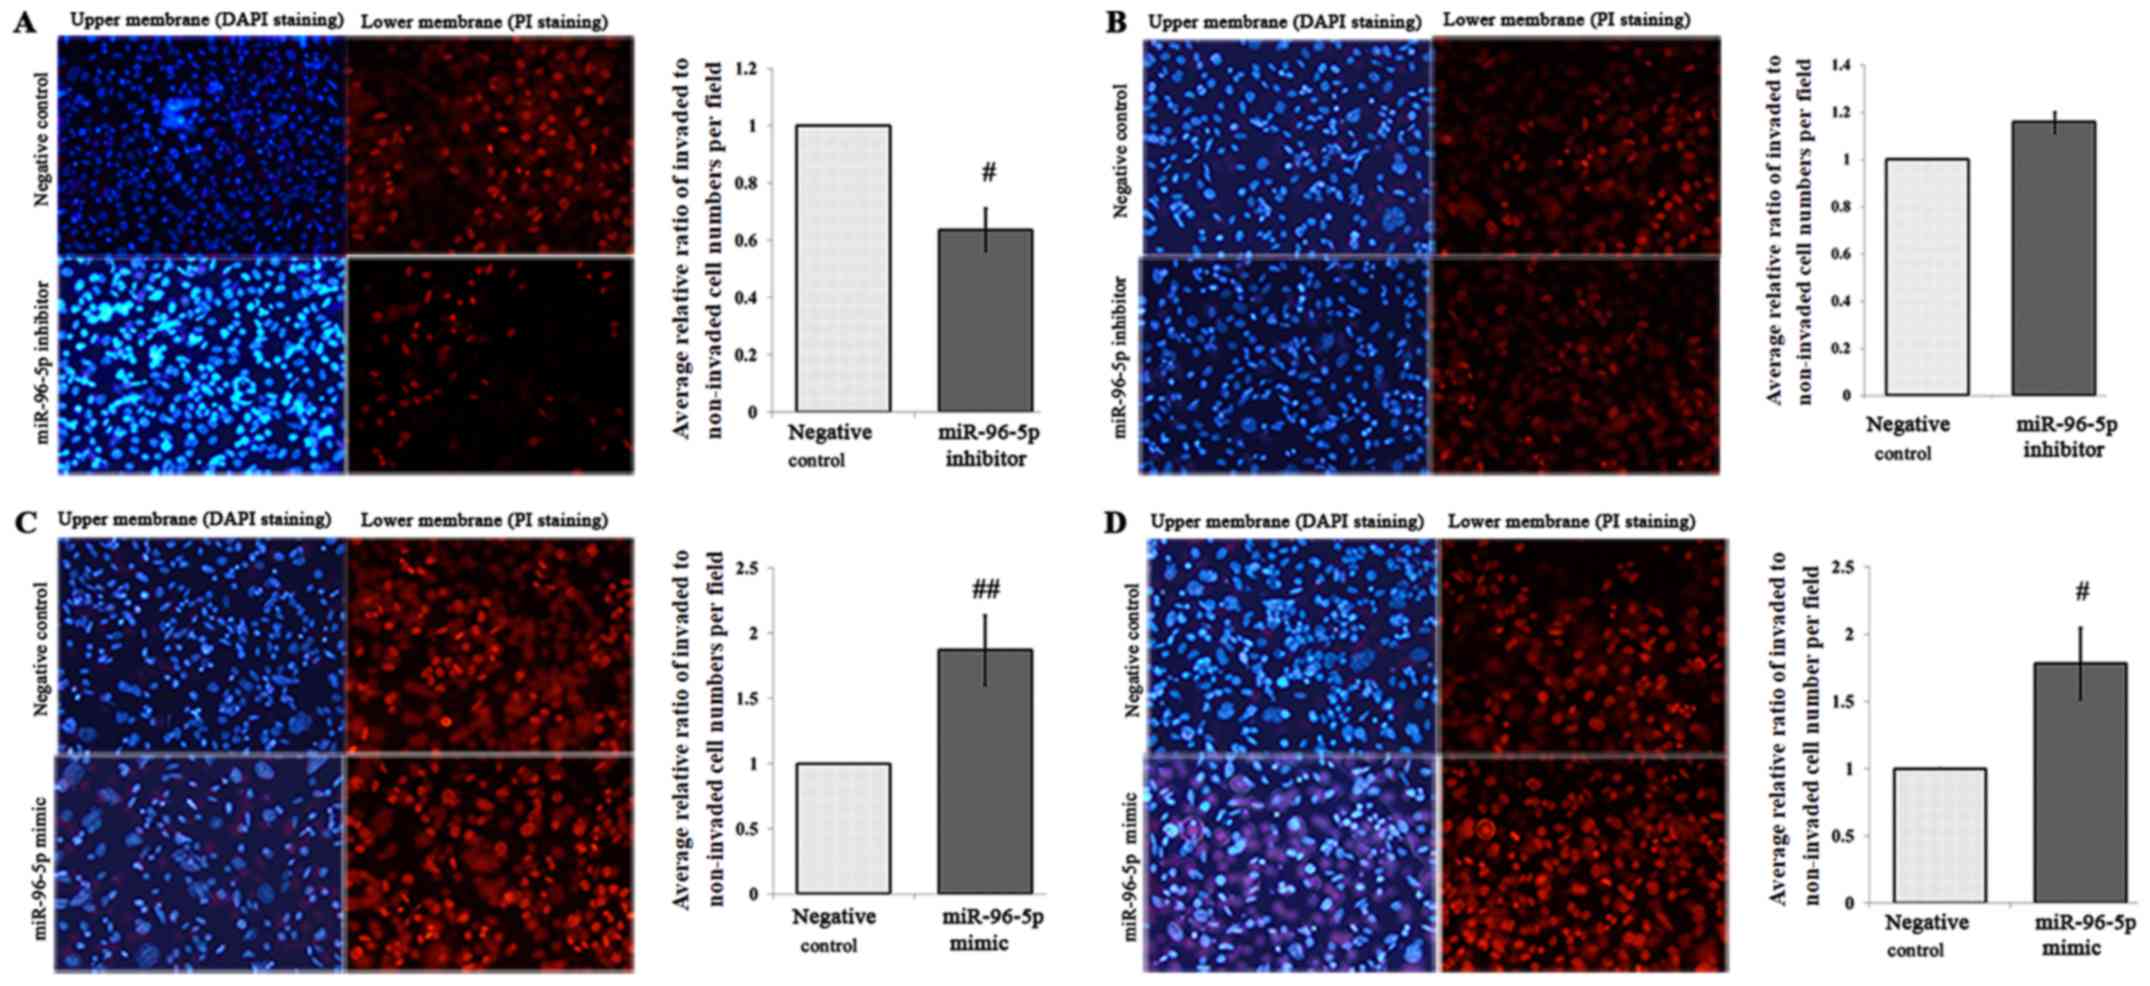
Effects of the miR-96-5p inhibitor and
mimic on the migration and invasion of SW480-7 cells
Cell migration assays were conducted following the
transfection of SW480-7 cells with the miR-96-5p inhibitor or
miR-inhibitor negative control for 48 h. Significant inhibition of
migration of SW480-7 cells was determined in miR-96-5p
inhibitor-transfected cells, as expected (P=0.0329, Fig. 4A); however, Matrigel cell invasion
assays demonstrated that miR-96-5p inhibition had no effect on cell
invasion (P>0.05, Fig. 4B). In
parallel, miR-96-5p mimic or miR-mimic negative control was also
transfected into SW480-7 cells for 48 h followed by Transwell
migration and Matrigel invasion assays. Transfection with the
miR-96-5p mimic in SW480-7 cells significantly promoted the cell
migration (P=0.03) and invasion (P=0.0369) (Fig. 4C and D).
Cytoskeleton Regulator RT2
Profiler PCR array
miR-96-5p-inhibitor-transfected SW480-7 cells
induced a higher expression of numerous genes, which are known to
be associated with the regulation of cytoskeleton dynamics,
compared with the SW480-7 cells transfected with miRNA inhibitor
control. The expression of six genes, including myosin light chain
kinase 2 (MYLK2), pleckstrin homology like domain family B member 2
(PHLDB2), cyclin A1 (CCNA1), IQ motif containing GTPase activating
protein 2 (IQGAP2), Brain-specific angiogenesisinhibitor
1-associated protein 2 (BAIAP2) and microtubule-actin crosslinking
factor 1 (MACF1), was increased by >2.5 fold (Table ) in
inhibitor transfected cells compared with inhibitor control
transfected cells.
Validation of PCR array data at a mRNA
level through RT-qPCR
The validation results of RT2 Profiler
PCR array are summarized in Fig. 5.
The corresponding expression levels of control groups were used as
calibrators, which were set as one, and relative mRNA expression of
each gene was compared with the control group. As a result, mRNA
expression levels of MYLK2, PHLDB2, CCNA1, IQGAP2, BAIAP2 and MACF1
in SW480-7 cells transfected with the miR-96-5p inhibitor were
increased significantly, whilst the expression of IQGAP had the
largest fold change. For MYLK2, PHLDB2, CCNA1, BAIAP2 and MACF1,
the increase in mRNA expression in miR-96-5p inhibitor-transfected
cells was 5.6-, 3.2- 5.4-, 4.8- and 6.7-fold, respectively
(Fig. 5A). Furthermore, miR-96-5p
mimic-transfection reversed the effect of the miR-96-5p inhibitor,
whereby the expression of all these six mRNA was decreased
(Fig. 5B).
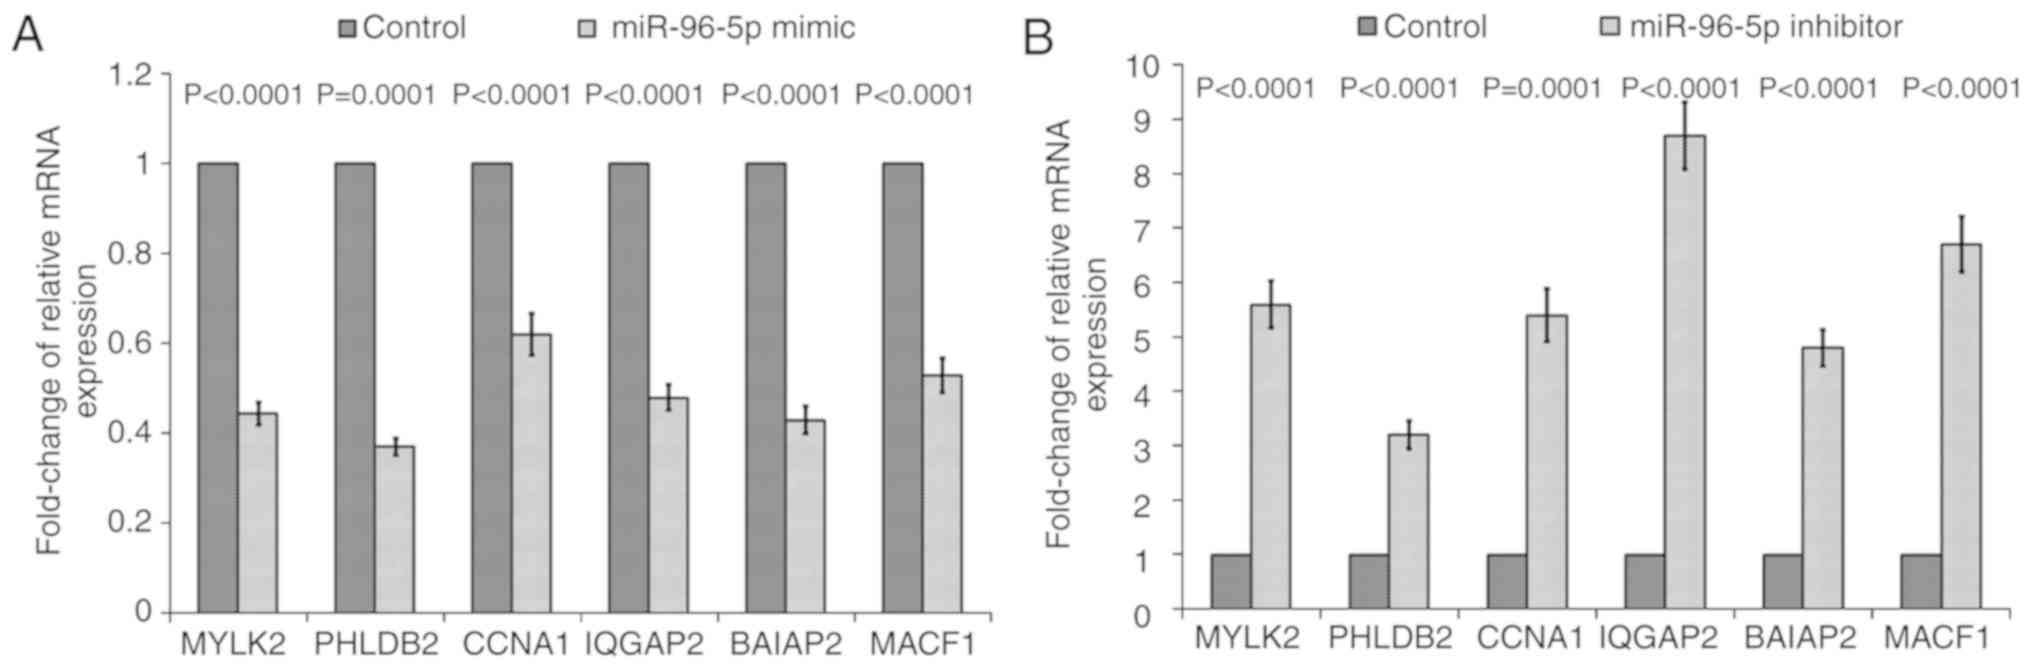 | Figure 5.The mRNA expression of selected mRNAs
(MYLK2, PHLDB2, CCNA1, IQGAP2, BAIAP2 and MACF1) in miR-96-5p
inhibitor/mimic transfected SW480-7 cells by reverse
transcription-polymerase chain reaction. The relative mRNA
expression in SW480-7 cells transfected with (A) miR-96-5p
inhibitor and (B) miR-96-5p mimic. The ratio of mRNA expression in
the inhibitor/mimic-transfected groups relative to the
corresponding negative control was calculated. Data are presented
as the mean ± standard deviation from three independent
experiments. Statistical analysis was conducted using one-sample
Student's t-test. P-values are as shown in the bar chart. MYLK2,
myosin light chain kinase 2; PHLDB2, pleckstrin homology like
domain family B member 2; CCNA1, cyclin A1; IQGAP2, IQ motif
containing GTPase activating protein 2; BAIAP2, Brain-specific
angiogenesis inhibitor 1-associated protein 2; MACF1,
microtubule-actin crosslinking factor 1; miR, microRNA. |
Discussion
Increasing evidence has established that miRNA
dysregulation is involved in multiple cellular characteristics of
CRC including proliferation, apoptosis, cell cycle, migration and
invasion (17–20). miR-96-5p is a member of the miR-183
family consisting of three members, including miR-96, miR-182 and
miR-183 (21). A number of published
miRNA profiling studies indicated that miR-96-5p is upregulated in
CRC tissues, compared with apparently normal adjacent tissues
(22–24). To further investigate the biological
function of miR-96-5p in CRC, the miR-96-5p inhibitor was
introduced into SW480-7 cells by transient transfection. Due to
miR-96-5p inhibitor exerting its function through inhibiting the
endogenous miR-96-5p, the expression level of miR-96-5p in the five
CRC cell lines, including HCT116, HT29, Caco2, SW480 and SW620, was
detected prior to transfection. To the best of our knowledge, the
present study indicated for the first time that miR-96-5p was
detectable in all five of these CRC cell lines.
The development of metastasis is a major cause of
mortality in patients with CRC, and migration and invasion are two
cellular characteristics associated with metastasis in
vitro. In the present study, the Transwell assay system was
used to evaluate the effect of miR-96-5p on the cell invasion and
migration of CRC cells in vitro. The Transwell migration and
Matrigel invasion assays have been frequently used to determine the
cell motility of cancer cells in vitro. The original
technique for assessing the migratory capacity of polymorphonuclear
leucocytes was introduced by Boyden in 1962 (25). Currently, the modified migration
assay is performed with commercially available plastic inserts
compatible with multi-well plates. The bottom of the plastic insert
contains a microporous membrane allowing migratory cells to migrate
to the other side of the membrane. Due to Transwell Permeable
Supports typifying the most commonly used plastic inserts, this
plastic insert-based migration assay type is frequently termed a
Transwell migration assay. To determine cell invasion, a gel, which
is referred to as Matrigel, containing similar components with a
basement membrane, is formed on the microporous membrane (26). The only difference between the
migration and invasion assays is the presence of Matrigel, which is
intended to mimic the barrier that cancer cells encounter in the
process of invasion.
In migration and invasion assays, the cell numbers
used in the control group and treatment groups are identical at the
beginning of the experiment. If miR-96-5p regulates the cell growth
of CRC cells, the cell numbers in the control group and treatment
groups will be significantly different and the invasion data
between treatment groups will be not statistically different. An
MTT assay was performed to assess the influence of miR-96-5p on the
cell viability of the HCT116, SW480 and SW620 cell lines, which
indicated that miR-96-5p had no effect on the viability of the
three cell lines.
Invasion and migration assays were conducted using
Transwell inserts as described previously (27) with a number of modifications. The
original SW480 cell line has been used for invasion assays in
previous studies (28,29) to assess the invasiveness of SW480
cells by counting the cell number of invasive cells at the bottom
of the insert. Previously, an improved method was used to quantify
the invasiveness of cancer cells by calculating the ratio of
invasive cells to non-invasive cells (30). As depicted in Fig. 3A, only a limited number of cells
invaded through the Matrigel-coated Transwell inserts. Due to
miR-96-5p overexpression in CRC, miR-96-5p inhibition was expected
to suppress the cell invasion of SW480 cells; therefore, more
invasive CRC cell lines are required to evaluate the effect of the
miR-96-5p inhibitor on cell invasion. A common method to gain an
invasive subpopulation from an established cancer cell line is to
isolate invasive cells with Transwell inserts in vitro
(31,32). An invasive subpopulation, SW480-7,
was derived in vitro by subjecting SW480 parental cells to 7
sequential passages through Matrigel-coated Transwell inserts
(Fig. 3B).
miR-96-5p inhibitor targeting endogenous miR-96-5p
was utilized to perform a loss-of-function study. RT-qPCR results
demonstrated that the level of miR-96-5p in SW480-7 cells was not
altered, compared with the original SW480 cell line (Fig. 4). In accordance with the previous
study, miRNA-96-5p acted as an oncogene in CRC cells in
vitro (33). The results of the
Transwell migration assay demonstrated that the miR-96-5p inhibitor
suppressed cell migration in SW480-7 cells; however, in the
invasion assay, the miR-96-5p inhibitor did not block SW480-7 cell
invasion through the Matrigel-coated Transwell inserts. This may be
due to a number of components of Matrigel, which may have
counteracted the ability of the miR-96-5p inhibitor to block cell
invasion.
In order to further investigate the molecular
changes in miR-96-5p inhibitor-transfected SW480-7 cells,
comparative gene expression analysis was performed using the
Cytoskeleton Regulator RT2 Profiler PCR array. A number
of genes were upregulated in SW480-7 cells transfected with the
miR-96-5p inhibitor. For example, a 5.6 fold increase in the
expression of MYLK2 was observed following miR-96-5p inhibitor
transfection. Stress fibers, which are made up of prominent bundles
of actin filaments and myosin II filaments, serve an essential role
in cell migration. The myosin regulatory light chain (MLC), a
component of myosin II, is the target component regulated by MYLK
and myosin light chain phosphatase. Only the active monomer of
myosin II with phosphorylated MLC are able to associate with other
myosin II molecules assembling into myosin II filaments (34). In the present study, cell migration
was suppressed by miR-96-5p inhibition, and MYLK2 was expected to
be downregulated; however, MYLK2 was upregulated in miR-96-5p
inhibitor-treated SW480 cells, indicating that the Cytoskeleton
Regulatory pathway serves a role in miR-96-5p inhibitor-induced
suppression of cell migration as negative regulators. Besides
PHLDB2, the genes MYLK2 and IQGAP2 have also been reported as
negative regulators of cell migration and/or invasion. Knockdown of
MYLK by siRNAs in breast epithelial cells has been demonstrated to
result in increased cell migration and invasion, disruption of
cell-cell adhesions and enhanced formation of focal adhesions at
the leading edge of migratory cells (35). Cell migration/invasion was also
increased following IQGAP2 knockdown and impaired following
overexpression of IQGAP2 in CRC and prostate cancer cells (36,37).
Although the CCNA1 gene has not been reported as a negative
regulator of cell migration, its family member CCNA2 gene has been
indicated to negatively control cell motility by promoting Ras
homology family member A activation (38). To the best of our knowledge, BAIAP2
and MACF1 genes are required for the migration function (39); however, their negative role in
migration in different cell types may be possible, similar to other
cytoskeletal regulatory genes, including MYLK2, IQGAP2 and CCNA1.
Thus, the increased expression of these cytoskeleton regulator
genes, which are negative regulators of cell migration and/or
invasion, is consistent with our data on the inhibition of
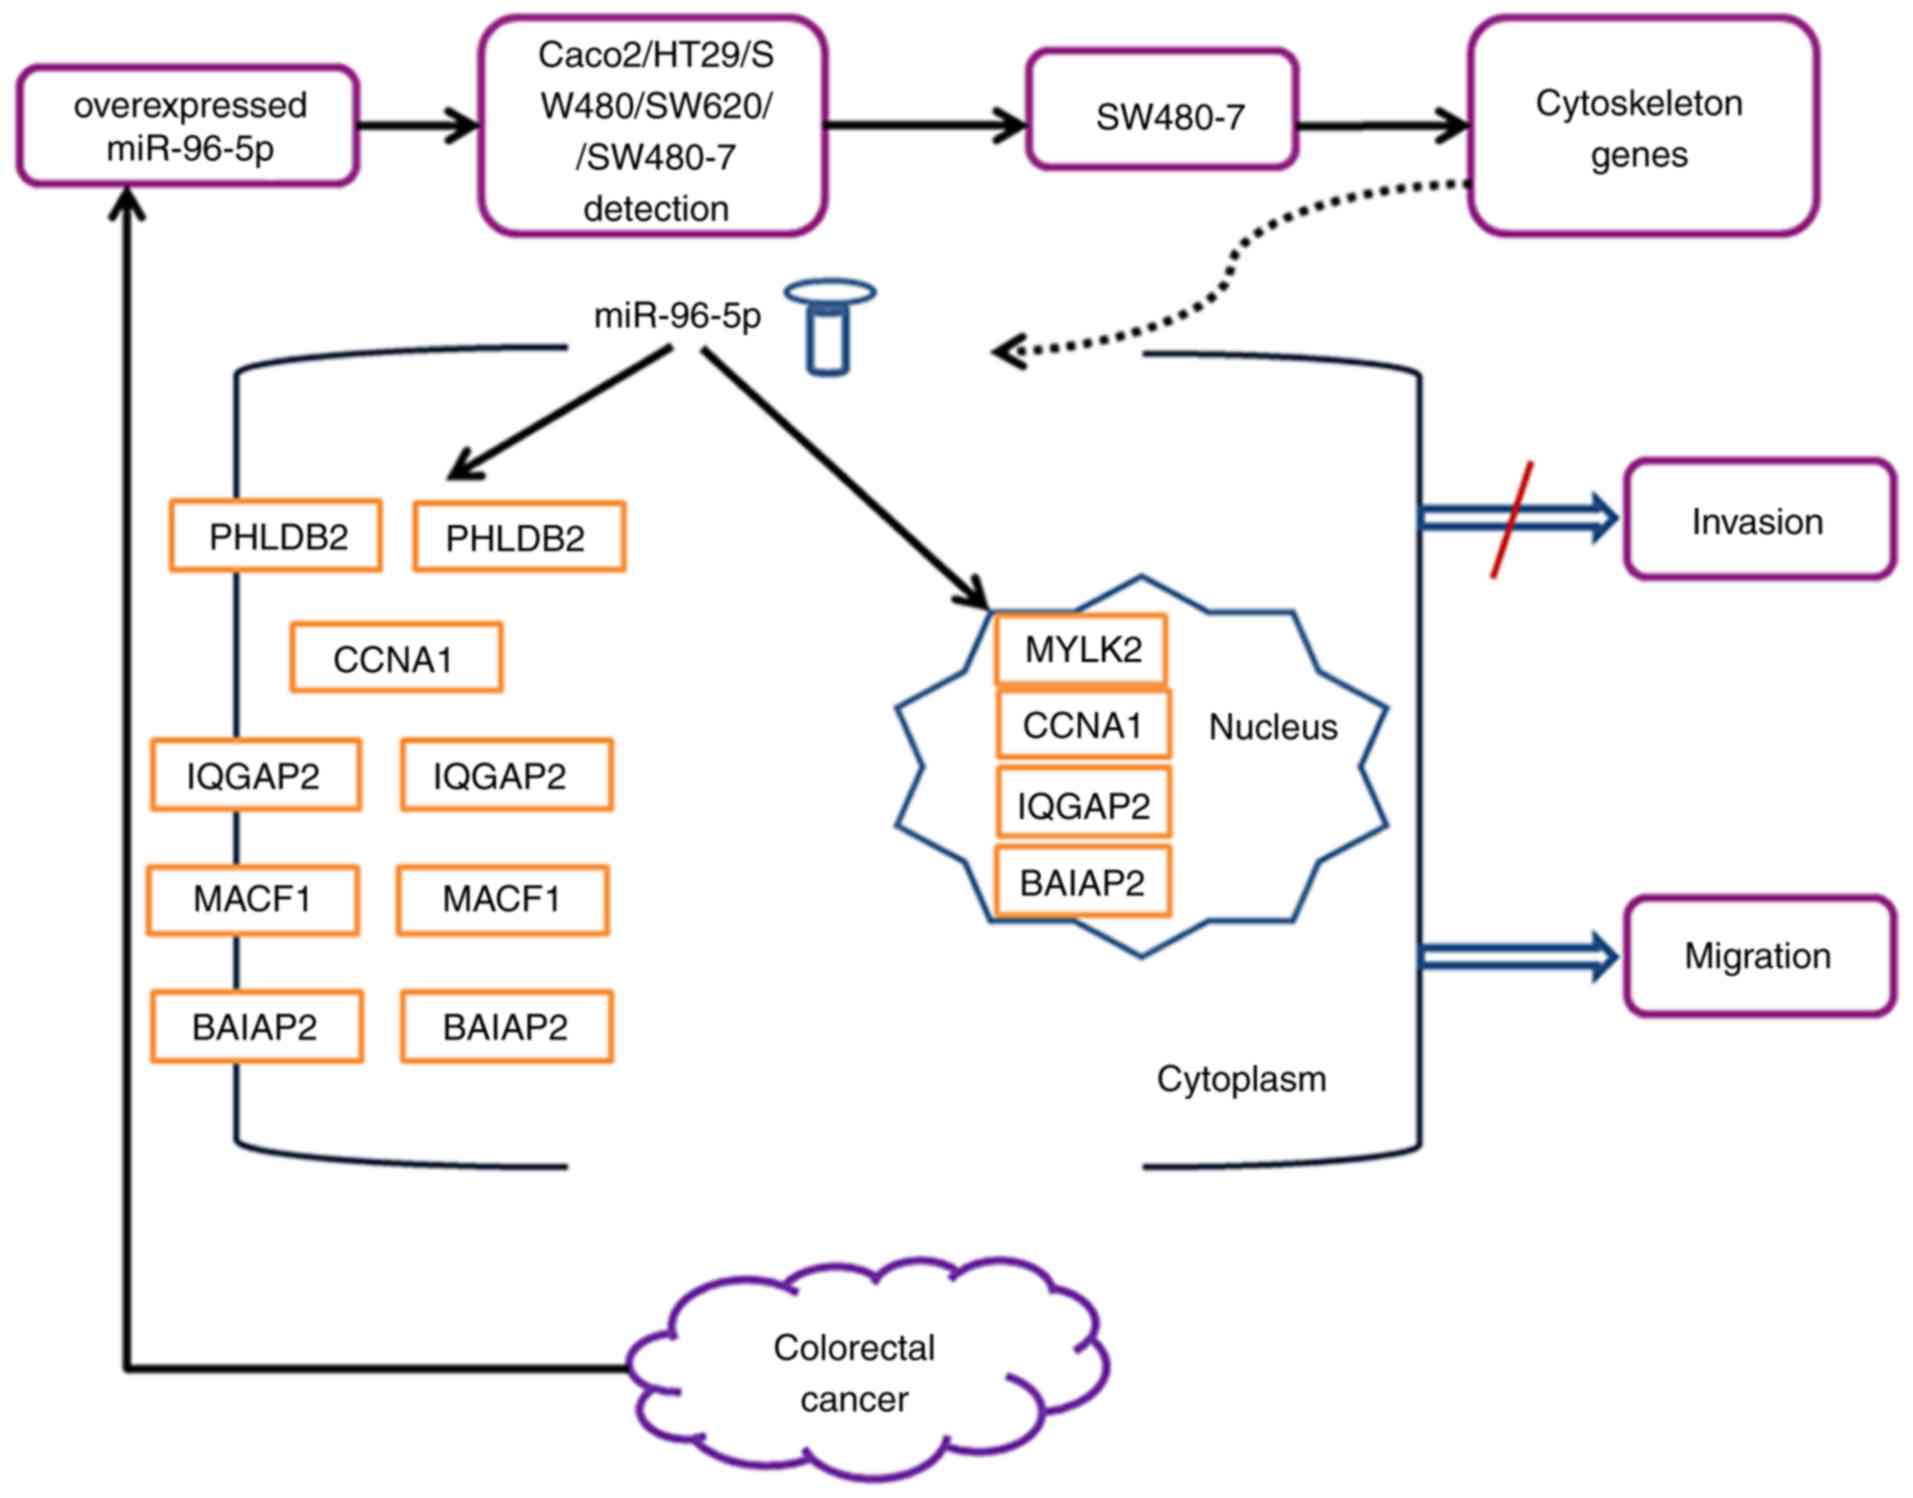
migration by the miR-96-5p inhibitor. Fig. 6 summarizes the findings of the
present study.
It is possible that target prediction will
demonstrate that miR-96-5p can interact with other genes besides
MYLK2, PHLDB2, CCNA1, IQGAP2, BAIAP2 and MACF1, which were used in
the 96-well Cytoskeleton Regulators RT2 Profiler PCR
array. Other miRNAs that can interact with MYLK2, PHLDB2, CCNA1,
IQGAP2, BAIAP2 and MACF1 can also be determined by target
prediction. The identity of these other genes and miRNAs are worthy
of further investigation in the future.
Another limitation of the present study was the
inability to associate the expression of these mRNAs with protein
expression. Future studies to verify this using western blotting,
or cytochemical or immunofluorescence staining are required. Due to
only the SW480-7 cell line being used, similar studies are required
using other cell lines.
The extracellular matrix (ECM) is a major component
of tumor microenvironment (40).
Matrigel is used as a substitute ECM in invasion assays, and was
only considered as a barrier against cancer cell invasion; however,
increasing numbers of studies have demonstrated that cancer cells
are not only affected by the architecture of Matrigel mechanically,
but also influenced by certain components biochemically (38). The Matrigel comprises of laminin,
collagen IV, entactin/nidogen, heparan sulfate proteoglycans and a
number of growth factors (41,42).
Previous studies have demonstrated that Matrigel promotes cell
invasion and gene expression changes by activating integrins and
other transmembrane receptors (43).
The RMCCA1 cells, a cholangiocarcinoma cell line, cultured with a
coating of Matrigel are more invasive than cells maintained in
Matrigel-free plates. The protein expression profile indicated that
the expression of the actin-binding protein L-plastin is
upregulated by Matrigel, and the subsequent loss-of-function study,
using siRNA, demonstrated that the knockdown of L-plastin reduces
cell invasion induced by Matrigel (44). Vimentin, an intermediate filament
protein type, is associated with a high degree of invasiveness
(45,46). It is considered that Matrigel can
promote cell invasion of head and neck squamous cell carcinoma
cells through increasing vimentin expression in vitro
(47).
Furthermore, more recent observations have indicated
that Matrigel has an influence on cell invasion by altering the
expression of miRNAs in cancer cells. miRNA profiling of two CRC
cell lines, SW480 and SW620, was performed via a microarray assay
to investigate the effect of Matrigel on miRNA expression (46). When comparing the miRNA expression
signatures between the cells cultured on plastic and Matrigel,
numerous differentially expressed miRNAs were identified.
Furthermore, a number of miRNAs with altered expression were
observed in SW480 and SW620 cells, indicating that Matrigel may
induce a particular miRNA panel across various cancer cell lines.
To test this hypothesis, four notably affected miRNAs in both cell
lines, including miR-32, miR-29b, miR-1290 and miR-210, were
detected in five epithelial cancer cell lines, including SW480,
SW620, A549, HT29 and MDA-MB-231. Three out of the four miRNAs
detected, miRNA-32, miRNA-29b and miRNA-1290, exhibited consistent
alterations across all five of the cancer cell lines. Functional
studies indicated that Matrigel-mediated miRNA-210 overexpression
may promote the invasion of SW480 cells by decreasing the
expression of vacuole membrane protein 1 (48). All of the studies aforementioned
provide evidence to demonstrate that Matrigel can stimulate cell
invasion by altering the expression of relevant genes.
In the present study, the invasiveness of SW480-7
cells subjected to a Matrigel invasion assay was affected by two
factors: miR-96-5p inhibitor and Matrigel, whilst the migratory
capacity assessed via a Transwell migration assay was influenced by
the miR-96-5p inhibitor only. The present study indicated that the
miR-96-5p inhibitor suppressed the cell migration of SW480-7 cells,
but had no influence on the cell invasion. The difference in
results may be attributable to the usage of Matrigel in invasion
assay, due to it being the only difference between the invasion and
migration assays. The most possible explanation is that the
pathways implicated in the cell invasion of SW480-7 cells are
regulated by biochemical components of Matrigel and miR-96-5p. It
is possible that the effect of the miR-96-5p inhibitor blockade on
cell invasion was opposed by the stimulation of cell invasion by
the effects of Matrigel, as aforementioned. As a result, miR-96-5p
inhibition had no effect on cell invasion. The effects of Matrigel
on miR-96-5p-transfected cells require further investigation. The
mechanisms underlying the promotion of cell migration and invasion
by the miR-96-5p mimic in SW480-7 cells also require further
investigation. Due to the SW480-7 cell line being used, the present
study requires investigation with other cell lines in the
future.
As summarized in Table
V, numerous studies have demonstrated that miR-96-5p is
overexpressed in cancer tissues, compared with matched normal
adjacent tissues, indicating an oncogenic role for miR-96-5p. This
is consistent with our in vitro observations, whereby
increased cell migration and invasion was determined in miR-96-5p
mimic-transfected SW480-7 cells and the miR-96-5p inhibitor blocked
cell migration; however, Ress et al (49) demonstrated that there was a decrease
in growth of HCT116 cells, thus supporting the role of miR-96-5p as
a tumor suppressor. This may be due to the fact that miRNAs can act
as oncogenes or tumor suppressors depending on the cellular
context, as indicated by Arndt et al (50), whereby miR-145 acted as an oncogene
in HCT8 and SW620 cells, but indicated a tumor suppressive role in
SW480 cells (50).
| Table V.Differentially expressed genes
mediated by miRNA-96-5p inhibitor. |
Table V.
Differentially expressed genes
mediated by miRNA-96-5p inhibitor.
| Gene | Fold
regulation |
|---|
| MYLK2 | 4.8906 |
| PHLDB2 | 3.2944 |
| CCNA1 | 5.8679 |
| IQGAP2 | 8.7321 |
| BAIAP2 | 4.7132 |
| MACF1 | 6.5491 |
To conclude, it was observed that migration of
SW480-7 cells was blocked by the miR-96-5p inhibitor; however,
invasion was not blocked, indicating that Matrigel not only
functions as a molecular scaffold but can also influence cancer
cell invasion by involving other biochemical components, such as
integrins and other transmembrane receptors, and activating
signaling pathways. The blockade of cell invasion by miR-96-5p
inhibitor may be counteracted by the stimulatory effects of
Matrigel on cell invasion; thus, the underlying mechanisms
involving Matrigel components in miR-96-5p inhibitor-transfected
SW480-7 is worthy of further investigations in the future.
Acknowledgements
The authors would like to express their appreciation
to Mr. Samuel Leon Juan Khoo for helpful discussion on experimental
techniques.
Funding
Funding support was received from Hebei Provincial
of Human Resources and Social Security (CY201701), Chengde Medical
Key Project (201813) the University Putra Malaysia (grant no.
GP-IPS/2014/943395) and the Malaysian Ministry of Science,
Technology and Innovation (grant no. 02-01-04-SF1312).
Availability of data and materials
The datasets used and/or analyzed during the current
study are available from the corresponding author on reasonable
request.
Authors' contributions
PYH, WKY, and HFS designed the study. PYH performed
the experiments. MFJ, NM, and NMD contributed to the data analysis.
PYH wrote the manuscript. All authors read and approved the final
manuscript.
Ethics approval and consent to
participate
Ethics approval was obtained from the National
Medical Ethics Board (approval no. NMRR-12-435-11565), and study
participants provided written informed consent.
Patient consent for publication
Not applicable.
Competing interests
The authors declare that they have no competing
interests.
Glossary
Abbreviations
Abbreviations:
|
CRC
|
colorectal cancer
|
|
PET
|
polyethylene terephthalate
|
|
DMSO
|
dimethyl sulfoxide
|
|
PI
|
propidium iodide
|
|
MYLK2
|
myosin light chain kinase 2
|
|
MLC
|
myosin regulatory light chain
|
|
MYLK
|
myosin light chain kinase
|
|
MLCP
|
myosin light chain phosphatase
|
|
ECM
|
extracellular matrix
|
|
VMP1
|
vacuole membrane protein 1
|
References
|
1
|
Arnold M, Sierra MS, Laversanne M,
Soerjomataram I, Jemal A and Bray F: Global patterns and trends in
colorectal cancer incidence and mortality. Gut. 66:683–691. 2017.
View Article : Google Scholar : PubMed/NCBI
|
|
2
|
Brody H: Colorectal cancer. Nature.
521:S12015. View
Article : Google Scholar : PubMed/NCBI
|
|
3
|
Bockhorn J, Yee K, Chang YF, Prat A, Huo
D, Nwachukwu C, Dalton R, Huang S, Swanson KE, Perou CM, et al:
MicroRNA-30c targets cytoskeleton genes involved in breast cancer
cell invasion. Breast Cancer Res Treat. 137:373–382. 2013.
View Article : Google Scholar : PubMed/NCBI
|
|
4
|
Valeri N, Braconi C, Gasparini P, Murgia
C, Lampis A, Paulus-Hock V, Hart JR, Ueno L, Grivennikov SI, Lovat
F, et al: MicroRNA-135b promotes cancer progression by acting as a
downstream effector of oncogenic pathways in colon cancer. Cancer
Cell. 25:469–483. 2014. View Article : Google Scholar : PubMed/NCBI
|
|
5
|
Friedman RC, Farh KK, Burge CB and Bartel
DP: Most mammalian mRNAs are conserved targets of microRNAs. Genome
Res. 19:92–105. 2009. View Article : Google Scholar : PubMed/NCBI
|
|
6
|
Xiao R, Li C and Chai B: miRNA-144
suppresses proliferation and migration of colorectal cancer cells
through GSPT1. Biomed Pharmacother. 74:138–144. 2015. View Article : Google Scholar : PubMed/NCBI
|
|
7
|
Ye J, Wu X, Wu D, Wu P, Ni C, Zhang Z,
Chen Z, Qiu F, Xu J and Huang J: miRNA-27b targets vascular
endothelial growth factor C to inhibit tumor progression and
angiogenesis in colorectal cancer. PLoS One. 8:e606872013.
View Article : Google Scholar : PubMed/NCBI
|
|
8
|
Mo JS, Alam KJ, Kang IH, Park WC, Seo GS,
Choi SC, Kim HS, Moon HB, Yun KJ and Chae SC: MicroRNA 196B
regulates FAS-mediated apoptosis in colorectal cancer cells.
Oncotarget. 6:2843–2855. 2015. View Article : Google Scholar : PubMed/NCBI
|
|
9
|
Sun P, Sun D, Wang X, Liu T, Ma Z and Duan
L: miR-206 is an independent prognostic factor and inhibits tumor
invasion and migration in colorectal cancer. Cancer Biomark.
15:391–396. 2015. View Article : Google Scholar : PubMed/NCBI
|
|
10
|
Cristóbal I, Madoz-Gúrpide J, Manso R,
Rojo F and García-Foncillas J: miR-29c downregulation contributes
to metastatic progression in colorectal cancer. Ann Oncol.
26:2199–2200. 2015. View Article : Google Scholar
|
|
11
|
Li C, Du X, Tai S, Zhong X, Wang Z, Hu Z,
Zhang L, Kang P, Ji D, Jiang X, et al: GPC1 regulated by miR-96-5p,
rather than miR-182-5p, in inhibition of pancreatic carcinoma cell
proliferation. Int J Mol Sci. 15:6314–6327. 2014. View Article : Google Scholar : PubMed/NCBI
|
|
12
|
Larne O, Martens-Uzunova E, Hagman Z,
Edsjö A, Lippolis G, den Berg MS, Bjartell A, Jenster G and Ceder
Y: miQ-a novel microRNA based diagnostic and prognostic tool for
prostate cancer. Int J Cancer. 132:2867–2875. 2013. View Article : Google Scholar : PubMed/NCBI
|
|
13
|
Assal RA, EI Tayebi HM, Hosny KA, Esmat G
and Abdelaziz AI: A pleiotropic effect of the single clustered
hepatic metastamiRs miR-96-5p and miR-182-5p on insulin-like growth
factor II, insulin-like growth factor-1 receptor and insulin-like
growth factor-binding protein-3 in hepatocellular carcinoma. Mol
Med Rep. 12:645–650. 2015. View Article : Google Scholar : PubMed/NCBI
|
|
14
|
Oliveros JC: 2015, Venny. An interactive
tool for comparing lists with Venn's diagrams. http://bioinfogp.cnb.csic.es/tools/venny/index.htmlJune
12–2013
|
|
15
|
Cikos S, Bukovská A and Koppel J: Relative
quantification of mRNA: Comparison of methods currently used for
real-time PCR data analysis. BMC Mol Biol. 8:1132007. View Article : Google Scholar : PubMed/NCBI
|
|
16
|
Livak KJ and Schmittgen TD: Analysis of
relative gene expression data using real-time quantitative PCR and
the 2(-Delta Delta C(T)) method. Methods. 25:402–408. 2001.
View Article : Google Scholar : PubMed/NCBI
|
|
17
|
Qiu Z, Guo W, Wang Q, Chen Z, Huang S,
Zhao F, Yao M, Zhao Y and He X: MicroRNA-124 reduces the pentose
phosphate pathway and proliferation by targeting PRPS1 and RPIA
mRNAs in human colorectal cancer cells. Gastroenterology.
149:1587–1598.e11. 2015. View Article : Google Scholar : PubMed/NCBI
|
|
18
|
Fujiya M, Konishi H, Mohamed Kamel MK,
Ueno N, Inaba Y, Moriichi K, Tanabe H, Ikuta K, Ohtake T and Kohgo
Y: microRNA-18a induces apoptosis in colon cancer cells via the
autophagolysosomal degradation of oncogenic heterogeneous nuclear
ribonucleoprotein A1. Oncogene. 33:4847–4856. 2014. View Article : Google Scholar : PubMed/NCBI
|
|
19
|
Christensen LL, Tobiasen H, Holm A,
Schepeler T, Ostenfeld MS, Thorsen K, Rasmussen MH,
Birkenkamp-Demtroeder K, Sieber OM, Gibbs P, et al: miRNA-362-3p
induces cell cycle arrest through targeting of E2F1, USF2 and PTPN1
and is associated with recurrence of colorectal cancer. Int J
Cancer. 133:67–78. 2013. View Article : Google Scholar : PubMed/NCBI
|
|
20
|
Guo H, Chen Y, Hu X, Qian G, Ge S and
Zhang J: The regulation of Toll-like receptor 2 by miR-143
suppresses the invasion and migration of a subset of human
colorectal carcinoma cells. Mol Cancer. 12:772013. View Article : Google Scholar : PubMed/NCBI
|
|
21
|
Pierce ML, Weston MD, Fritzsch B, Gabel
HW, Ruvkun G and Soukup GA: MicroRNA-183 family conservation and
ciliated neurosensory organ expression. Evol Dev. 10:106–113. 2008.
View Article : Google Scholar : PubMed/NCBI
|
|
22
|
Brunet Vega A, Pericay C, Moya I, Ferrer
A, Dotor E, Pisa A, Casalots À, Serra-Aracil X, Oliva JC, Ruiz A
and Saigí E: microRNA expression profile in stage III colorectal
cancer: Circulating miR-18a and miR-29a as promising biomarkers.
Oncol Rep. 30:320–326. 2013. View Article : Google Scholar : PubMed/NCBI
|
|
23
|
Hamfjord J, Stangeland AM, Hughes T,
Skrede ML, Tveit KM, Ikdahl T and Kure EH: Differential expression
of miRNAs in colorectal cancer: Comparison of paired tumor tissue
and adjacent normal mucosa using high-throughput sequencing. PLoS
One. 7:e341502012. View Article : Google Scholar : PubMed/NCBI
|
|
24
|
Callari M, Dugo M, Musella V, Marchesi E,
Chiorino G, Grand MM, Pierotti MA, Daidone MG, Canevari S and De
Cecco L: Comparison of microarray platforms for measuring
differential microRNA expression in paired normal/cancer colon
tissues. PLoS One. 7:e451052012. View Article : Google Scholar : PubMed/NCBI
|
|
25
|
Boyden S: The chemotactic effect of
mixtures of antibody and antigen on polymorphonuclear leucocytes. J
Exp Med. 115:453–466. 1962. View Article : Google Scholar : PubMed/NCBI
|
|
26
|
Marshall J: Transwell(®)
invasion assays. Methods Mol Biol. 769:97–110. 2011. View Article : Google Scholar : PubMed/NCBI
|
|
27
|
Borley AC, Hiscox S, Gee J, Smith C, Shaw
V, Barrett-Lee P and Nicholson RI: Anti-oestrogens but not
oestrogen deprivation promote cellular invasion in intercellular
adhesion-deficient breast cancer cells. Breast Cancer Res.
10:R1032008. View Article : Google Scholar : PubMed/NCBI
|
|
28
|
Rogers MA, Kalter V, Marcias G, Zapatka M,
Barbus S and Lichter P: CITED4 gene silencing in colorectal cancer
cells modulates adherens/tight junction gene expression and reduces
cell proliferation. J Cancer Res Clin Oncol. 142:225–237. 2016.
View Article : Google Scholar : PubMed/NCBI
|
|
29
|
Zhong G, Li H, Shan T and Zhang N: CSN5
silencing inhibits invasion and arrests cell cycle progression in
human colorectal cancer SW480 and LS174T cells in vitro. Int J Clin
Exp Pathol. 8:2809–2815. 2015.PubMed/NCBI
|
|
30
|
Yip WK, Cheenpracha S, Chang LC, Ho CC and
Seow HF: Anti-proliferative and anti-invasive properties of a
purified fraction from Streptomyces sp. H7372. Int J Oncol.
37:1229–1241. 2010.PubMed/NCBI
|
|
31
|
Chu YW, Yang PC, Yang SC, Shyu YC, Hendrix
MJ, Wu R and Wu CW: Selection of invasive and metastatic
subpopulations from a human lung adenocarcinoma cell line. Am J
Respir Cell Mol Biol. 17:353–360. 1997. View Article : Google Scholar : PubMed/NCBI
|
|
32
|
Smith JJ, Deane NG, Wu F, Merchant NB,
Zhang B, Jiang A, Lu P, Johnson JC, Schmidt C, Bailey CE, et al:
Experimentally derived metastasis gene expression profile predicts
recurrence and death in patients with colon cancer.
Gastroenterology. 138:958–968. 2010. View Article : Google Scholar : PubMed/NCBI
|
|
33
|
Gao F and Wang W: MicroRNA-96 promotes the
proliferation of colorectal cancer cells and targets tumor protein
p53 inducible nuclear protein 1, forkhead box protein O1 (FOXO1)
and FOXO3a. Mol Med Rep. 11:1200–1206. 2015. View Article : Google Scholar : PubMed/NCBI
|
|
34
|
Vicente-Manzanares M, Ma X, Adelstein RS
and Horwitz AR: Non-muscle myosin II takes centre stage in cell
adhesion and migration. Nat Rev Mol Cell Biol. 10:778–790. 2009.
View Article : Google Scholar : PubMed/NCBI
|
|
35
|
Kim DY and Helfman DM: Loss of MLCK leads
to disruption of cell-cell adhesion and invasive behavior of breast
epithelial cells via increased expression of EGFR and ERK/JNK
signaling. Oncogene. 35:4495–4508. 2016. View Article : Google Scholar : PubMed/NCBI
|
|
36
|
Gröschl BM, Bettstetter T, Widmann F,
Hofstädter W and Dietmaier W: IQGAP2 is downregulated in colorectal
cancer (CRC) and involved in cellular migration. Cancer Res. 74
(Suppl 19):50042014.
|
|
37
|
Xie Y, Yan J, Cutz JC, Rybak AP, He L, Wei
F, Kapoor A, Schmidt VA, Tao L and Tang D: IQGAP2, A candidate
tumour suppressor of prostate tumorigenesis. Biochim Biophys Acta.
1822:875–884. 2012. View Article : Google Scholar : PubMed/NCBI
|
|
38
|
Arsic N, Bendris N, Peter M, Begon-Pescia
C, Rebouissou C, Gadéa G, Bouquier N, Bibeau F, Lemmers B and
Blanchard JM: A novel function for Cyclin A2: Control of cell
invasion via RhoA signaling. J Cell Biol. 196:147–162. 2012.
View Article : Google Scholar : PubMed/NCBI
|
|
39
|
Nakamura N, Oshiro N, Fukata Y, Amano M,
Fukata M, Kuroda S, Matsuura Y, Leung T, Lim L and Kaibuchi K:
Phosphorylation of ERM proteins at filopodia induced by Cdc42.
Genes Cells. 5:571–581. 2000. View Article : Google Scholar : PubMed/NCBI
|
|
40
|
Lu P, Weaver VM and Werb Z: The
extracellular matrix: A dynamic niche in cancer progression. J Cell
Biol. 196:395–406. 2012. View Article : Google Scholar : PubMed/NCBI
|
|
41
|
Kleinman HK, McGarvey ML, Liotta LA, Robey
PG, Tryggvason K and Martin GR: Isolation and characterization of
type IV procollagen, laminin, and heparan sulfate proteoglycan from
the EHS sarcoma. Biochemistry. 21:6188–6193. 1982. View Article : Google Scholar : PubMed/NCBI
|
|
42
|
Vukicevic S, Kleinman HK, Luyten FP,
Roberts AB, Roche NS and Reddi AH: Identification of multiple
active growth factors in basement membrane Matrigel suggests
caution in interpretation of cellular activity related to
extracellular matrix components. Exp Cell Res. 202:1–8. 1992.
View Article : Google Scholar : PubMed/NCBI
|
|
43
|
Hood JD and Cheresh DA: Role of integrins
in cell invasion and migration. Nat Rev Cancer. 2:91–100. 2002.
View Article : Google Scholar : PubMed/NCBI
|
|
44
|
Chaijan S, Roytrakul S, Mutirangura A and
Leelawat K: Matrigel induces L-plastin expression and promotes
L-plastin-dependent invasion in human cholangiocarcinoma cells.
Oncol Lett. 8:993–1000. 2014. View Article : Google Scholar : PubMed/NCBI
|
|
45
|
de Araujo VC, Pinto Junior DS, de Sousa
SO, Nunes FD and de Araujo NS: Vimentin in oral squamous cell
carcinoma. Eur Arch Otorhinolaryngol. 250:105–109. 1993. View Article : Google Scholar : PubMed/NCBI
|
|
46
|
Mendez MG, Kojima S and Goldman RD:
Vimentin induces changes in cell shape, motility, and adhesion
during the epithelial to mesenchymal transition. FASEB J.
24:1838–1851. 2010. View Article : Google Scholar : PubMed/NCBI
|
|
47
|
Dal Vechio AM, Giudice FS, Sperandio FF,
Mantesso A and Pinto Junior Ddos S: Vimentin expression and the
influence of Matrigel in cell lines of head and neck squamous cell
carcinoma. Braz Oral Res. 25:235–240. 2011. View Article : Google Scholar : PubMed/NCBI
|
|
48
|
Price KJ, Tsykin A, Giles KM, Sladic RT,
Epis MR, Ganss R, Goodall GJ and Leedman PJ: Matrigel basement
membrane matrix influences expression of microRNAs in cancer cell
lines. Biochem Biophys Res Commun. 427:343–348. 2012. View Article : Google Scholar : PubMed/NCBI
|
|
49
|
Ress AL, Stiegelbauer V, Winter E,
Schwarzenbacher D, Kiesslich T, Lax S, Jahn S, Deutsch A,
Bauernhofer T, Ling H, et al: miR-96-5p influences cellular growth
and is associated with poor survival in colorectal cancer patients.
Mol Carcinog. 54:1442–1450. 2015. View Article : Google Scholar : PubMed/NCBI
|
|
50
|
Arndt GM, Dossey L, Cullen LM, Lai A,
Druker R, Eisbacher M, Zhang C, Tran N, Fan H, Retzlaff K, et al:
Characterization of global microRNA expression reveals oncogenic
potential of miR-145 in metastatic colorectal cancer. BMC Cancer.
9:3742009. View Article : Google Scholar : PubMed/NCBI
|
|
51
|
Motoyama K, Inoue H, Takatsuno Y, Tanaka
F, Mimori K, Uetake H, Sugihara K and Mori M: Over- and
under-expressed microRNAs in human colorectal cancer. Int J Oncol.
34:1069–1075. 2009.PubMed/NCBI
|
|
52
|
Sarver AL, French AJ, Borralho PM,
Thayanithy V, Oberg AL, Silverstein KA, Morlan BW, Riska SM,
Boardman LA, Cunningham JM, et al: Human colon cancer profiles show
differential microRNA expression depending on mismatch repair
status and are characteristic of undifferentiated proliferative
states. BMC Cancer. 9:4012009. View Article : Google Scholar : PubMed/NCBI
|
|
53
|
Schepeler T, Reinert JT, Ostenfeld MS,
Christensen LL, Silahtaroglu AN, Dyrskjot L, Dyrskjøt L, Wiuf C,
Sørensen FJ, Kruhøffer M, et al: Diagnostic and prognostic
microRNAs in stage II colon cancer. Cancer Res. 68:6416–6424. 2008.
View Article : Google Scholar : PubMed/NCBI
|
|
54
|
Schetter AJ, Leung SY, Sohn JJ, Zanetti
KA, Bowman ED, Yanaihara N, Yuen ST, Chan TL, Kwong DL, Au GK, et
al: MicroRNA expression profiles associated with prognosis and
therapeutic outcome in colon adenocarcinoma. JAMA. 299:425–436.
2008. View Article : Google Scholar : PubMed/NCBI
|
|
55
|
Bandrés E, Cubedo E, Agirre X, Malumbres
R, Zárate R, Ramirez N, Abajo A, Navarro A, Moreno I, Monzó M and
García-Foncillas J: Identification by Real-time PCR of 13 mature
microRNAs differentially expressed in colorectal cancer and
non-tumoral tissues. Mol Cancer. 5:292006. View Article : Google Scholar : PubMed/NCBI
|
|
56
|
Kuipers EJ, Grady WM, Lieberman D,
Seufferlein T, Sung JJ, Boelens PG, van de Velde CJH and Watanabe
T: Colorectal cancer. Nat Rev Dis Primers. 1:150652015. View Article : Google Scholar : PubMed/NCBI
|