Introduction
Metformin, a standard clinical drug, used for the
treatment of type 2 diabetes mellitus and polycystic ovary
syndrome, reduces cellular energy production and inhibits growth of
various cultured cancer cell lines (1,2).
Metformin has certain anticancer effects on BHK-21/C13-induced
fibrosarcoma in hamsters (3).
Notably, metformin exerts anticancer effects in vitro via
the following main mechanisms: Inhibition of AMP-activated protein
kinase (AMPK)/serine/threonine- protein kinase mTOR signaling,
anti-angiogenesis, or folate and autophagy inhibition (3). The drug also exhibits anticancer
effects by altering host response mechanisms, decreasing
gluconeogenesis and regulating circulating insulin, lipid
metabolism and serum bile acids (4).
In addition, other possible anticancer mechanisms of action have
been identified for metformin, including transcriptional regulation
of certain genes (5), cobalamin
deficiency (6), inhibition of
neurogenic locus notch homolog protein 1/transcription factor HES
and androgen receptor signaling pathways (7), and regulation of tight junctions via
the myosin light-chain kinase-MLC signaling pathway (8).
In patients with diabetes, metformin is usually
administered in combination with the most common and safe
antimycotic agent itraconazole, since fungal infections occur
frequently in diabetes (9). This
combination is nontoxic in humans (10).
Similar to metformin, itraconazole also possesses
anticancer properties. The in vitro anticancer functions of
itraconazole in cancer cell cultures include the following:
Inhibition of AMPK/mTOR signaling (11), anti-angiogenesis (11), antilymphangiogenesis (11), folate and autophagy inhibition
(11,12), inhibition of Hedgehog signaling
(13,14), inhibition of P-glycoprotein (P-gp),
chemosensitization (reversed multiple drug resistance, particularly
to cytotoxic antitumor drugs), inhibition of the transportation and
pumping of cholesterol, and inhibition of the Wnt/β-catenin
signaling pathway (11). There is
notable synergy between antifolates and itraconazole, which
inhibits ergosterol biosynthesis (12).
The pharmacokinetic interaction between metformin
and itraconazole by mutual competitive inhibition of metabolism
through hepatic and intestinal cytochrome P450 3A (CYP3A)1/2 leads
to a significant increase in the areas under the serum
concentration/time curves of metformin and itraconazole following
oral or intravenous (IV) administration in rats, implying an
improved effect of the drugs (15,16).
Metformin and itraconazole are metabolized by the CYP3A subfamily
in rats and humans; the two drugs have been demonstrated to
significantly inhibit the metabolism of each other by CYP3A4 in
human microsomes (15). In humans,
metformin is predominantly excreted in urine unchanged, with
<20% of the IV dose being metabolized (15). In contrast, itraconazole is
eliminated exclusively by hepatic metabolism, where CYP3A4 in
humans or CYP3A1/2 in rats is involved to produce several
metabolites, including 7-hydroxyitraconazole, the major metabolite
in both species (15).
Itraconazole inhibits P-gp, decreasing the
elimination of organic cation drugs and increasing their absorption
(11). Metformin is present as a
cation at physiological pH (17).
Organic cation transporters 1 and 3 are active transporters of
metformin (18); therefore, as a
potent P-gp and CYP3A4 inhibitor, itraconazole can increase the
plasma concentrations of P-gp and CYP3A4 substrates, including
metformin, and enhance their effects (19).
The aim of the present study was to investigate the
anticancer effects of combining nontoxic drugs on experimental
tumors. Preclinical and limited clinical studies have proposed the
use of metformin (3) or itraconazole
(11) as promising nontoxic
anticancer agents. To the best of our knowledge, no published
results of the anticancer effect of the combination of these drugs
exist to date. The possibilities of synergistic anticancer
metformin-itraconazole interactions (15–18) and
safe multitargeting therapy (9,10), based
on previous separate preclinical studies (3,11,12),
were the main reasons for testing this drug combination on an
experimental hamster fibrosarcoma model.
Sarcoma models are of fundamental importance in
cancer treatment research due to the multiple pathological and
clinical entities, resistance to current therapies and high
mortality attributed to these malignancies (20). Sarcomas are a large family of diverse
mesenchymal malignant tumors derived from connective and soft
tissues, such as bone, muscle, cartilage, fat, vascular tissue,
skin or hematopoietic tissue (21).
Sarcomas affect ~200,000 individuals worldwide each year and
represent a higher percentage of overall cancer morbidity and
mortality in children and adolescents compared with adults
(22,23). Sarcomas account for >20% of all
pediatric solid malignant cancers (24). Notably, osteosarcoma is the most
common primary bone tumor and mainly affects adolescents and young
adults (25), and rhabdomyosarcoma
is the most common soft tissue sarcoma of childhood (26). There are >100 different
histological subtypes of soft tissue sarcomas, which develop in a
number of different locations and tissues (23). Fibrosarcoma, which is a common soft
tissue sarcoma, accounts for ~10% of all sarcomas and occurs at all
ages; in children, the majority of tumors are diagnosed in the
first year and tend to occur in the lower extremities, whereas head
and neck lesions account for ≤20% of cases. Despite treatment
protocols that combine chemotherapy, including methotrexate,
cisplatin, doxorubicin and ifosfamide, surgery and radiotherapy,
the 5-year survival rate for patients diagnosed with sarcoma is
~60%, whereas for patients with metastatic disease the survival
rate is ~30%. Current treatment strategies for sarcomas, including
fibrosarcoma, are associated with significant side effects, and
there have been no significant improvements in prognosis in the
last decade (23). In addition,
chemotherapy dose increase has not improved the outcome (22,23).
Therefore, there is a need for improved nontoxic therapies for the
treatment of sarcoma and fibrosarcoma (20,22,23). The
main rationale for the use of metformin and itraconazole for
separate or combined antisarcoma therapy in an animal fibrosarcoma
model was the antifolate anticancer effect of the two drugs on
malignant cells in vitro (3,11,12). It
was hypothesized that an interaction between the folic acid cycle
and these drugs, which is different from the effects of the
antifolate drug methotrexate, may produce synergistic anticancer
effects similar to this antifolate drug, without toxicity.
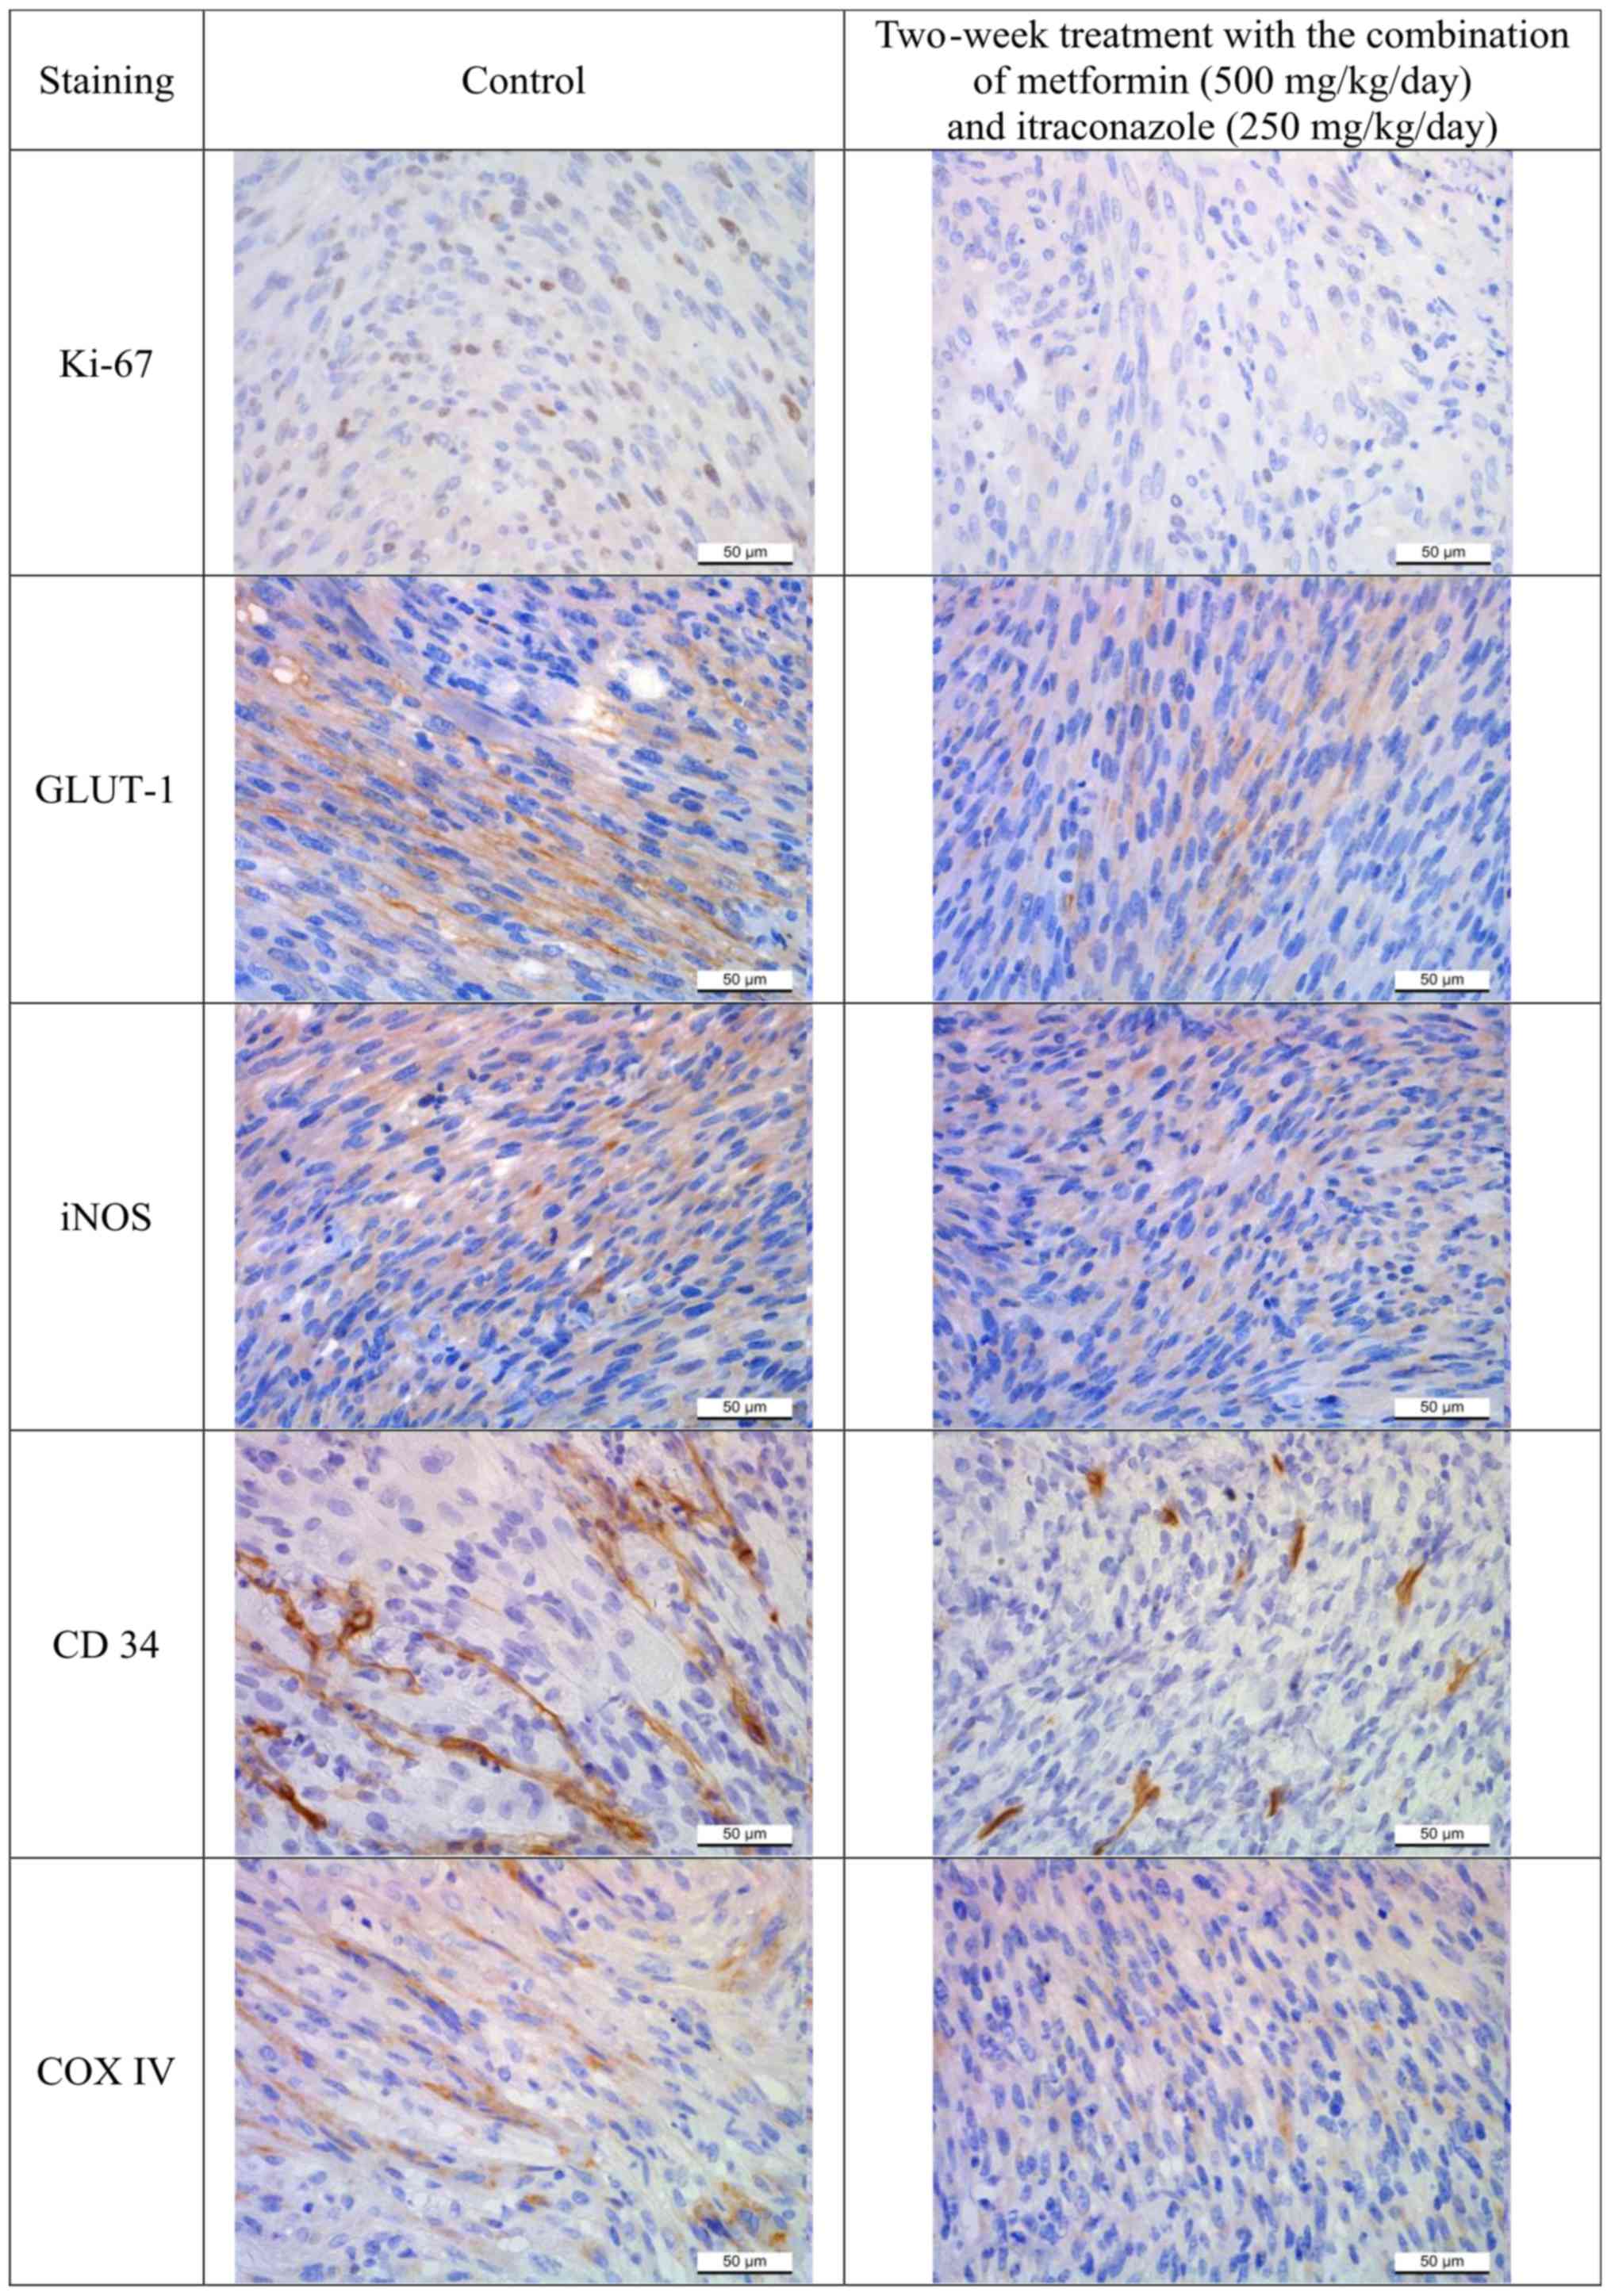
To validate the results on tumor progression
obtained by the measurements of fibrosarcoma dimensions, markers of
cancer mitosis (proliferation marker protein Ki-67), vasculature
(hematopoietic progenitor cell antigen CD34), apoptosis [cytochrome
c oxidase subunit 4 (COX4)], glucose metabolism [glucose
transporter 1 (GLUT1)] and nitric oxide (NO) production [inducible
NO synthase (iNOS)] were immunohistochemically assessed in
fibrosarcoma specimens (3,11,14).
Ki-67 immunoexpression was evaluated by stained cell counting
(3). The relative immunoexpression
of GLUT1, iNOS, CD34 and COX4 markers was graded according to the
portion of stained sample areas. For further validation of the
results of co-treatment with metformin and itraconazole, the in
vitro antiproliferative functions of the combination treatment
in cervical carcinoma HeLa, colon carcinoma HT-29, lung carcinoma
A549, fibrosarcoma BHK-21/C13 and normal fetal lung MRC-5 cells
were tested.
Materials and methods
Animal model
The present study was performed on 48 Syrian golden
hamsters (22 males and 26 females; age, 12–20 weeks; weight, ~100
g). The animals were obtained from the Pasteur Institute and were
maintained under standard animal housing conditions at 25±2°C and
60±2% humidity under a 12-h light/dark cycle. The animals had ad
libitum access to food and water.
The study protocol was conducted in accordance with
the requirements of the national regulations for the handling of
laboratory animals and the study was approved by the University of
Novi Sad Animal Ethics Committee (approval no. 01-78/18-5; dated
April 26, 2016).
The hamsters were randomized into eight groups (n=6
hamsters/group) with equal numbers of males and females due to the
potential role of sex hormones on the response to the treatment.
Treatment with metformin, itraconazole (both Galenika a.d.) and
their combination in experimental groups was initiated 3 days prior
to the subcutaneous inoculation of 1 ml BHK-21/C13 cell suspension
(27) (2×10⁶ cells/ml)
into the back for the development of a subcutaneous fibrosarcoma
tumor (28). BHK-21/C13 cells were
cultured in DMEM media with 4.5 g/l glucose (Capricorn Scientific),
supplemented with 10% fetal bovine serum (FBS; Capricorn
Scientific), 2 mM glutamine (Capricorn Scientific) and 1%
penicilin/streptomicin (Capricorn Scientific), at 37°C, in a 5%
CO2 humidified atmosphere. Cells were subcultured twice
a week once they reached confluency of 70–80%. Tumor inoculation
and drug administration were performed by the same researcher to
maintain consistency. The following humane endpoints were
established: Significant body weight loss (20%), decreased
activity/responsiveness with loss of body weight, impaired posture,
inability to eat, urinate or defecate, tumor diameter >10% body
weight, or tumor ulceration. The following aspects were monitored:
Behavior, general condition, body weight (measured daily), general
clinical signs (diarrhea, neurological signs, breathing disorders),
tumor diameter, anatomical location, incidence of multiple tumors
and tumor ulceration.
Two sets of experiments were performed. The first
set involved four groups of animals administered different
treatments via a gastric probe daily for 3 days prior to cancer
cell inoculation: Perioral treatment with i) physiological saline;
ii) 500 mg/kg metformin; iii) 250 mg/kg itraconazole; or iv)
combination of 500 mg/kg metformin and 250 mg/kg itraconazole. The
animals were sacrificed 2 weeks post-inoculation. The second set of
experiments followed the same protocol as the first set, with the
exception that the daily dose of metformin was 250 mg/kg and the
animals were sacrificed at 3 weeks. To sacrifice the animals, a
dose of 60 mg/kg pentobarbital was administered intraperitoneally.
The animals were assessed for loss of consciousness at 5 min by a
combination of methods, including a toe pinch, lack of visible
respiration and lack of reaction on digital palpation. An
additional dose of 30 mg/kg pentobarbital was administered if loss
of consciousness was not observed. Total cardiac exsanguination was
performed immediately following confirmation of loss of
consciousness. The volume of blood extracted by total cardiac
exsanguination was 3–5.5 ml, depending on animal weight and/or sex.
Only 2–3 ml of the total collected blood was used for blood
biochemical analysis. Following exsanguination and animal death,
vital organs (heart, lungs, liver, kidneys and brain) were removed.
The weight of the animals at the time of sacrifice is presented in
Table I. In a previous study,
subcutaneous inoculation of 1×10⁷ BHK-21/C13 cells
produced fibrosarcoma, which killed the animals in 40 days
(28). Therefore, 21 days was the
maximum duration of the experiments in the present study. All
animals were in a good condition during the study, and none of the
hamsters were euthanized prior to the end of the experiment. In the
course of experiment, the tumor burdens were evaluated daily using
calipers and the following ellipsoid volume formula:
Volume=4πabc/3, where a, b and c are half-diameters (29,30). The
maximal tumor burden in the present study, 1 day prior to
sacrifice, was <3.2% of body weight for the 2-week treatment
groups and <10% of body weight for the 3-week treatment groups.
After sacrifice, the tumors were excised, weighed, their diameters
were measured and the exact tumor volume was determined using the
standard water volume displacement method.
 | Table I.Characteristics of animals in the
control and treated groups. |
Table I.
Characteristics of animals in the
control and treated groups.
| A, Control
group |
|---|
|
|---|
|
| 2-week
treatment | 3-week
treatment |
|---|
|
|
|
|
|---|
|
| Hamster | Tumor | Hamster | Tumor |
|---|
|
|
|
|
|
|
|---|
| No. | Weight at start
(g) | Weight at end
(g) | Sex | Weight (g) | Dmax
(cm)a | Volume
(cm3) | Weight at start
(g) | Weight at end
(g) | Sex | Weight (g) | Dmax
(cm)a | Volume
(cm3) |
|---|
| 1 | 91 | 102 | F | 2.370 | 2.4 | 2.20 | 104 | 160 | F | 7.700 | 3.5 | 7.00 |
| 2 | 87 | 98 | F | 2.580 | 3.4 | 2.24 | 138 | 176 | F | 16.890 | 3.5 | 16.00 |
| 3 | 82 | 93 | M | 0.550 | 1.8 | 0.35 | 112 | 123 | F | 11.380 | 3.5 | 10.50 |
| 4 | 94 | 99 | M | 3.040 | 2.4 | 2.80 | 115 | 118 | M | 2.580 | 2.5 | 2.30 |
| 5 | 80 | 91 | M | 1.600 | 2.3 | 1.50 | 134 | 141 | M | 1.270 | 2.0 | 1.20 |
| 6 | 84 | 92 | M | 0.670 | 2.1 | 0.60 | 105 | 112 | M | 7.930 | 3.4 | 7.20 |
| Mean | 86.3 | 95.8 | – | 1.802 | 2.4 | 1.67 | 118.0 | 138.3 | – | 7.960 | 3.07 | 7.37 |
| ± SD | 5.4 | 4.4 | – | 1.034 | 0.54 | 0.96 | 14.6 | 25.4 | – | 5.750 | 0.65 | 5.44 |
|
| B, Group treated
with metformin |
|
| 1 | 124 | 138 | F | 2.470 | 2.5 | 2.40 | 79 | 91 | F | 7.690 | 2.8 | 7.00 |
| 2 | 146 | 155 | F | 1.270 | 2.2 | 1.20 | 78 | 84 | F | 6.690 | 3.0 | 6.00 |
| 3 | 118 | 133 | F | 3.960 | 2.6 | 3.80 | 75 | 87 | F | 4.110 | 2.2 | 3.80 |
| 4 | 87 | 112 | M | 1.640 | 2.0 | 1.50 | 112 | 108 | M | 2.660 | 2.2 | 2.50 |
| 5 | 78 | 101 | M | 0.800 | 1.6 | 0.75 | 84 | 86 | M | 3.860 | 2.8 | 3.70 |
| 6 | 91 | 73 | M | 0.710 | 1.8 | 0.70 | 87 | 92 | M | 2.510 | 1.9 | 2.40 |
| Mean | 107.3 | 118.7 | – | 1.808 | 2.12 | 1.56 | 85.8 | 91.3 | – | 4.587 | 2.48 | 4.23 |
| ± SD | 26.2 | 29.5 | – | 1.234 | 0.39 | 1.15 | 13.5 | 8.7 | – | 2.137 | 0.44 | 1.88 |
|
| C, Group treated
with itraconazole (250 mg/kg) |
|
| 1 | 92 | 107 | F | 3.100 | 2.0 | 3.00 | 89 | 98 | F | 7.230 | 3.0 | 7.00 |
| 2 | 132 | 121 | F | 1.160 | 2.1 | 1.10 | 99 | 102 | F | 7.900 | 3.2 | 7.50 |
| 3 | 112 | 110 | F | 0.800 | 1.9 | 0.75 | 140 | 107 | F | 6.700 | 3.2 | 6.50 |
| 4 | 149 | 129 | F | 0.630 | 1.2 | 0.60 | 112 | 100 | F | 5.970 | 3.2 | 5.50 |
| 5 | 125 | 98 | M | 0.780 | 1.9 | 0.70 | 95 | 110 | M | 5.090 | 3.0 | 4.80 |
| 6 | 51 | 71 | M | 2.260 | 2.4 | 2.00 | 82 | 85 | M | 6.530 | 3.2 | 6.00 |
| Mean | 110.2 | 106.0 | – | 1.455 | 1.92 | 1.36 | 102.8 | 100.3 | – | 6.570 | 3.13 | 6.22 |
| ± SD | 34.7 | 20.3 | – | 1.001 | 0.397 | 0.95 | 20.8 | 8.7 | – | 0.977 | 0.10 | 0.99 |
|
| D, Group
co-treated with metformin and itraconazole (250 mg/kg) |
|
|
| 2-week
treatmentb | 3-week
treatmentc |
|
|
|
|
|
| Hamster | Tumor | Hamster | Tumor |
|
|
|
|
|
|
| No. | Weight at start
(g) | Weight at end
(g) | Sex | Weight
(g) | Dmax
(cm)a | Volume
(cm3) | Weight at start
(g) | Weight at end
(g) | Sex | Weight
(g) | Dmax
(cm)a | Volume
(cm3) |
|
| 1 | 93 | 93 | F | 0.350 | 1.2 | 0.34 | 94 | 112 | F | 2.970 | 1.8 | 2.80 |
| 2 | 101 | 104 | F | 0.120 | 0.9 | 0.12 | 98 | 99 | F | 2.090 | 1.9 | 2.00 |
| 3 | 109 | 113 | F | 0.400 | 1.6 | 0.40 | 96 | 94 | F | 1.440 | 1.7 | 1.40 |
| 4 | 84 | 85 | F | 0.170 | 1.1 | 0.16 | 105 | 98 | M | 2.450 | 2.7 | 2.35 |
| 5 | 118 | 117 | M | 0.460 | 1.4 | 0.45 | 89 | 104 | M | 1.920 | 2.2 | 1.85 |
| 6 | 106 | 114 | M | 0.250 | 1.0 | 0.24 | 88 | 90 | M | 1.040 | 1.4 | 1.00 |
| Mean | 101.8 | 104.3 | – | 0.292 | 1.20 | 0.28 | 95.0 | 99.5 | – | 1.973 | 1.95 | 1.90 |
| ± SD | 12.1 | 12.9 | – | 0.134 | 0.26 | 0.13 | 6.3 | 7.7 | – | 0.690 | 0.45 | 0.65 |
Metformin was dissolved in physiological saline and
administered at a dose of 250 or 500 mg/kg (in 1 ml/100 g animal
weight), equivalent to a human dose of 20 or 40 mg/kg (by
normalization to surface area), which are the daily doses taken by
patients with diabetes (31). The
dose of itraconazole (250 mg/kg) was equivalent to the maximum
human dose of 20 mg/kg, and was prepared and administered in the
same manner as metformin. The control groups received physiological
saline (1 ml/100 g animal weight). The relative tumor weight was
determined as the weight ratio of tumor/animal. The tumor volume
was determined using the standard water volume displacement method,
by measuring the water level in a graduated cylinder prior to and
following the submergence of the tumor. The tumor density was
calculated as density=mass/volume. The tumor surface area (S) was
calculated using the ellipsoid formula from three half diameters
(a, b and c): S=4π {[(ab)1.6 + (ac)1.6 +
(bc)1.6]/3}1/1.6. The ratio of tumor surface
area to volume (S/V) was also calculated.
Tumor slices (4 µm) were assessed
pathohistologically and immunohistochemically for the verification
of tumor growth and angiogenesis. The weight of the hamsters was
recorded in order to evaluate possible side effects of metformin
and/or itraconazole. The vital animal organs (brain, heart, lungs,
liver and kidneys) were analyzed histopathologically and no obvious
toxicological effects of drugs used in this experiment were
detected.
Immunohistochemistry
In addition to the principal hematoxylin and eosin
staining, immunohistochemical Ki-67, CD34, COX4, GLUT1 and iNOS
staining was performed to assess tumor cell proliferation. Tissue
sections were stained at room temperature with hematoxylin for 5
min and with Eosin G for 30 sec. For the Ki-67 staining, tumor
slices were fixed in 10% neutral buffered formalin for 48 h at room
temperature, blocked with 4% bovine serum albumin (Capricorn
Scientific) in PBS for 1 h at room temperature, and incubated
overnight at 4°C with anti-Ki-67 primary antibody (Thermo Fisher
Scientific, Inc.; cat. no. RB-9043-P0, 1:300). Sections were
incubated with fluorescein isothiocyanate-conjugated polyclonal
anti-rabbit secondary antibody (cat. no. F7512; 1:80;
Sigma-Aldrich; Merck KGaA) for 2 h at room temperature. The nuclei
were counterstained with Hoechst 33256 (Sigma-Aldrich; Merck KGaA).
In further immunohistochemical staining, the following primary
antibodies were used: CD34 (Abcam; cat. no. ab81289; 1:200), COX4
(Abcam; cat. no. ab185056; 1:1,000), GLUT1 (Thermo Fisher
Scientific, Inc.; cat. no. RB-9052-P0; 1:200) and iNOS (Thermo
Fisher Scientific, Inc.; RB-9242-P0; 1:100). Briefly, sections (5
µm) were deparaffinized in xylene (100%) and rehydrated in
descending ethanol series (100% twice for 3 min; 95% for 3 min and
70% for 3 min). For antigen retrieval, the sections were microwaved
(850 W; ~98°C) for 20 min in Tris-EDTA buffer [10 mM Tris Base, 1
mM EDTA solution, 0.05% Tween 20 (pH 9.0)], washed twice for 5 min
with TBS plus 0.025% Triton X-100 (with agitation) and blocked by
immersion in 10% goat serum (cat. no. G6767; Sigma-Aldrich; Merck
KGaA) in TBS with 1% BSA (cat. no. T6789; Sigma-Aldrich; Merck
KGaA) for 2 h at room temperature. Primary antibodies dissolved in
TBS with 1% BSA were incubated at 4°C overnight. The sections were
washed twice for 5 min with TBS plus 0.025% Triton X-100 (with
agitation) and incubated with 0.3% H2O2 in
TBS for 15 min at room temperature. Horseradish
peroxidase-conjugated goat polyclonal rabbit immunoglobulin G
secondary antibody (cat. no. ab6721; Abcam) dissolved in TBS with
1% BSA was added to the sections for 2 h at room temperature. The
sections were washed three times for 5 min with TBS. For
visualization, the chromogen 3,3-diaminobenzidine
tetrahydrochloride (cat. no. K3468; Liquid DAB + SubstratChromogen
System; Dako; Agilent Technologies, Inc.) was added and incubated
for 10 min at room temperature. The sections were washed with water
for 5 min and stained with Mayer's hematoxylin for 5 min at room
temperature. The stained tumor slices were assessed using Leica
DMLB 100T (Leica Microsystems GmbH) microscope at ×400
magnification. Images were captured using a Leica MC190 HD camera
(Leica Microsystems GmbH). The images of Ki-67 staining were
processed using the UTHSCSA Image Tool for Windows version 3.00
(32). In each sample image, the
number of Ki-67-positive cells was counted. The mean numbers of
Ki-67-positive cells in 20 tumor images from each animal were
compared among the groups.
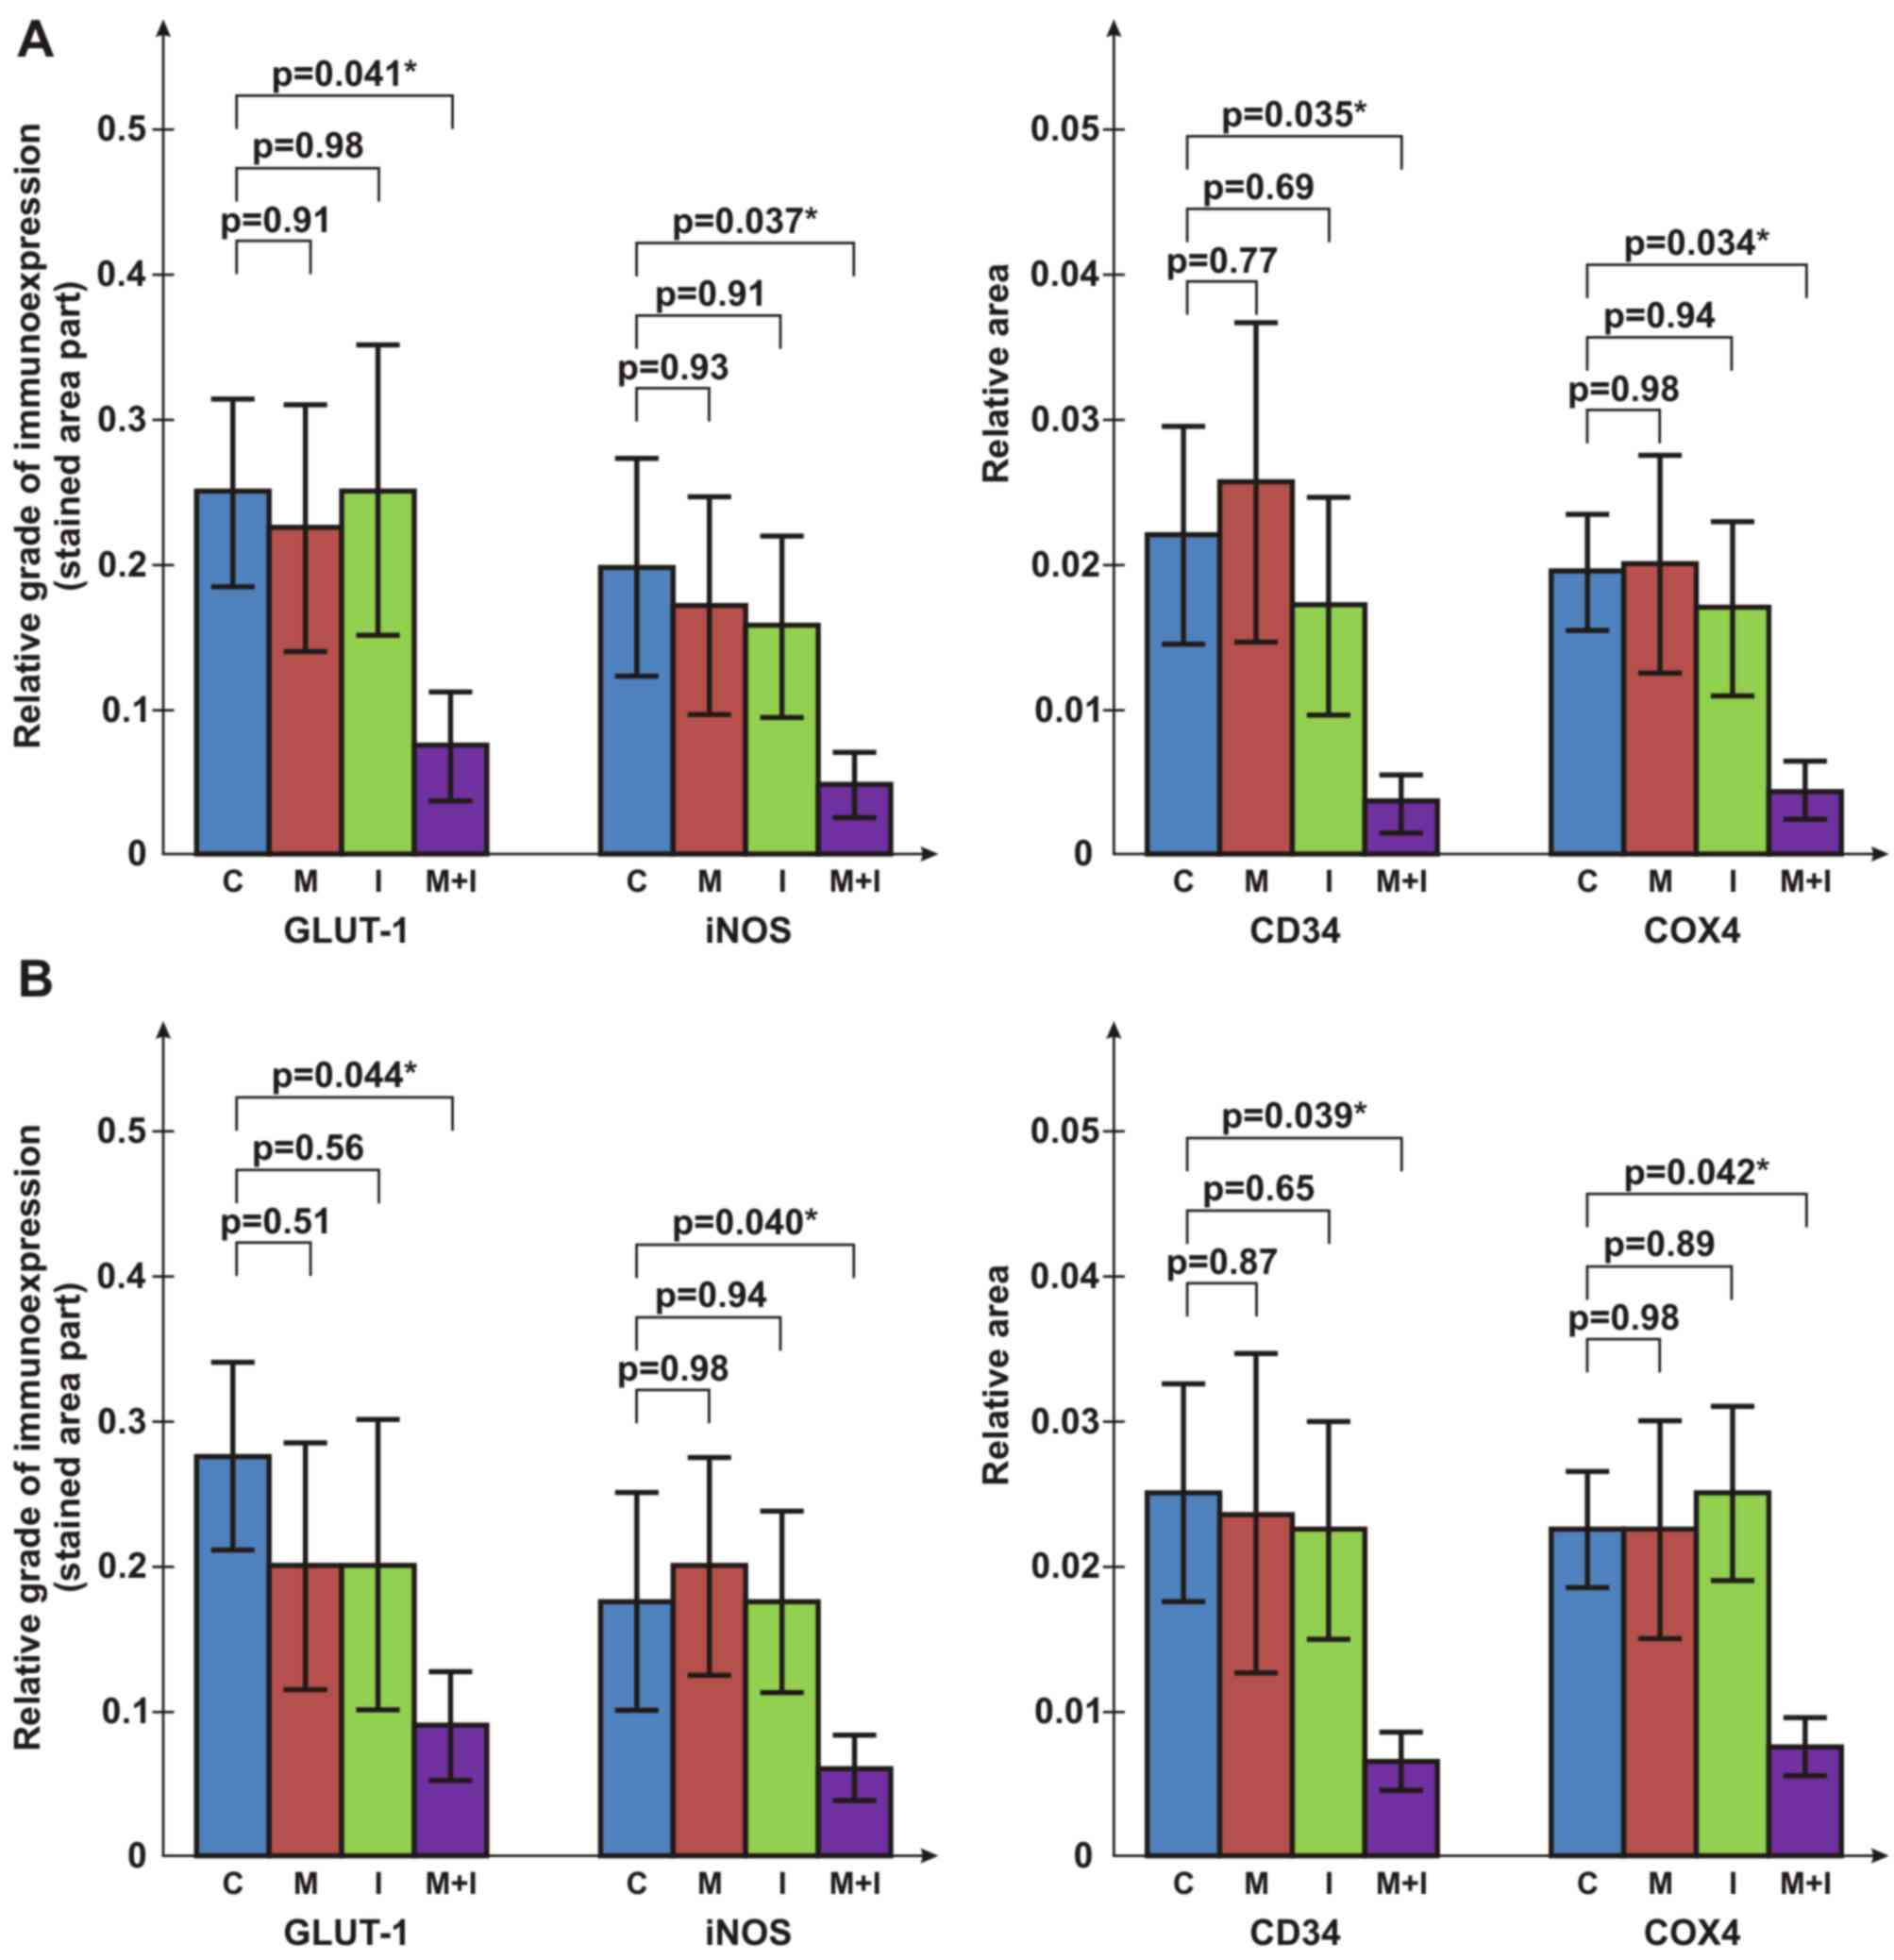
CD34, COX4, GLUT1 and iNOS staining was used to
evaluate the vasculature, apoptosis, glucose metabolism and NO
production in the tumor specimens, respectively. Immunoexpression
was evaluated based on the measured portion of stained surface area
(stained surface/whole surface) in the tumor sections (mean of 10
measurements) using UTHSCSA Image Tools for Windows version
3.00.
In vitro antiproliferative assay
The tested treatments were evaluated for their in
vitro antiproliferative effects in hamster fibrosarcoma
BHK-21/C13, human cervical carcinoma HeLa (CCL-2), colon carcinoma
HT-29 (HTB-38), lung carcinoma A549 (CCL-185) and normal fetal lung
MRC-5 (CCL-171) cells. All cell lines were obtained from the
American Type Culture Collection. The cell lines were authenticated
and mycoplasma testing was conducted. The cell lines were cultured
in DMEM with 4.5 g/l glucose containing 10% FBS and 1%
penicillin-streptomycin in an incubator at 37°C with 5%
CO2. A standard MTT assay (33) was performed to evaluate the cytotoxic
effects of the treatments following exposure to doses of 50, 100,
250, 350, 500 µM and 1, 2, 3, 4, 5, 10, 20, 50 mM at 37°C for 48 h.
The antiproliferative effect was expressed as the half maximal
inhibitory concentration (IC50).
Blood biochemical tests
Blood samples were collected from the hamsters for
blood measurements, including glucose, erythrocytes, leucocytes,
lymphocytes, monocytes, granulocytes, platelets, hemoglobin,
hematocrit, mean corpuscular volume, mean corpuscular hemoglobin,
mean corpuscular hemoglobin concentration, serum proteins, albumins
and sedimentation. Full blood cell counts were obtained using an
auto hematology analyzer (Abacus Junior Vet; Diatron; Stratec SE).
The serum, extracted by centrifugation at 2,000 × g for 10 min from
the blood samples, was analyzed using an auto chemistry analyzer
(Rayto Life and Analytical Sciences Co., Ltd.) and by commercial
tests for concentration determination of glucose (cat. no. 21503),
serum proteins (cat. no. 11500) and albumins (cat. no. 11547;
BioSystems S.A.).
Statistical analysis
The data are presented as means ± standard
deviations. The differences among the groups in tumor weight,
volume, density, length, surface area, S/V ratio, mean number of
Ki-67-positive cells and other measured parameters were determined
using one-way ANOVA followed by a Student-Newman-Keuls post hoc
test. Data analysis was conducted using TIBCO Statistica 13.3.1
software (TIBCO Software, Inc.). P<0.05 was considered to
indicate a statistically significant difference.
Results
Co-treatment with metformin and
itraconazole has antitumor effects in a hamster fibrosarcoma
model
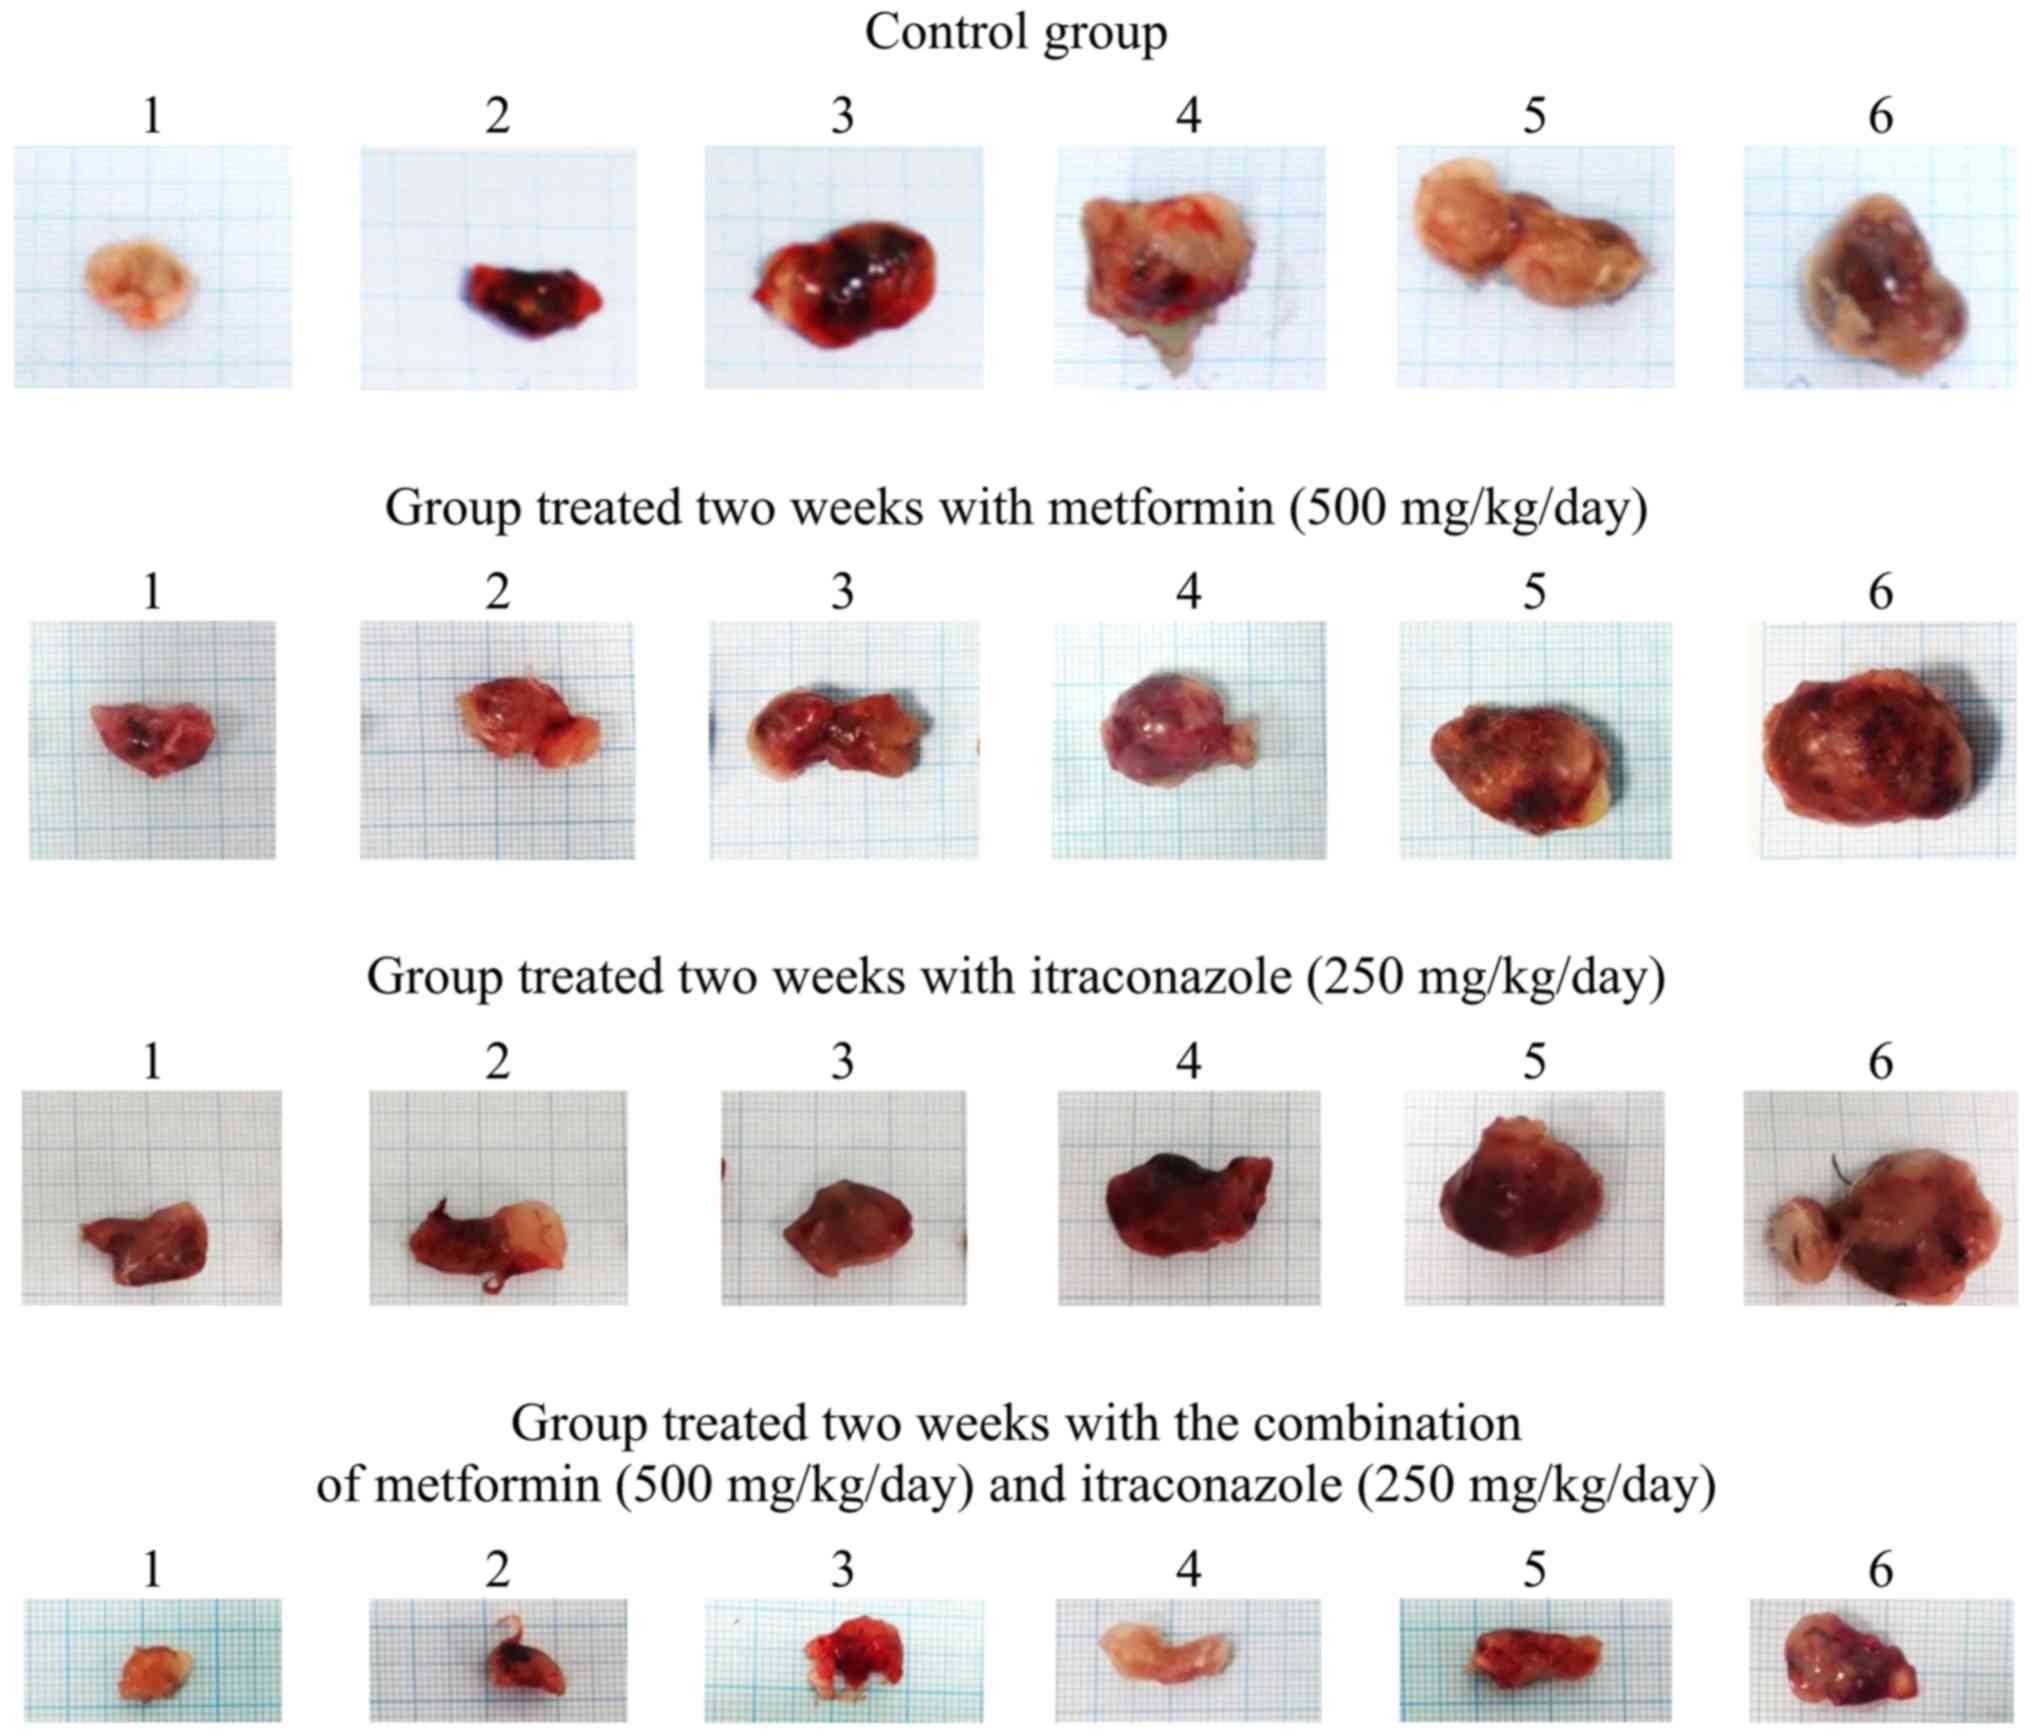
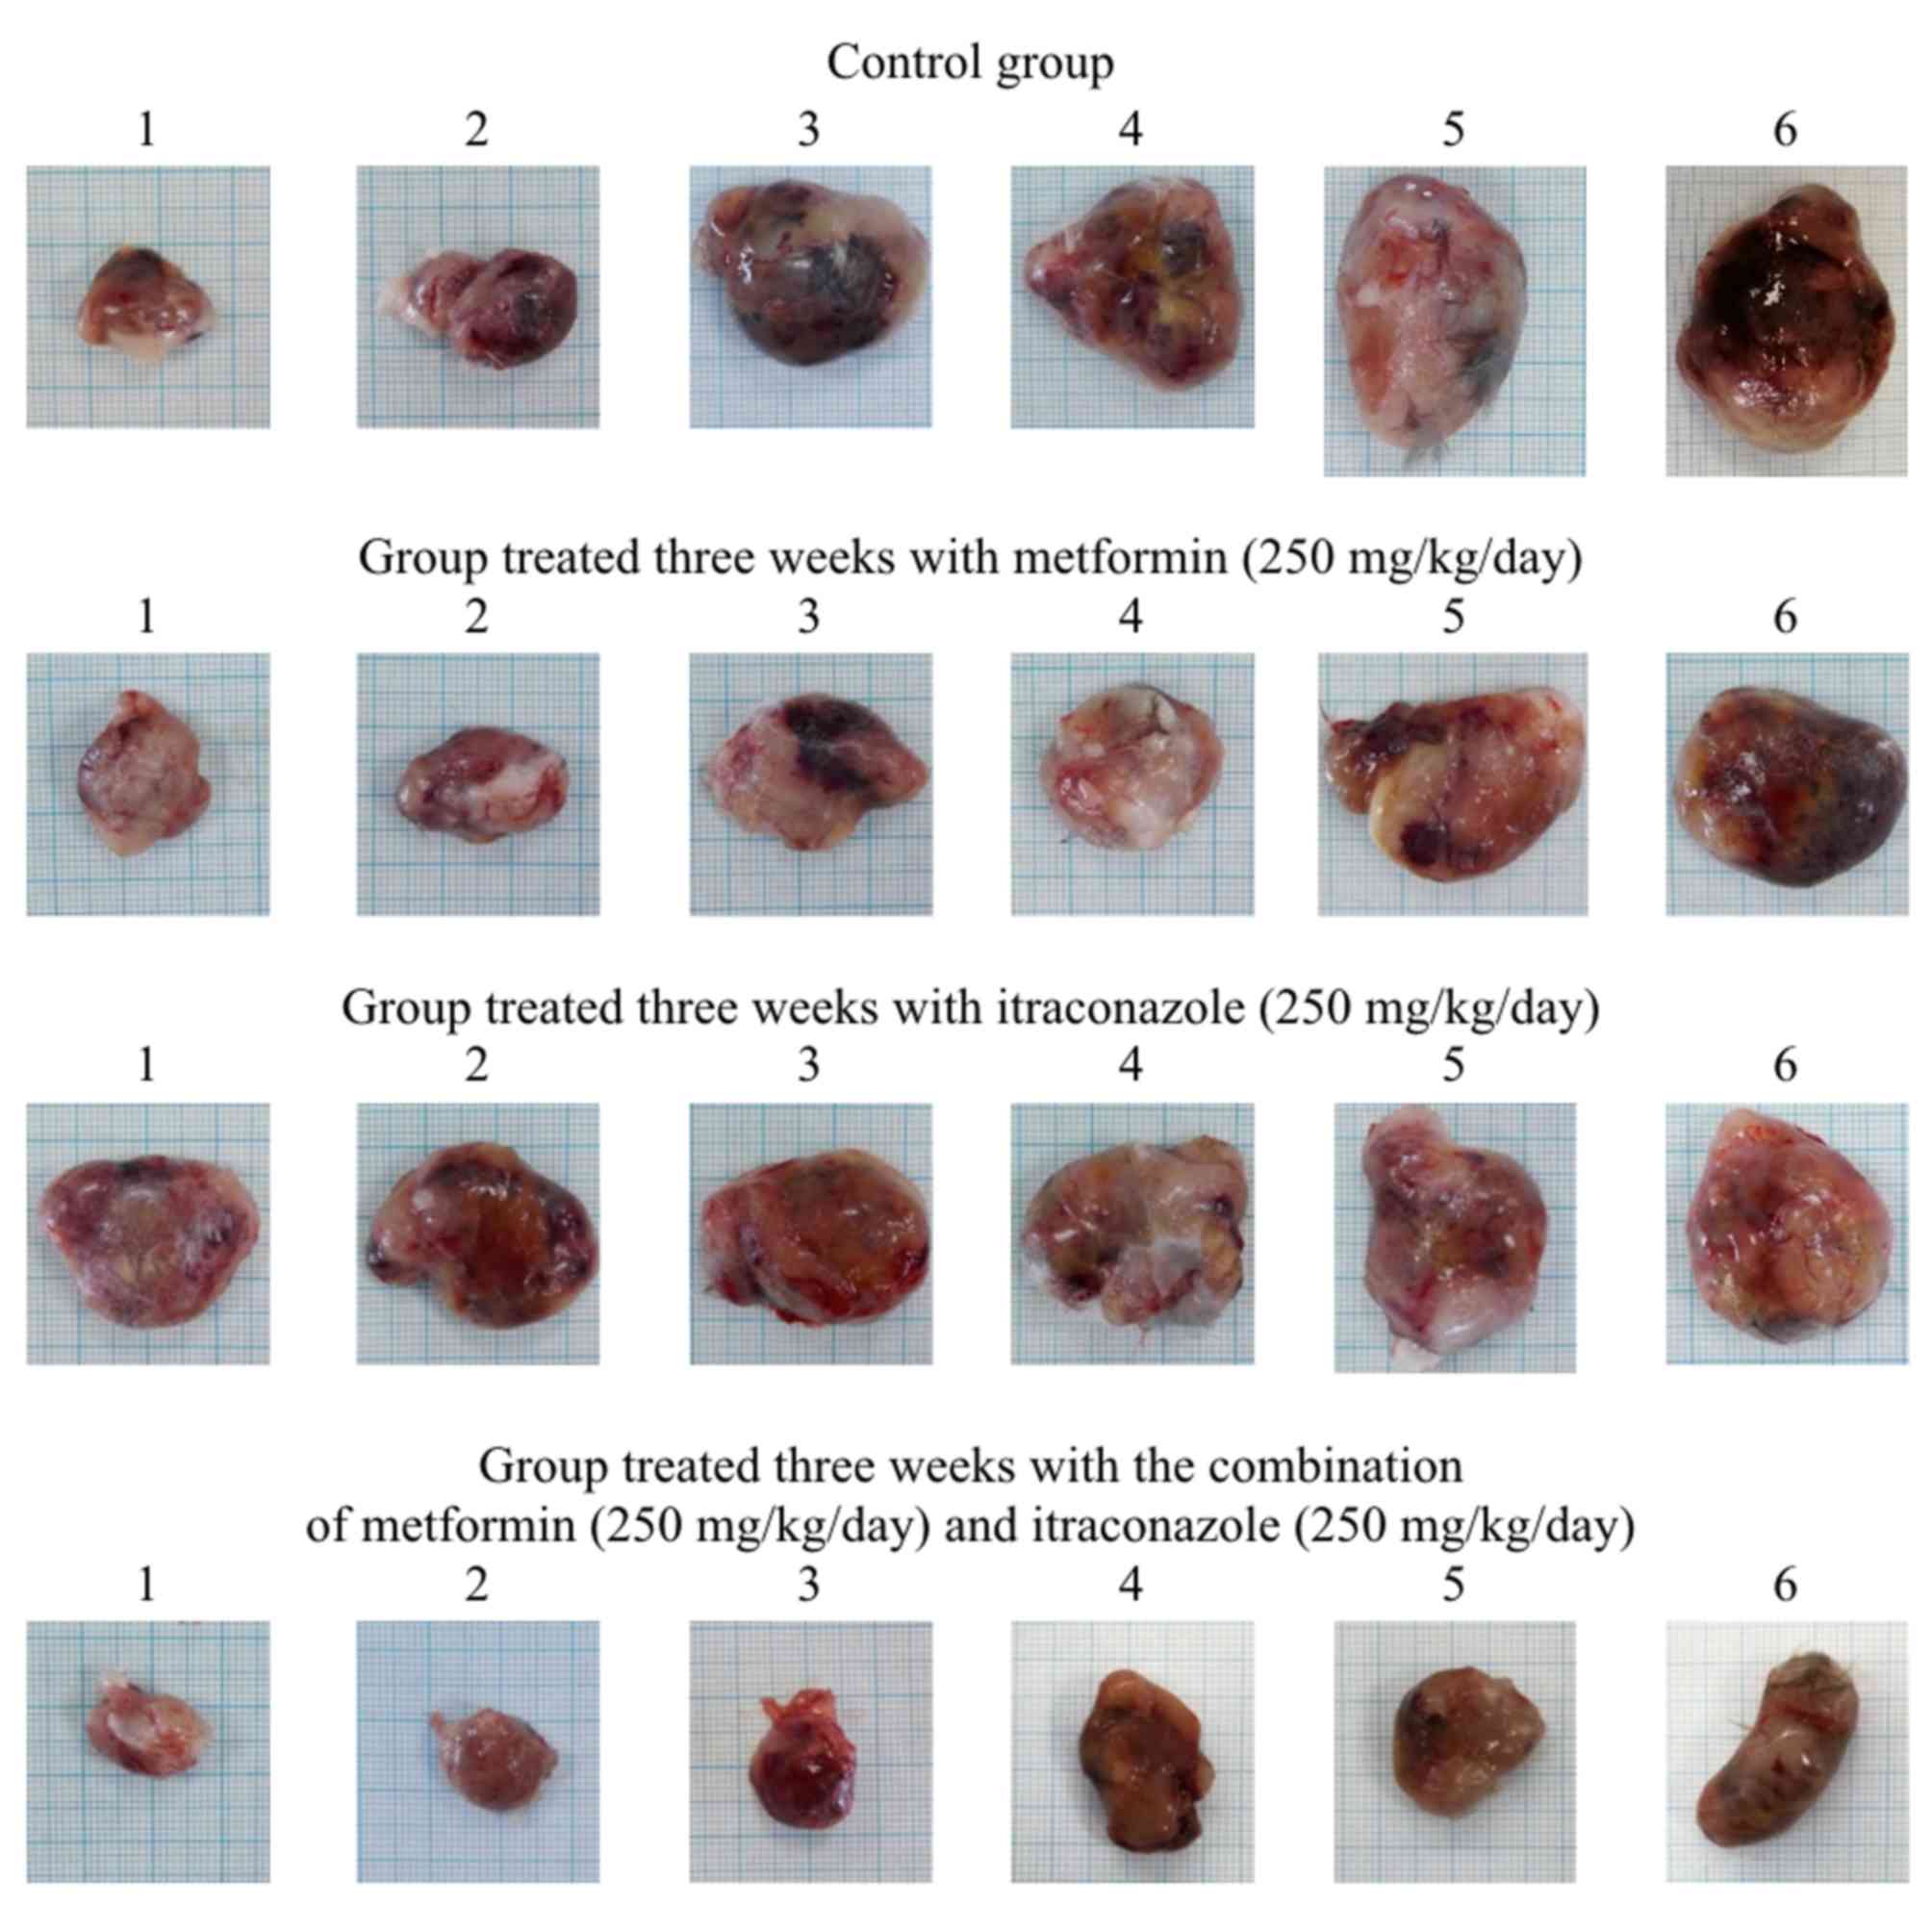
The subcutaneous inoculation of BHK-21/C13 cells
into hamsters (Table I) resulted in
fibrosarcoma formation at the site of injection in all inoculated
animals. All experimental animals had isolated, well-demarcated
solid tumors without adverse effects on general health and
well-being. Pathological and histopathological analysis following
autopsy revealed no signs of metastases or ascites. Perioral
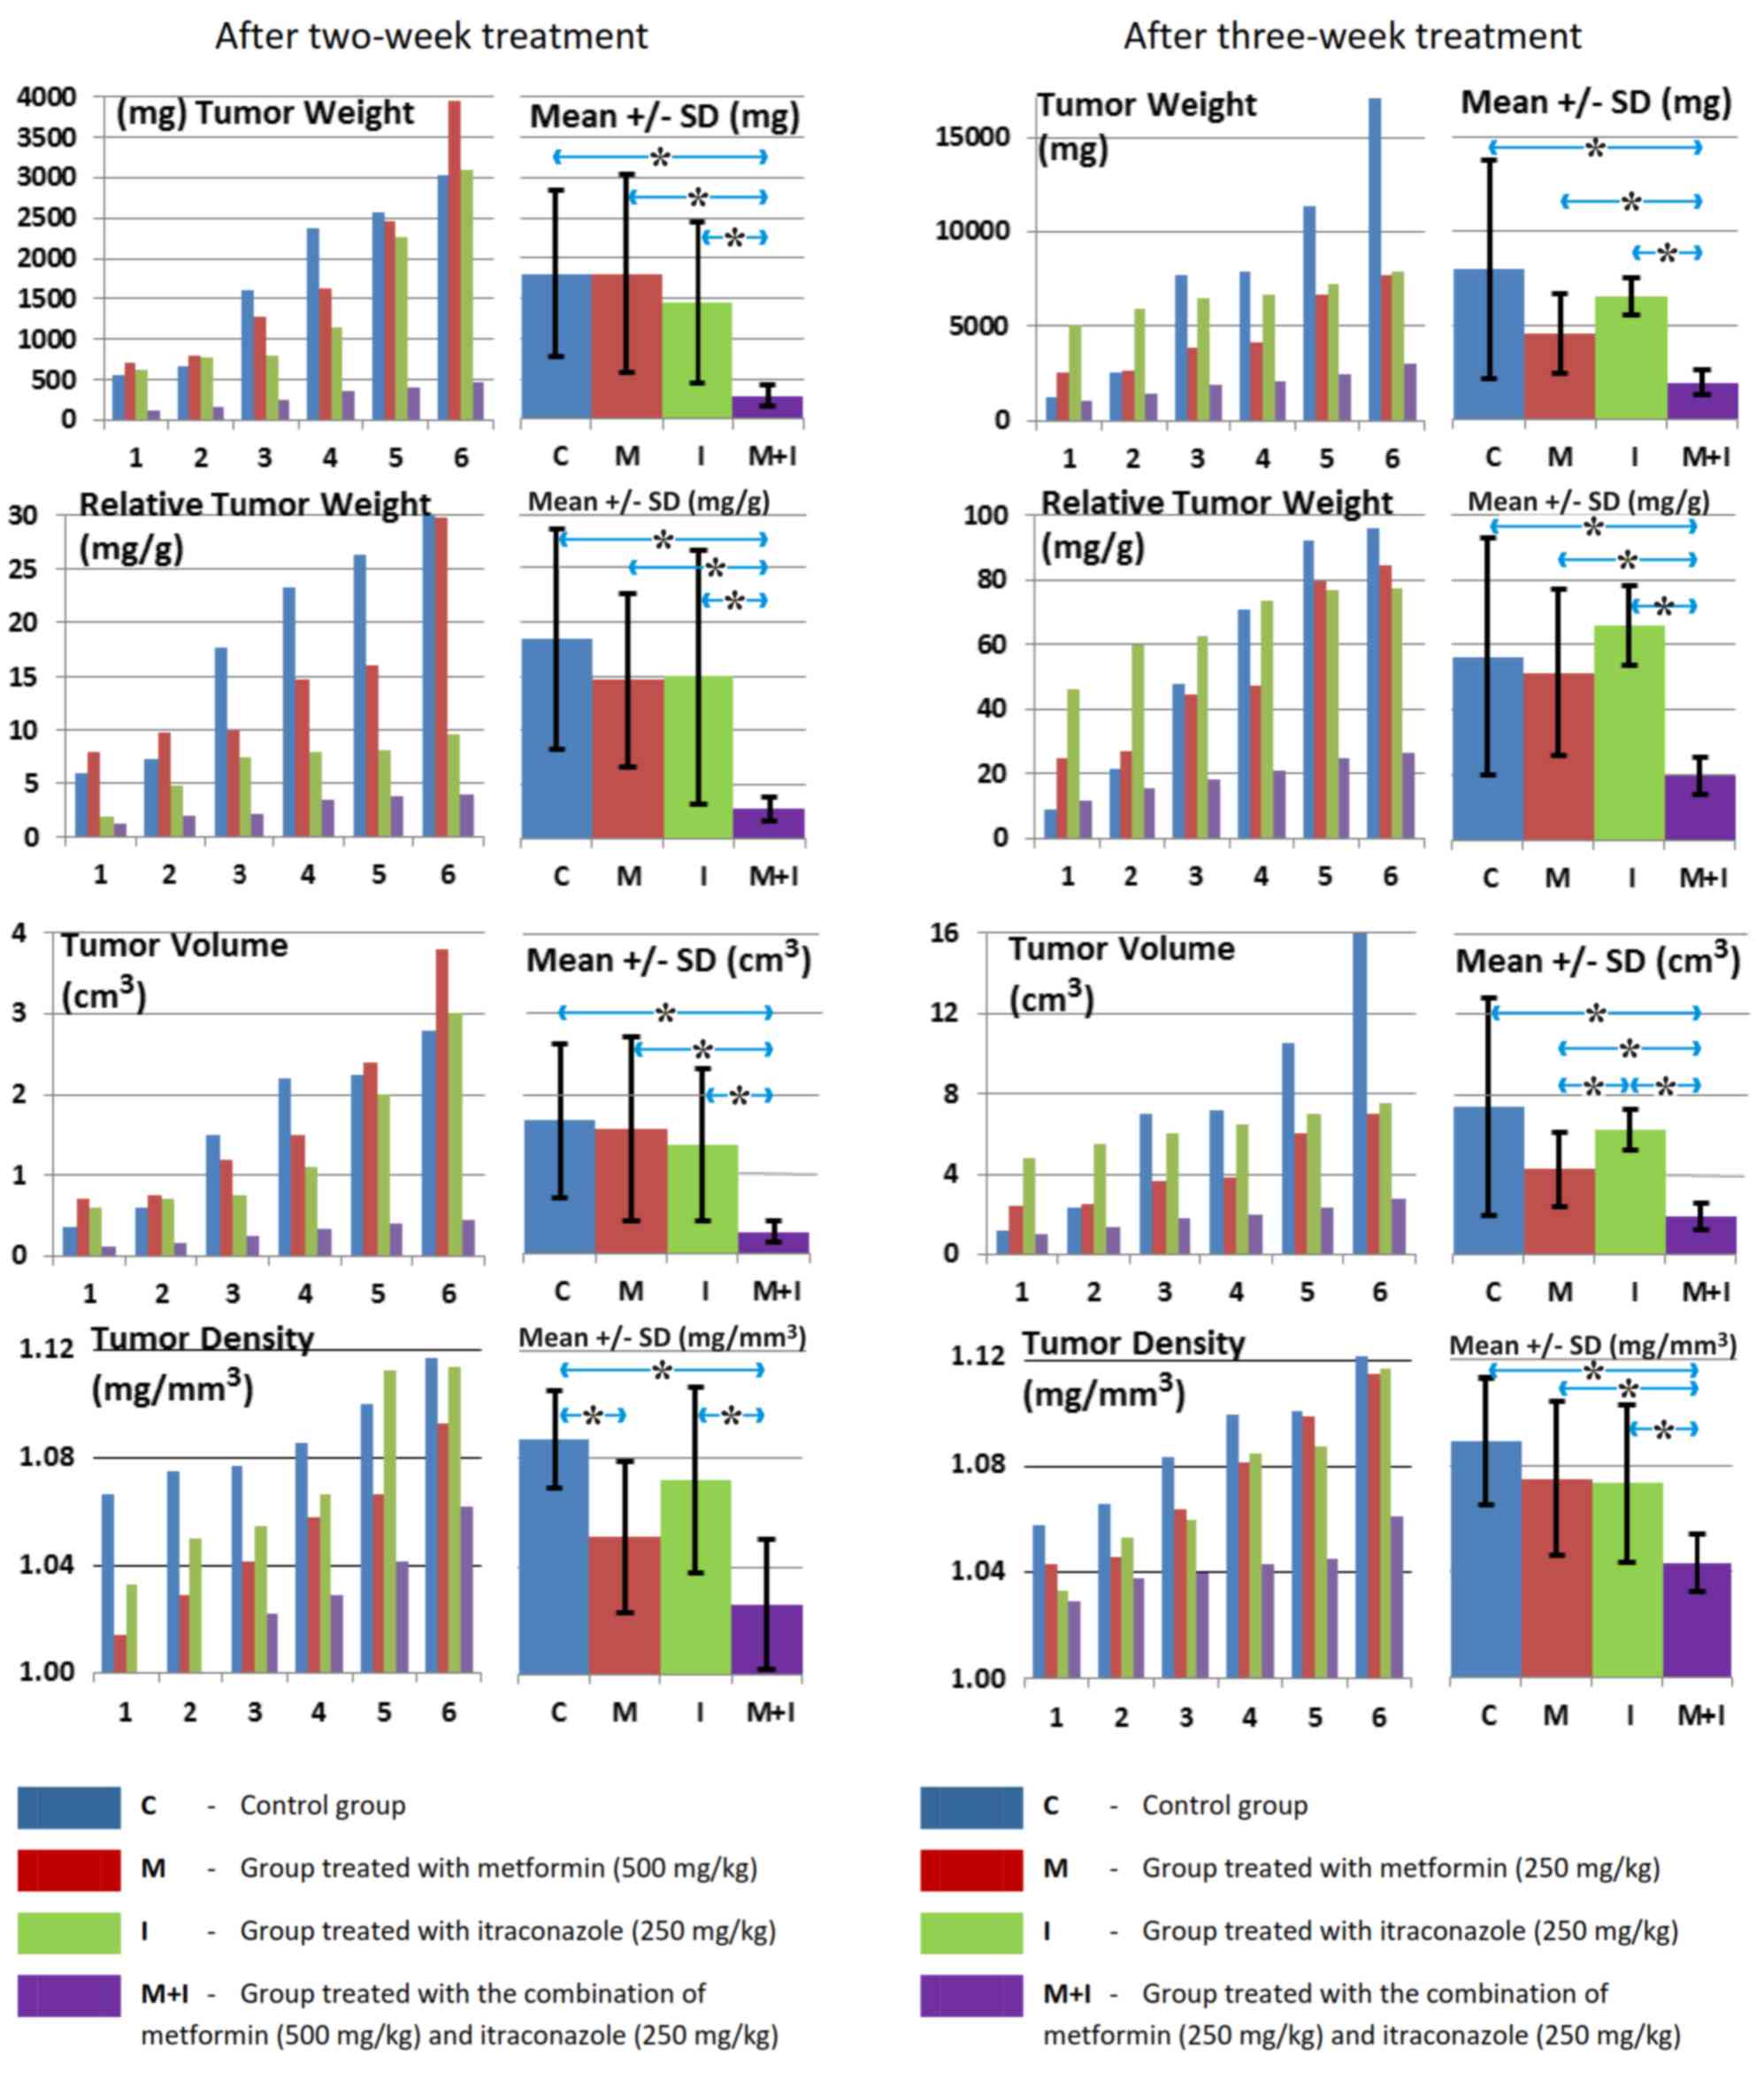
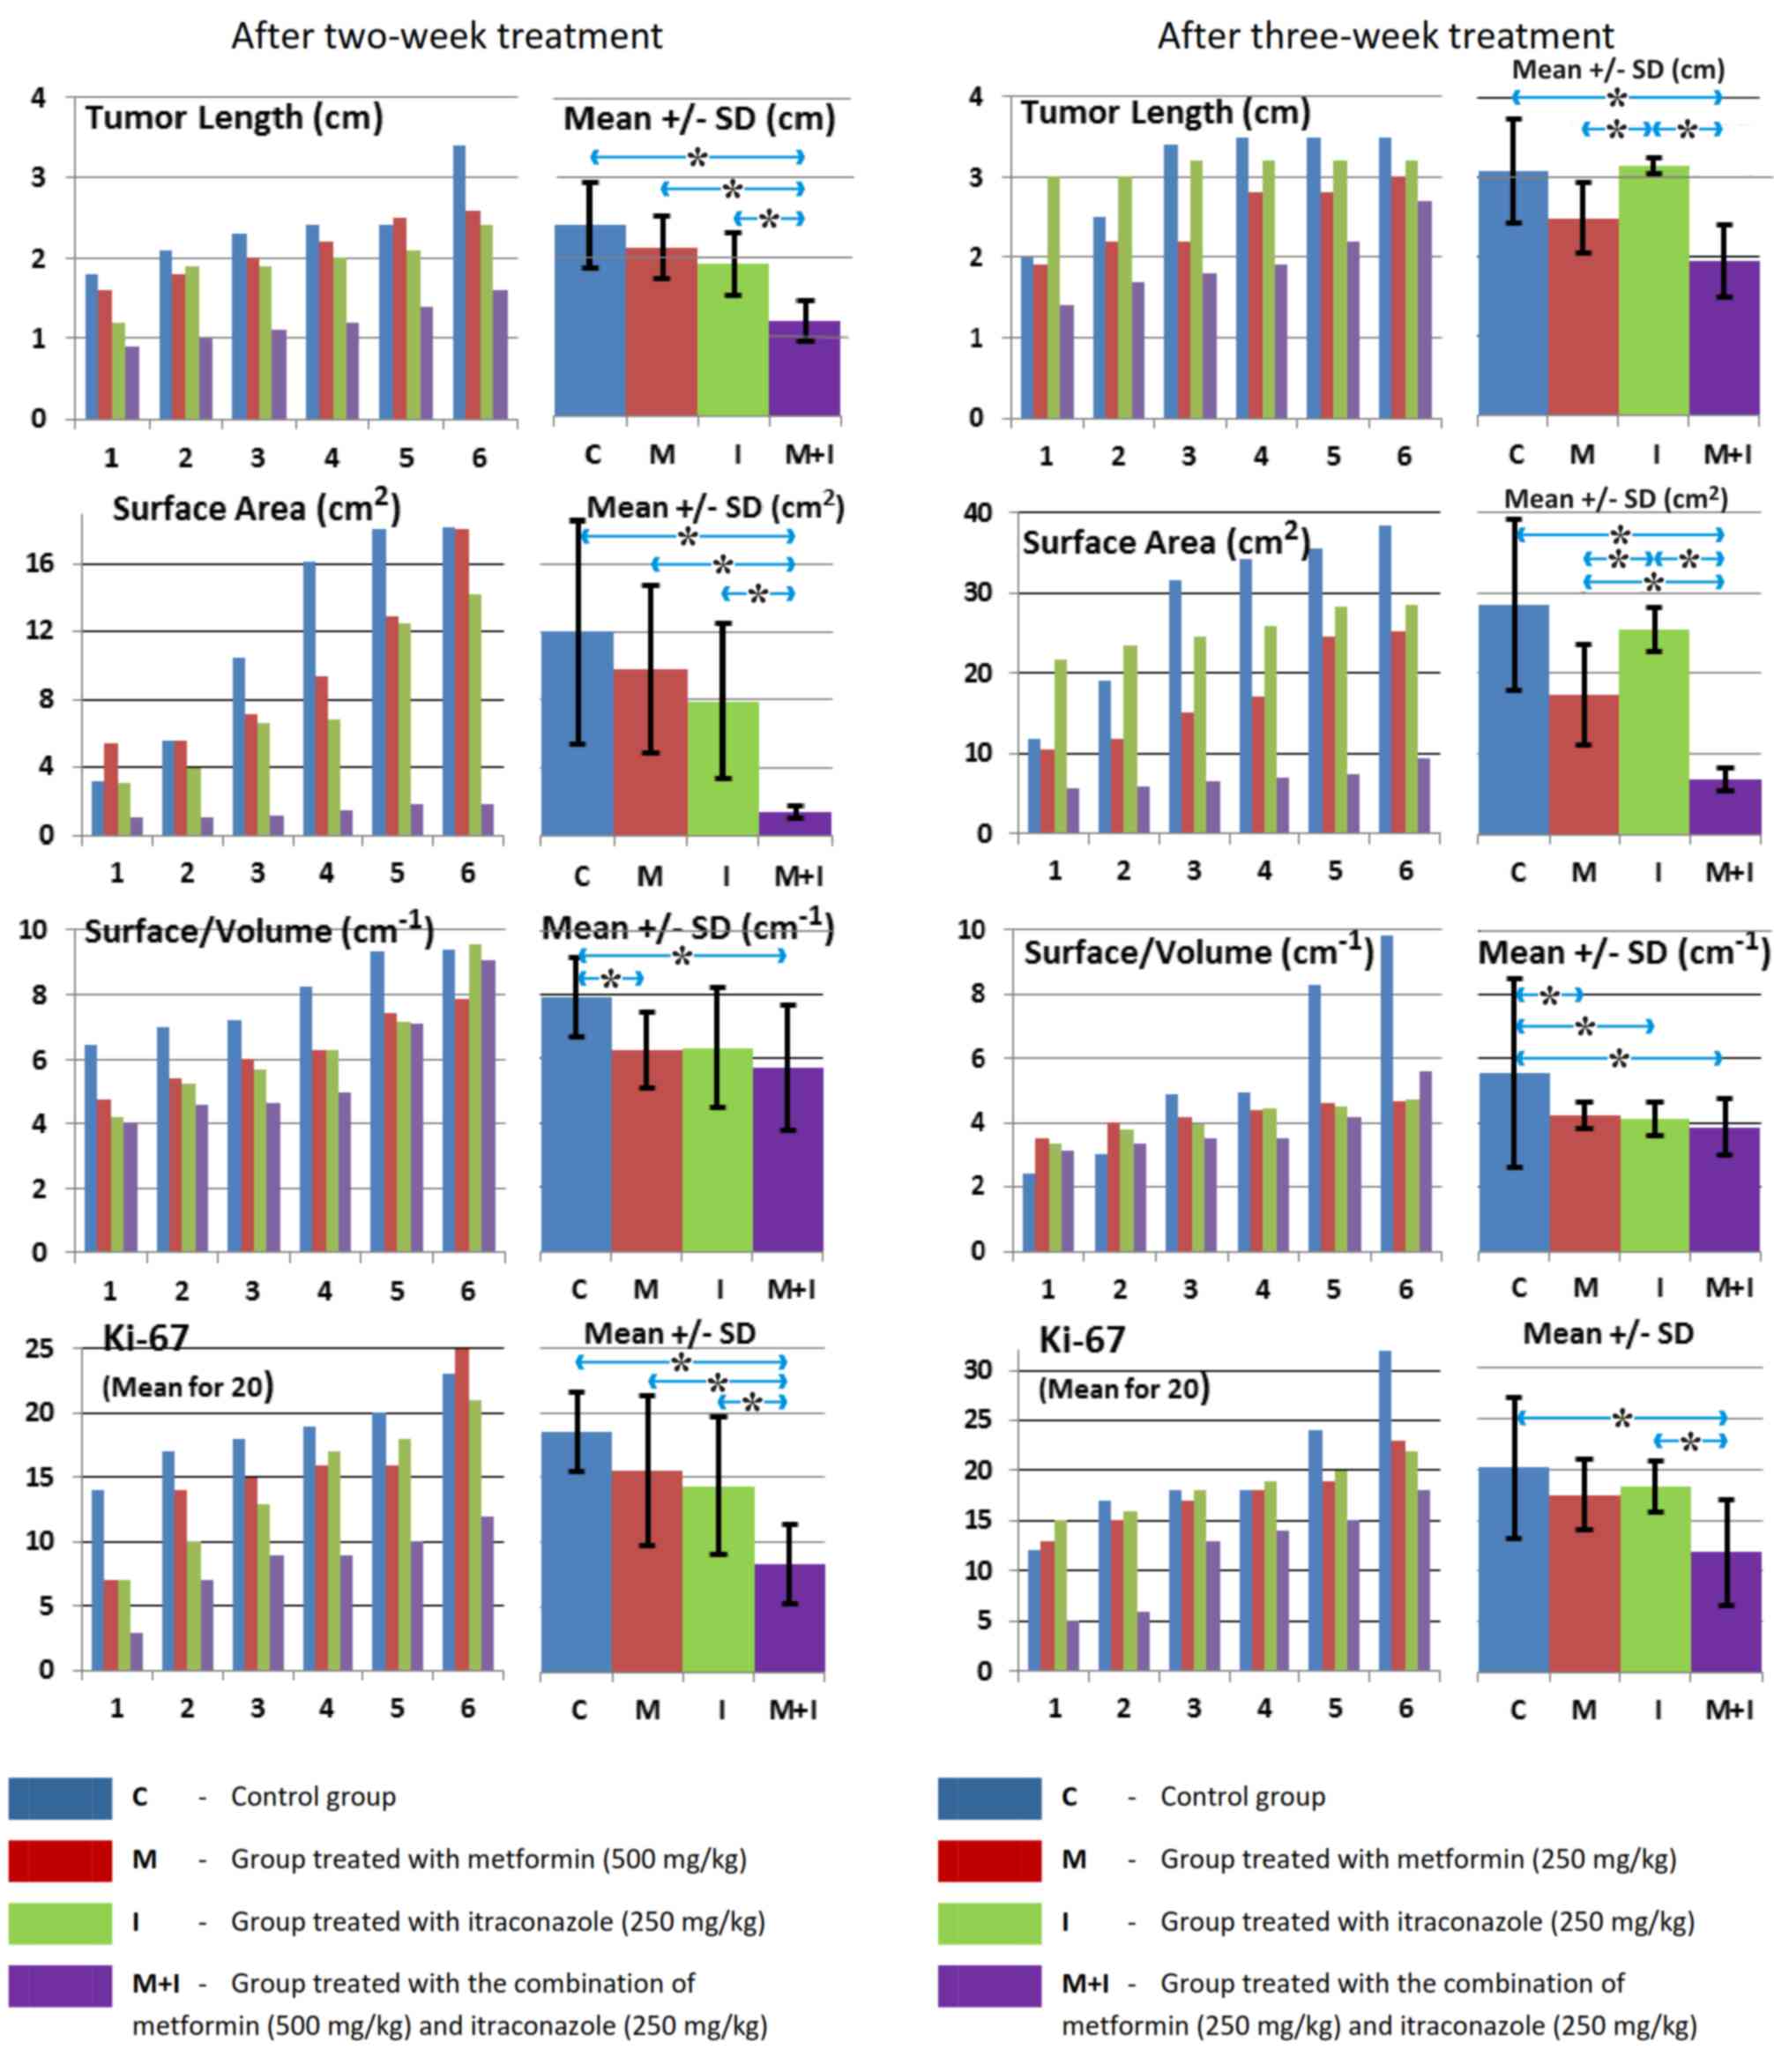
co-treatment with metformin and itraconazole significantly
inhibited tumor growth at 2 and 3 weeks, as indicated by
significant decreases in tumor weight, relative weight, volume,
density, length, surface area and S/V ratio, as well as by the
decreased proliferation status of tumor cells, as demonstrated by
Ki-67 staining of the hamster tumor sections at 2 and 3 weeks
(Tables II and III; Figs.
1, 2, 3 and 4).
Notably, following a 3-day pre-treatment, only the combination of
metformin and itraconazole resulted in a statistically significant
antitumor effect compared with control (Tables II and III).
| Table II.Statistical evaluation of tumor
characteristics following 2-week treatment. |
Table II.
Statistical evaluation of tumor
characteristics following 2-week treatment.
|
| Tumor
(P-values) |
|---|
|
|
|
|---|
| Group
comparison | Weight | Relative
weight | Volume | Density | Length | Surface area | Surface/volume | Mean Ki-67 |
|---|
| C/M | 0.999 | 0.850 | 0.936 | 0.025a | 0.311 | 0.592 | 0.0499a | 0.250 |
| C/I | 0.610 | 0.862 | 0.600 | 0.450 | 0.170 | 0.251 | 0.110 | 0.170 |
| M/I | 0.615 | 0.950 | 0.803 | 0.410 | 0.472 | 0.590 | 0.999 | 0.850 |
| C/M+I | 0.009a | 0.01a | 0.0095a | 0.009a | 0.006a | 0.0085a | 0.049a | 0.0065a |
| M/M+I | 0.019a | 0.0088a | 0.021a | 0.150 | 0.005a | 0.0078a | 0.601 | 0.031a |
| I/M+I | 0.029a | 0.037a | 0.0205a | 0.022a | 0.0085a | 0.0095a | 0.650 | 0.042a |
| Table III.Statistical evaluation of tumor
characteristics following 3-week treatment. |
Table III.
Statistical evaluation of tumor
characteristics following 3-week treatment.
|
| Tumor
(P-values) |
|---|
|
|
|
|---|
| Group
comparison | Weight | Relative
weight | Volume | Density | Length | Surface area | Surface/volume | Mean Ki-67 |
|---|
| C/M | 0.201 | 0.833 | 0.120 | 0.480 | 0.133 | 0.351 | 0.049a | 0.479 |
| C/I | 0.610 | 0.888 | 0.551 | 0.401 | 0.655 | 0.656 | 0.048a | 0.535 |
| M/I | 0.051 | 0.213 | 0.049a | 0.900 | 0.0095a | 0.019a | 0.713 | 0.803 |
| C/M+I | 0.035a | 0.049a | 0.036a | 0.005a | 0.045a | 0.047a | 0.046a | 0.044a |
| M/M+I | 0.018a | 0.015a | 0.015a | 0.035a | 0.062 | 0.008a | 0.452 | 0.053 |
| I/M+I | 0.002a | 0.002a | 0.003a | 0.045a | 0.007a | 0.0001a | 0.552 | 0.021a |
The pathohistological and immunohistochemical
evaluation revealed a decrease in tissue penetration, an expansion
of necrosis and hemorrhagic areas, inhibition of tumor growth and
vasculature in all analyzed slices of tumors from animals treated
with the combination of metformin and itraconazole compared with
the control group (Figs. 5 and
6). The combined metformin and
itraconazole therapy exhibited tumor cytotoxicity between the early
and late tumor treatment stages (days 14–21 post tumor inoculation;
Tables II and III; Figs.
3, 4 and 6).
The treatments had no significant effect on the body
weight of the hamsters during the course of the study (Table I).
Treatment with metformin alone resulted in a
nonsignificant (P>0.05) decrease in the fasting blood glucose
levels in the hamsters (Tables IV
and V). Additionally, the
experimental and control groups were statistically compared for red
and white blood cell counts, platelet number, hemoglobin levels,
hematocrit levels, serum proteins and sedimentation, but no
significant differences were observed among the groups (P>0.05).
In addition, examination of the vital organs revealed no
pathological or toxicological differences between the experimental
and control groups.
| Table IV.Blood analysis following 2-week
treatment. |
Table IV.
Blood analysis following 2-week
treatment.
| A, Control
group |
|---|
|
|---|
| Hamster no. | Leucocytes
(109/l) | Lymphocytes
(%) | Monocytes (%) | Granulocytes
(%) | Erythrocytes
(1012/l) | Hemoglobin
(g/l) | Hematocrit (%) | MCV | MCH | MCHC (g/l) | Platelets
(109/l) | Sedimentation | Glucose (mM/l) | Serum proteins
(g/l) | Albumins (g/l) |
|---|
| 1 | 9.60 | 86.1 | 1.8 | 12.0 | 4.68 | 112 | 34.63 | 74 | 23.9 | 323 | 512 | 1/2 | 5.1 | 57.79 | 27.49 |
| 2 | 27.41 | 44.0 | 0.8 | 55.2 | 5.29 | 136 | 35.36 | 67 | 25.8 | 386 | 201 | 1/2 | 4.2 | 52.80 | 43.00 |
| 3 | 18.14 | 53.6 | 8.0 | 45.6 | 6.14 | 134 | 37.01 | 60 | 21.6 | 361 | 265 | 1/2 | 4.8 | 54.72 | 33.84 |
| 4 | 13.38 | 82.3 | 4.4 | 13.3 | 5.47 | 114 | 34.74 | 64 | 20.9 | 329 | 413 | 1/2 | 4.5 | 50.68 | 29.32 |
| 5 | 18.69 | 73.6 | 6.3 | 20.1 | 4.30 | 92 | 27.66 | 64 | 21.4 | 332 | 564 | 1/2 | 3.3 | 89.80 | 41.70 |
| 6 | 29.14 | 78.5 | 7.2 | 14.3 | 4.98 | 114 | 32.08 | 64 | 23.0 | 356 | 484 | 1/2 | 3.9 | 53.10 | 45.30 |
| Mean | 19.39 | 69.68 | 4.75 | 26.75 | 5.14 | 117.00 | 33.58 | 65.50 | 22.77 | 347.83 | 406.50 | – | 4.30 | 59.82 | 36.78 |
| ± SD | 7.66 | 16.97 | 2.95 | 18.77 | 0.64 | 16.24 | 3.31 | 4.72 | 1.86 | 24.16 | 144.39 | – | 0.65 | 14.88 | 7.56 |
|
| B, Group treated
with metformin (500 mg/kg) |
|
| Hamster
no. | Leucocytes
(109/l) | Lymphocytes
(%) | Monocytes
(%) | Granulocytes
(%) | Erythrocytes
(1012/l) | Hemoglobin
(g/l) | Hematocrit
(%) | MCV | MCH | MCHC
(g/l) | Platelets
(109/l) |
Sedimentation | Glucose
(mM/l) | Serum proteins
(g/l) | Albumins
(g/l) |
|
| 1 | 11.49 | 43.8 | 3.6 | 52.6 | 5.52 | 124 | 36.82 | 67 | 22.4 | 336 | 538 | 1/2 | 3.7 | 58.94 | 32.62 |
| 2 | 16.06 | 73.4 | 13.7 | 12.7 | 6.20 | 126 | 38.38 | 62 | 20.4 | 329 | 228 | 1/2 | 4.1 | 52.60 | 41.40 |
| 3 | 31.09 | 41.7 | 5.1 | 53.1 | 6.37 | 145 | 37.76 | 59 | 22.5 | 379 | 330 | 1/2 | 4.6 | 52.41 | 44.10 |
| 4 | 16.34 | 90.0 | 0.7 | 9.3 | 7.49 | 151 | 43.72 | 58 | 20.2 | 346 | 146 | 1/2 | 3.9 | 43.50 | 21.90 |
| 5 | 6.75 | 81.2 | 0.8 | 17.9 | 4.81 | 113 | 34.34 | 71 | 23.5 | 329 | 312 | 1/2 | 3.3 | 58.56 | 33.35 |
| 6 | 17.29 | 77.8 | 3.3 | 19.0 | 6.27 | 130 | 40.24 | 64 | 20.7 | 322 | 544 | 1/2 | 4.1 | 58.94 | 36.77 |
| Mean | 16.50 | 67.98 | 4.53 | 27.43 | 6.11 | 131.50 | 38.54 | 63.50 | 21.62 | 340.17 | 349.67 | – | 3.95 | 54.16 | 35.02 |
| ± SD | 8.17 | 20.30 | 4.80 | 20.00 | 0.90 | 14.10 | 3.19 | 4.93 | 1.36 | 20.68 | 162.06 | – | 0.44 | 6.07 | 7.83 |
|
| C, Group treated
with itraconazole (250 mg/kg) |
|
| Hamster
no. | Leucocytes
(109/l) | Lymphocytes
(%) | Monocytes
(%) | Granulocytes
(%) | Erythrocytes
(1012/l) | Hemoglobin
(g/l) | Hematocrit
(%) | MCV | MCH | MCHC
(g/l) | Platelets
(109/l) |
Sedimentation | Glucose
(mM/l) | Serum proteins
(g/l) | Albumins
(g/l) |
|
| 1 | 15.94 | 77.5 | 0.8 | 21.7 | 4.87 | 117 | 32.64 | 67 | 23.9 | 357 | 679 | 1/2 | 3.5 | 55.48 | 29.93 |
| 2 | 15.23 | 78.5 | 0.7 | 20.8 | 5.69 | 126 | 36.74 | 65 | 22.2 | 343 | 295 | 1/2 | 3.7 | 57.34 | 25.12 |
| 3 | 5.96 | 84.7 | 5.2 | 10.1 | 5.09 | 114 | 34.01 | 67 | 22.5 | 336 | 434 | 1/2 | 3.2 | 43.10 | 20.10 |
| 4 | 36.38 | 35.0 | 11.7 | 53.3 | 4.83 | 123 | 34.79 | 72 | 25.5 | 354 | 265 | 1/2 | 5.2 | 57.21 | 36.04 |
| 5 | 12.10 | 84.1 | 5.8 | 10.2 | 5.68 | 124 | 37.40 | 66 | 21.9 | 332 | 464 | 1/2 | 3.1 | 61.63 | 40.70 |
| 6 | 17.32 | 78.7 | 5.2 | 16.1 | 4.45 | 101 | 29.82 | 67 | 22.7 | 340 | 479 | 1/2 | 9.9 | 53.56 | 42.27 |
| Mean | 17.16 | 73.08 | 4.90 | 22.03 | 5.10 | 117.50 | 34.23 | 67.33 | 23.12 | 343.67 | 436.00 | – | 4.77 | 54.72 | 32.36 |
| ± SD | 10.25 | 18.91 | 4.04 | 16.11 | 0.50 | 9.27 | 2.78 | 2.42 | 1.35 | 9.93 | 148.87 | – | 2.63 | 6.29 | 8.83 |
|
| D, Group
co-treated with metformin (500 mg/kg) and itraconazole (250
mg/kg) |
|
| Hamster
no. | Leucocytes
(109/l) | Lymphocytes
(%) | Monocytes
(%) | Granulocytes
(%) | Erythrocytes
(1012/l) | Hemoglobin
(g/l) | Hematocrit
(%) | MCV | MCH | MCHC
(g/l) | Platelets
(109/l) |
Sedimentation | Glucose
(mM/l) | Serum proteins
(g/l) | Albumins
(g/l) |
|
| 1 | 14.16 | 58.8 | 0.7 | 40.5 | 3.39 | 85 | 24.51 | 72 | 25.0 | 345 | 406 | 1/2 | 3.5 | 59.90 | 26.60 |
| 2 | 29.18 | 86.8 | 3.8 | 9.4 | 5.48 | 118 | 38.21 | 70 | 21.5 | 308 | 542 | 1/2 | 3.3 | 61.63 | 40.70 |
| 3 | 20.66 | 34.5 | 13.9 | 51.6 | 6.13 | 129 | 35.94 | 59 | 21.1 | 360 | 421 | 1/2 | 3.9 | 58.10 | 43.20 |
| 4 | 10.82 | 88.6 | 1.7 | 9.7 | 5.99 | 141 | 39.17 | 65 | 23.6 | 361 | 416 | 1/2 | 4.1 | 48.80 | 24.20 |
| 5 | 16.49 | 65.7 | 8.0 | 26.3 | 5.95 | 132 | 38.44 | 65 | 22.2 | 344 | 475 | 1/2 | 3.1 | 57.98 | 40.19 |
| 6 | 9.82 | 73.5 | 6.5 | 21.0 | 4.78 | 109 | 32.96 | 69 | 23.9 | 332 | 551 | 1/2 | 3.2 | 58.97 | 37.99 |
| Mean | 16.86 | 67.98 | 5.77 | 26.42 | 5.29 | 119.00 | 34.87 | 66.67 | 22.88 | 341.67 | 468.50 | – | 3.52 | 57.56 | 35.48 |
| ± SD | 7.21 | 20.10 | 4.85 | 16.92 | 1.05 | 20.05 | 5.56 | 4.68 | 1.52 | 19.77 | 65.07 | – | 0.40 | 4.50 | 8.02 |
| Table V.Blood analysis following three-week
treatment. |
Table V.
Blood analysis following three-week
treatment.
| A, Control
group |
|---|
|
|---|
| Hamster no. | Leucocytes
(109/l) | Lymphocytes
(%) | Monocytes (%) | Granulocytes
(%) | Erythrocytes
(1012/l) | Hemoglobin
(g/l) | Hematocrit (%) | MCV | MCH | MCHC (g/l) | Platelets
(109/l) | Sedimentation | Glucose (mM/l) | Serum proteins
(g/l) | Albumins (g/l) |
|---|
| 1 | 23.25 | 62.2 | 12.5 | 25.3 | 4.03 | 111 | 28.41 | 64 | 24.1 | 375 | 519 | 1/2 | 2.9 | 52.03 | 35.18 |
| 2 | 20.20 | 60.2 | 8.1 | 31.7 | 5.72 | 118 | 36.26 | 72 | 25.2 | 350 | 490 | 1/2 | 4.9 | 55.10 | 40.12 |
| 3 | 16.61 | 81.7 | 1.8 | 16.5 | 3.47 | 90 | 23.46 | 68 | 25.8 | 383 | 192 | 1/2 | 2.6 | 50.60 | 34.40 |
| 4 | 11.77 | 80.2 | 3.6 | 16.2 | 5.71 | 12.6 | 36.79 | 64 | 22.1 | 343 | 428 | 1/2 | 2.5 | 57.20 | 37.00 |
| 5 | 10.44 | 78.6 | 4.6 | 16.8 | 6.95 | 149 | 44.06 | 63 | 21.5 | 339 | 448 | 1/2 | 7.9 | 61.24 | 35.55 |
| 6 | 13.78 | 66.6 | 4.0 | 29.4 | 5.67 | 129 | 37.98 | 67 | 22.8 | 340 | 445 | 1/2 | 6.7 | 55.68 | 29.56 |
| Mean | 16.01 | 71.58 | 5.77 | 22.65 | 5.26 | 101.60 | 34.49 | 66.33 | 23.27 | 355.00 | 420.33 | – | 4.58 | 55.31 | 35.30 |
| ± SD | 4.99 | 9.68 | 3.89 | 7.04 | 1.28 | 47.77 | 7.36 | 3.39 | 1.54 | 19.15 | 116.75 | – | 2.31 | 3.79 | 3.46 |
|
| B, Group treated
with metformin (250 mg/kg) |
|
| Hamster
no. | Leucocytes
(109/l) | Lymphocytes
(%) | Monocytes
(%) | Granulocytes
(%) | Erythrocytes
(1012/l) | Hemoglobin
(g/l) | Hematocrit
(%) | MCV | MCH | MCHC
(g/l) | Platelets
(109/l) |
Sedimentation | Glucose
(mM/l) | Serum proteins
(g/l) | Albumins
(g/l) |
|
| 1 | 14.89 | 76.5 | 6.2 | 15.9 | 5.80 | 136 | 35.67 | 61 | 23.4 | 381 | 484 | 1/2 | 4.5 | 59.50 | 44.00 |
| 2 | 25.13 | 71.31 | 6.9 | 21.9 | 3.94 | 95 | 27.21 | 69 | 24.1 | 349 | 445 | 1/2 | 4.5 | 48.30 | 31.40 |
| 3 | 18.33 | 54.5 | 0.2 | 15.3 | 6.73 | 145 | 42.81 | 64 | 21.5 | 339 | 400 | 1/2 | 5.1 | 53.95 | 29.93 |
| 4 | 9.93 | 62.3 | 7.1 | 30.6 | 7.22 | 145 | 45.13 | 63 | 20.0 | 320 | 544 | 1/2 | 6.7 | 41.60 | 31.78 |
| 5 | 10.19 | 83.1 | 0.3 | 16.7 | 7.00 | 152 | 48.83 | 63 | 21.7 | 347 | 418 | 1/2 | 3.4 | 42.40 | 25.30 |
| 6 | 14.30 | 80.4 | 2.7 | 16.9 | 6.72 | 146 | 43.09 | 64 | 21.9 | 339 | 357 | 1/2 | 3.1 | 44.90 | 23.40 |
| Mean | 15.46 | 71.35 | 3.90 | 19.55 | 6.24 | 136.50 | 40.46 | 64.00 | 22.10 | 345.83 | 441.33 | – | 4.55 | 48.44 | 30.97 |
| ± SD | 5.69 | 11.07 | 3.24 | 5.90 | 1.22 | 20.96 | 7.78 | 2.68 | 1.46 | 20.04 | 65.94 | – | 1.29 | 7.05 | 7.23 |
|
| C, Group treated
with itraconazole (250 mg/kg) |
|
| Hamster
no. | Leucocytes
(109/l) | Lymphocytes
(%) | Monocytes
(%) | Granulocytes
(%) | Erythrocytes
(1012/l) | Hemoglobin
(g/l) | Hematocrit
(%) | MCV | MCH | MCHC
(g/l) | Platelets
(109/l) |
Sedimentation | Glucose
(mM/l) | Serum proteins
(g/l) | Albumins
(g/l) |
|
| 1 | 10.24 | 85.8 | 2.0 | 12.2 | 6.65 | 148 | 44.04 | 66 | 22.3 | 336 | 365 | 1/2 | 3.7 | 46.70 | 22.90 |
| 2 | 29.03 | 72.4 | 3.7 | 21.9 | 4.63 | 105 | 38.33 | 65 | 22.7 | 346 | 417 | 1/2 | 3.2 | 49.30 | 37.20 |
| 3 | 18.87 | 81.2 | 4.6 | 14.1 | 6.29 | 134 | 39.98 | 64 | 21.3 | 335 | 220 | 1/2 | 5.6 | 40.00 | 20.00 |
| 4 | 16.27 | 83.9 | 1.3 | 14.9 | 6.74 | 143 | 42.73 | 63 | 21.4 | 336 | 347 | 1/2 | 7.3 | 45.60 | 22.60 |
| 5 | 15.77 | 82.6 | 2.0 | 16.4 | 6.75 | 141 | 40.55 | 61 | 20.9 | 348 | 436 | 1/2 | 5.1 | 57.40 | 27.00 |
| 6 | 7.64 | 84.2 | 0.8 | 15.0 | 6.89 | 143 | 41.44 | 60. | 20.7 | 344 | 332 | 1/2 | 6.1 | 49.90 | 24.80 |
| Mean | 16.30 | 81.68 | 2.40 | 15.75 | 6.33 | 135.67 | 41.18 | 63.17 | 21.55 | 340.83 | 352.83 | – | 5.17 | 48.15 | 25.75 |
| ± SD | 7.49 | 4.81 | 1.46 | 3.31 | 0.85 | 15.69 | 2.03 | 2.32 | 0.79 | 5.81 | 76.54 | – | 1.53 | 5.74 | 6.08 |
|
| D, Group
co-treated with metformin (250 mg/kg) and itraconazole (250
mg/kg) |
|
| Hamster
no. | Leucocytes
(109/l) | Lymphocytes
(%) | Monocytes
(%) | Granulocytes
(%) | Erythrocytes
(1012/l) | Hemoglobin
(g/l) | Hematocrit
(%) | MCV | MCH | MCHC
(g/l) | Platelets
(109/l) |
Sedimentation | Glucose
(mM/l) | Serum proteins
(g/l) | Albumins
(g/l) |
| 1 | 6.78 | 86.1 | 5.4 | 8.5 | 5.91 | 132 | 37.69 | 64 | 22.4 | 351 | 37.7 | 1/2 | 4.1 | 52.39 | 22.79 |
| 2 | 5.83 | 84.4 | 0.8 | 14.8 | 7.56 | 150 | 43.01 | 57 | 19.9 | 349 | 266 | 1/2 | 5.4 | 51.68 | 25.15 |
| 3 | 27.97 | 78.6 | 2.1 | 19.3 | 5.17 | 119 | 34.78 | 67 | 23.0 | 341 | 189 | 1/2 | 7.2 | 44.70 | 19.20 |
| 4 | 18.50 | 65.6 | 5.7 | 28.7 | 6.19 | 135 | 38.43 | 62 | 21.9 | 352 | 557 | 1/2 | 3.4 | 45.70 | 27.10 |
| 5 | 18.97 | 77.0 | 4.1 | 18.9 | 6.11 | 129 | 38.92 | 63 | 20.9 | 332 | 485 | 1/2 | 4.6 | 45.60 | 23.60 |
| 6 | 32.62 | 81.8 | 2.5 | 15.7 | 5.70 | 126 | 36.46 | 64 | 22.1 | 345 | 271 | 1/2 | 6.0 | 43.00 | 35.80 |
| Mean | 18.45 | 78.92 | 3.43 | 17.65 | 6.11 | 131.83 | 38.22 | 62.83 | 21.70 | 345.00 | 300.95 |
| 5.12 | 47.18 | 25.61 |
| ± SD | 10.84 | 7.36 | 1.95 | 6.66 | 0.80 | 10.46 | 2.78 | 3.31 | 1.12 | 7.56 | 191.51 |
| 1.37 | 3.89 | 5.65 |
Co-treatment with metformin and
itraconazole has antiproliferative effects in cancer cell
lines
The antiproliferative effects in fibrosarcoma,
carcinoma and normal cell lines, expressed as IC50, for
all treatments are presented in Table
VI. Co-treatment with metformin and itraconazole exhibited
selective cytotoxicity against the malignant cell lines (HeLa,
HT-29, A549 and BHK-21/C13). The combination demonstrated favorable
antiproliferative effects in the normal fetal lung MRC-5 cells,
suggesting that this treatment may be safe and efficient.
| Table VI.Experimentally obtained half maximal
inhibitory concentration values of analyzed drugs on various cell
lines after 48 h exposure. |
Table VI.
Experimentally obtained half maximal
inhibitory concentration values of analyzed drugs on various cell
lines after 48 h exposure.
| Drug | Normal fetal lung
MRC-5 | Cervix carcinoma
HeLa | Colon carcinoma
HT-29 | Lung carcinoma
A549 | Hamster
fibrosarcoma BHK-21/C13 |
|---|
| Metformin (mM) | 37 | 0.42 | 0.56 | 2.2 | 5.8 |
| Itraconazole
(mM) | 50 | 0.70 | 2.70 | 4.7 | 11.0 |
| Metformin +
itraconazole (1:1; mM each) | 33 | 0.29 | 0.42 | 1.5 | 3.5 |
Discussion
A number of common or separate anticancer mechanisms
of metformin (3) and itraconazole
(11) have been identified. Among
the potential anticancer targets of these drugs, AMPK/mTOR
inhibition, anti-angiogenesis, and folate and autophagy inhibition
are notable common functions. The chemosensitization properties of
itraconazole (34) are also
important, since they enhance the therapeutic efficacy of
anticancer drugs through the inhibition of P-gp.
The combination of metformin and itraconazole in the
present study resulted in reductions in fibrosarcoma tumor weight,
relative weight, volume, density, length, surface area, S/V ratio,
proliferation, vasculature and tissue penetration. These effects,
as well as increased tumor necrosis and hemorrhage observed in the
immunohistochemical and histological evaluation, may be due to the
cytotoxicity of the treatment, which may alter the expression of
proteins that regulate the proliferation and apoptosis of tumor
cells, and vascular growth (35).
The radiologically determined (4-dimension computed tomography)
density of non-small cell lung cancer tumors has been reported to
vary between 0.236 and 1.010 g/cm3 (36). Denser tumors are more likely to have
poorer outcomes and result in shorter disease-free survival times
(36). The Ki-67 protein is a
cellular marker for proliferation, present during all active phases
of the cell cycle (G1, S, G2 and M), and
absent in the resting phase. The Ki-67 antigen can be exclusively
detected within the cell nucleus. GLUT1 facilitates the transport
of glucose across membranes and is overexpressed in cancer
(3). Increased glycolysis, with
increased expression of GLUT1, is associated with poor cancer
prognosis. Increased iNOS immunostaining in the cytoplasm denotes
tumor progression by increasing proliferation and angiogenesis
(11), which is associated with poor
outcome in various types of cancer. CD34 is a marker of endothelial
cells and vascular differentiation (11). COX4 is a mitochondrial cytochrome
c oxidase marker overexpressed in cancer cells (14).
In a previous study, the metformin levels in the
colorectal cancer cells of xenograft-bearing mice that were
successfully treated orally and intraperitoneally corresponded to
the plasma concentrations (37).
This indicates a consistent delivery of the drug to the tumor
tissue. In the present study, the same orders of magnitude of oral
metformin doses were administered to the hamsters, compared with
the doses administered in a previous study (37). For the 2-week treatment, metformin
and itraconazole doses of ~30% of the median lethal dose
(LD50) for this species were selected; as metformin
LD50 is 1,450, 500 mg/kg was used. The daily dose of 500
mg/kg metformin in hamsters is equivalent to the maximum daily dose
of 40 mg/kg in patients with diabetes normalized to body surface
(38). The dosage of 500 mg/kg/day
metformin used in 2-week treatment was twice higher compared with
the equivalent of the 20 mg/kg/day typically administered to
patients with diabetes. Therefore, a lower dose of metformin (250
mg/kg) was selected for the 3-week treatment to prevent possible
toxicity induced by prolonged application of the maximal dose.
During the 2- and 3-week treatments, tumor diameters
reached ~2.5 and 3.5 cm in the untreated control groups,
respectively. Since the metformin doses in the 2- and 3-week
treatment groups were different, the effects of the treatments were
evaluated separately for each treatment period. The 3-week
treatment results confirmed and validated the results of the 2-week
treatment, which demonstrated the significant anticancer effects of
the co-treatment on hamster fibrosarcoma.
Itraconazole treatment has been reported to suppress
the growth of medulloblastoma and basal cell carcinoma in a mouse
allograft model at serum concentrations comparable to those in
patients undergoing antifungal therapy (39). The itraconazole levels achieved in
the tumors were similar to those in serum, indicating that
itraconazole exhibits good tumor tissue penetration (39). The human daily dose of 20 mg/kg
itraconazole is equivalent to a daily dose of 250 mg/kg in hamsters
normalized to body surface (38). In
previous studies, the anti-angiogenic effect of itraconazole was
reported to function synergistically in combination with the
effects of classical toxic chemotherapeutic drugs, such as
paclitaxel, in epithelial ovarian (40) and non-small cell lung carcinoma
(41) xenograft mouse models.
The anticancer properties of the present metformin
and itraconazole co-treatment doses in hamsters, and the
possibility of achieving comparably high nontoxic levels in humans,
suggest that the prospect of effective nontoxic oncological therapy
and prevention of cancer relapse using this drug combination may be
achievable. The present in vitro results from normal and
malignant cell lines (MRC-5, BHK-21/C13, HeLa, HT-29 and A549)
supported the in vivo findings from the hamster fibrosarcoma
tumors. In addition, in other studies, metformin (42) and itraconazole (11) separately inhibit tumor cell migration
and invasion in vitro. Furthermore, metformin alone inhibits
invasion and migration of human fibrosarcoma cells (42). Therefore, metformin may have the
potential to prevent fibrosarcoma metastasis. Itraconazole alone
inhibits the proliferation of cancer-associated fibroblasts,
serving a key role in cell proliferation, invasion and metastasis
in cancer (11). Therefore, the
effects of co-treatment with metformin and itraconazole on the
migration and invasion of fibrosarcoma cells need to be studied
further. Clinical trials are required to elucidate whether the
combination of metformin and itraconazole has the potential to
become an adjuvant or relapse prevention treatment in current
anticancer and particularly antisarcoma therapies.
In conclusion, nontoxic oral doses of metformin
combined with nontoxic doses of itraconazole significantly
inhibited sarcoma growth in hamsters and exhibited anticancer
properties in various cancer cell lines; this combination may be a
candidate for novel safe anticancer adjuvant or relapse prevention
therapy.
Acknowledgements
The authors would like to thank Mrs. Vesna Popović
(Department for Technical and Administrative Services of Provincial
Authorities, Provincial Government, Autonomous Province of
Vojvodina) for her expert technical assistance and suggestions
during the preparation of this study.
Funding
This study was supported by the Republic of Serbia,
Autonomous Province of Vojvodina, Provincial Secretariat for High
Education and Scientific Research [grant no. 142-451-2413/2018
(JP)] and Republic of Serbia, Ministry of Science [grant nos.
171039 (JS) and 172013 (DM)].
Availability of data and materials
The datasets used and/or analyzed during the current
study are available from the corresponding author on reasonable
request.
Authors contributions
KJP made substantial contributions to the conception
and design of the investigation, and performed physical biometrical
analyses of the hamster tumors. DJP was a major contributor in
writing the manuscript and in performing the blood analyses. DM
performed the randomization, tumor inoculation and treatment of
hamsters. DL performed the histological and toxicological analyses.
IČ performed the immunohistochemical analyses. JKP made substantial
contribution to the statistical analysis and interpretation of all
experimental data. All authors read and approved the final version
of the manuscript.
Ethics approval and consent to
participate
The study was approved by the Ethics Committee of
the University of Novi Sad (approval no. 01-78/18-5; dated April
26, 2016).
Patient consent for publication
Not applicable.
Competing interests
The authors declare that they have no competing
interests.
References
|
1
|
Park SY, Kim D and Kee SH:
Metformin-activated AMPK regulates β-catenin to reduce cell
proliferation in colon carcinoma RKO cells. Oncol Lett.
17:2695–2702. 2019.PubMed/NCBI
|
|
2
|
Zi F, Zi H, Li Y, He J, Shi Q and Cai Z:
Metformin and cancer: An existing drug for cancer prevention and
therapy. Oncol Lett. 15:683–690. 2018.PubMed/NCBI
|
|
3
|
Popović DJ, Lalošević D, Miljković D,
Popović KJ, Čapo I and Popović JK: Effect of metformin on
fibrosarcoma in hamsters. Eur Rev Med Pharmacol Sci. 21:5499–5505.
2017.PubMed/NCBI
|
|
4
|
Meng XM, Ma XX, Tian YL, Jiang Q, Wang LL,
Shi R, Ding L and Pang SG: Metformin improves the glucose and lipid
metabolism via influencing the level of serum total bile acids in
rats with streptozotocin-induced type 2 diabetes mellitus. Eur Rev
Med Pharmacol Sci. 21:2232–2237. 2017.PubMed/NCBI
|
|
5
|
Salis O, Bedir A, Ozdemir T, Okuyucu A and
Alacam H: The relationship between anticancer effect of metformin
and the transcriptional regulation of certain genes (CHOP, CAV-1,
HO-1, SGK-1 and Par-4) on MCF-7 cell line. Eur Rev Med Pharmacol
Sci. 18:1602–1609. 2014.PubMed/NCBI
|
|
6
|
Purchiaroni F, Galli G and Annibale B:
Metformin plus proton pump inhibitors therapy: The cobalamin
deficiency challenge. Eur Rev Med Pharmacol Sci. 19:2501–2502.
2015.PubMed/NCBI
|
|
7
|
Yang Y and Wu XH: Study on the influence
of metformin on castration-resistant prostate cancer PC-3 cell line
biological behavior by its inhibition on PLCε gene-mediated
Notch1/Hes and androgen receptor signaling pathway. Eur Rev Med
Pharmacol Sci. 21:1918–1923. 2017.PubMed/NCBI
|
|
8
|
Zhou HY, Zhu H, Yao XM, Qian JP, Yang J,
Pan XD and Chen XD: Metformin regulates tight junction of
intestinal epithelial cells via MLCK-MLC signaling pathway. Eur Rev
Med Pharmacol Sci. 21:5239–5246. 2017.PubMed/NCBI
|
|
9
|
Tan JS and Joseph WS: Common fungal
infections of the feet in patients with diabetes mellitus. Drugs
Aging. 21:101–112. 2004. View Article : Google Scholar : PubMed/NCBI
|
|
10
|
Gupta AK, Gover MD and Lynde CW: Pulse
itraconazole vs. continuous terbinafine for the treatment of
dermatophyte toenail onychomycosis in patients with diabetes
mellitus. J Eur Acad Dermatol Venereol. 20:1188–1193. 2006.
View Article : Google Scholar : PubMed/NCBI
|
|
11
|
Tsubamoto H, Ueda T, Inoue K, Sakata K,
Shibahara H and Sonoda T: Repurposing itraconazole as an anticancer
agent. Oncol Lett. 14:1240–1246. 2017. View Article : Google Scholar : PubMed/NCBI
|
|
12
|
Navarro-Martínez MD, Cabezas-Herrera J and
Rodríguez-López JN: Antifolates as antimycotics? Connection between
the folic acid cycle and the ergosterol biosynthesis pathway in
Candida albicans. Int J Antimicrob Agents. 28:560–567. 2006.
View Article : Google Scholar : PubMed/NCBI
|
|
13
|
Pace JR, DeBerardinis AM, Sail V,
Tacheva-Grigorova SK, Chan KA, Tran R, Raccuia DS, Wechsler-Reya RJ
and Hadden MK: Repurposing the clinically efficacious Anti-fungal
agent itraconazole as an anti-cancer chemotherapeutic. J Med Chem.
59:3635–3649. 2016. View Article : Google Scholar : PubMed/NCBI
|
|
14
|
Hu Q, Hou YC, Huang J, Fang JY and Xiong
H: Itraconazole induces apoptosis and cell cycle arrest via
inhibiting Hedgehog signaling in gastric cancer cells. J Exp Clin
Cancer Res. 36:502017. View Article : Google Scholar : PubMed/NCBI
|
|
15
|
Choi YH, Lee U, Lee BK and Lee MG:
Pharmacokinetic interaction between itraconazole and metformin in
rats: Competitive inhibition of metabolism of each drug by each
other via hepatic and intestinal CYP3A1/2. Br J Pharmacol.
161:815–829. 2010. View Article : Google Scholar : PubMed/NCBI
|
|
16
|
Bondarenko LB, Shayakhmetova GM, Voronina
AK and Kovalenko VM: Effects of metformin on cytochromes CYP3А,
CYP2С and CYP2Е1 Functioning at metabolic syndrome in rats of
different age. Curr Res Diabetes Obes J. 4:5556452017.
|
|
17
|
Pakkir Maideen NM, Jumale A and
Balasubramaniam R: Drug interactions of metformin involving drug
transporter proteins. Adv Pharm Bull. 7:501–505. 2017. View Article : Google Scholar : PubMed/NCBI
|
|
18
|
Wagner DJ, Hu T and Wang J: Polyspecific
organic cation transporters and their impact on drug intracellular
levels and pharmacodynamics. Pharmacol Res. 111:237–246. 2016.
View Article : Google Scholar : PubMed/NCBI
|
|
19
|
König J, Müller F and Fromm MF:
Transporters and drug-drug interactions: Important determinants of
drug disposition and effects. Pharmacol Rev. 65:944–966. 2013.
View Article : Google Scholar : PubMed/NCBI
|
|
20
|
Quesada J and Amato R: The molecular
biology of Soft-tissue sarcomas and current trends in therapy.
Sarcoma. 2012:8494562012. View Article : Google Scholar : PubMed/NCBI
|
|
21
|
Anderson JL, Denny CT, Tap WD and Federman
N: Pediatric sarcomas: Translating molecular pathogenesis of
disease to novel therapeutic possibilities. Pediatr Res.
72:112–121. 2012. View Article : Google Scholar : PubMed/NCBI
|
|
22
|
Issaq SH, Teicher BA and Monks A:
Bioenergetic properties of human sarcoma cells help define
sensitivity to metabolic inhibitors. Cell Cycle. 13:1152–1161.
2014. View
Article : Google Scholar : PubMed/NCBI
|
|
23
|
Hoang NT, Acevedo LA, Mann MJ and Tolani
B: A review of soft-tissue sarcomas: Translation of biological
advances into treatment measures. Cancer Manag Res. 10:1089–1114.
2018. View Article : Google Scholar : PubMed/NCBI
|
|
24
|
Burningham Z, Hashibe M, Spector L and
Schiffman JD: The epidemiology of sarcoma. Clin Sarcoma Res.
2:142012. View Article : Google Scholar : PubMed/NCBI
|
|
25
|
Calvert GT, Randall RL, Jones KB,
Cannon-Albright L, Lessnick S and Schiffman JD: At-Risk populations
for osteosarcoma: The syndromes and beyond. Sarcoma.
2012:1523822012. View Article : Google Scholar : PubMed/NCBI
|
|
26
|
Egas-Bejar D and Huh WW: Rhabdomyosarcoma
in adolescent and young adult patients: Current perspectives.
Adolesc Health Med Ther. 5:115–125. 2014.PubMed/NCBI
|
|
27
|
Stoker M and Macpherson I: Syrian hamster
fibroblast cell line BHK21 and its derivatives. Nature.
203:1355–1357. 1964. View Article : Google Scholar : PubMed/NCBI
|
|
28
|
Mayo J, Lombardo L, Klein-Szanto AJ, Conti
CJ and Moreira JL: An oncogenic virus carried by hamster kidney
cells. Cancer Res. 33:2273–2277. 1973.PubMed/NCBI
|
|
29
|
Tomayko MM and Reynolds CP: Determination
of subcutaneous tumor size in athymic (nude) mice. Cancer Chemother
Pharmacol. 24:148–154. 1989. View Article : Google Scholar : PubMed/NCBI
|
|
30
|
Sápi J, Kovács L, Drexler DA, Kocsis P,
Gajári D and Sápi Z: Tumor volume estimation and quasi-continuous
administration for most effective bevacizumab therapy. PLoS One.
10:e01421902015. View Article : Google Scholar : PubMed/NCBI
|
|
31
|
Kanto K, Ito H, Noso S, Babaya N, Hiromine
Y, Taketomo Y, Toma J, Niwano F, Yasutake S, Kawabata Y and Ikegami
H: Effects of dosage and dosing frequency on the efficacy and
safety of high-dose metformin in Japanese patients with type 2
diabetes mellitus. J Diabetes Investig. Sep 30–2017.(Epub ahead of
print). PubMed/NCBI
|
|
32
|
de Sousa ATO, Vasconcelos JMB and Soares
MJGO: Software Image Tool 3.0 as an instrument for measuring
wounds. J Nurs UFPE on line. 6:2569–2573. 2012.(In English;
Portuguese).
|
|
33
|
Scudiero DA, Shoemaker RH, Paull KD, Monks
A, Tierney S, Nofziger TH, Currens MJ, Seniff D and Boyd MR:
Evaluation of a soluble tetrazolium/formazan assay for cell growth
and drug sensitivity in culture using human and other tumor cell
lines. Cancer Res. 48:4827–4833. 1988.PubMed/NCBI
|
|
34
|
Campbell BC, Chan KL and Kim JH:
Chemosensitization as a means to augment commercial antifungal
agents. Front Microbiol. 3:792012. View Article : Google Scholar : PubMed/NCBI
|
|
35
|
Singh V and Singh SM: Effect of high cell
density on the growth properties of tumor cells: A role in tumor
cytotoxicity of chemotherapeutic drugs. Anticancer Drugs.
18:1123–1132. 2007. View Article : Google Scholar : PubMed/NCBI
|
|
36
|
No authors listed, . (P097) tumor density,
size, and histology in the outcome of stereotactic body radiation
therapy for early-stage non-small-cell lung cancer: a
single-institution experience. Oncology (Williston Park). 29 (Suppl
1):(pii): 2050532015.PubMed/NCBI
|
|
37
|
Dowling RJ, Lam S, Bassi C, Mouaaz S, Aman
A, Kiyota T, Al-awar R, Goodwin PJ and Stambolic V: Metformin
pharmacokinetics in mouse tumors: Implications for human therapy.
Cell Metab. 23:567–568. 2016. View Article : Google Scholar : PubMed/NCBI
|
|
38
|
Cheong JH, Park ES, Liang J, Dennison JB,
Tsavachidou D, Nguyen-Charles C, Wa Cheng K, Hall H, Zhang D, Lu Y,
et al: Dual inhibition of tumor energy pathway by 2-deoxyglucose
and metformin is effective against a broad spectrum of preclinical
cancer models. Mol Cancer Ther. 10:2350–2362. 2011. View Article : Google Scholar : PubMed/NCBI
|
|
39
|
Kim J, Tang JY, Gong R, Kim J, Lee JJ,
Clemons KV, Chong CR, Chang KS, Fereshteh M, Gardner D, et al:
Itraconazole, a commonly used antifungal that inhibits Hedgehog
pathway activity and cancer growth. Cancer Cell. 17:388–399. 2010.
View Article : Google Scholar : PubMed/NCBI
|
|
40
|
Choi CH, Ryu JY, Cho YJ, Jeon HK, Choi JJ,
Ylaya K, Lee YY, Kim TJ, Chung JY, Hewitt SM, et al: The
anti-cancer effects of itraconazole in epithelial ovarian cancer.
Sci Rep. 7:65522017. View Article : Google Scholar : PubMed/NCBI
|
|
41
|
Zhang L, Liu Z, Yang K, Kong C, Liu C,
Chen H, Huang J and Qian F: Tumor progression of non-small cell
lung cancer controlled by albumin and Micellar nanoparticles of
Itraconazole, a Multitarget angiogenesis inhibitor. Mol Pharm.
14:4705–4713. 2017. View Article : Google Scholar : PubMed/NCBI
|
|
42
|
Hwang YP and Jeong HG: Metformin blocks
migration and invasion of tumour cells by inhibition of matrix
metalloproteinase-9 activation through a calcium and protein kinase
Calpha-dependent pathway:
Phorbol-12-myristate-13-acetate-induced/extracellular
signal-regulated kinase/activator protein-1. Br J Pharmacol.
160:1195–1211. 2010. View Article : Google Scholar : PubMed/NCBI
|