Introduction
Glioblastoma multiforme (GBM) is the most common and
malignant types of glioma, accounting for the major cause of brain
cancer death, with a median patient survival of about 15 months
from diagnosis (1). It is considered
to be the 12th leading cause of cancer-associated death in the USA
(2). Treatment of GBM includes
surgery, chemotherapy and radiation therapy, but resistance to
chemotherapeutic agents and a high frequency of relapse after
surgery, pose difficulties in the therapeutic intervention of this
disease (3–5). The molecular determinants of GBM are
not well understood even though there have been advances in GBM
research in last few decades. It is therefore important to identify
and establish a clear mechanism of GBM onset and progression that
may help in early diagnosis, as well as development of new
strategies for combating this disease.
Even though microRNAs (miRNAs) were discovered in
1993 (6), their involvement in
cancer was first reported only in 2002 (7). MicroRNAs are small non-coding RNAs
ranging from 17–25 bp, which are involved in the post-translational
regulation of gene expression by the partial complementarity of
binding sites in the 3′ untranslated regions of mRNA (8). MicroRNAs can regulate gene expression
either by mRNA cleavage or by translational repression (9). Some miRNAs can act as tumour
suppressors by downregulating oncogenes, whereas others called
oncomirs, act to promote tumorigenesis, by lowering expression
levels of tumour suppressor genes (10). According to MirBase, there are 1,917
precursors and 2,654 mature miRNAs in humans, each miRNA being able
to regulate the expression of several mRNAs. Each of these mRNAs
are in turn regulated by different miRNAs, implicating the presence
of a very complex regulatory machinery which demands a focused
study in order to map mRNAs and its miRNA regulators. Deregulated
miRNA expression patterns have been observed in a wide variety of
human malignancies, such as pancreas, breast, colon, lung and skin
cancers (11).
Even though there are ongoing efforts to establish
miRNA patterns in GBM models, identification of new biomarkers that
could be used for diagnostic and prognostic purposes is a very
significant unmet need. Therefore, the current study is focused on
investigating the GBM miRNA expression profile data sets collected
from GEO database, followed by identification of differentially
expressed miRNAs between normal and GBM tissues. Furthermore, the
present study also details the exploration of their targets, and
construction of their target gene interaction networks, to get a
better understanding of the underlying mechanism of GBM development
and progression.
Materials and methods
Microarray data
The GBM miRNA expression data from GEO dataset with
accession number GSE65626 and GSE25631 were selected for the
analysis. GSE65626 contained both gene expression and miRNA
expression analysis of 3 primary GBM tissues which were compared
with normal adjacent tissues. The miRNA expression data performed
based on the GPL19117 platform (Affymetrix Multispecies miRNA-4
Array), was taken for the current analysis. GSE25631 contained the
expression data of 82 primary GBM and 5 normal brain tissues,
performed in a platform based on GPL8179 Illumina Human v2 MicroRNA
expression beadchip.
Microarray data processing
GEO2R (http://www.ncbi.nlm.nih.gov/geo/geo2r), is an online
tool which compares two groups of samples in GEO dataset in order
to identify deregulated miRNAs in GBM samples, compared to adjacent
normal tissues. The two packages of Bioconductor project in R
platform, GEOquery and limma, enable accurate analysis of processed
microarray data supplied, to detect deregulated miRNAs from GEO
datasets. False discovery rate (FDR) was minimized by applying
adjusted P-values (adj P-value) based on Benjamini-Hochberg method.
The |log Fold Change (logFC)|>1 and adj P-value <0.05 were
taken as cut off values for detection of upregulated or
downregulated miRNAs in the samples.
Identification of targets of
deregulated miRNAs
Validated target genes of deregulated miRNAs were
determined using MirTarbase (http://mirtarbase.mbc.nctu.edu.tw), which is a
database of manually curated miRNA target gene interactions,
obtained from the literature. The target genes which are tagged
with strong evidence (Western blot/Reporter assay/Quantitative
real-time PCR) are selected for further analysis.
Gene ontology (GO) and pathway
analysis
The Database for Annotation, Visualization and
Integrated Discovery (DAVID) (http://david.ncifcrf.gov/), is a web tool for high
throughput analysis of gene function, obtained from genomic
experiments. In the present study, DAVID was used to perform gene
ontology (GO) and Kyoto Encyclopedia of Genes and Genomes (KEGG)
pathway analysis. GO categorizes ontology terms into molecular
function, cellular components and biological processes. KEGG
pathway database analysis was performed to identify enrichment of
deregulated miRNA target genes, which could be mapped to specific
pathways. Both the GO and KEGG pathway analysis were performed with
a strict criterion for selection of significant enrichment (False
Discovery Rate (RDF) <0.05). Wikipathway analysis and mapping of
target genes were done using a Cytoscape 3.6 plugin (WikiPathways),
and is visualized in Cytoscape 3.6.
PPI network analysis and clusters
selection
Protein interaction network (PPI) of the target
genes were constructed using Search Tool for the Retrieval of
Interacting Genes/Proteins (STRING, http://string.embl.de/), which is a database of
predicted and known protein-protein interactions. The PPI network
was created with a high confidence score (confidence score ≥7) and
was visualized by Cytoscape 3.6 software. In order to detect
functional modules in the network, a Cytoscape plugin, Molecular
Complex Detection (MCODE) was used. An MCODE score greater than 3,
and the total number of nodes greater than 4, was kept as cut-off
criteria.
Kaplan-Meier survival curves
analysis
The survival analysis was performed using OncoLnc
(http://www.oncolnc.org), an online data mining
tool which uses survival data from cancer studies executed by The
Cancer Genome Atlas (TCGA). Patients were divided into high
expression and low expression groups based on a 25th percentile cut
off.
Results
Identification of deregulated
miRNAs
In this study, we obtained two publically available
miRNA microarray data sets, GSE65626 and GSE25631, from GEO.
GSE65626 contains a total of 12 samples, in which 3 primary GBM
tissues are compared with their normal adjacent tissues in
duplicates. GSE25631 has the miRNA expression profiles of 5 normal
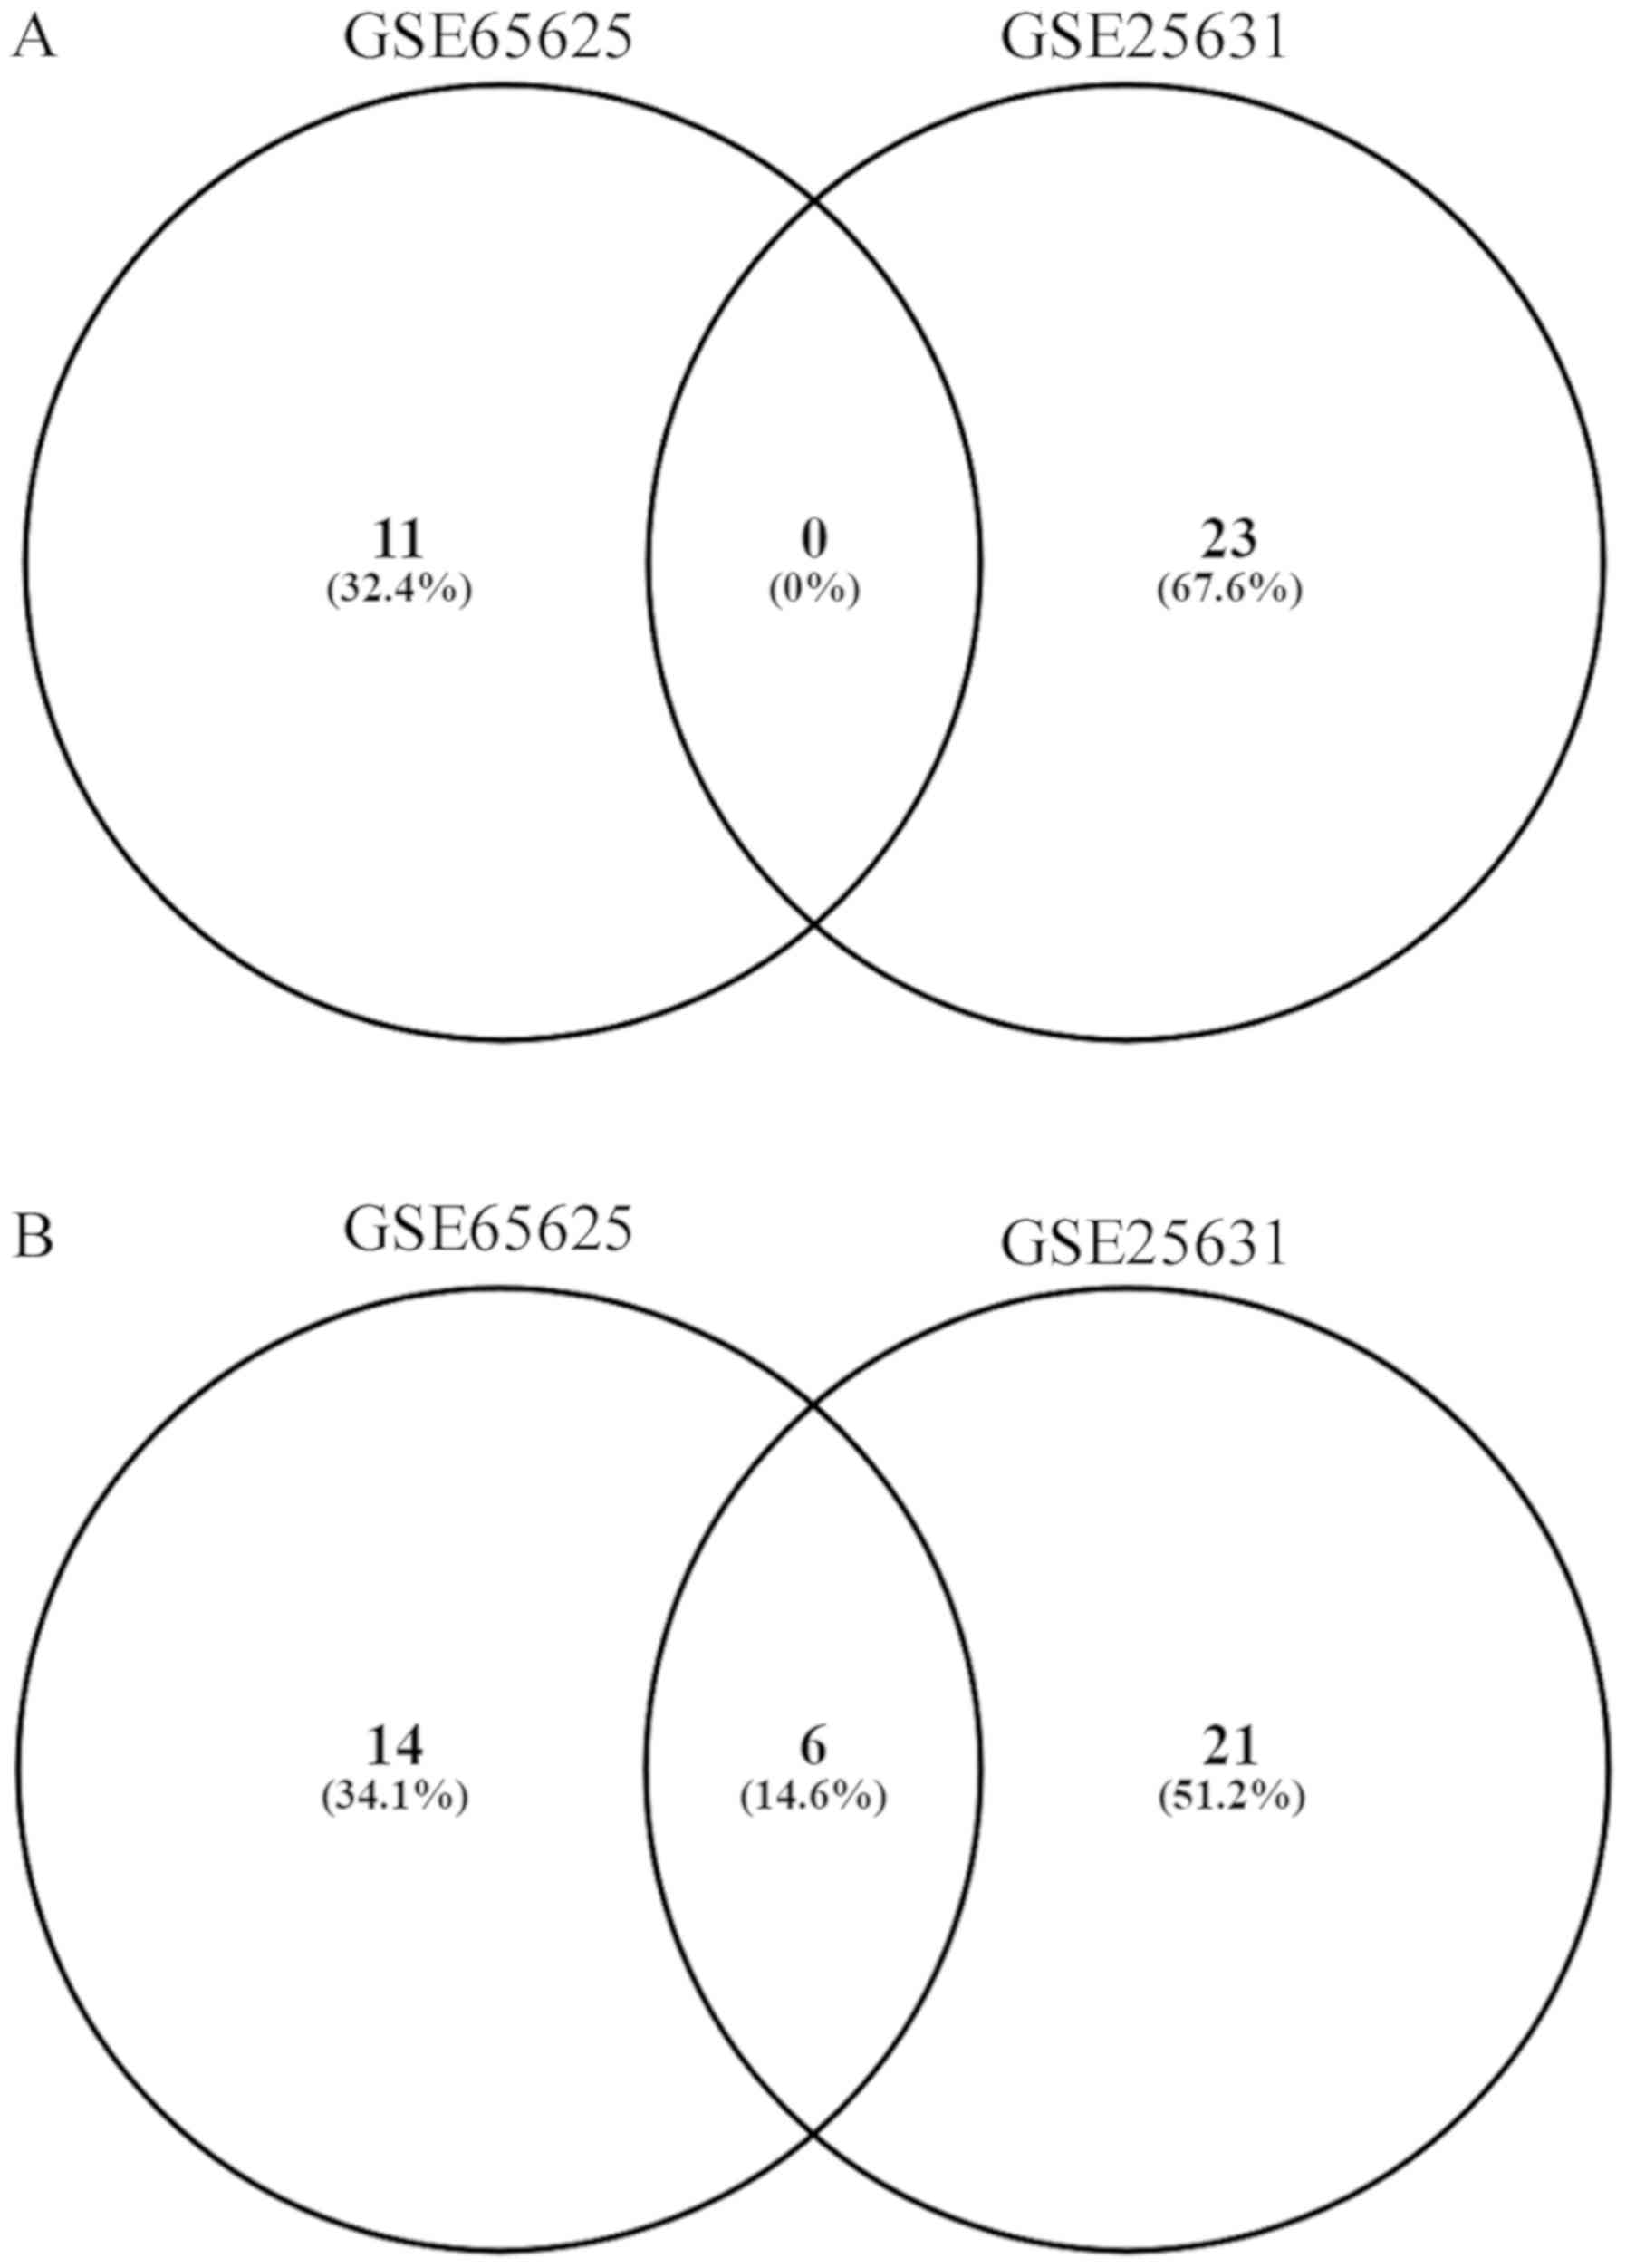
brain tissues and 82 primary GBM tissues. A total of 11 and 23
upregulated miRNAs were observed in GSE65626 and GSE25631
respectively (Fig. 1A). However,
none of the upregulated miRNAs were found to show similar
expression trends in both the datasets. On other hand, of the 20
and 27 down-regulated miRNAs present in GSE65626 and GSE25631
respectively, 6 (hsa-miR-139-3p, hsa-miR-139-5p, hsa-miR-138-2-3p,
hsa-miR-338-5p, hsa-miR-383-5p and hsa-miR-770-5p) were found to be
expressed in reduced levels in GBM tissues as compared to adjacent
normal brain tissues in both the datasets (Fig. 1B; Table
I). Among these miRNAs, hsa-miR-338-5p was found to show the
highest average downregulation (logFC=−5.672712), whereas
hsa-mir-139-5p showed the least average downregulation
(logFC=−2.783656) in both the datasets.
 | Table I.Most significantly upregulated and
downregulated miRNAs. |
Table I.
Most significantly upregulated and
downregulated miRNAs.
|
| logFC | adj.P.Val |
|---|
|
|
|
|
|---|
| miRNA ID | GSE65626 | GSE25631 | GSE65626 | GSE25631 |
|---|
|
hsa-miR-138-2-3p | −4.983773 | −3.540977 | 0.000943 | 0.001108 |
| hsa-miR-139-3p | −6.720897 | −3.16659 | 0.012132 | 0.009653 |
| hsa-mir-139-5p | −4.09792 | −1.469392 | 0.039613 | 0.025831 |
| hsa-miR-338-5p | −7.989224 | −3.3562 | 0.013202 | 0.001108 |
| hsa-miR-770-5p | −4.504915 | −2.807833 | 0.027344 | 0.039478 |
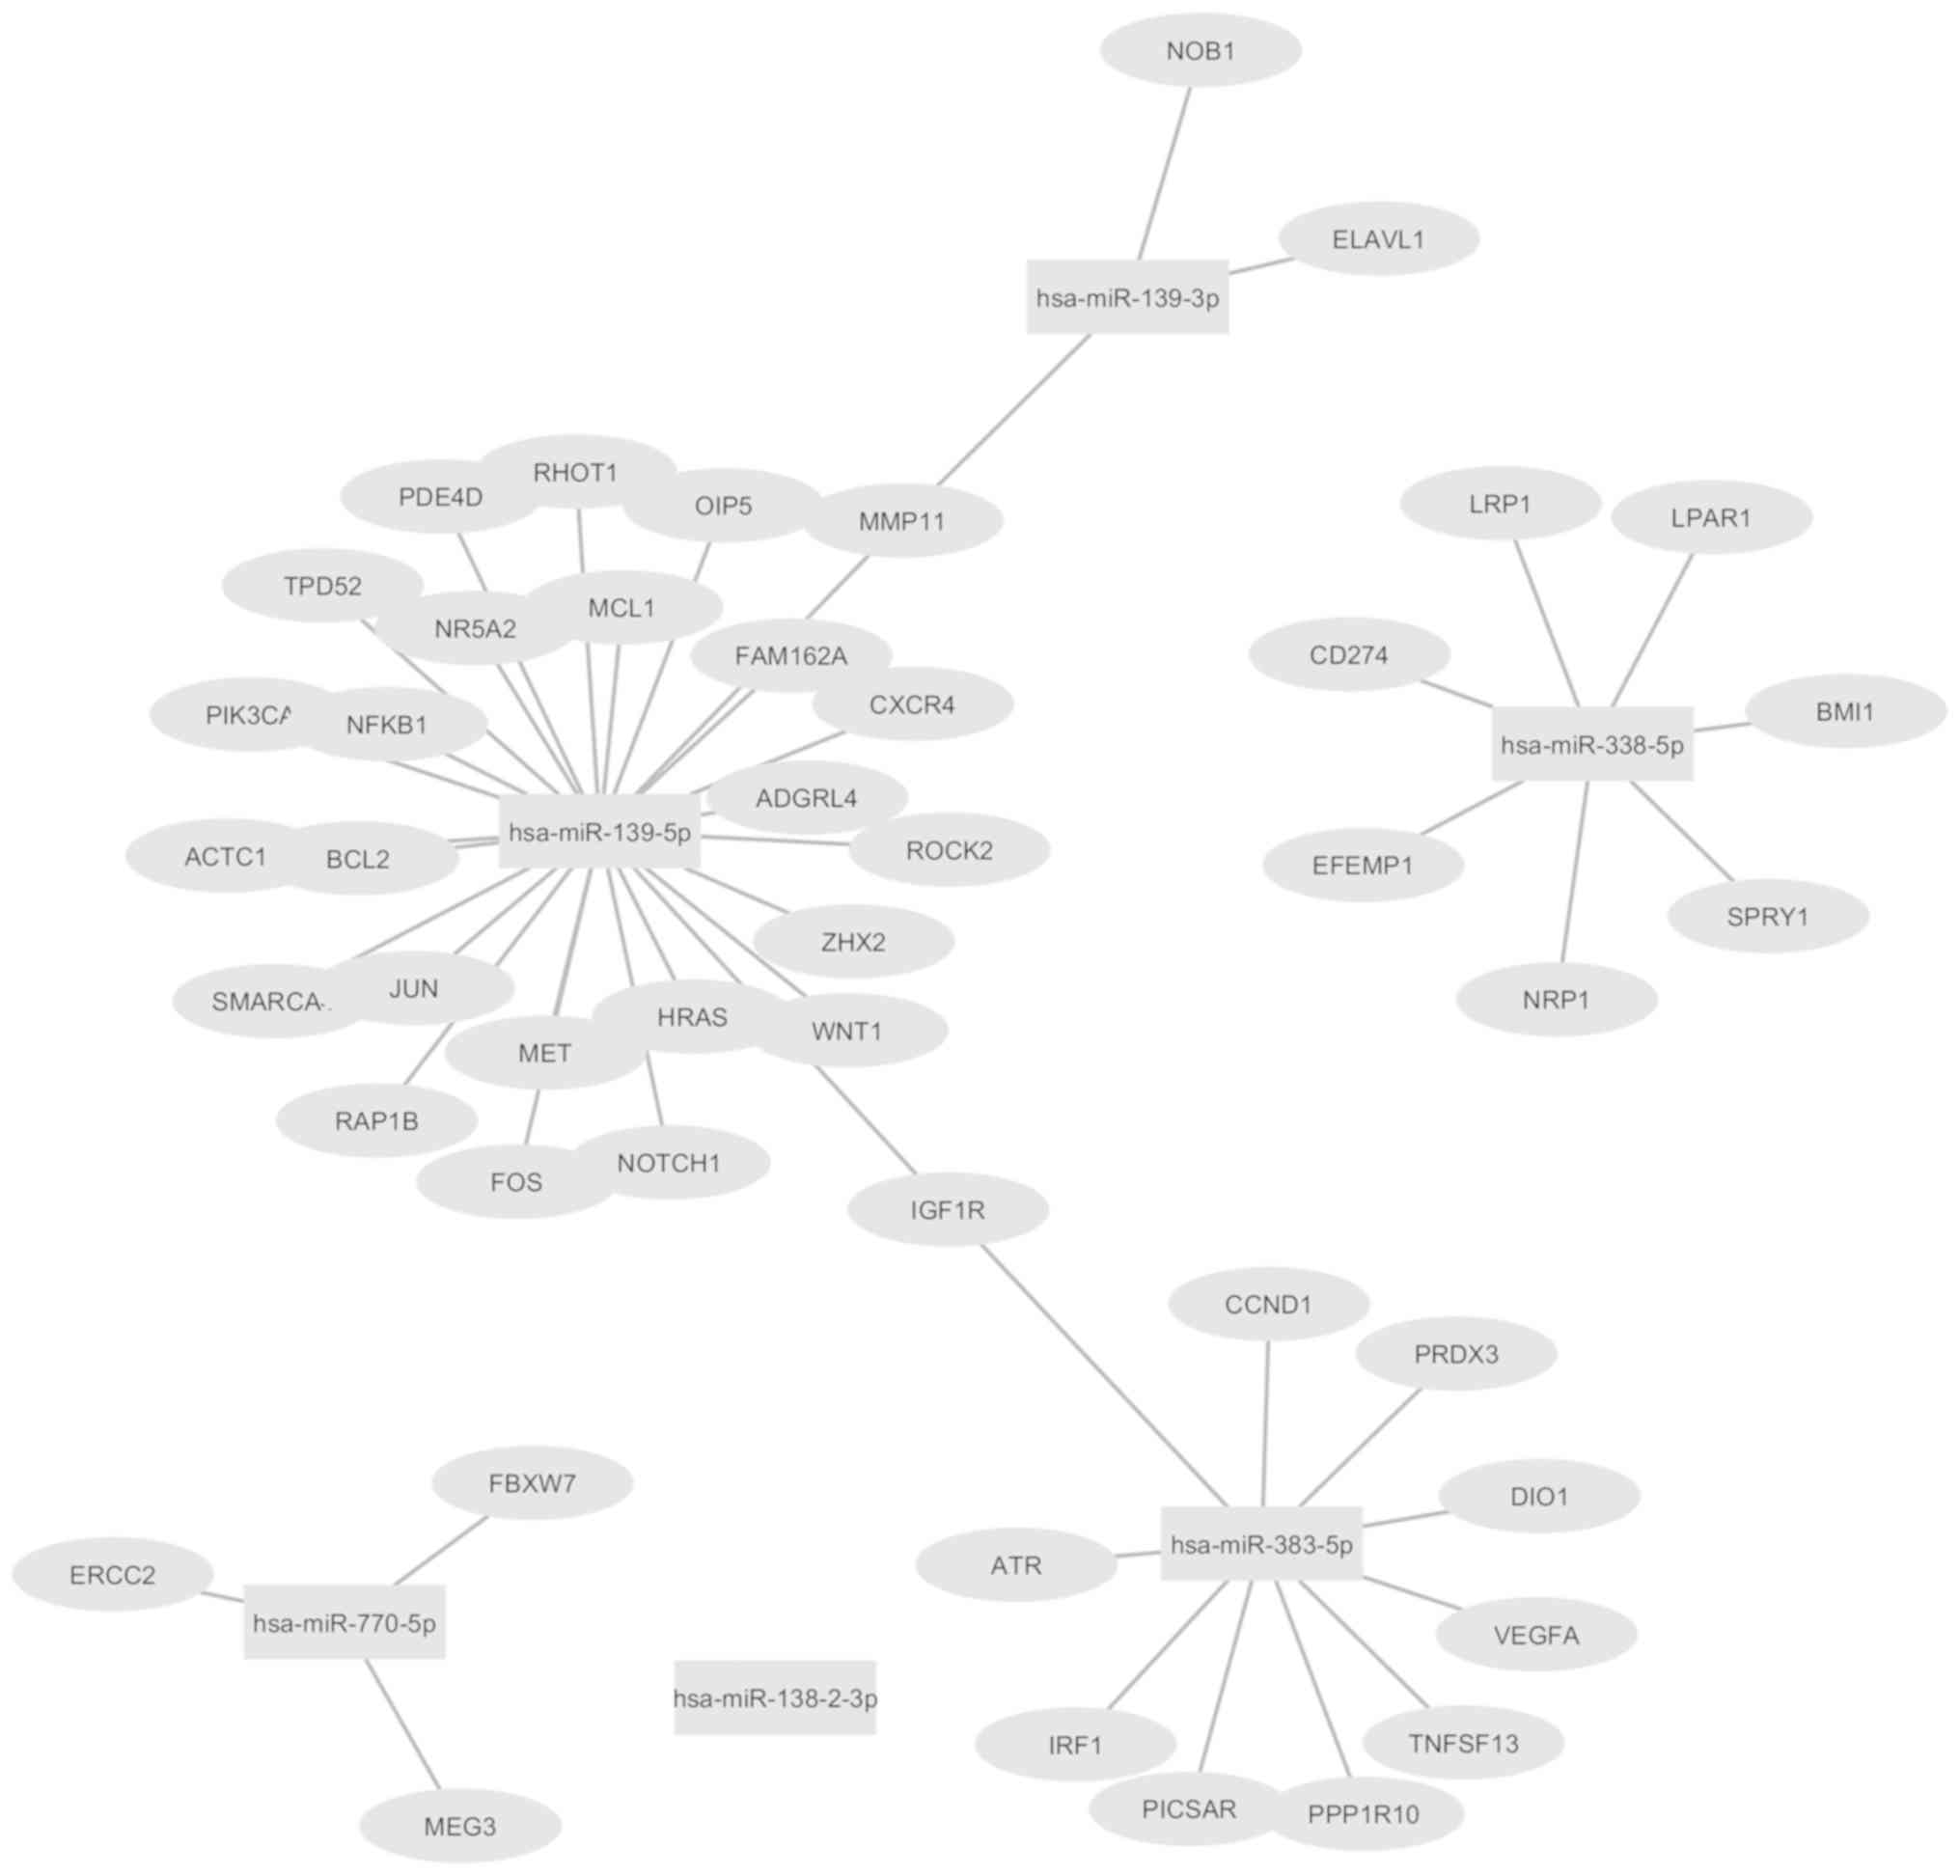
Identification of the miRNA gene
regulatory network
Since miRNAs play a very important role in the
regulation of post-translational gene expression, we queried the
targets of all 6 deregulated miRNAs (hsa-miR-139-3p,
hsa-miR-139-5p, hsa-miR-138-2-3p, hsa-miR-338-5p, hsa-miR-383-5p
and hsa-miR-770-5p) from miRTarBase, which is a database of
experimentally validated miRNA-target gene interactions. Altogether
49 interactions were obtained with strong experimental evidence
(Western blot/Reporter assay/Quantitative real-time PCR), for 5 out
of 6 miRNAs, which were visualized using Cytoscape (Fig. 2). Amongst the deregulated miRNAs,
hsa-miR-138-2-3p was not found to have any validated target gene
available in the database, in contrast to the other miRNAs, namely,
hsa-miR-139-3p, hsa-miR-139-5p, hsa-miR-338-5p, hsa-miR-383-5p and
hsa-miR-770-5p, which have 3, 26, 7, 10 and 3 target genes
respectively. IGF1R is a target of both hsa-miR-139-5p and
hsa-miR-383-5p whereas MMP11 is targeted by both hsa-miR-139-3p,
hsa-miR-139-5p.
Gene ontology (GO) functional
annotation and pathway enrichment of targets genes
To gain insights into the biological pathways of
target genes, we performed GO categories and pathway enrichment
analysis using DAVID software, a web-accessible program for the
functional annotation of genes obtained from genomic experiments.
The list of genes were analyzed for enrichment in different GO
terms, which were grouped into sub-ontologies, namely, biological
process (BP), cellular component (CC) and molecular function (MF).
The minimum number of genes for the GO categorization was set to 2.
The significant GO term for the target genes is listed in Table II. Only 7 GO terms were enriched
with a selection criterion of FDR <0.05. Based on this, we
identified that the majority of the genes in CC category are
enriched in the cytosol (24 genes) and nucleoplasm (20 genes). In
BP ontology, majority of the genes were enriched in positive
regulation of DNA-templated transcription (10 genes), followed by
negative regulation of neuron apoptotic process (6 genes), response
to cytokine (5 genes) and negative regulation of anoikis (4 genes).
However, in MF ontology, only one category was significantly
enriched, namely, protein hetero-dimerization activity (9
genes).
| Table II.Top enriched GO terms. |
Table II.
Top enriched GO terms.
| A, Cellular
component |
|---|
|
|---|
| GO ID and term | Count | FDR | Genes |
|---|
| GO:0005829:
cytosol | 22 | 0.008208 | HRAS, ACTC1, NRP1,
MCL1, ROCK2, NOB1, ELAVL1, NFKB1, TNFSF13, PDE4D, PRDX3, FOS,
SPRY1, NOTCH1, FBXW7, CCND1, JUN, BCL2, IRF1, RHOT1, PIK3CA,
RAP1B |
| GO:0005654:
nucleoplasm | 20 | 0.010017 | BMI1, MCL1, ZHX2,
NOB1, ELAVL1, PPP1R10, NFKB1, TNFSF13, ATR, FOS, SPRY1, NOTCH1,
FBXW7, CCND1, OIP5, JUN, IRF1, NR5A2, ERCC2, SMARCA4 |
|
| B, Biological
process |
|
| GO ID and
term | Count | FDR | Genes |
|
| GO:0045893:
positive regulation of transcription, DNA-templated | 10 | 0.009448 | WNT1, FOS, NOTCH1,
JUN, IRF1, MEG3, NFKB1, NR5A2, SMARCA4, ERCC2 |
| GO:0034097:
response to cytokine | 5 | 0.015699 | FOS, MCL1, JUN,
BCL2, CD274 |
| GO:2000811:
negative regulation of anoikis | 4 | 0.017246 | NOTCH1, MCL1, BCL2,
PIK3CA |
| GO:0043524:
negative regulation of neuron apoptotic process | 6 | 0.036615 | HRAS, NRP1, LRP1,
JUN, BCL2, PIK3CA |
|
| C, Molecular
function |
|
| GO ID and
term | Count | FDR | Genes |
|
| GO:0046982: protein
heterodimerization activity | 9 | 0.028328 | FOS, NOTCH1, MCL1,
JUN, BCL2, VEGFA, ZHX2, NFKB1, TPD52 |
Furthermore, the KEGG pathway analysis to identify
the significant pathways enriched in target gene list was performed
using DAVID software. With a cut-off criteria of FDR <0.05, only
11 pathways were obtained (Table
III). The major pathway which was significantly enriched
included pathways in cancer with the highest number of target genes
(14 genes), followed by focal adhesion (10 genes), PI3K-Akt
signaling (10 genes), microRNAs in cancer (9 genes). Pathways in
cancer involves different signaling pathways such as Wnt, p53,
VEGF, calcium, HIF-1, PPAR, Notch, PI3K-Akt, MAPK, Estrogen, cAMP,
TGF beta, Hedgehog, Jak-STAT and mTOR pathways, which play critical
roles in invasion and metastasis, cell proliferation, adhesion,
angiogenesis, apoptosis and resistance to chemotherapy. Focal
adhesion pathway plays a crucial role in cell motility, cell
survival and cell proliferation. PI3K-Akt signaling plays a vital
role in the development and progression of GBM. Pathway enrichment
analysis thus shows a significant role for these deregulated miRNAs
in GBM development.
| Table III.Enriched Kyoto Encyclopedia of Genes
and Genomes pathways of the target genes. |
Table III.
Enriched Kyoto Encyclopedia of Genes
and Genomes pathways of the target genes.
| Term | Count | FDR | Genes |
|---|
| Pathways in
cancer | 14 |
5.10×10⁻⁶ | HRAS, ROCK2, MET,
NFKB1, LPAR1, IGF1R, WNT1, FOS, CCND1, CXCR4, BCL2, JUN, VEGFA,
PIK3CA |
| Focal adhesion | 10 |
2.10×10⁻⁴ | IGF1R, HRAS, CCND1,
ROCK2, JUN, BCL2, VEGFA, MET, PIK3CA, RAP1B |
| Renal cell
carcinoma | 6 | 0.010445 | HRAS, JUN, VEGFA,
MET, PIK3CA, RAP1B |
| HTLV–I
infection | 9 | 0.014093 | WNT1, FOS, HRAS,
CCND1, NRP1, JUN, PIK3CA, NFKB1, ATR |
| PI3K-Akt signaling
pathway | 10 | 0.015521 | IGF1R, HRAS, CCND1,
MCL1, BCL2, VEGFA, MET, PIK3CA, NFKB1, LPAR1 |
| Prolactin signaling
pathway | 6 | 0.016156 | FOS, HRAS, CCND1,
IRF1, PIK3CA, NFKB1 |
| Proteoglycans in
cancer | 8 | 0.026297 | IGF1R, WNT1, HRAS,
CCND1, ROCK2, VEGFA, MET, PIK3CA |
| MicroRNAs in
cancer | 9 | 0.030795 | BMI1, NOTCH1, HRAS,
CCND1, MCL1, BCL2, VEGFA, MET, NFKB1 |
| Hepatitis B | 7 | 0.043312 | FOS, HRAS, CCND1,
JUN, BCL2, PIK3CA, NFKB1 |
| Prostate
cancer | 6 | 0.046072 | IGF1R, HRAS, CCND1,
BCL2, PIK3CA, NFKB1 |
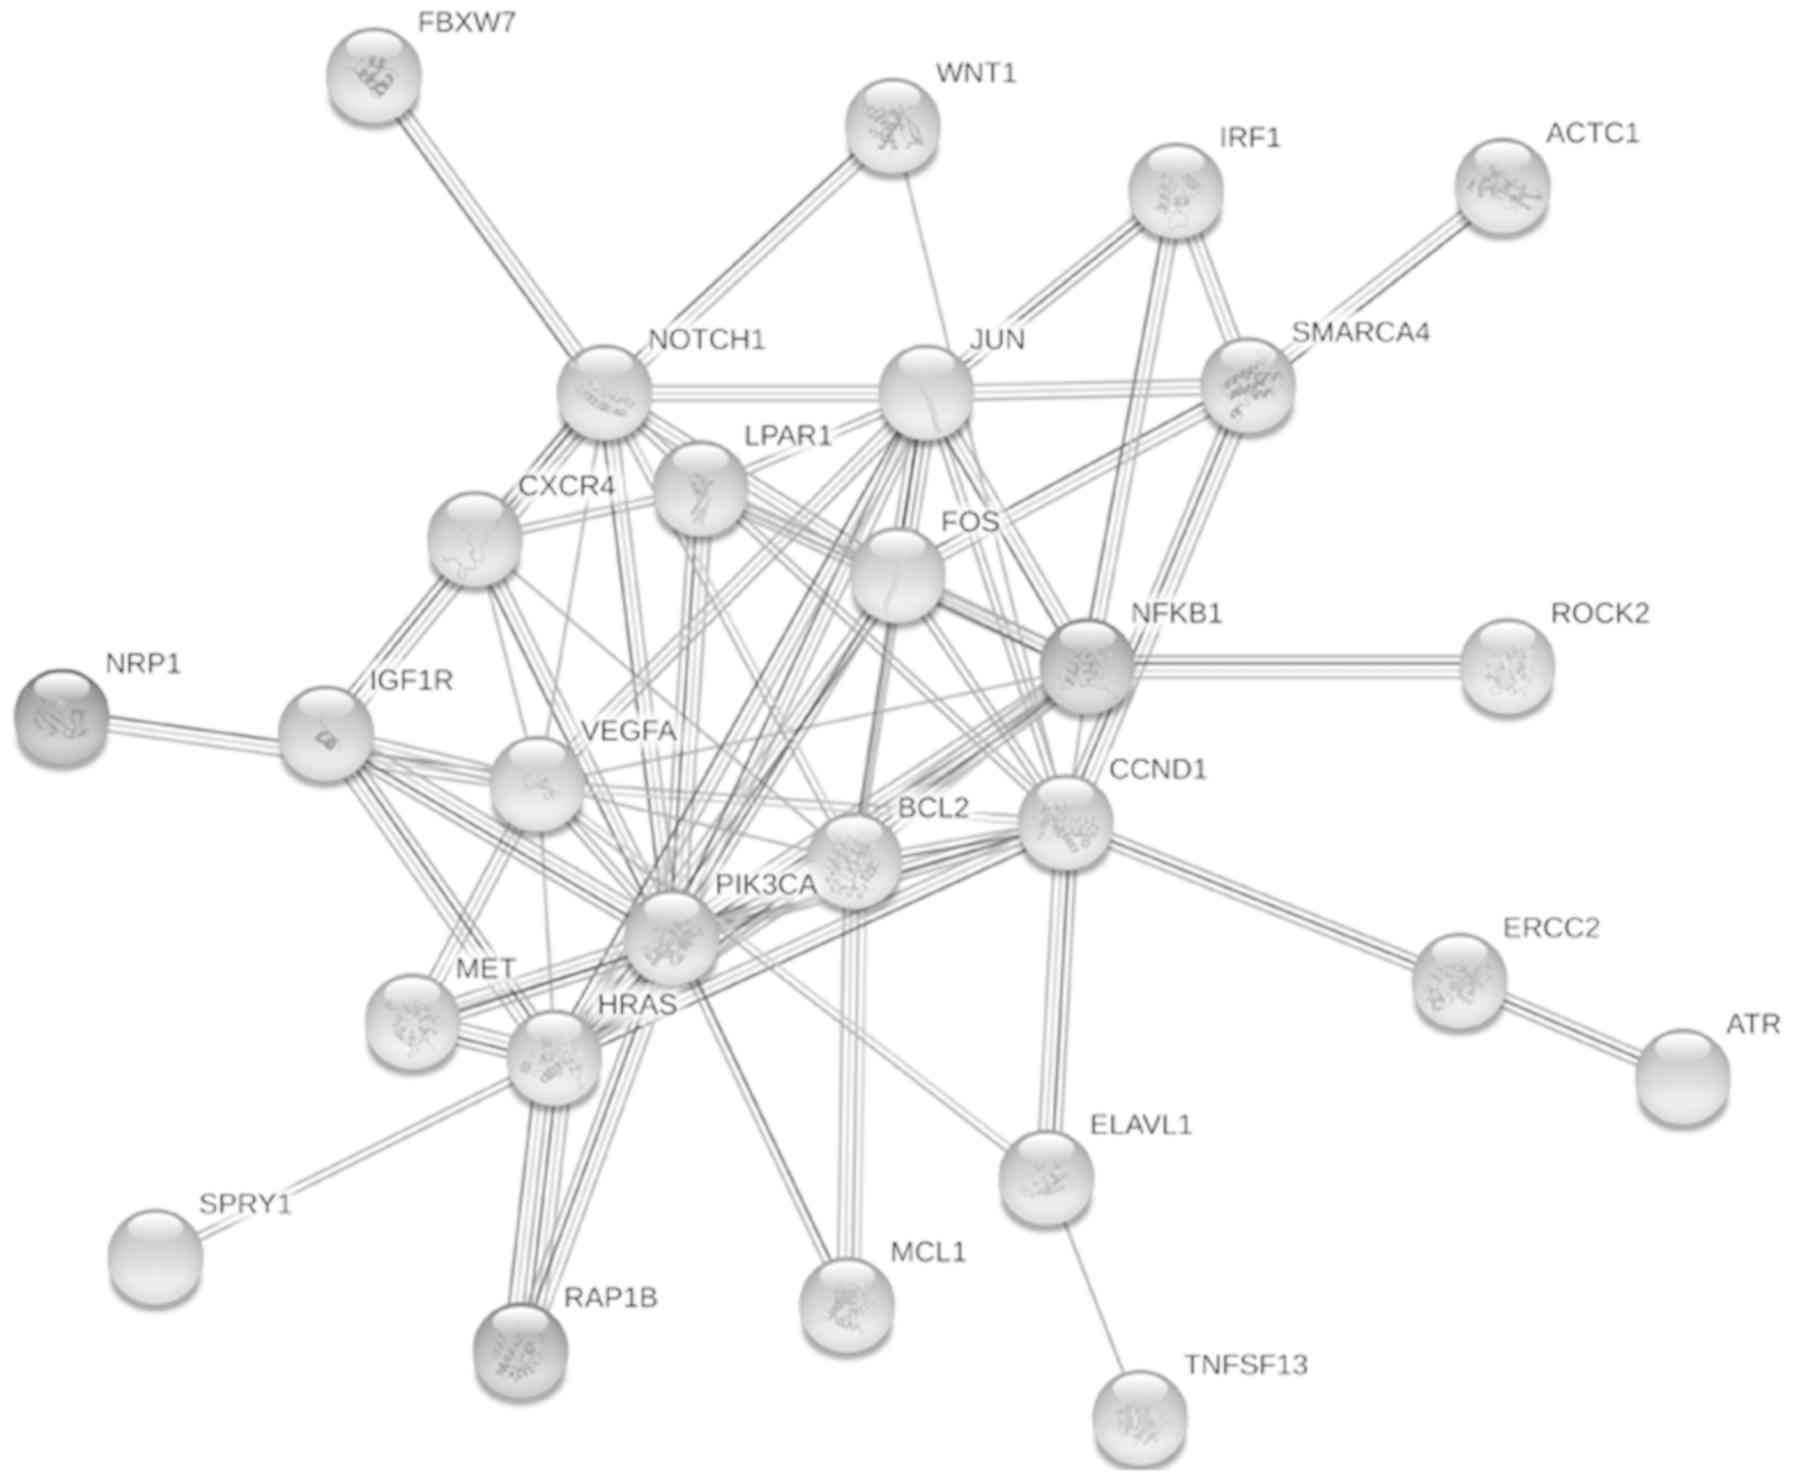
PPI network construction of DE-miRNA
target genes and module analysis
In order to understand the interaction among target
genes, PPI network was constructed using STRING database with a
criterion of minimum required interaction score set to high
confidence (0.7). There were 44 nodes with 136 edges with an
average node degree of 6.18 (Fig.
3). PPI enrichment showed that target genes of deregulated
miRNAs are at least partially biologically connected
(P-value:4.62e−12). The PPI interaction network was
further explored for identification of clusters using a Cytoscape
based plug in, MCODE. An MCODE score greater than 3, and the total
number of nodes greater than 4, was kept as cut-off criteria for
identification of functional modules. Only a single cluster was
identified by MCODE which consisted of 8 nodes (BCL-2, CCND1, FOS,
HRAS, JUN, NFKB1, PIK3CA, VEGFA) and 27 edges (Fig. 4). Furthermore, VEGFA has been
identified as the seed gene in this cluster with an MCODE score of
6.
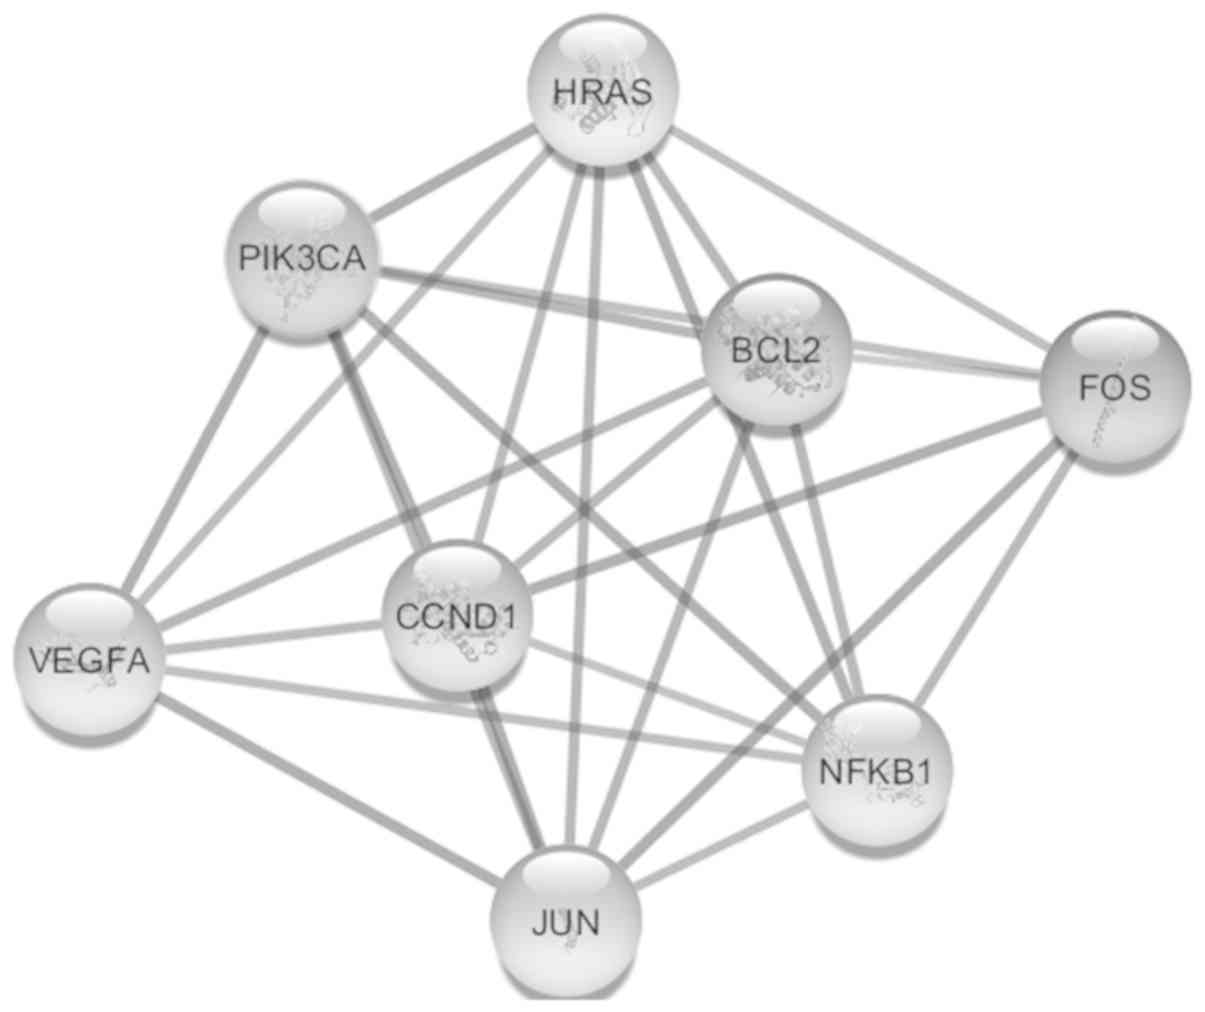 | Figure 4.Only significant module found by
MCODE analysis with cut-off criteria of MCODE score >3 and node
>4. This module consists of 8 nodes (BCL-2, CCND1, FOS, HRAS,
JUN, NFKB1, PIK3CA and VEGFA) and 27 edges, and VEGF is the seed
gene in this module with an MCODE score of 6. MCODE, Molecular
Complex Detection; CCND1, cyclin D1; FOS, Fos proto-oncogene, AP-1
transcription factor subunit; HRAS, HRas proto-oncogene, GTPase;
NFKB1, nuclear factor κB subunit 1; PIK3CA,
phosphatidylinositol-4,5-biphosphate 3-kinase catalytic subunit α;
VEGFA, vascular endothelial growth factor A. |
Mapping of target genes to
glioblastoma pathway in wikipathway
We downloaded signaling pathways in glioblastoma
from Wikipathway which included most frequently altered genes in
GBM, drawn together from literature and public database resources,
using plug-in Wikipathways, and visualized them in Cytoscape,
followed by mapping of deregulated miRNA targets genes. Our
analysis showed that five of the target genes, namely, CCND1,
IGF1R, PIK3CA, HRAS and MET play a significant role in GBM
signaling cascades (Fig. 5). Of the
6 miRNAs that were downregulated, the 2 miRNAs, hsa-miR-139-5p
(IGF1R, PIK3CA, HRAS, MET) and hsa-miR-383-5p (CCND1, IGF1R),
targeted all five of these genes. CCND1, IGF1R, PIK3CA and HRAS
were also found to be present in the glioma pathways in KEGG
database.
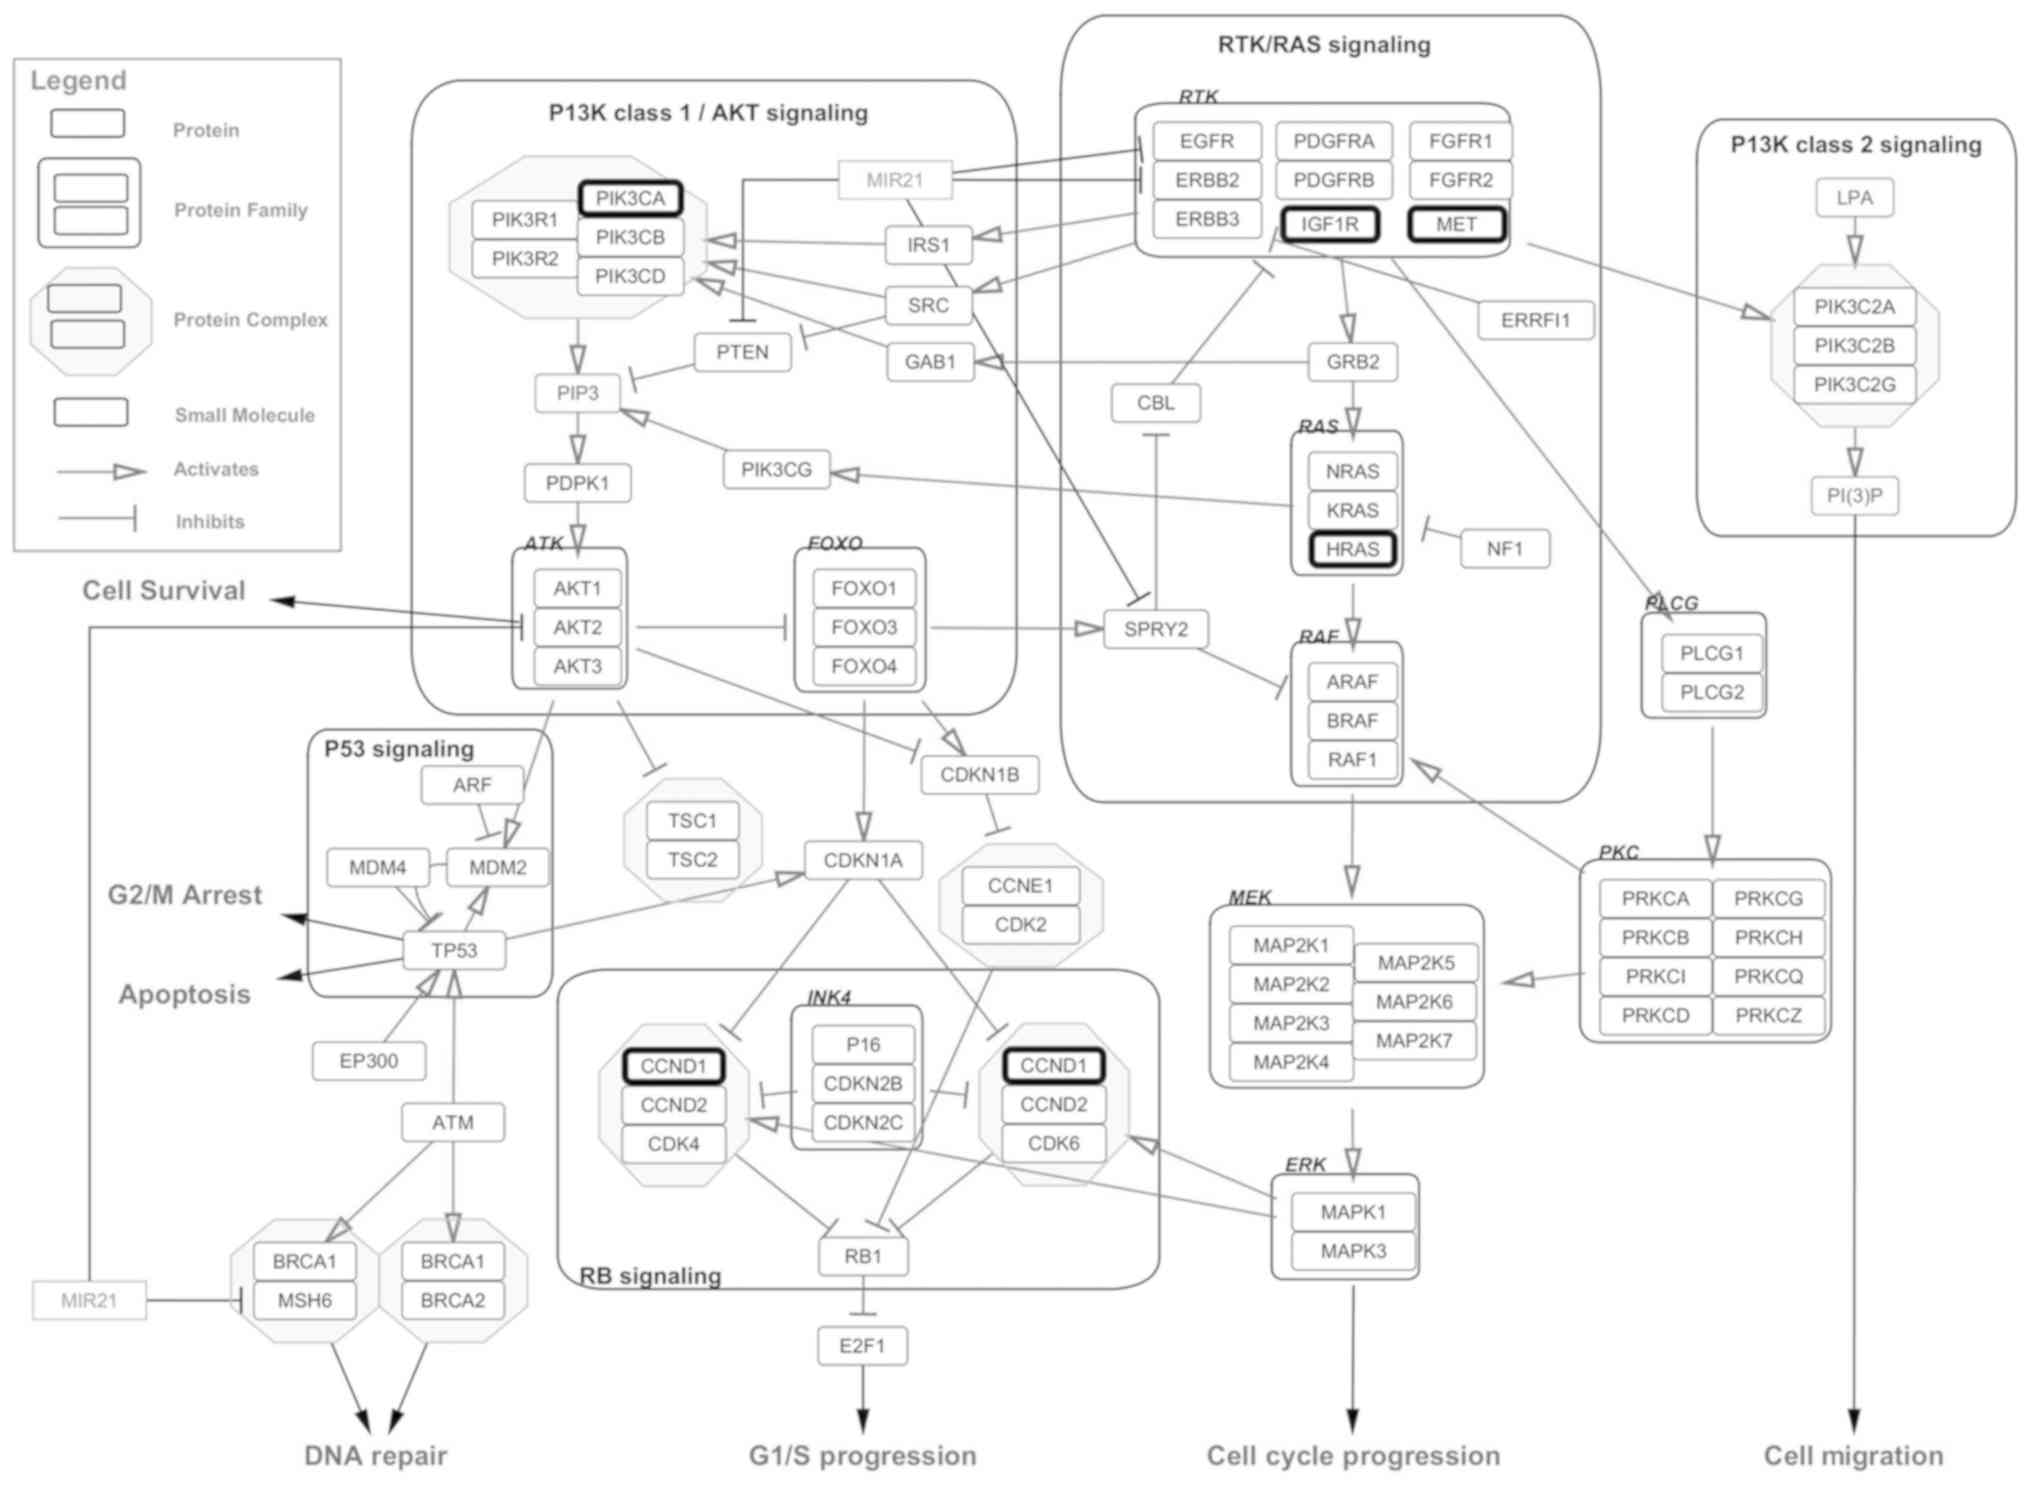 | Figure 5.Pathway Map of Glioblastoma obtained
from Wikipathways using Cytoscape. Targets genes of deregulated
miRNAs are highlighted with thick borders. Five targets of
downregulated miRNAs; CCND1, IGF1R, PIK3CA, HRAS and MET, found to
play an important role in GBM signaling cascades. miRNAs,
microRNAs; CCND1, cyclin D1; IGF1R, insulin like growth factor 1
receptor; PIK3CA, phosphatidylinositol-4,5-biphosphate 3-kinase
catalytic subunit α; HRAS, HRas proto-oncogene, GTPase; MET, MET
proto-oncogene, receptor tyrosine kinase. |
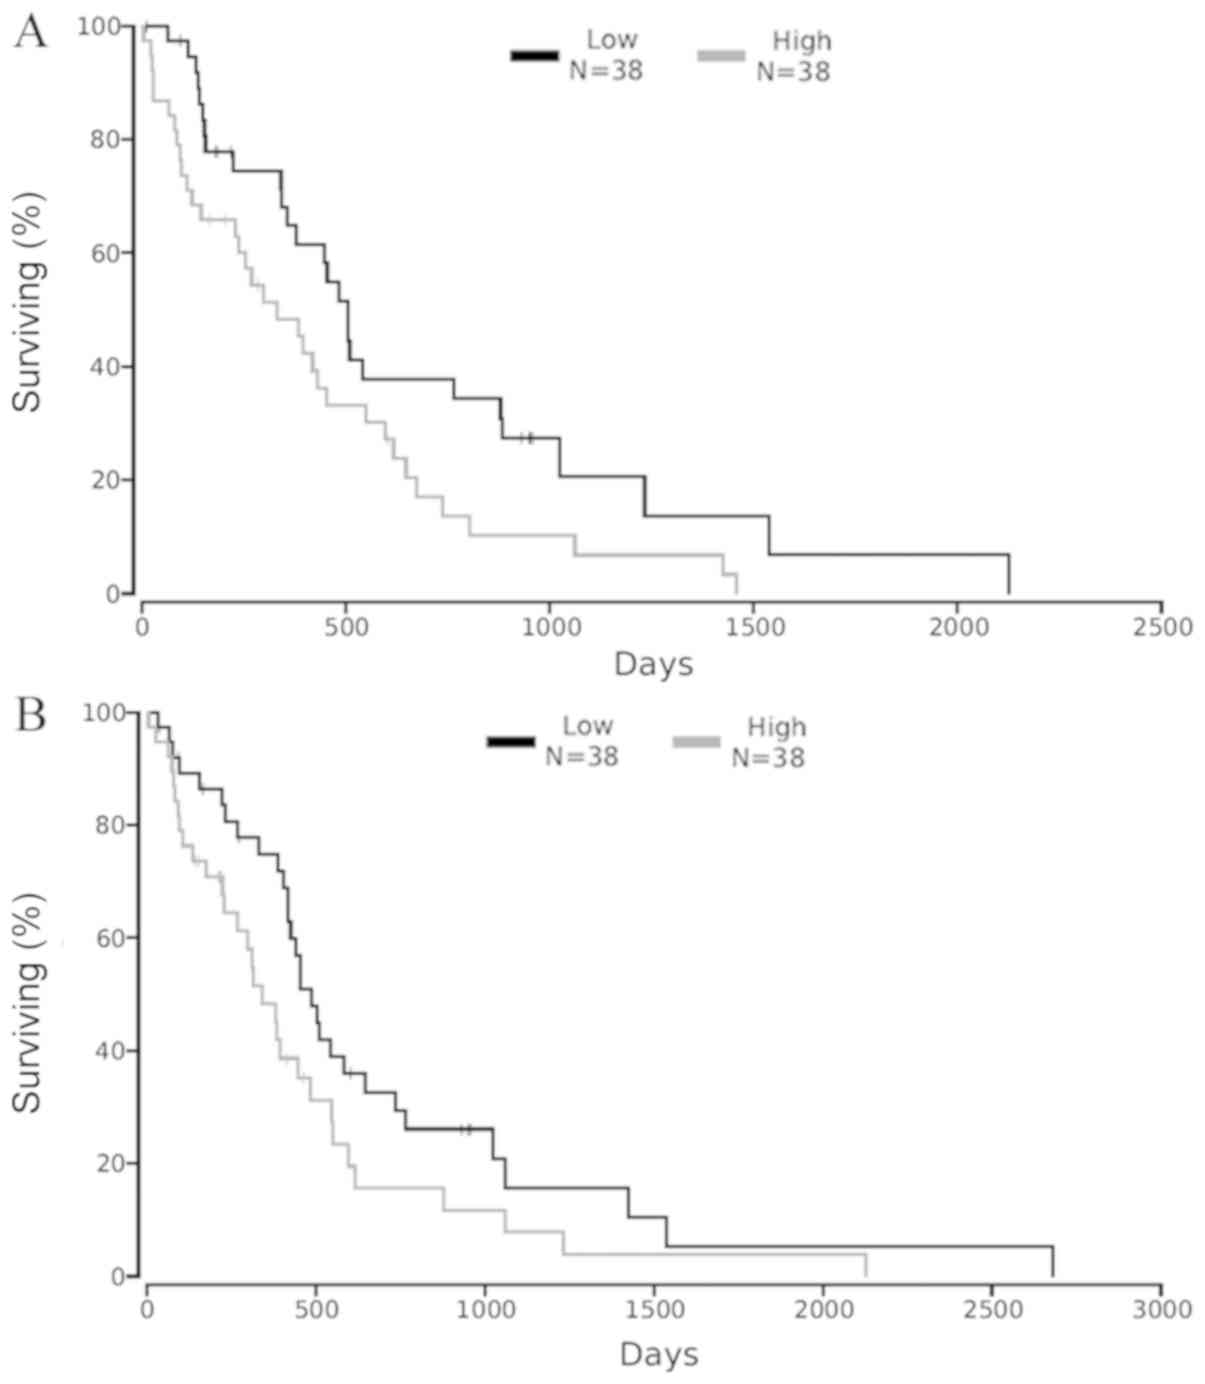
To identify the association between shortlisted
target genes and survival of GBM patients, we used an online tool
that correlates gene expression with patient survival from Cancer
Genome Atlas (TCGA) data called OncoLnc. Patients were categorized
into high expression and low expression groups based on 25th
percentile cut off. Our analysis showed that high levels of HRAS
expression predicted significantly less survival (Cox
Coefficient=0.155), with a Log-rank P-value=0.0242 in GBM patients
(Fig. 6A). Similarly, higher
expression of MET in GBM is correlated with poor patient survival
(Cox Coefficient=0.136), with a Log-rank P-value=0.0529 (Fig. 6B). The three other genes (CCND1,
IGF1R and PIK3CA), did not show any significant difference in the
overall survival of GBM patients. Both HRAS and MET, which are key
players in GBM disease progression, are the targets of
hsa-miR-139-5p. Thus among the 6 miRNAs, down-regulation of
hsa-miR-139-5p could play a very crucial role in the development of
GBM and restoration of the normal expression levels of this miRNA
can be further explored for therapeutic purposes to increase the
overall survival of GBM patients.
Discussion
GBM is a very deadly type of brain cancer with
reduced survival and a high degree of recurrence. Even though
considerable efforts have been taken to find effective treatment
strategies, there is no significant improvement observed with
patient survival. Therefore there is an urgent need for
identification of novel therapeutic approaches which require an
understanding of the molecular markers that play an important role
in the disease progression. Changes in the expression levels of
miRNAs (which are endogenous regulators of tumour suppressor genes
or oncogenes), play a critical role in cancer progression or
development. Analysis of microarray expression data from GEO
indicated 6 miRNAs to be down-regulated in both data sets studied.
Instead of depending on the significance levels based on P-values
for the identification of deregulated miRNAs, False Discovery Rate
(FDR) was calculated on the basis of adjusted p values (Adj
P-Values), which will reduce the probability of false positive
result. This stringent statistical criteria along with a minimum 2
fold difference in expression, is the reason for the low number of
deregulated miRNAs observed in the study. Furthermore, this
methodology increases the confidence of the results for
identification of reliable miRNA signatures in GBM, highly
increasing the probability of obtaining specific miRNA patterns
that are true positives.
Among the deregulated miRNAs, hsa-miR-338-5p, which
showed the highest average downregulation, was already reported to
be involved in the regulation of different types of cancers. In
gastric cancers, hsa-miR-338-5p has been found to be downregulated
and its overexpression in cell lines inhibits cell growth and
proliferation by targeting BMI1 (12). Bioinformatics analysis has also
identified hsa-miR-338-5p as a diagnostic target for hepatocellular
carcinoma (HCC) (13). Furthermore,
in GBM this miRNA was shown to sensitize cancer cells to radiation
by targeting genes involved in DNA damage response (14). Studies have also demonstrated the
ability of this miRNA to inhibit proliferation, suppress migration
and invasion, and induce apoptosis in U87 GBM cell lines (15). Though there are no reports on the
expression of hsa-miR-338-5p in different stages of GBM patients, a
rise in the expression of hsa-miR-338-5p was correlated with
increase in tumor stage in hepatocellular carcinoma (HCC). Reports
of expression analysis based on tumor grade indicate that well
differentiated tissues from HCC have higher expression levels of
the miRNA as compared to poorly or moderately differentiated tumors
(16).
Although there was a strong down-regulation of
hsa-miR-138-2-3p in both the datasets, we were unable to find any
target gene(s) for this miRNA using miRTarBase. There have been no
previous studies thus far that implicate a role for this miRNA in
GBM. However, this miRNA has been reported to play a critical role
in laryngeal cancer by enhancing radio-sensitivity of laryngeal
squamous cancer stem cells. Overexpression of this miRNA also
decreases proliferation and invasion, induces cell cycle arrest,
downregulates β-catenin in Wnt signaling pathway and enhances the
expression of p38 and JNK1 in MAPK signaling pathway (17). Analysis of plasma samples from
non-small cell lung cancer (NSCLC) patients with and without
primary resistance to Tyrosine Kinase Inhibitors (TKIs), showed a
downregulation in the expression level of hsa-miR-138-2-3p in TKI
resistant patients (18). Taken
together, these observations suggest that this miRNA could also
play an important role in GBM. Further analysis and focused studies
are required to identify the target genes of this miRNA and its
expression patterns in different stages of cancer in order to
identify its effects on GBM.
Previous studies have shown downregulation of
miRNA-770-5p in tumors associated with the brain such as gliomas
(19) and medulloblastomas (MB)
(20). Even amongst different types
of brain cancers, the expression levels of hsa-miR-770-5p was
significantly lower in MB as compared to astrocytomas (21). Our observations further support these
studies by demonstrating down-regulation of hsa-miR-770-5p in brain
tumors. There is no direct evidence suggesting a role for this
miRNA in cancers of the central nervous system, but in HCC,
Wnt/β-catenin signaling inhibits the expression of FBXW7, which
serves as a tumor suppressor, by inducing expression of
hsa-miR-770-5p (22). This miRNA
could also be a useful biomarker for predicting the chemoresistance
towards cisplatin in ovarian cancer patients and was found to act
as a tumor suppressor by downregulating ERCC2 expression (23). Reduced expression of hsa-miRNA-770-5p
was observed in higher stages of glioma (WHO grade III and IV) as
compared to lower stages (WHO grade I and II) (19).
Various studies have reported the role of
hsa-miR-383-5p in the regulation of cell proliferation and tumor
growth while upregulation of hsa-miR-383 was shown to induce
G0/G1 phase arrest in glioma cells (24–26).
MicroRNA-383 is reported to be downregulated in MB and
overexpression of this miRNA promoted apoptosis in MB cells. In
glioma patients the expression levels of this miRNA is negatively
correlated with increase in the stage of the tumor (27). Our analysis also showed significant
down-regulation of hsa-miR-383-5p in GBM samples, which is
consistent with and corroborates the observations from previous
studies showing decreased expression of miR-383 in gliomas as
compared to normal brain tissues (25).
MicroRNA-139 is reported to play a significant role
in different types of cancers such as gastric cancer (28), osteosarcomas (29), hepatocellular carcinoma (30), and papillary thyroid carcinoma
(31). MicroRNA-139 was shown to
inhibit proliferation and enhance apoptosis in temozolomide treated
gliomas (32), and is reported to
sensitize ovarian cancer cells to cisplatin chemotherapy (33). Specific studies on the patterns of
hsa-miR-139 in different stages of GBM is absent, but a significant
decrease in the expression of hsa-miR-139 was reported in HCC with
advancement of the disease state. The metastatic tumor tissues
expressed lower levels of hsa-miR-139 compared to their primary
tumor tissues (34). There was a 60%
reduction in hsa-miR-139 expression observed in metastatic lesions
of laryngeal squamous carcinoma cells (LSCC), as compared to
primary LSCC tissues (35). These
observations along with reduced expression of hsa-miR-139 in GBM
implies the possibility of similar expression profiles in different
stages of GBM. MicroRNA-139 precursors could yield two mature
miRNAs, hsa-miR-139-3p and hsa-miR-139-5p. Our study reported the
down-regulation of both these mature miRNAs in GBM tissues.
MicroRNA-139-3p has been reported to serve as a prognostic
biomarker for bile duct cancer (36). Several studies have also indicated
the possibility of using hsa-miR-139-3p as a diagnostic biomarker
for colorectal cancer (37–40). Although there are no reports
describing the role of hsa-miR-139-3p in glioblastoma, our study
shows a significant change in expression levels of this miRNA in
GBM tissues, suggesting a possible role in the development of GBM.
Differences in hsa-miR-139-5p expression patterns have been
described between primary and recurrent glioblastoma (36). Expression levels of miRNA-139-5p were
also reported to predict as well as distinguish between long-term
survivors and short-term survivors of GBM (41). Furthermore, miRNA-139-5p is also
known to suppress the migration, invasion and proliferation of GBM
cells (42,43). Taken together, these findings confirm
hsa-miR-139-5p to play a key role in GBM development and suggests
its possible use as a biomarker for diagnosis of the disease as
well as prediction of overall survival of the patients. Results
from our analysis further support these observations that show a
significant down-regulation of hsa-miR-139-5p in GBM (41,44).
Pathway analysis of target genes of deregulated
miRNAs showed significant enrichment in pathways associated with
cancer. Fourteen genes, namely, HRAS, ROCK2, MET, NFKB1, LPAR1,
IGF1R, WNT1, FOS, CCND1, CXCR4, BCL2, JUN, VEGFA and PIK3CA were
involved in pathways in cancer. The second most enriched pathway
included focal adhesion, which plays a significant role in several
important biological processes such as cell proliferation,
differentiation and motility. An excessive activation of the
PI3K-Akt signaling pathway in GBM induces cell proliferation,
enhanced migratory potential and reduced survival of the patients
(45,46). Deregulation of PI3K-Akt signaling
pathway is observed in a number of tumors including GBM.
Phosphatase and Tensin homolog (PTEN) is a negative regulator of
PI3K pathway, which dephosphorylates phosphoinositide, resulting in
the termination of PI3K pathway signaling. The fact that around 70%
of GBM patients harbor alterations in PTEN expression, shows the
critical role of PI3K pathway in GBM (47,48).
PI3K pathway represses the PTEN transcription, both via activation
of NFkB pathway and by inducing the expression of NEDD4-1, an E3
ligase involved in the ubiquitination of PTEN (48–51). In
pediatric low-grade gliomas (pLGGs), microRNA-139-5p has been
identified to target PIK3CA gene, which encodes the catalytic unit
of PI3K (52). The possibility of
additive regulation of PI3K pathway by PTEN and miR-139-5p in
normal cells cannot be excluded. Down regulation of PI3K targeting
miRNAs may shift the homeostasis of PI3K-PTEN regulatory network,
which in turn results in PTEN down regulation, and further
activation of PI3K pathway (48). In
PTEN negative GBM, down regulation of miRNAs that target PI3K
pathway might lead to hyper activation of PI3K, resulting in an
increase in aggressiveness of cancer. It is not yet determined if
the loss or alteration in PTEN accounts for the down regulation of
PI3K regulating miRNA, or whether the alteration in miRNA
expression results in altered PTEN expression. The association of
PTEN and miRNAs regulating PI3K needs to be further evaluated in
GBM. Prolactin signaling pathway, another pathway enriched with
target genes is found to play dynamic roles in both colorectal
cancer (53) and breast cancer
(54). Nine targets genes were found
to be associated with the HTLV–I infection pathway, which leads to
adult T-cell leukemia (ATL). BMI1, NOTCH1, HRAS, CCND1, MCL1, BCL2,
VEGFA, MET and NFKB1 were enriched in ‘MicroRNAs in cancer
pathway’. Other significantly enriched pathways included, renal
cell carcinoma, prostate cancer and hepatitis B. Amongst the target
genes enriched in different pathways, NFKB1 is found to be
associated with many types of human cancers including GBM (55,56) and
is known to be elevated in glioma cells (57). Overexpression of NFKB1 inhibited the
apoptosis of glioma cells by inducing the BCL2 expression. The over
expression of BCL2, an anti-apoptotic gene, highly expressed in
majority of GBM tissues, is associated with increased resistance to
anti-cancer drugs (58). Inhibition
of BCL2 expression in colorectal cancer cells by hsa-miR-139-5p
reduced the epithelial to mesenchymal transition and improved chemo
sensitivity (59). Studies on
esophageal squamous cell carcinoma showed positive regulation of
MCL1 by NFKB (60). MCL1 is an
oncogene and is a member of BCL2 gene family which is highly
expressed in GBM. MCL1 inhibition in GBM showed induction of
apoptosis and increased chemo sensitivity (61). All these observations show the
critical role of deregulated miRNAs identified in this study, in
the regulation of GBM development and progression. Protein-protein
interaction (PPI) network of targets genes predicted significant
levels of interaction among them and the only single cluster
identified from the network had eight nodes, with VEGFA as the seed
gene. VEGFA is known to play a vital role in a wide variety of
cancers, promoting angiogenesis and inducing cell survival.
Mapping of target genes to the glioblastoma pathway
revealed five genes namely CCND1, IGF1R, PIK3CA, HRAS and MET as a
part of the pathway reiterating the importance of deregulated
miRNAs in the regulation of GBM. hsa-miR-139-5p is known to target
genes such as IGF1R, PIK3CA, HRAS and MET, which might play a very
critical role in the development of GBM. Previous studies have
reported that increased levels of hsa-miR-139-5p showed a
significant improvement in the overall survival of the GBM patients
(41). Concurrent with these
observations, the current study also demonstrated that lowered
expression levels of hsa-miR-139-5p target genes like HRAS and MET,
predicted increased survival in GBM patients.
In conclusion, we have identified differentially
expressed miRNAs in GBM tissues from miRNA expression profiles,
downloaded from GEO. Our analysis identified six downregulated
miRNAs and their targets that might play a crucial role in GBM,
including HRAS and MET. Furthermore, survival analysis showed that
hsa-miR-139-5p could play a significant role in the overall
survival of GBM patients and restoring the levels of this miRNA in
GBM tissues might show a therapeutic advantage in the treatment of
the disease. Further studies are needed for confirmation of our
observations, but this study could provide the basis for
understanding the roles of these miRNAs in GBM.
Acknowledgements
The authors would like to thank Dr Mata
Amritanandamayi (Amrita Vishwa Vidyapeetham) for guidance in the
preparation of the manuscript.
Funding
The University Grants Commission (grant no.
BININ00357398) provided financial assistance in the form of a
fellowship to SS. The present study was supported by institutional
funding (Amrita Vishwa Vidyapeetham; grant no.
AM/ASBT/RE-03/2017).
Availability of data and materials
The datasets generated and/or analyzed during the
presemt study are available in the Gene Expression Omnibus
repository, https://www.ncbi.nlm.nih.gov/geo.
Authors contributions
BN, GK and SS conceived and designed the study. SS,
DS and NM acquired data. SS and DS performed the experiments and
analyzed the data. BN, GK and SS wrote the manuscript. All authors
read and approved the final manuscript. All authors read and
approved the manuscript and agree to be accountable for all aspects
of the research in ensuring that the accuracy or integrity of any
part of the work are appropriately investigated and resolved.
Ethics approval and consent to
participate
Not applicable.
Patient consent for publication
Not applicable.
Competing interests
The authors declare that they have no competing
interests.
References
|
1
|
Ramachandran R, Junnuthula VR, Gowd GS,
Ashokan A, Thomas J, Peethambaran R, Thomas A, Unni AK, Panikar D,
Nair SV and Koyakutty M: Theranostic 3-Dimensional nano
brain-implant for prolonged and localized treatment of recurrent
glioma. Sci Rep. 7:432712017. View Article : Google Scholar : PubMed/NCBI
|
|
2
|
Malhotra M, Sekar TV, Ananta JS,
Devulapally R, Afjei R, Babikir HA, Paulmurugan R and Massoud TF:
Targeted nanoparticle delivery of therapeutic antisense microRNAs
presensitizes glioblastoma cells to lower effective doses of
temozolomide in vitro and in a mouse model. Oncotarget.
9:21478–21494. 2018. View Article : Google Scholar : PubMed/NCBI
|
|
3
|
Wong ET, Hess KR, Gleason MJ, Jaeckle KA,
Kyritsis AP, Prados MD, Levin VA and Yung WK: Outcomes and
prognostic factors in recurrent glioma patients enrolled onto phase
II clinical trials. J Clin Oncol. 17:2572–2578. 1999. View Article : Google Scholar : PubMed/NCBI
|
|
4
|
Lamborn KR, Yung WK, Chang SM, Wen PY,
Cloughesy TF, DeAngelis LM, Robins HI, Lieberman FS, Fine HA, Fink
KL, et al: Progression-free survival: An important end point in
evaluating therapy for recurrent high-grade gliomas. Neuro Oncol.
10:162–170. 2008. View Article : Google Scholar : PubMed/NCBI
|
|
5
|
Schmalz PG, Shen MJ and Park JK: Treatment
resistance mechanisms of malignant glioma tumor stem cells. Cancers
(Basel). 3:621–635. 2011. View Article : Google Scholar : PubMed/NCBI
|
|
6
|
Lee RC, Feinbaum RL and Ambros V: The C.
Elegans heterochronic gene lin-4 encodes small RNAs with antisense
complementarity to lin-14. Cell. 75:843–854. 1993. View Article : Google Scholar : PubMed/NCBI
|
|
7
|
Calin GA, Dumitru CD, Shimizu M, Bichi R,
Zupo S, Noch E, Aldler H, Rattan S, Keating M, Rai K, et al:
Frequent deletions and down-regulation of micro-RNA genes miR15 and
miR16 at 13q14 in chronic lymphocytic leukemia. Proc Natl Acad Sci
USA. 99:15524–15529. 2002. View Article : Google Scholar : PubMed/NCBI
|
|
8
|
Khan AA, Advani J, Patel K, Nanjappa V,
Datta KK, Solanki HS, Kumar P, Mathur PP, Nair B, Keshava Prasad
TS, et al: Chronic exposure to cigarette smoke and chewing tobacco
alters expression of microRNAs in esophageal epithelial cells.
Microrna. 7:28–37. 2018. View Article : Google Scholar : PubMed/NCBI
|
|
9
|
Cai Y, Yu X, Hu S and Yu J: A brief review
on the mechanisms of miRNA regulation. Genomics Proteomics
Bioinformatics. 7:147–154. 2009. View Article : Google Scholar : PubMed/NCBI
|
|
10
|
Zhang B, Pan X, Cobb GP and Anderson TA:
microRNAs as oncogenes and tumor suppressors. Dev Biol. 302:1–12.
2007. View Article : Google Scholar : PubMed/NCBI
|
|
11
|
Reddy KB: MicroRNA (miRNA) in cancer.
Cancer Cell Int. 15:382015. View Article : Google Scholar : PubMed/NCBI
|
|
12
|
Tong D, Zhao L, He K, Sun H, Cai D, Ni L,
Sun R, Chang S, Song T and Huang C: MECP2 promotes the growth of
gastric cancer cells by suppressing miR-338-mediated
antiproliferative effect. Oncotarget. 7:34845–34859. 2016.
View Article : Google Scholar : PubMed/NCBI
|
|
13
|
Liang L, Gao L, Zou XP, Huang ML, Chen G,
Li JJ and Cai XY: Diagnostic significance and potential function of
miR-338-5p in hepatocellular carcinoma: A bioinformatics study with
microarray and RNA sequencing data. Mol Med Rep. 17:2297–2312.
2018.PubMed/NCBI
|
|
14
|
Besse A, Sana J, Lakomy R, Kren L, Fadrus
P, Smrcka M, Hermanova M, Jancalek R, Reguli S, Lipina R, et al:
MiR-338-5p sensitizes glioblastoma cells to radiation through
regulation of genes involved in DNA damage response. Tumour Biol.
37:7719–7727. 2016. View Article : Google Scholar : PubMed/NCBI
|
|
15
|
Lei D, Zhang F, Yao D, Xiong N, Jiang X
and Zhao H: MiR-338-5p suppresses proliferation, migration,
invasion, and promote apoptosis of glioblastoma cells by directly
targeting EFEMP1. Biomed Pharmacother. 89:957–965. 2017. View Article : Google Scholar : PubMed/NCBI
|
|
16
|
Huang XH, Wang Q, Chen JS, Fu XH, Chen XL,
Chen LZ, Li W, Bi J, Zhang LJ, Fu Q, et al: Bead-based microarray
analysis of microRNA expression in hepatocellular carcinoma:
miR-338 is downregulated. Hepatol Res. 39:786–794. 2009. View Article : Google Scholar : PubMed/NCBI
|
|
17
|
Zhu Y, Shi LY, Lei YM, Bao YH, Li ZY, Ding
F, Zhu GT, Wang QQ and Huang CX: Radiosensitization effect of
hsa-miR-138-2-3p on human laryngeal cancer stem cells. PeerJ.
5:e32332017. View Article : Google Scholar : PubMed/NCBI
|
|
18
|
Ma Y, Pan X, Xu P, Mi Y, Wang W, Wu X, He
Q, Liu X, Tang W and An HX: Plasma microRNA alterations between
EGFR-activating mutational NSCLC patients with and without primary
resistance to TKI. Oncotarget. 8:88529–88536. 2017.PubMed/NCBI
|
|
19
|
Zhang JF, Zhang JS, Zhao ZH, Yang PB, Ji
SF, Li N, Shi QD, Tan J, Xu X, Xu CB and Zhao LY: MicroRNA-770
affects proliferation and cell cycle transition by directly
targeting CDK8 in glioma. Cancer Cell Int. 18:1952018. View Article : Google Scholar : PubMed/NCBI
|
|
20
|
Dai J, Li Q, Bing Z, Zhang Y, Niu L, Yin
H, Yuan G and Pan Y: Comprehensive analysis of a microRNA
expression profile in pediatric medulloblastoma. Mol Med Rep.
15:4109–4115. 2017. View Article : Google Scholar : PubMed/NCBI
|
|
21
|
Eguia-Aguilar P, Gutierrez-Castillo L and
Perezpena-Diazconti M: Expression of microRNAs in tumors of the
central nervous system in pediatric patients in México. Childs Nerv
Syst. 33:2117–2128. 2017. View Article : Google Scholar : PubMed/NCBI
|
|
22
|
Wu WJ, Shi J, Hu G, Yu X, Lu H, Yang ML,
Liu B and Wu ZX: Wnt/β-catenin signaling inhibits FBXW7 expression
by upregulation of microRNA-770 in hepatocellular carcinoma. Tumour
Biol. 37:6045–6051. 2016. View Article : Google Scholar : PubMed/NCBI
|
|
23
|
Zhao H, Yu X, Ding Y, Zhao J, Wang G, Wu
X, Jiang J, Peng C, Guo GZ and Cui S: MiR-770-5p inhibits cisplatin
chemoresistance in human ovarian cancer by targeting ERCC2.
Oncotarget. 7:53254–53268. 2016.PubMed/NCBI
|
|
24
|
Lian J, Tian H, Liu L, Zhang XS, Li WQ,
Deng YM, Yao GD, Yin MM and Sun F: Downregulation of microRNA-383
is associated with male infertility and promotes testicular
embryonal carcinoma cell proliferation by targeting IRF1. Cell
Death Dis. 1:e942010. View Article : Google Scholar : PubMed/NCBI
|
|
25
|
Xu Z, Zeng X, Tian D, Xu H, Cai Q, Wang J
and Chen Q: MicroRNA-383 inhibits anchorage-independent growth and
induces cell cycle arrest of glioma cells by targeting CCND1.
Biochem Biophys Res Commun. 453:833–838. 2014. View Article : Google Scholar : PubMed/NCBI
|
|
26
|
Lü M, Tian H, Cao YX, He X, Chen L, Song
X, Ping P, Huang H and Sun F: Downregulation of
miR-320a/383-sponge-like long non-coding RNA NLC1-C (narcolepsy
candidate-region 1 genes) is associated with male infertility and
promotes testicular embryonal carcinoma cell proliferation. Cell
Death Dis. 6:e19602015. View Article : Google Scholar : PubMed/NCBI
|
|
27
|
Xu D, Ma P, Gao G, Gui Y, Niu X and Jin B:
MicroRNA-383 expression regulates proliferation, migration,
invasion, and apoptosis in human glioma cells. Tumour Biol.
36:7743–7753. 2015. View Article : Google Scholar : PubMed/NCBI
|
|
28
|
Yu X, Ma C, Fu L, Dong J and Ying J:
MicroRNA-139 inhibits the proliferation, migration and invasion of
gastric cancer cells by directly targeting ρ-associated protein
kinase 1. Oncol Lett. 15:5977–5982. 2018.PubMed/NCBI
|
|
29
|
Su S and Nie X: MiR-139 prompts the
development of osteosarcomas mainly through targeting ROCK1.
Pharmazie. 72:759–763. 2017.PubMed/NCBI
|
|
30
|
Zhang P, Yin J, Yuan L, Bai Q and Lu J:
microRNA-139 suppresses proliferation of hepatocellular carcinoma
cells by silencing of B cell translocation gene 3. Xi Bao Yu Fen Zi
Mian Yi Xue Za Zhi. 33:1516–1520. 2017.(In Chinese). PubMed/NCBI
|
|
31
|
Ye Y, Zhuang J, Wang G, He S, Ni J and Xia
W: MicroRNA-139 targets fibronectin 1 to inhibit papillary thyroid
carcinoma progression. Oncol Lett. 14:7799–7806. 2017.PubMed/NCBI
|
|
32
|
Li RY, Chen LC, Zhang HY, Du WZ, Feng Y,
Wang HB, Wen JQ, Liu X, Li XF, Sun Y, et al: MiR-139 inhibits Mcl-1
expression and potentiates TMZ-induced apoptosis in glioma. CNS
Neurosci Ther. 19:477–483. 2013. View Article : Google Scholar : PubMed/NCBI
|
|
33
|
Xiao F, Li Y, Wan Y and Xue M:
MircroRNA-139 sensitizes ovarian cancer cell to cisplatin-based
chemotherapy through regulation of ATP7A/B. Cancer Chemother
Pharmacol. 81:935–947. 2018. View Article : Google Scholar : PubMed/NCBI
|
|
34
|
Wong CC, Wong CM, Tung EK, Au SL, Lee JM,
Poon RT, Man K and Ng IO: The microRNA miR-139 suppresses
metastasis and progression of hepatocellular carcinoma by
down-regulating Rho-kinase 2. Gastroenterology. 140:322–331. 2011.
View Article : Google Scholar : PubMed/NCBI
|
|
35
|
Luo HN, Wang ZH, Sheng Y, Zhang Q, Yan J,
Hou J, Zhu K, Cheng Y, Xu YL, Zhang XH, et al: MiR-139 targets
CXCR4 and inhibits the proliferation and metastasis of laryngeal
squamous carcinoma cells. Med Oncol. 31:7892014. View Article : Google Scholar : PubMed/NCBI
|
|
36
|
Bo LJ, Wei B, Li ZH, Wang ZF, Gao Z and
Miao Z: Bioinformatics analysis of miRNA expression profile between
primary and recurrent glioblastoma. Eur Rev Med Pharmacol Sci.
19:3579–3586. 2015.PubMed/NCBI
|
|
37
|
Lin M, Chen W, Huang J, Gao H, Ye Y, Song
Z and Shen X: MicroRNA expression profiles in human colorectal
cancers with liver metastases. Oncol Rep. 25:739–747.
2011.PubMed/NCBI
|
|
38
|
Kanaan Z, Roberts H, Eichenberger MR,
Billeter A, Ocheretner G, Pan J, Rai SN, Jorden J, Williford A and
Galandiuk S: A plasma microRNA panel for detection of colorectal
adenomas: A step toward more precise screening for colorectal
cancer. Ann Surg. 258:400–408. 2013. View Article : Google Scholar : PubMed/NCBI
|
|
39
|
Chen WC, Lin MS, Ye YL, Gao HJ, Song ZY
and Shen XY: microRNA expression pattern and its alteration
following celecoxib intervention in human colorectal cancer. Exp
Ther Med. 3:1039–1048. 2012. View Article : Google Scholar : PubMed/NCBI
|
|
40
|
Liu X, Duan B, Dong Y, He C, Zhou H, Sheng
H, Gao H and Zhang X: MicroRNA-139-3p indicates a poor prognosis of
colon cancer. Int J Clin Exp Pathol. 7:8046–8052. 2014.PubMed/NCBI
|
|
41
|
Yuan GQ, Wei NL, Mu LY, Wang XQ, Zhang YN,
Zhou WN and Pan YW: A 4-miRNAs signature predicts survival in
glioblastoma multiforme patients. Cancer Biomark. 20:443–452. 2017.
View Article : Google Scholar : PubMed/NCBI
|
|
42
|
Yue S, Wang L, Zhang H, Min Y, Lou Y, Sun
H, Jiang Y, Zhang W, Liang A, Guo Y, et al: miR-139-5p suppresses
cancer cell migration and invasion through targeting ZEB1 and ZEB2
in GBM. Tumour Biol. 36:6741–6749. 2015. View Article : Google Scholar : PubMed/NCBI
|
|
43
|
Dai S, Wang X, Li X and Cao Y:
MicroRNA-139-5p acts as a tumor suppressor by targeting ELTD1 and
regulating cell cycle in glioblastoma multiforme. Biochem Biophys
Res Commun. 467:204–210. 2015. View Article : Google Scholar : PubMed/NCBI
|
|
44
|
Sana J, Radova L, Lakomy R, Kren L, Fadrus
P, Smrcka M, Besse A, Nekvindova J, Hermanova M, Jancalek R, et al:
Risk Score based on microRNA expression signature is independent
prognostic classifier of glioblastoma patients. Carcinogenesis.
35:2756–2762. 2014. View Article : Google Scholar : PubMed/NCBI
|
|
45
|
Westhoff MA, Karpel-Massler G, Brühl O,
Enzenmüller S, La Ferla-Brühl K, Siegelin MD, Nonnenmacher L and
Debatin KM: A critical evaluation of PI3K inhibition in
glioblastoma and neuroblastoma therapy. Mol Cell Ther. 2:322014.
View Article : Google Scholar : PubMed/NCBI
|
|
46
|
Langhans J, Schneele L, Trenkler N, von
Bandemer H, Nonnenmacher L, Karpel-Massler G, Siegelin MD, Zhou S,
Halatsch ME, Debatin KM and Westhoff MA: The effects of
PI3K-mediated signalling on glioblastoma cell behaviour.
Oncogenesis. 6:3982017. View Article : Google Scholar : PubMed/NCBI
|
|
47
|
Xu J, Li Z, Wang J, Chen H and Fang JY:
Combined PTEN mutation and protein expression associate with
overall and disease-free survival of glioblastoma patients. Transl
Oncol. 7:196–205.e1. 2014. View Article : Google Scholar : PubMed/NCBI
|
|
48
|
Carracedo A and Pandolfi PP: The PTEN-PI3K
pathway: Of feedbacks and cross-talks. Oncogene. 27:5527–5541.
2008. View Article : Google Scholar : PubMed/NCBI
|
|
49
|
Vasudevan KM, Gurumurthy S and Rangnekar
VM: Suppression of PTEN expression by NF-kappa B prevents
apoptosis. Mol Cell Biol. 24:1007–1021. 2004. View Article : Google Scholar : PubMed/NCBI
|
|
50
|
Wang X, Trotman LC, Koppie T, Alimonti A,
Chen Z, Gao Z, Wang J, Erdjument-Bromage H, Tempst P, Cordon-Cardo
C, et al: NEDD4-1 is a proto-oncogenic ubiquitin ligase for PTEN.
Cell. 128:129–139. 2007. View Article : Google Scholar : PubMed/NCBI
|
|
51
|
Ahn Y, Hwang CY, Lee SR, Kwon KS and Lee
C: The tumour suppressor PTEN mediates a negative regulation of the
E3 ubiquitin-protein ligase Nedd4. Biochem J. 412:331–338. 2008.
View Article : Google Scholar : PubMed/NCBI
|
|
52
|
Catanzaro G, Besharat ZM, Miele E,
Chiacchiarini M, Po A, Carai A, Marras CE, Antonelli M, Badiali M,
Raso A, et al: The miR-139-5p regulates proliferation of
supratentorial paediatric low-grade gliomas by targeting the
PI3K/AKT/mTORC1 signalling. Neuropathol Appl Neurobiol. 44:687–706.
2018. View Article : Google Scholar : PubMed/NCBI
|
|
53
|
Neradugomma NK, Subramaniam D, Tawfik OW,
Goffin V, Kumar TR, Jensen RA and Anant S: Prolactin signaling
enhances colon cancer stemness by modulating Notch signaling in a
Jak2-STAT3/ERK manner. Carcinogenesis. 35:795–806. 2014. View Article : Google Scholar : PubMed/NCBI
|
|
54
|
Tworoger SS and Hankinson SE: Prolactin
and breast cancer etiology: An epidemiologic perspective. J Mammary
Gland Biol Neoplasia. 13:41–53. 2008. View Article : Google Scholar : PubMed/NCBI
|
|
55
|
Yang TQ, Chen M, Wang YQ, Xu W, Han Y, Xu
J, Xiang YJ, Yuan B, Wang HZ and Zhou YX: Nuclear factor-kappa B1
inhibits early apoptosis of glioma cells by promoting the
expression of Bcl-2. Onco Targets Ther. 10:4305–4313. 2017.
View Article : Google Scholar : PubMed/NCBI
|
|
56
|
Kina I, Sultuybek GK, Soydas T, Yenmis G,
Biceroglu H, Dirican A, Uzan M and Ulutin T: Variations in
Toll-like receptor and nuclear factor-kappa B genes and the risk of
glioma. Br J Neurosurg. 33:165–170. 2019. View Article : Google Scholar : PubMed/NCBI
|
|
57
|
Hayashi S, Yamamoto M, Ueno Y, Ikeda K,
Ohshima K, Soma G and Fukushima T: Expression of nuclear
factor-kappa B, tumor necrosis factor receptor type 1, and c-Myc in
human astrocytomas. Neurol Med Chir (Tokyo). 41:187–195. 2001.
View Article : Google Scholar : PubMed/NCBI
|
|
58
|
Fels C, Schäfer C, Hüppe B, Bahn H,
Heidecke V, Kramm CM, Lautenschläger C and Rainov NG: Bcl-2
expression in higher-grade human glioma: A clinical and
experimental study. J Neurooncol. 48:207–216. 2000. View Article : Google Scholar : PubMed/NCBI
|
|
59
|
Li Q, Liang X, Wang Y, Meng X, Xu Y, Cai
S, Wang Z, Liu J and Cai G: miR-139-5p inhibits the
epithelial-mesenchymal transition and enhances the chemotherapeutic
sensitivity of colorectal cancer cells by downregulating BCL2. Sci
Rep. 6:271572016. View Article : Google Scholar : PubMed/NCBI
|
|
60
|
Liu H, Yang J, Yuan Y, Xia Z, Chen M, Xie
L, Ma X, Wang J, Ouyang S, Wu Q, et al: Regulation of Mcl-1 by
constitutive activation of NF-κB contributes to cell viability in
human esophageal squamous cell carcinoma cells. BMC Cancer.
14:982014. View Article : Google Scholar : PubMed/NCBI
|
|
61
|
Day BW, Stringer BW, Spanevello MD,
Charmsaz S, Jamieson PR, Ensbey KS, Carter JC, Cox JM, Ellis VJ,
Brown CL, et al: ELK4 neutralization sensitizes glioblastoma to
apoptosis through downregulation of the anti-apoptotic protein
Mcl-1. Neuro Oncol. 13:1202–1212. 2011. View Article : Google Scholar : PubMed/NCBI
|