Introduction
Cholangiocarcinoma (CCA) is a biliary malignancy
which originates in the bile duct epithelium and can be
subclassified according to the location as intrahepatic,
extrahepatic or perihilar (1–3).
Although rare, the incidence of CCA has increased in the past
decade (2,3). CCA is prone to lymphatic metastasis and
has a high mortality rate. CCA may be difficult to diagnose until
advanced stages of the disease. The majority of patients with CCA
are diagnosed at an advanced stage of the disease, when
loco-regional invasion or distant metastasis has occurred (2,3).
Curative surgical intervention for patients in an early stage is
unlikely (2). Although the
diagnostic methods for CCA have improved, several patients with CCA
face delayed or inaccurate diagnoses, resulting in a decreased
five-year overall survival time (3).
This suggests that novel biomarkers for the early diagnosis of CCA
as well as specific targeted therapy are required to improve
patient outcomes in CCA.
Next generation RNA sequencing technology has
revealed the complexity and diversity of the human genome (4). Non-coding RNAs (ncRNAs) constitute the
majority of the transcriptome and include microRNAs (miRNAs), long
non-coding RNAs (lncRNAs) and circle-RNAs (4–6). ncRNAs
are involved in several important biological functions, such as RNA
transcription and intracellular and intercellular communication
(4). Furthermore, lncRNAs may serve
as novel biomarkers and drug targets, in different types of cancer,
including renal, breast and prostate cancer (5,6).
However, the mechanism by which lncRNAs regulate the expression of
genes remains unclear.
Salmena et al (7) proposed the competing endogenous RNA
(ceRNA) hypothesis, which suggest that lncRNAs may act as ceRNAs to
suppress miRNA function by sharing one or more miRNA response
elements. This hypothesis has since been supported by a number of
studies (8,9). lncRNAs may modulate genes at the
protein-coding level and take part in the regulation of cellular
processes by competing with miRNAs (10,11). The
importance of the lncRNA-miRNA-mRNA regulatory network in tumor
pathogenesis and progression has been demonstrated in numerous
studies (12–14). However, the role of the ceRNA network
in CCA has not been elucidated and requires further
investigation.
Weighted gene co-expression network analysis (WGCNA)
is a novel systems biology method for describing the correlation
patterns among genes across microarray samples (15,16).
WGCNA may be used to identify modules of highly related genes, to
summarize such clusters using eigengenes or intramodular hub genes,
to associate modules to one another and to external sample traits,
and to calculate module membership measures (17,18).
Correlation networks may be applied to network-based gene screening
methods that can be used to identify candidate biomarkers or
therapeutic targets (17–19). The present study performed WGCNA and
multiple database analyses to construct a ceRNA network to
elucidate the interactions between differentially expressed (DE)
lncRNAs, DEmiRNAs and DEmRNAs in CCA.
Materials and methods
Study population
A total of 45 CCA samples were used in a
comprehensive integrated analysis, including 36 samples from
patients and 9 from healthy controls. The dataset was downloaded
from the The Cancer Genome Atlas database (TCGA; cancergenome.nih.gov) using the Genomics Data Commons
Data Transfer Tool, release number 16.0 (gdc.cancer.gov/access-data/gdc-data-transfer-tool).
The data included a level three gene expression file of mRNAseq and
miRNAseq data as well as patient clinical information. The current
study met the publication guidelines provided by TCGA (cancergenome.nih.gov/publications/publicationguidelines).
Differential expression analysis
The mRNAseq data used in the current study were
derived from 45 samples, including 36 CCA samples (tumor cohort)
and 9 normal tissue samples that were extracted from adjacent
tissues (normal cohort). The data from the two types of samples
were merged and the data points that were close to zero were
removed. The ‘DESeq’ package (www.bioconductor.org/packages/DESeq)in R software
version 3.5.2 (www.r-project.org) was used to identify the DEmRNAs
and DEmiRNAs. A threshold of |log2 fold change (FC)|>2.0 and an
adjusted P<0.01 were used to select the DEmRNAs and DEmiRNAs.
The Encyclopedia of DNA Elements (www.encodeproject.org) was used to define and annotate
the lncRNAs. The DElncRNAs with cut-off criteria of |log2
FC|>2.0 and an adjusted P<0.01 were selected. To remove any
potential noise, the FC values associated with the comparisons that
were not considered significant by the ‘limma’ package (www.bioconductor.org/packages/limma) or
potentially significant by threshold-filtering were converted to
‘zero’, where the log2 scale corresponded with the complete absence
of differential regulation among all samples. In addition, the
GeneCards database (https://www.genecards.org/) was used for annotation,
as it is a searchable, integrative database that provides
comprehensive information on all annotated human genes.
Weighted gene co-expression network
construction and functional annotation
WGCNA, a systematic biology method, describes the
co-expression patterns between genes across microarray samples.
WGCNA can be used for identifying modules of highly correlated
genes, for summarizing these clusters using the module eigengene or
an intramodular hub gene, for relating modules to one another and
to external sample traits, and for calculating module membership
measures. Co-expression networks facilitate network-based gene
screening methods that can be used to identify candidate biomarkers
or therapeutic targets (18).
Therefore, to identify the interactions between the differentially
expressed genes (DEGs), the ‘WGCNA’ package (www.bioconductor.org/packages/WGCNA) in R software was
used to identify co-expression modules, with a power cut-off
threshold of four and a minimum module size limited to 20 in the
present study.
In order to confirm Kyoto Encyclopedia of Genes and
Genomes (KEGG; genome.jp/kegg) pathways of DEGs, the ‘cluster
profiler’ package (www.bioconductor.org/packages/clusterprofiler) in
R software was used to annotate the function of the different
module genes. The Search Tool for the Retrieval of Interacting
Genes (STRING; www.string-db.org) was subsequently used to evaluate
the protein-protein interaction (PPI) network for the different
colored modules, and Cytoscape software 3.2.0 (https://cytoscape.org/) was used to construct the PPI
network.
Construction of the ceRNA network
To investigate the association between lncRNA and
miRNA in the ceRNA network, a coexpression network of DEmRNA,
DEmiRNA and DElncRNA and was constructed using Cytoscape software.
The pairs of miRNA-mRNA were selected using miRTarBase (http://mirtarbase.mbc.nctu.edu.tw) (20). The data in miRTarBase has been
verified by various methods, including the reporter assay, reverse
transcription quantitative PCR, western blotting, microarray and
next-generation sequencing experiments. Furthermore, the
lncRNA-miRNA interactions were assessed using the miRcode database
(www.mircode.org), which includes >10,000
lncRNA genes (21).
Survival and co-expression
analysis
The clinical data of patients with CCA were used to
identify the prognostic DE RNA signatures and a multivariate Cox
proportional hazard regression analysis was performed. The
regression coefficient of each gene was determined using the
‘survival’ package (www.bioconductor.org/packages/surival) in R software.
The coefficient of each selected gene presented the estimated
logarithm of the hazard ratio. The risk score formula was used to
define the high- and low-risk groups. The Kaplan-Meier method was
used to assess the survival time difference between two groups
using the log-rank test. P<0.05 was considered to indicate a
statistically significant difference.
Pearson's correlation coefficient
analysis
The Pearson's correlation coefficient was used to
identify the correlations between DElncRNAs and DEmRNAs involved in
the established ceRNA network. P<0.01 and R>0.5 were used to
indicate a statistically significant difference.
Results
Identification of DEmRNAs, DEmiRNAs
and DElncRNAs
The clinical information of the patients from whom
the 36 CCA samples were obtained is presented in Table I. Using the ‘DESeq’ package in R
software, 1,095 DEmRNAs and 75 DEmiRNAs were identified. The
results obtained in the current study indicated that there were 862
(78.72%) upregulated and 233 (21.28%) downregulated DEmRNAs. In
addition, a total of 70 upregulated and 5 downregulated DEmiRNAs
were identified. Furthermore, a total of 485 aberrantly expressed
lncRNAs in CCA tissues compared with normal tissues were identified
using the GeneCards database The heatmap clustering of DEmRNAs,
DEmiRNAs and DElncRNA is presented in Figs. S1–3.
 | Table I.Clinical characteristics of the 36
patients with cholangiocarcinoma. |
Table I.
Clinical characteristics of the 36
patients with cholangiocarcinoma.
| Variables | Patient
characteristics |
|---|
| Age, mean years ±
SD | 63.48±12.85 |
| Overall survival
time, mean months ± SD | 25.49±18.56 |
| Sex, n (%) |
|
|
Male | 16 (44.4) |
|
Female | 20 (55.6) |
| Ethnicity, n
(%) |
|
|
Caucasian | 31 (86.2) |
|
Asian | 3 (8.3) |
| African
American | 2 (5.5) |
| Tumor stage, n
(%) |
|
| Stage
I | 19 (52.7) |
| Stage
II | 9 (25.0) |
| Stage
III | 1 (2.8) |
| Stage
IV | 2 (5.6) |
| Stage
IVa | 2 (5.6) |
| Stage
IVb | 3 (8.3) |
| Alive, n (%) |
|
|
Yes | 18 (50.0) |
| No | 18 (50.0) |
Construction of weighted gene
co-expression modules
In order to identify the functional clusters in
patients with CCA, the gene co-expression network analysis of 1,095
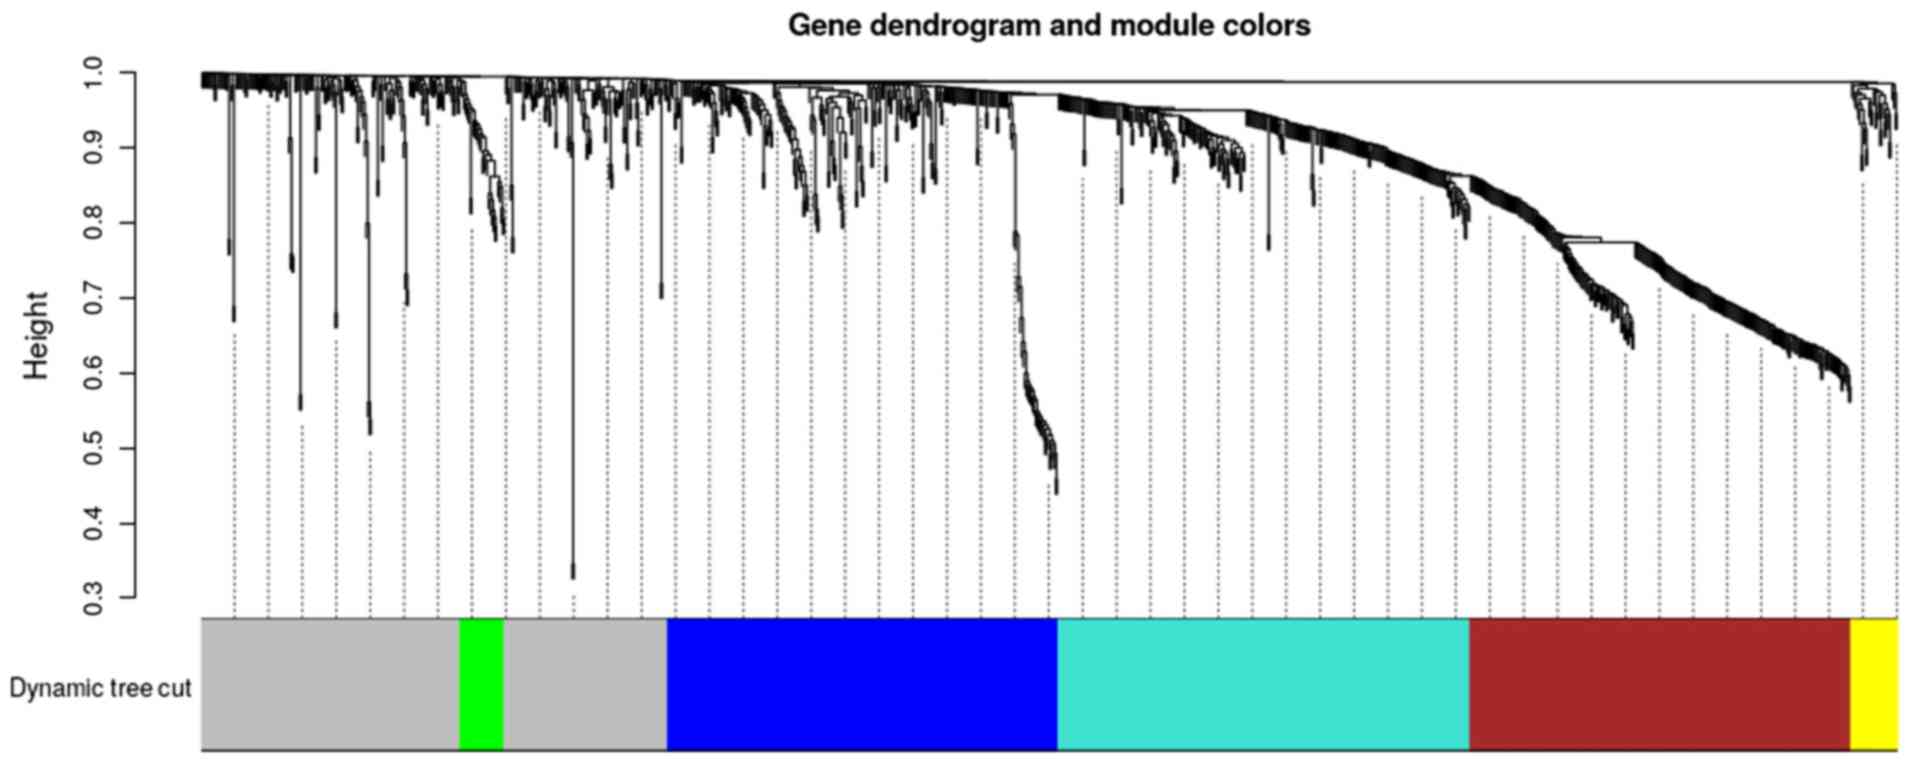
DEmRNAs was performed by WGCNA. As illustrated in Fig. 1, six color modules were clustered,
while the non-clustering DEmRNAs were presented in grey. Each
branch in the dendrogram signified a single gene. The area occupied
by each color illustrated the number of genes within the
corresponding module.
PPI and functional annotation for the
modules
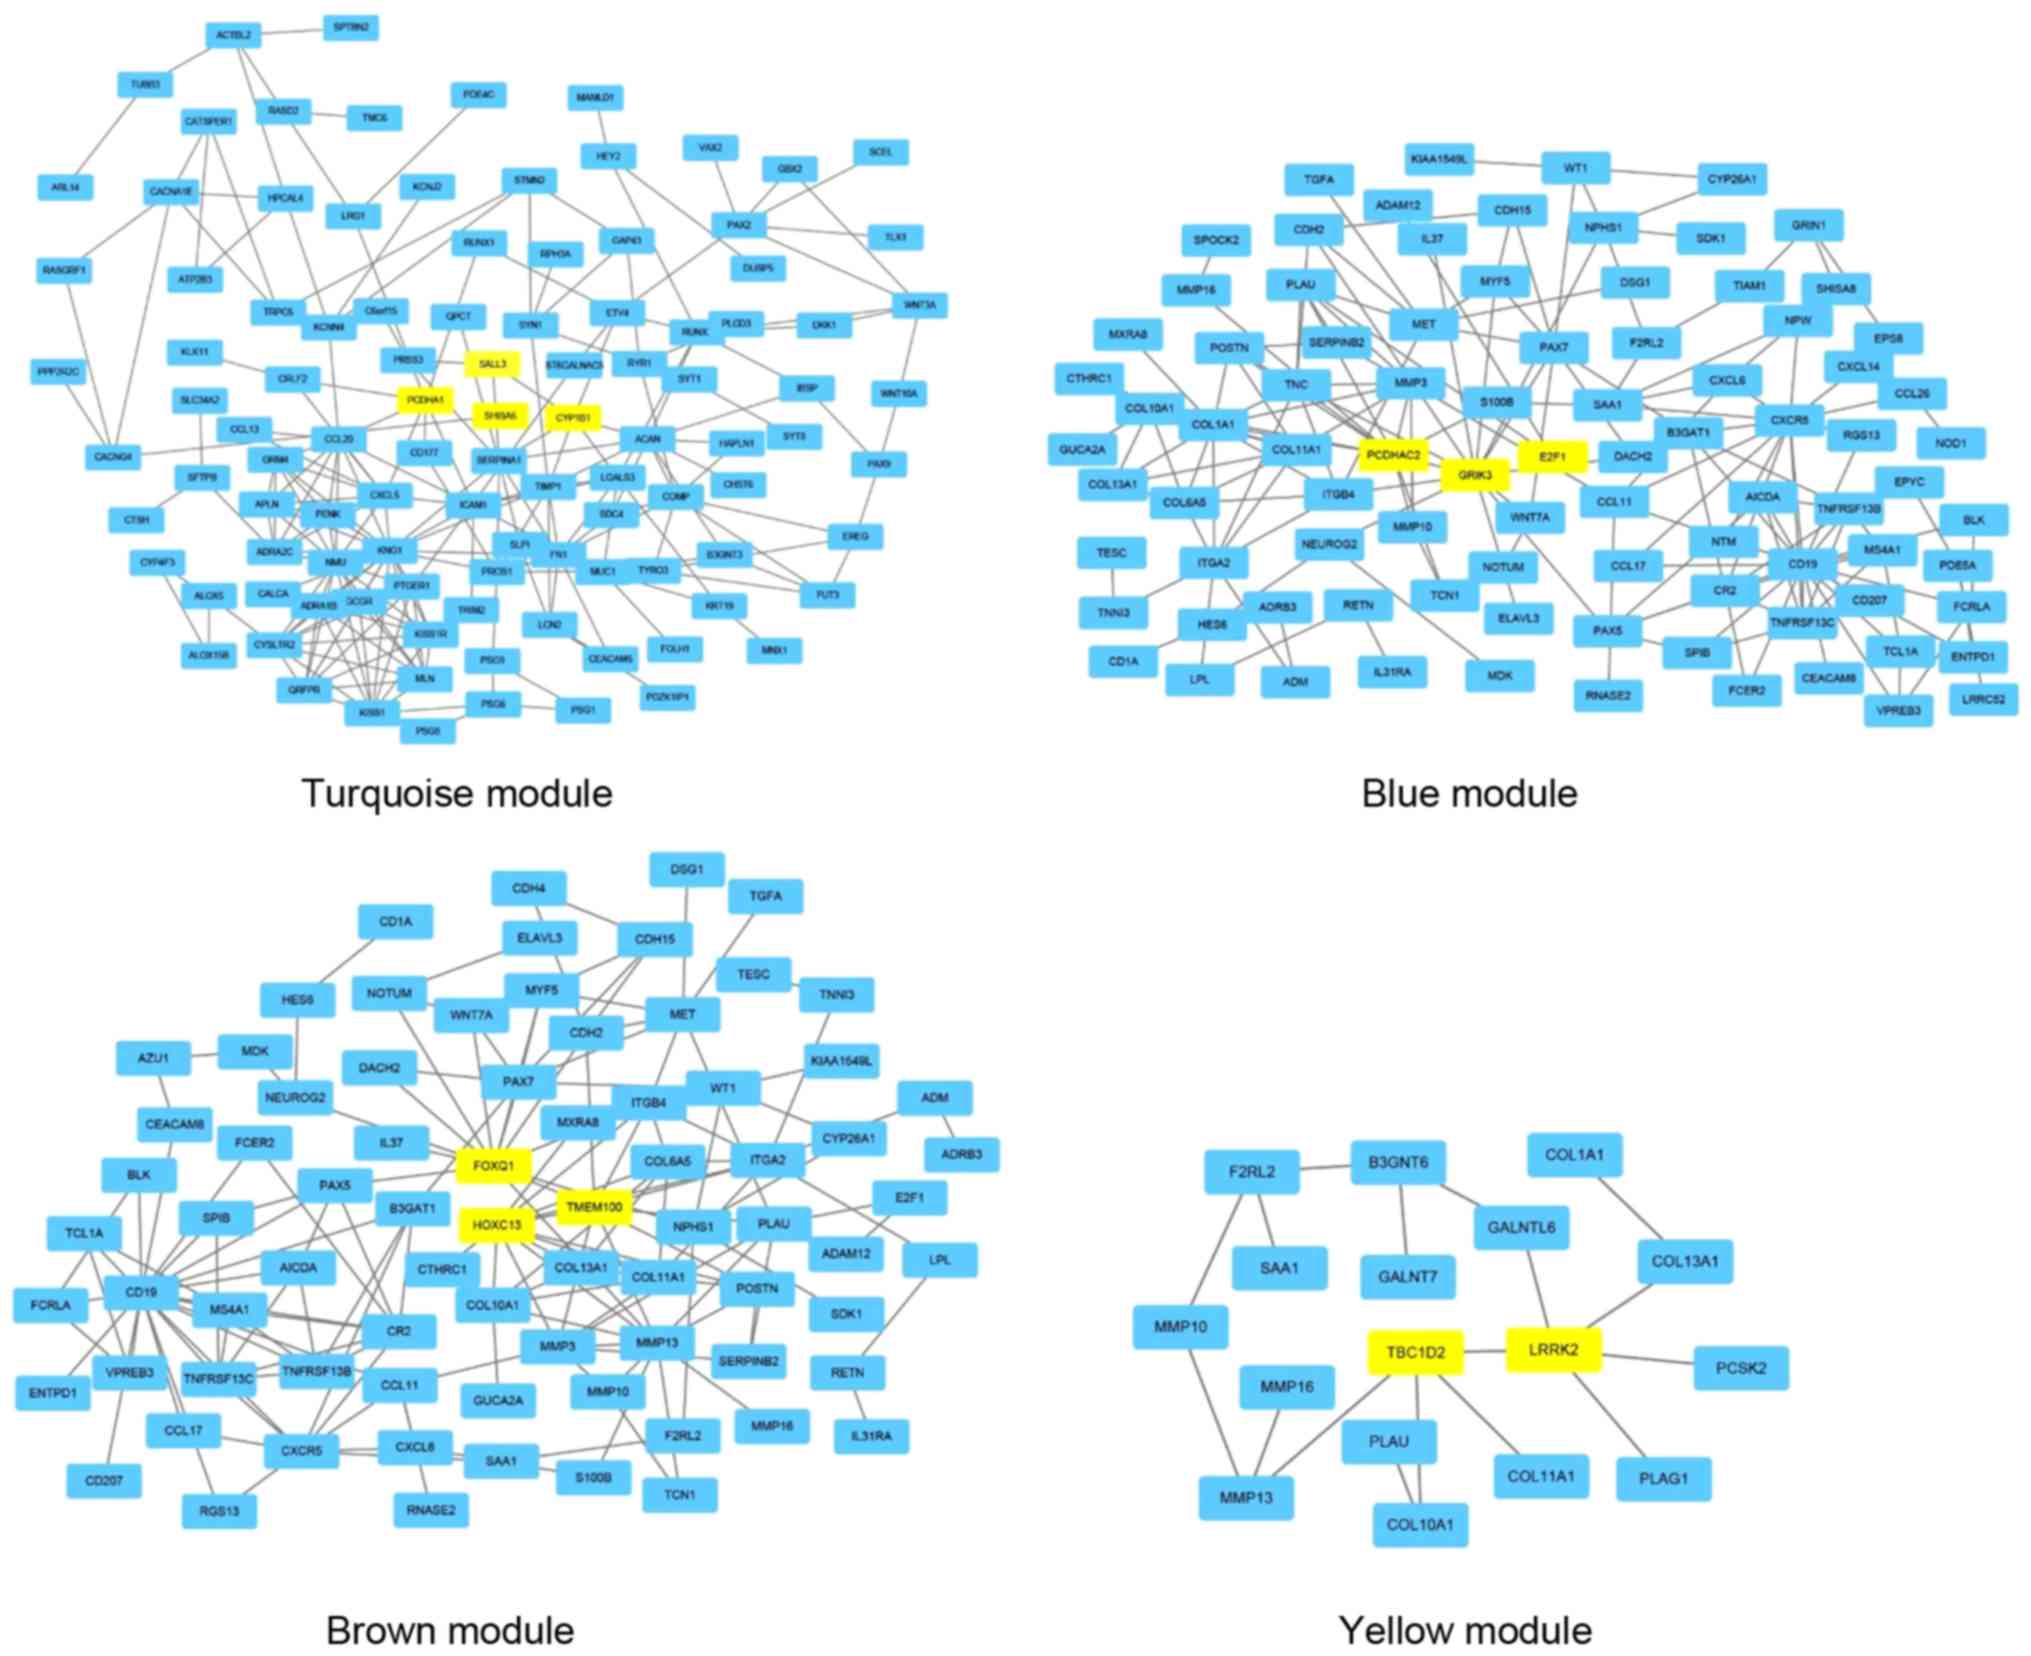
Using the STRING tool, 4 PPI networks were
identified in the modules, including turquoise, blue, brown and
yellow modules. However, a relevant PPI was not identified in the
green module. Additionally, in order to identify the function and
PPI of DEmRNAs in the different colored modules, KEGG pathway
annotation for each module was performed and is presented in
Table II. Hub DEmRNAs from the PPI
networks were selected for ceRNA network construction. As
illustrated in Fig. 2, the relevant
modules (turquoise, blue, brown and yellow) were selected for
visualization of the Cytoscape software results.
| Table II.KEGG pathway analysis of weighted
gene co-expression network analysis modules. |
Table II.
KEGG pathway analysis of weighted
gene co-expression network analysis modules.
| A, Turquoise |
|---|
|
|---|
| KEGG pathway | Input number | Top genes | P-value |
|---|
| ‘Regulation of
signaling’ | 76 | SHISA6, PCDHA1,
SALL3, |
8.5×10−05 |
| ‘Regulation of cell
communication’ | 73 | CYP1B1, SERPINA1,
TIMP1, |
3.2×10−04 |
| ‘Regulation of
multicellular organismal process’ | 68 | CD177, PRSS3 |
4.6×10−05 |
| ‘Anatomical
structure morphogenesis’ | 59 |
|
1.8×10−04 |
| ‘Tissue
development’ | 47 |
|
9.2×10−04 |
| ‘Secretion’ | 46 |
|
8.0×10−05 |
| ‘Cell-cell
signaling’ | 45 |
|
8.5×10−05 |
| ‘Secretion by
cell’ | 45 |
|
4.6×10−05 |
| ‘Positive
regulation of cell communication’ | 43 |
|
8.6×10−04 |
| ‘Positive
regulation of multicellular organismal process’ | 41 |
|
7.9×10−04 |
| ‘Neuron
differentiation’ | 35 |
|
9.2×10−04 |
| ‘Regulation of
secretion’ | 25 |
|
9.2×10−04 |
| ‘Regulation of
secretion by cell’ | 24 |
|
9.2×10−04 |
| ‘Epidermis
development’ | 19 |
|
1.3×10−03 |
|
| B, Blue |
|
| KEGG
pathway | Input
number | Top
genes | P-value |
|
| ‘Cellular
developmental process’ | 93 | GRIK3, E2F1,
PCDHAC2, |
6.4×10−08 |
| ‘System
development’ | 92 | MMP3, PAX7,
S100B |
4.1×10−06 |
| ‘Cell
differentiation’ | 91 |
|
6.4×10−08 |
| ‘Anatomical
structure morphogenesis’ | 53 |
|
9.9×10−04 |
| ‘Response to
external stimulus’ | 48 |
|
9.9×10−04 |
| ‘Tissue
development’ | 46 |
|
3.7×10−04 |
| ‘Cell
adhesion’ | 38 |
|
2.2×10−04 |
| ‘Chemotaxis’ | 22 |
|
2.2×10−04 |
| ‘Extracellular
structure organization’ | 22 |
|
1.1×10−06 |
| ‘Extracellular
matrix organization’ | 21 |
|
4.0×10−07 |
| ‘Cell
chemotaxis’ | 14 |
|
6.6×10−04 |
| ‘Collagen metabolic
process’ | 12 |
|
4.1×10−06 |
| ‘Collagen catabolic
process’ | 10 |
|
4.1×10−06 |
|
| C,
Brown |
|
| KEGG
pathway | Input
number | Top
genes | P-value |
|
| ‘Nervous system
development’ | 49 | FOXQ1, HOXC13,
TMEM100, |
7.2×10−04 |
| ‘Cell-cell
signaling’ | 43 | PAX7, COL13A1,
NPHS1, |
8.6×10−05 |
| ‘Transmembrane
transport’ | 41 | MXRA8 |
1.5×10−04 |
| ‘Behavior’ | 24 |
|
6.1×10−05 |
| ‘Chemical synaptic
transmission’ | 23 |
|
1.5×10−04 |
| ‘Ossification’ | 16 |
|
6.3×10−04 |
| ‘Learning or
memory’ | 15 |
|
8.6×10−05 |
| ‘Neurotransmitter
transport’ | 13 |
|
5.9×10−04 |
| ‘Memory’ | 9 |
|
5.9×10−04 |
| ‘Hippocampus
development’ | 8 |
|
4.0×10−04 |
| ‘Positive
regulation of fat cell proliferation’ | 3 |
|
7.0×10−04 |
|
| D,
Yellow |
|
| KEGG
pathways | Input
number | Top
genes | P-value |
|
| ‘Cell
morphogenesis’ | 7 | TBC1D2, LRRK2 |
9.9×10−03 |
| ‘Cell part
morphogenesis’ | 6 |
|
9.4×10−03 |
| ‘Tangential
migration from the subventricular zone to the olfactory bulb’ | 2 |
|
9.4×10−03 |
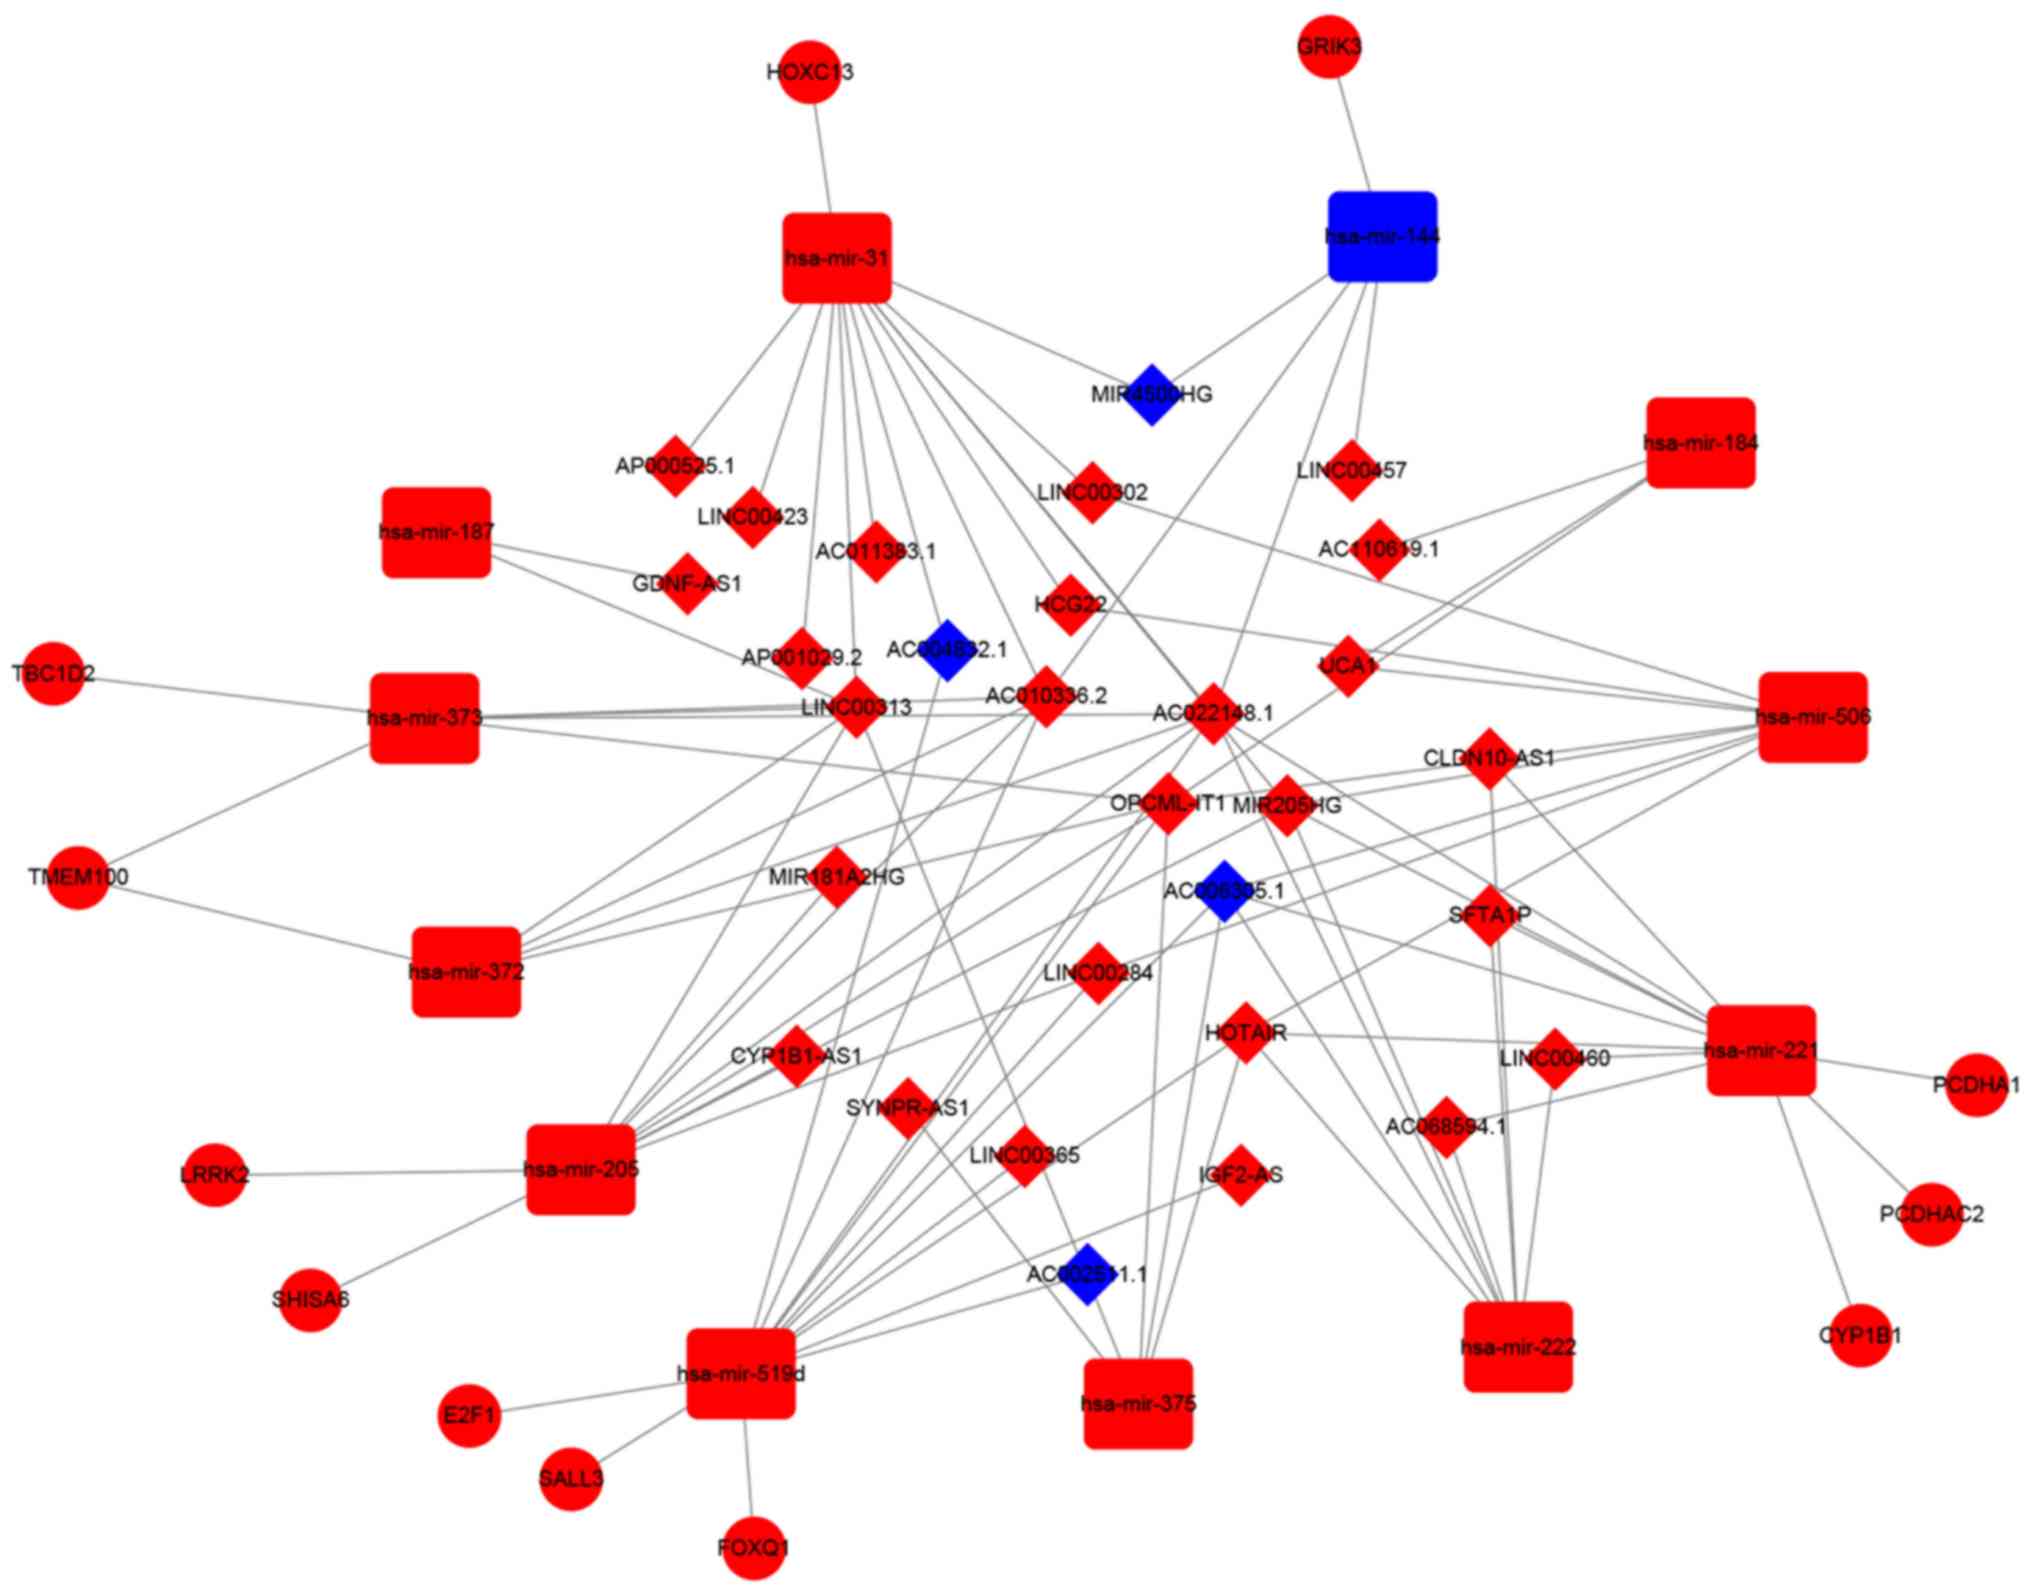
Construction of the ceRNA network in
CCA
To further explore the association between lncRNAs
and miRNAs in patients with CCA, a ceRNA network was constructed
using the three types of DE RNAs. DEmiRNA-mRNA pairs were predicted
using the miRTarBase database. A total of 12 hub DEmRNAs were
identified as targeted genes by WGCNA. These were LRRK2, TBC1D2,
E2F1, SHISA6, CYP1B1, TMEM100, PCDHAC2, GRIK3, FOXQ1, PCDHA1,
HOXC13 and SALL3. DEmiRNAs, including hsa-mir-519d, hsa-mir-31,
hsa-mir-506, hsa-mir-372, hsa-mir-373, hsa-mir-144, hsa-mir-205,
hsa-mir-221, hsa-mir-222, hsa-mir-187, hsa-mir-375 and hsa-mir-184,
were subsequently identified to be closely associated with the
aforementioned 12 hub DEmRNAs. A total of 30 DElncRNAs that were
also closely associated with the DEmiRNAs were identified using the
miRcode database (Table III). The
DEmiRNAs and lncRNAs in the ceRNA network are presented in Table IV. Two highly clustered DElncRNAs in
the ceRNA network were identified, AC022148.1 and OPCML intronic
transcript 1 (OPCML-IT1). AC022148.1 interacted with hsa-mir-372,
hsa-mir-373, hsa-mir-144, hsa-mir-519d, hsa-mir-205, hsa-mir-221,
hsa-mir-222 and hsa-mir-31. OPCML-IT1 interacted closely with 7
miRNAs, including hsa-mir-372, hsa-mir-373, hsa-mir-519d,
hsa-mir-184, hsa-mir-205, hsa-mir-506 and hsa-mir-375. The ceRNA
network is presented in Fig. 3.
| Table III.Thirty DElncRNAs interact with the 12
DEmiRNAs as retrieved from the miRcode database. |
Table III.
Thirty DElncRNAs interact with the 12
DEmiRNAs as retrieved from the miRcode database.
| lncRNA | miRNAs |
|---|
| IGF2-AS | hsa-mir-519d |
| LINC00302 | hsa-mir-31,
hsa-mir-506 |
| AC022148.1 | hsa-mir-372,
hsa-mir-373, hsa-mir-144, |
|
| hsa-mir-519d,
hsa-mir-205, hsa-mir-221, |
|
| hsa-mir-222,
hsa-mir-31 |
| LINC00313 | hsa-mir-372,
hsa-mir-373, hsa-mir-187, |
|
| hsa-mir-205,
hsa-mir-31, hsa-mir-375 |
| AC004832.1 | hsa-mir-519d,
hsa-mir-31, |
| AC002511.1 | hsa-mir-519d |
| AC006305.1 | hsa-mir-519d,
hsa-mir-221, hsa-mir-222, |
|
| hsa-mir-506,
hsa-mir-375 |
| AP000525.1 | hsa-mir-31 |
| UCA1 | hsa-mir-184,
hsa-mir-506 |
| AC010336.2 | hsa-mir-372,
hsa-mir-373, hsa-mir-144, |
|
| hsa-mir-519d,
hsa-mir-205, hsa-mir-31 |
| CLDN10-AS1 | hsa-mir-221,
hsa-mir-222 |
| MIR181A2HG | hsa-mir-205 |
| LINC00365 | hsa-mir-519d |
| LINC00457 | hsa-mir-144 |
| SFTA1P | hsa-mir-221,
hsa-mir-222 |
| LINC00423 | hsa-mir-31 |
| HOTAIR | hsa-mir-519d,
hsa-mir-221, hsa-mir-222, |
|
| hsa-mir-506,
hsa-mir-375 |
| HCG22 | hsa-mir-31,
hsa-mir-506 |
| MIR4500HG | hsa-mir-144,
hsa-mir-31 |
| MIR205HG | hsa-mir-205,
hsa-mir-221, hsa-mir-222, |
|
| hsa-mir-31,
hsa-mir-506 |
| CYP1B1-AS1 | hsa-mir-205 |
| LINC00460 | hsa-mir-222,
hsa-mir-221 |
| LINC00284 | hsa-mir-519d,
hsa-mir-205, hsa-mir-506 |
| AC068594.1 | hsa-mir-222,
hsa-mir-221 |
| AC011383.1 | hsa-mir-31 |
| SYNPR-AS1 | hsa-mir-375 |
| GDNF-AS1 | hsa-mir-187 |
| OPCML-IT1 | hsa-mir-372,
hsa-mir-373, hsa-mir-519d, |
|
| hsa-mir-184,
hsa-mir-205, hsa-mir-506, |
|
| hsa-mir-375, |
| AC110619.1 | hsa-mir-184 |
| AP001029.2 | hsa-mir-31 |
| Table IV.Specific miRNAs, lncRNAs and mRNAs in
the competing endogenous RNA network. |
Table IV.
Specific miRNAs, lncRNAs and mRNAs in
the competing endogenous RNA network.
| A, miRNA |
|---|
|
|---|
| Gene symbol | Gene ID | Expression
change | log2 fold
change | P-value |
|---|
| hsa-mir-519d |
ENSG00000207981 | Up | 4.74 | 3.73E-06 |
| hsa-mir-31 |
ENSG00000199177 | Up | 2.45 | 8.69E-20 |
| hsa-mir-506 |
ENSG00000207731 | Up | 2.03 | 7.24E-13 |
| hsa-mir-372 |
ENSG00000199095 | Up | 3.46 | 4.82E-09 |
| hsa-mir-373 |
ENSG00000199143 | Up | 2.55 | 3.35E-05 |
| hsa-mir-144 |
ENSG00000283819 | Down | −2.14 | 1.80E-48 |
| hsa-mir-205 |
ENSG00000284485 | Up | 2.08 | 1.12E-07 |
| hsa-mir-221 |
ENSG00000207870 | Up | 3.36 | 1.92E-60 |
| hsa-mir-222 |
ENSG00000207725 | Up | 3.02 | 9.01E-57 |
| hsa-mir-187 |
ENSG00000207797 | Up | 3.17 | 8.72E-20 |
| hsa-mir-375 |
ENSG00000198973 | Up | 2.89 | 1.10E-23 |
| hsa-mir-184 |
ENSG00000207695 | Up | 3.62 | 6.05E-12 |
|
| B,
lncRNA |
|
| Gene
symbol | Gene ID | Expression
change | log2 fold
change | P-value |
|
| IGF2-AS |
ENSG00000099869 | Up | 3.94 | 7.11E-08 |
| LINC00302 |
ENSG00000176075 | Up | 3.36 | 8.92E-08 |
| AC022148.1 |
ENSG00000180458 | Up | 3.13 | 3.85E-28 |
| LINC00313 |
ENSG00000185186 | Up | 2.16 | 1.53E-11 |
| AC004832.1 |
ENSG00000181123 | Down | −2.19 | 3.22E-20 |
| AC002511.1 |
ENSG00000232680 | Down | −2.29 | 7.96E-30 |
| AC006305.1 |
ENSG00000206129 | Down | −2.62 | 2.57E-42 |
| AP000525.1 |
ENSG00000272872 | Up | 2.52 | 5.41E-17 |
| UCA1 |
ENSG00000214049 | Up | 3.48 | 6.85E-12 |
| AC010336.2 |
ENSG00000260500 | Up | 2.33 | 2.16E-28 |
| CLDN10-AS1 |
ENSG00000223392 | Up | 4.19 | 1.58E-13 |
| MIR181A2HG |
ENSG00000224020 | Up | 2.12 | 2.23E-41 |
| LINC00365 |
ENSG00000224511 | Up | 2.39 | 5.59E-14 |
| LINC00457 |
ENSG00000225179 | Up | 2.87 | 6.46E-12 |
| SFTA1P |
ENSG00000225383 | Up | 2.19 | 3.09E-19 |
| LINC00423 |
ENSG00000226968 | Up | 3.17 | 4.16E-21 |
| HOTAIR |
ENSG00000228630 | Up | 2.41 | 2.64E-06 |
| HCG22 |
ENSG00000228789 | Up | 2.76 | 3.18E-19 |
| MIR4500HG |
ENSG00000228824 | Down | −2.48 | 7.14E-21 |
| MIR205HG |
ENSG00000230937 | Up | 2.63 | 6.43E-10 |
| CYP1B1-AS1 |
ENSG00000232973 | Up | 2.26 | 9.22E-35 |
| LINC00460 |
ENSG00000233532 | Up | 3.61 | 3.66E-20 |
| LINC00284 |
ENSG00000233725 | Up | 3.91 | 8.27E-30 |
| AC068594.1 |
ENSG00000263718 | Up | 2.65 | 1.38E-37 |
| AC011383.1 |
ENSG00000253852 | Up | 2.37 | 1.86E-26 |
| SYNPR-AS1 |
ENSG00000241359 | Up | 2.66 | 4.38E-07 |
| GDNF-AS1 |
ENSG00000248587 | Up | 3.59 | 1.08E-12 |
| OPCML-IT1 |
ENSG00000254896 | Up | 5.02 | 5.08E-14 |
| AC110619.1 |
ENSG00000218416 | Up | 2.09 | 2.36E-22 |
| AP001029.2 |
ENSG00000267199 | Up | 2.69 | 1.10E-35 |
|
| C, mRNA |
|
| Gene
symbol | Gene ID | Expression
change | log2 fold
change | P-value |
|
| LRRK2 |
ENSG00000188906 | Up | 4.02 | 7.71E-51 |
| TBC1D2 |
ENSG00000095383 | Up | 2.01 | 7.90E-42 |
| E2F1 |
ENSG00000101412 | Up | 2.01 | 7.55E-40 |
| SHISA6 |
ENSG00000188803 | Up | 3.91 | 6.01E-28 |
| CYP1B1 |
ENSG00000138061 | Up | 3.09 | 1.35E-24 |
| TMEM100 |
ENSG00000166292 | Up | 2.82 | 2.19E-20 |
| PCDHAC2 |
ENSG00000243232 | Up | 2.16 | 2.48E-20 |
| GRIK3 |
ENSG00000163873 | Up | 2.84 | 1.52E-19 |
| FOXQ1 |
ENSG00000164379 | Up | 2.10 | 1.94E-19 |
| PCDHA1 |
ENSG00000204970 | Up | 2.03 | 1.02E-13 |
| HOXC13 |
ENSG00000123364 | Up | 2.94 | 1.53E-07 |
| SALL3 |
ENSG00000256463 | Up | 2.52 | 6.15E-06 |
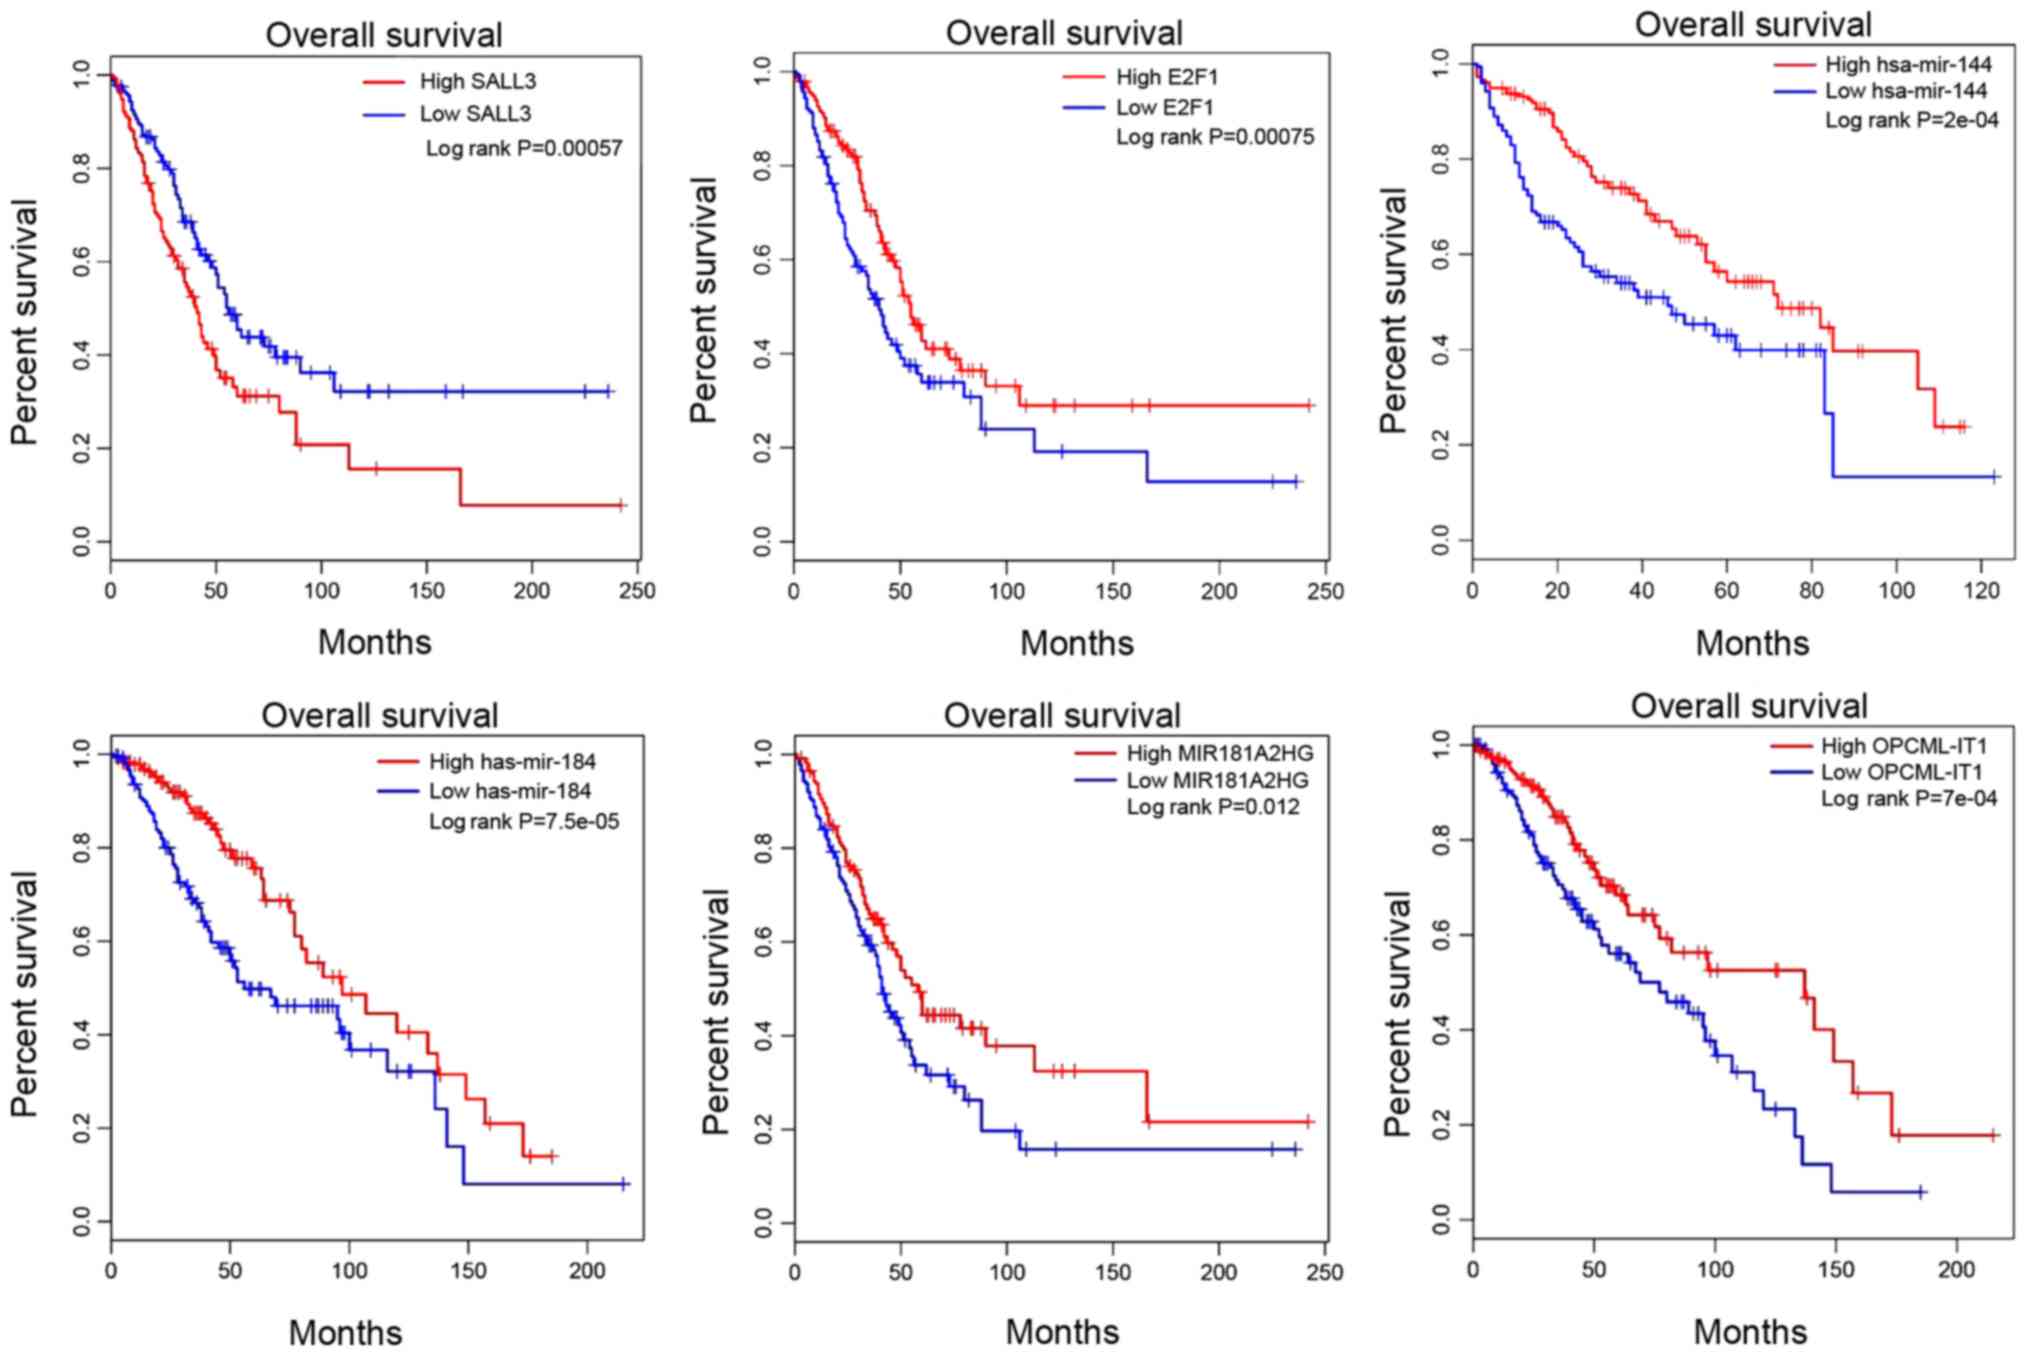
Survival and correlation analysis for
the hub DEmRNAs, DEmiRNAs and DElncRNAs
A total of 12 DEmRNAs, 12 DEmiRNAs and 30 DElncRNAs
were identified as hub genes in the tumorigenesis of CCA. To
explore the effect these RNAs had on the overall survival time,
Kaplan-Meier curve analysis was used to obtain a prognostic
signature. Survival analysis in Fig.
4 revealed that two key mRNAs, SALL3 and E2F1, were associated
with the progression of CCA. High SALL3 mRNA expression, but low
E2F1 expression were associated with poor prognosis. Additionally,
low expression levels of hsa-mir-144 and hsa-mir-184 were also
associated with poor prognosis. MIR181A2HG and OPCML-IT1 had
positive effects on the overall survival time of patients with CCA.
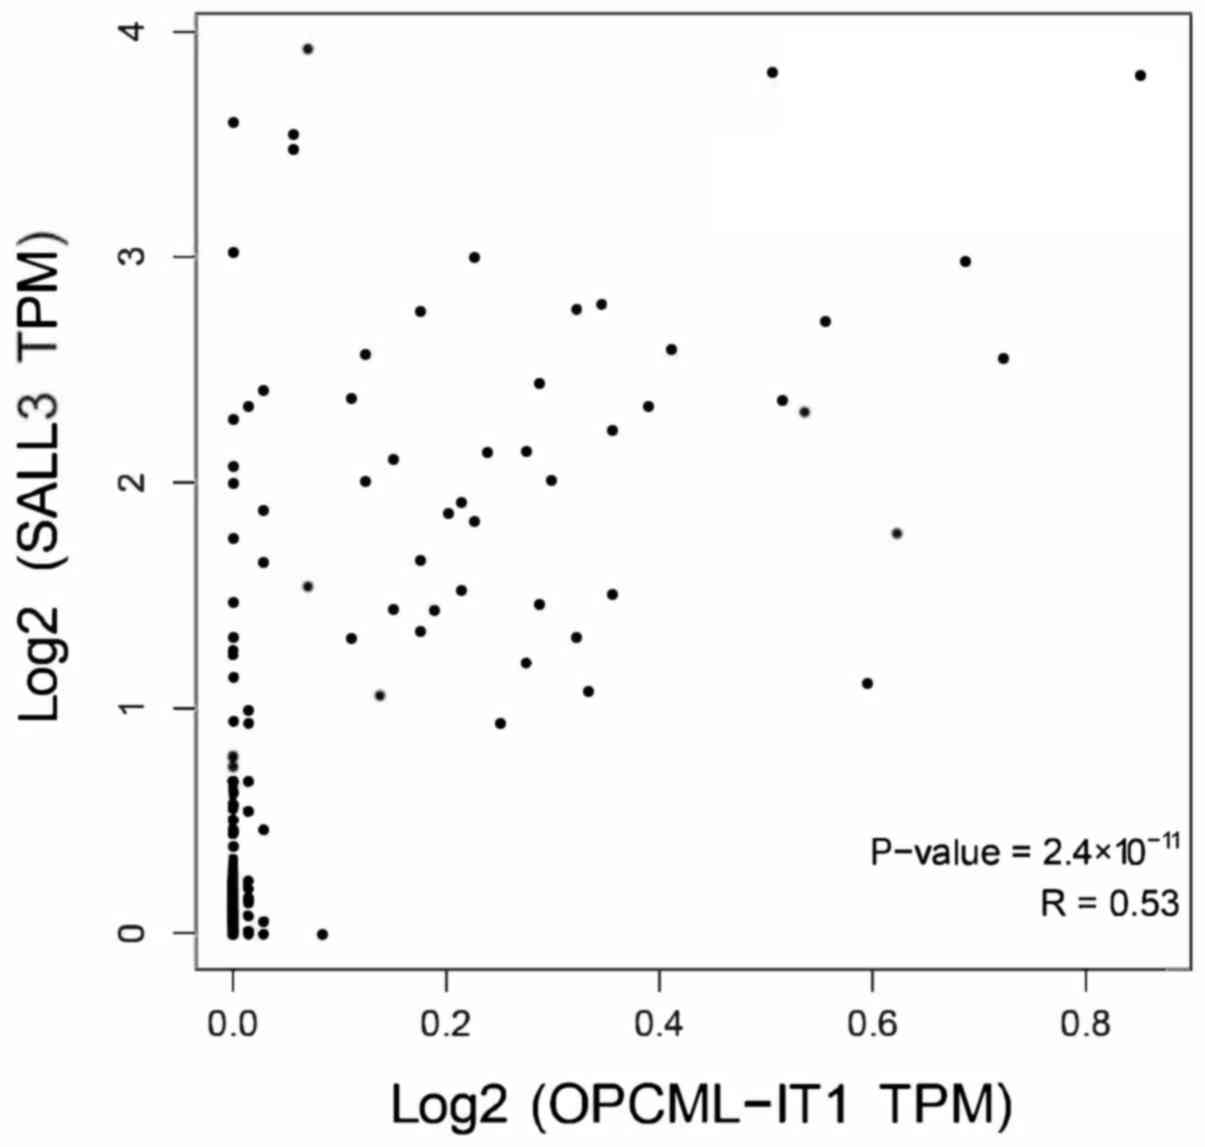
Pearson's correlation coefficient analysis revealed that OPCML-IT1
has a stronger correlation with SALL3 in Fig. 5.
Discussion
With a high mortality and an increasing incidence
rate globally, the mechanisms underlying CCA are currently being
investigated (1–3). Numerous studies have revealed that
dysregulated miRNAs and lncRNAs may be involved in tumor
progression (22–24). Previous studies have demonstrated
that non-coding RNAs may serve an important role in various
biological processes (4,24–28). The
ceRNA network has been implicated in a number of different types of
cancer and may contribute to tumor progression and metastasis in
triple negative breast cancer (25),
papillary renal cell carcinoma (26)
and gastric cancer (27). A previous
study revealed that two key ceRNA clusters involved in cell-based
functions may contribute to CCA (28). However, the specific lncRNAs involved
in the overall survival time in CCA remain unclear. The current
study therefore comprehensively integrated mRNA and miRNA data from
TCGA and constructed a ceRNA network of lncRNA-miRNA-mRNA
interactions to further explore the mechanism of lncRNAs in
CCA.
In the current study, 30 DElncRNAs were identified
as the hub lncRNAs which were involved in the ceRNA network.
MIR181A2HG and OPCML-IT1 were revealed to be potential prognostic
biomarkers for CCA. As illustrated in the ceRNA network, these two
DElncRNAs had more interactions and were involved in regulating the
target genes by competing for a common miRNA (mir-205).
lncRNAs are non-protein-coding transcripts
consisting of >200 nucleotides and have been revealed to
regulate cellular processes (29).
MIR181A2HG is the host gene of MIR181A2, and its overexpression has
been associated with several types of cancer. Xu et al
(30) demonstrated that MIR181A2HG
was downregulated by estrogen in breast cancer. A previous study
demonstrated that MIR181A2HG was upregulated in elderly patients
with breast cancer (31).
The current study revealed that high expression of
MIR181A2HG may compete with one key DEmiRNA (mir-205) to mediate
the expression of target genes. In addition, patients with highly
expressed MIR181A2HG had shorter survival time compared with those
with low expression according to the survival analysis performed in
the current study. OPCML-IT1, another hub DElncRNA in the ceRNA
network, has been previously associated with gastric cancer
(32). High expression of OPCML-IT1
may compete with seven key DEmiRNAs (mir-372, mir-373, mir-519d,
mir-184, mir-205, mir-506 and mir-375) to mediate the expression of
target genes. Furthermore, similar to MIR181A2HG, survival analysis
revealed that increased expression of OPCML-IT1 was associated with
a poor prognosis for patients with CCA. Based on the results of
pathways analysis in the current study, knockdown of MIR181A2HG and
OPCML-IT1 may prevent cell proliferation in CCA and prolong
survival time of patients with CCA. miRNAs are master regulators of
fine-tuning gene expression in a number of pathways, including cell
cycle pathways (33). The current
study demonstrated that 12 DEmiRNAs were involved in the ceRNA
network, two of which (mir-144 and mir-184) were associated with
differences in the overall survival time of patients with CCA. A
previous study revealed that mir-144 may be an essential suppresser
of CCA cell proliferation and invasion by targeting platelet
activating factor acetylhydrolase 1b regulatory subunit 1 (34). The survival analysis of mir-144
performed in the current study demonstrated that low expression of
mir-144 can prolong patient survival. While mir-184 was revealed to
be a target gene in breast (35) and
liver (32) cancer, few studies have
investigated the role of mir-184 in CCA (35,36).
Survival analysis indicated that high expression of mir-184 was
associated with poor prognosis in patients with CCA. Thus, the
mechanism of mir-184 in CCA requires further investigation.
Based on the results of WGCNA performed in the
current study, two protein-coding genes involved in the ceRNA
network from four modules were identified, of which SALL3 and E2F1
were demonstrated to affect the overall survival time of patients
with CCA. Epigenetic silencing of SALL3 was a predictor of poor
survival in head and neck cancer (37). E2F1 is involved in the control of the
cell cycle, proliferation and cell death (38). E2F1 was demonstrated to affect the
overall survival in patients with prostate (39) and colorectal cancer (40). In the construction of ceRNA network,
SALL3 or E2F1 can be a direct target of the hub DEmiRNA, mir-519d.
Therefore, this DEmiRNA may compete with DElncRNA OPCML-IT1.
Furthermore, the results of the regression analysis indicated a
stronger correlation between SALL3 and OPCML-IT1 than between E2F1
and OPCML-IT1. Consequently, OPCML-IT1 may exhibit
tumor-suppressing effects in CCA.
The current study had certain advantages over a
previously published study (28): i)
WGCNA was used to confirm the hub genes in functional modules; ii)
the survival analysis of genes instead of clusters was
investigated, which provided a clearer direction for future
research; and iii) Pearson's correlation analysis was performed to
validate the correlations between DElncRNAs and DEmRNAs involved in
the formulated ceRNA network. Due to the several differences in the
types of RNA-Seq gene expression, methods used for gene selection
and cut-off criteria used for analyzing DEGs, there was no overlap
between the current study and a previous study by Wan et al
(28). The current study
demonstrated the importance of SALL3 and OPCML-IT1 expression in
patients with CCA, based on analysis of a weighted gene
co-expression network, a ceRNA network and patient overall survival
time. Future studies are required to verify the involvement of the
ceRNA network in CCA.
Supplementary Material
Supporting Data
Acknowledgements
Not applicable.
Funding
No funding was received.
Availability of data and materials
The datasets used and/or analyzed during the present
study are available from the corresponding author on reasonable
request.
Authors' contributions
YH, ZM, CH and XF conceived and designed the study.
CL, PS, ZP, TY and MS collected the data and performed statistical
analysis. ZM, CH and XF completed the manuscript.
Ethics approval and consent to
participate
Not applicable.
Patient consent for publication
Not applicable.
Competing interests
The authors declare that they have no competing
interests.
References
|
1
|
Banales JM, Cardinale V, Carpino G,
Marzioni M, Andersen JB, Invernizzi P, Lind GE, Folseraas T, Forbes
SJ, Fouassier L, et al: Expert consensus document:
Cholangiocarcinoma: Current knowledge and future perspectives
consensus statement from the European Network for the Study of
Cholangiocarcinoma (ENS-CCA). Nat Rev Gastroenterol Hepatol.
13:261–280. 2016. View Article : Google Scholar : PubMed/NCBI
|
|
2
|
Jarnagin WR, Fong Y, DeMatteo RP, Gonen M,
Burke EC, Bodniewicz BS J, Youssef BA M, Klimstra D and Blumgart
LH: Staging, resectability, and outcome in 225 patients with hilar
cholangiocarcinoma. Ann Surg. 234:507–519. 2001. View Article : Google Scholar : PubMed/NCBI
|
|
3
|
Maithel SK, Gamblin TC, Kamel I,
Corona-Villalobos CP, Thomas M and Pawlik TM: Multidisciplinary
approaches to intrahepatic cholangiocarcinoma. Cancer.
119:3929–3942. 2013. View Article : Google Scholar : PubMed/NCBI
|
|
4
|
Baltimore D: Our genome unveiled. Nature.
409:814–816. 2001. View
Article : Google Scholar : PubMed/NCBI
|
|
5
|
Gong Z, Zhang S, Zeng Z, Wu H, Yang Q,
Xiong F, Shi L, Yang J, Zhang W, Zhou Y, et al: LOC401317, a
p53-regulated long non-coding RNA, inhibits cell proliferation and
induces apoptosis in the nasopharyngeal carcinoma cell line HNE2.
PLoS One. 9:e1106742014. View Article : Google Scholar : PubMed/NCBI
|
|
6
|
Zhang W, Huang C, Gong Z, Zhao Y, Tang K,
Li X, Fan S, Shi L, Li X, Zhang P, et al: Expression of LINC00312,
a long intergenic non-coding RNA, is negatively correlated with
tumor size but positively correlated with lymph node metastasis in
nasopharyngeal carcinoma. J Mol Histol. 44:545–554. 2013.
View Article : Google Scholar : PubMed/NCBI
|
|
7
|
Salmena L, Poliseno L, Tay Y, Kats L and
Pandolfi PP: A ceRNA hypothesis: The Rosetta Stone of a hidden RNA
language? Cell. 146:353–358. 2011. View Article : Google Scholar : PubMed/NCBI
|
|
8
|
Jeyapalan Z, Deng Z, Shatseva T, Fang L,
He C and Yang BB: Expression of CD44 3′-untranslated region
regulates endogenous microRNA functions in tumorigenesis and
angiogenesis. Nucleic Acids Res. 39:3026–3041. 2011. View Article : Google Scholar : PubMed/NCBI
|
|
9
|
Poliseno L, Salmena L, Zhang J, Carver B,
Haveman WJ and Pandolfi PP: A coding-independent function of gene
and pseudogene mRNAs regulates tumour biology. Nature.
465:1033–1038. 2010. View Article : Google Scholar : PubMed/NCBI
|
|
10
|
Hu Q, Yin J, Zeng A, Jin X, Zhang Z, Yan W
and You Y: H19 functions as a competing endogenous RNA to regulate
EMT by sponging miR-130a-3p in glioma. Cell Physiol Biochem.
50:233–245. 2018. View Article : Google Scholar : PubMed/NCBI
|
|
11
|
Zhao G, Fu Y, Su Z and Wu R: How long
non-coding RNAs and microRNAs mediate the endogenous RNA network of
head and neck squamous cell carcinoma: A comprehensive analysis.
Cell Physiol Biochem. 50:332–341. 2018. View Article : Google Scholar : PubMed/NCBI
|
|
12
|
Liu XH, Sun M, Nie FQ, Ge YB, Zhang EB,
Yin DD, Kong R, Xia R, Lu KH, Li JH, et al: Lnc RNA HOTAIR
functions as a competing endogenous RNA to regulate HER2 expression
by sponging miR-331-3p in gastric cancer. Mol Cancer. 13:922014.
View Article : Google Scholar : PubMed/NCBI
|
|
13
|
Song X, Cao G, Jing L, Lin S, Wang X,
Zhang J, Wang M, Liu W and Lv C: Analysing the relationship between
lncRNA and protein-coding gene and the role of lncRNA as ceRNA in
pulmonary fibrosis. J Cell Mol Med. 18:991–1003. 2014. View Article : Google Scholar : PubMed/NCBI
|
|
14
|
Yu G, Yao W, Gumireddy K, Li A, Wang J,
Xiao W, Chen K, Xiao H, Li H, Tang K, et al: Pseudogene PTENP1
functions as a competing endogenous RNA to suppress clear-cell
renal cell carcinoma progression. Mol Cancer Ther. 13:3086–3097.
2014. View Article : Google Scholar : PubMed/NCBI
|
|
15
|
Xi X, Chu Y, Liu N, Wang Q, Yin Z, Lu Y
and Chen Y: Joint bioinformatics analysis of underlying potiential
functions of has-let-7b-5p and core genes in human glioma. J Transl
Med. 17:1292019. View Article : Google Scholar : PubMed/NCBI
|
|
16
|
Ivliev AE, t Hoen PA and Sergeeva MG:
Coexpression network analysis identifies transcriptional modules
related to proastrocytic differentiation and sprouty signaling in
glioma. Cancer Res. 24:10060–10070. 2010. View Article : Google Scholar
|
|
17
|
Langfelder P and Horvath S: Eigengene
networks for studying the relationships between co-expression
modules. BMC Syst Biol. 1:542007. View Article : Google Scholar : PubMed/NCBI
|
|
18
|
Langfelder P and Horvath S: WGCNA: An R
package for weighted correlation network analysis. BMC
Bioinformatics. 9:5592008. View Article : Google Scholar : PubMed/NCBI
|
|
19
|
Zhang B and Horvath S: A general framework
for weighted gene co-expression network analysis. Stat Appl Genet
Mol Biol. 4:Article17. 2005. View Article : Google Scholar : PubMed/NCBI
|
|
20
|
Hsu SD, Tseng YT, Shrestha S, Lin YL,
Khaleel A, Chou CH, Chu CF, Huang HY, Lin CM, Ho SY, et al:
miRTarBase update 2014: An information resource for experimentally
validated miRNA-target interactions. Nucleic Acids Res.
42((Database Issue)): D78–D85. 2014. View Article : Google Scholar : PubMed/NCBI
|
|
21
|
Jeggari A, Marks DS and Larsson E:
miRcode: A map of putative microRNA target sites in the long
non-coding transcriptome. Bioinformatics. 28:2062–2063. 2012.
View Article : Google Scholar : PubMed/NCBI
|
|
22
|
Li P, Dong M and Wang Z: Downregulation of
TSPAN13 by miR-369-3p inhibits cell proliferation in papillary
thyroid cancer (PTC). Bosn J Basic Med Sci. Aug 2–2018.doi:
10.17305/bjbms.2018.2865 (Epub ahead of print). View Article : Google Scholar
|
|
23
|
Luo L, Xia L, Zha B, Zuo C, Deng D, Chen
M, Hu L, He Y, Dai F, Wu J, et al: miR-335-5p targeting ICAM-1
inhibits invasion and metastasis of thyroid cancer cells. Biomed
Pharmacother. 106:983–990. 2018. View Article : Google Scholar : PubMed/NCBI
|
|
24
|
Xia E, Bhandari A, Shen Y, Zhou X and Wang
O: lncRNA LINC00673 induces proliferation, metastasis and
epithelial-mesenchymal transition in thyroid carcinoma via
Kruppel-like factor 2. Int J Oncol. 53:1927–1938. 2018.PubMed/NCBI
|
|
25
|
Yuan N, Zhang G, Bie F, Ma M, Ma Y, Jiang
X, Wang Y and Hao X: Integrative analysis of lncRNAs and miRNAs
with coding RNAs associated with ceRNA crosstalk network in triple
negative breast cancer. OncoTargets Therapy. 10:5883–5897. 2017.
View Article : Google Scholar : PubMed/NCBI
|
|
26
|
Huang C, Yuan N, Wu L, Wang X, Dai J, Song
P, Li F, Xu C and Zhao X: An integrated analysis for long noncoding
RNAs and microRNAs with the mediated competing endogenous RNA
network in papillary renal cell carcinoma. Onco Targets Therapy.
10:4037–4050. 2017. View Article : Google Scholar
|
|
27
|
Li F, Huang C, Li Q and Wu X: Construction
and comprehensive analysis for dysregulated long non-coding RNA
(lncRNA)-associated competing endogenous RNA (ceRNA) network in
gastric cancer. Med Sci Monit. 24:37–49. 2018. View Article : Google Scholar : PubMed/NCBI
|
|
28
|
Wan M, Zhang FM, Li ZL, Kang PC, Jiang PM,
Wang YM, Wang ZD, Zhong XY, Li CL, Wang H, et al: Identifying
survival-associated ceRNA clusters in cholangiocarcinoma. Oncol
Rep. 36:1542–1550. 2016. View Article : Google Scholar : PubMed/NCBI
|
|
29
|
Ponting CP, Oliver PL and Reik W:
Evolution and functions of long noncoding RNAs. Cell. 136:629–641.
2009. View Article : Google Scholar : PubMed/NCBI
|
|
30
|
Xu S, Kong D, Chen Q, Ping Y and Pang D:
Oncogenic long noncoding RNA landscape in breast cancer. Mol
cancer. 16:1292017. View Article : Google Scholar : PubMed/NCBI
|
|
31
|
Brouwers B, Fumagalli D, Brohee S, Hatse
S, Govaere O, Floris G, Van den Eynde K, Bareche Y, Schöffski P,
Smeets A, et al: The footprint of the ageing stroma in older
patients with breast cancer. Breast Cancer Res. 19:782017.
View Article : Google Scholar : PubMed/NCBI
|
|
32
|
Kang C, Song JJ, Lee J and Kim MY:
Epigenetics: An emerging player in gastric cancer. World J
Gastroenterol. 20:6433–6447. 2014. View Article : Google Scholar : PubMed/NCBI
|
|
33
|
Adams BD, Kasinski AL and Slack FJ:
Aberrant regulation and function of microRNAs in cancer. Curr Biol.
24:R762–R776. 2014. View Article : Google Scholar : PubMed/NCBI
|
|
34
|
Yang R, Chen Y, Tang C, Li H, Wang B, Yan
Q, Hu J and Zou S: MicroRNA-144 suppresses cholangiocarcinoma cell
proliferation and invasion through targeting platelet activating
factor acetylhydrolase isoform 1b. BMC Cancer. 14:9172014.
View Article : Google Scholar : PubMed/NCBI
|
|
35
|
Phua YW, Nguyen A, Roden DL, Elsworth B,
Deng N, Nikolic I, Yang J, Mcfarland A, Russell R, Kaplan W, et al:
MicroRNA profiling of the pubertal mouse mammary gland identifies
miR-184 as a candidate breast tumour suppressor gene. Breast Cancer
Res. 17:832015. View Article : Google Scholar : PubMed/NCBI
|
|
36
|
Wu GG, Li WH, He WG, Jiang N, Zhang GX,
Chen W, Yang HF, Liu QL, Huang YN, Zhang L, et al: Mir-184
post-transcriptionally regulates SOX7 expression and promotes cell
proliferation in human hepatocellular carcinoma. PLoS One.
9:e887962014. View Article : Google Scholar : PubMed/NCBI
|
|
37
|
Misawa K, Mochizuki D, Imai A, Misawa Y,
Endo S, Mima M, Kawasaki H, Carey TE and Kanazawa T: Epigenetic
silencing of SALL3 is an independent predictor of poor survival in
head and neck cancer. Clin Epigenetics. 9:642017. View Article : Google Scholar : PubMed/NCBI
|
|
38
|
Lin M, Liu Y, Ding X, Ke Q, Shi J, Ma Z,
Gu H, Wang H, Zhang C, Yang C, et al: E2F1 transactivates IQGAP3
and promotes proliferation of hepatocellular carcinoma cells
through IQGAP3-mediated PKC-alpha activation. Am J Cancer Res.
9:285–299. 2019.PubMed/NCBI
|
|
39
|
Ren Z, Kang W, Wang L, Sun B, Ma J, Zheng
C, Sun J, Tian Z, Yang X and Xiao W: E2F1 renders prostate cancer
cell resistant to ICAM-1 mediated antitumor immunity by NF-κB
modulation. Mol Cancer. 13:842014. View Article : Google Scholar : PubMed/NCBI
|
|
40
|
Yang S, Wu B, Sun H, Ji F, Sun T, Zhao Y
and Zhou D: Interrupted E2F1-miR-34c-SCF negative feedback loop by
hyper-methylation promotes colorectal cancer cell proliferation.
Biosci Rep. 36:e002932016. View Article : Google Scholar
|