Introduction
Pancreatic neuroendocrine neoplasms (pNENs) are the
second most commonly-occurring solid neoplasms in the pancreas,
accounting for <3% of all pancreatic neoplasms (1). The reported annual incidence of pNENs
is approximately 2.5–5 per million persons (2). As all pNENs have the potential to
become malignant, surgery is the only curative treatment option for
pNENs; thus, it is recommended to all patients (3–5).
Compared with pancreatic ductal adenocarcinoma (PDAC), pNENs
usually demonstrate more indolent biological behaviors; pNENs
exhibit a more preferable response to chemotherapy, higher
resectability and longer overall survival (6). Even advanced pNENs exhibit improved
longer-term survival compared with PDAC (7). As PDAC is one of the leading causes of
cancer-associated mortality worldwide, with mortality rates of
~80.3% (8), preoperative adjuvant
chemoradiation may improve the 1- and 2-year overall survival and
disease free survival rates of patients (9). However, radiotherapy and chemotherapy
induce numerous side effects, such as nausea, vomiting and bone
marrow suppression. Therefore, it is imperative to accurately
differentiate pNENs from PDAC prior to surgery.
Contrast-enhancement (CE) CT and MRI are widely
accepted techniques for differentiating pNENs from PDAC. PNENs
usually present with rapid and notable enhancement in the arterial
phase of the CT scan due to their rich vascularity (7). However, pNENs gradually lose angiogenic
potential and their microvascular density (MVD) decreases as the
disease progresses (10). High-grade
pNENs demonstrate lower vascularity and MVD compared with grade-1
pNENs (11,12). Therefore, high-grade pNENs often
exhibit hypo-enhancement or heterogeneous enhancement in early
contrast-enhanced images (13). At
present, the use of CE CT or MRI exhibit difficulties when
differentiating high-grade pNENs from PDAC. Hypo-enhanced pNENs in
arterial phase imaging are associated with poor differentiation,
increased aggressiveness and decreased 5-year survival rate
(14,15). High-grade pNENs including grade 2 and
3 tumors often exhibit local invasion and/or metastases (16,17).
Since Le Bihan et al (18) proposed the theory of intravoxel
incoherent motion (IVIM), the phenomenon that tissue perfusion
effects can be separated from true tissue diffusion in IVIM
diffusion weighted imaging (IVIM-DWI) was determined (19,20).
Owing to the increasing concern for nephrogenic systemic fibrosis
(21), IVIM-DWI may be an effective
alternative to determine perfusion in tissues without contrast
agents (22). An increasing number
of studies have demonstrated the value of IVIM-DWI for evaluating
pancreatic neoplasms (23,24). In addition, studies have applied
quantitative parameters derived from IVIM-DWI to predict
histological characteristics of pNENs (25,26).
However, to the best of our knowledge, no published studies that
compare IVIM-DWI parameters between pNENs and PDAC are currently
available. Therefore, the aim of the present study was to assess
the diagnostic performance of IVIM-DWI parameters for
distinguishing between high-grade pNENs and PDAC.
Materials and methods
Subjects
Ethical approval was acquired from the Institutional
Ethics Committee Board of Xijing hospital (Xi'an, China) and
written informed consent was obtained from all participants. A
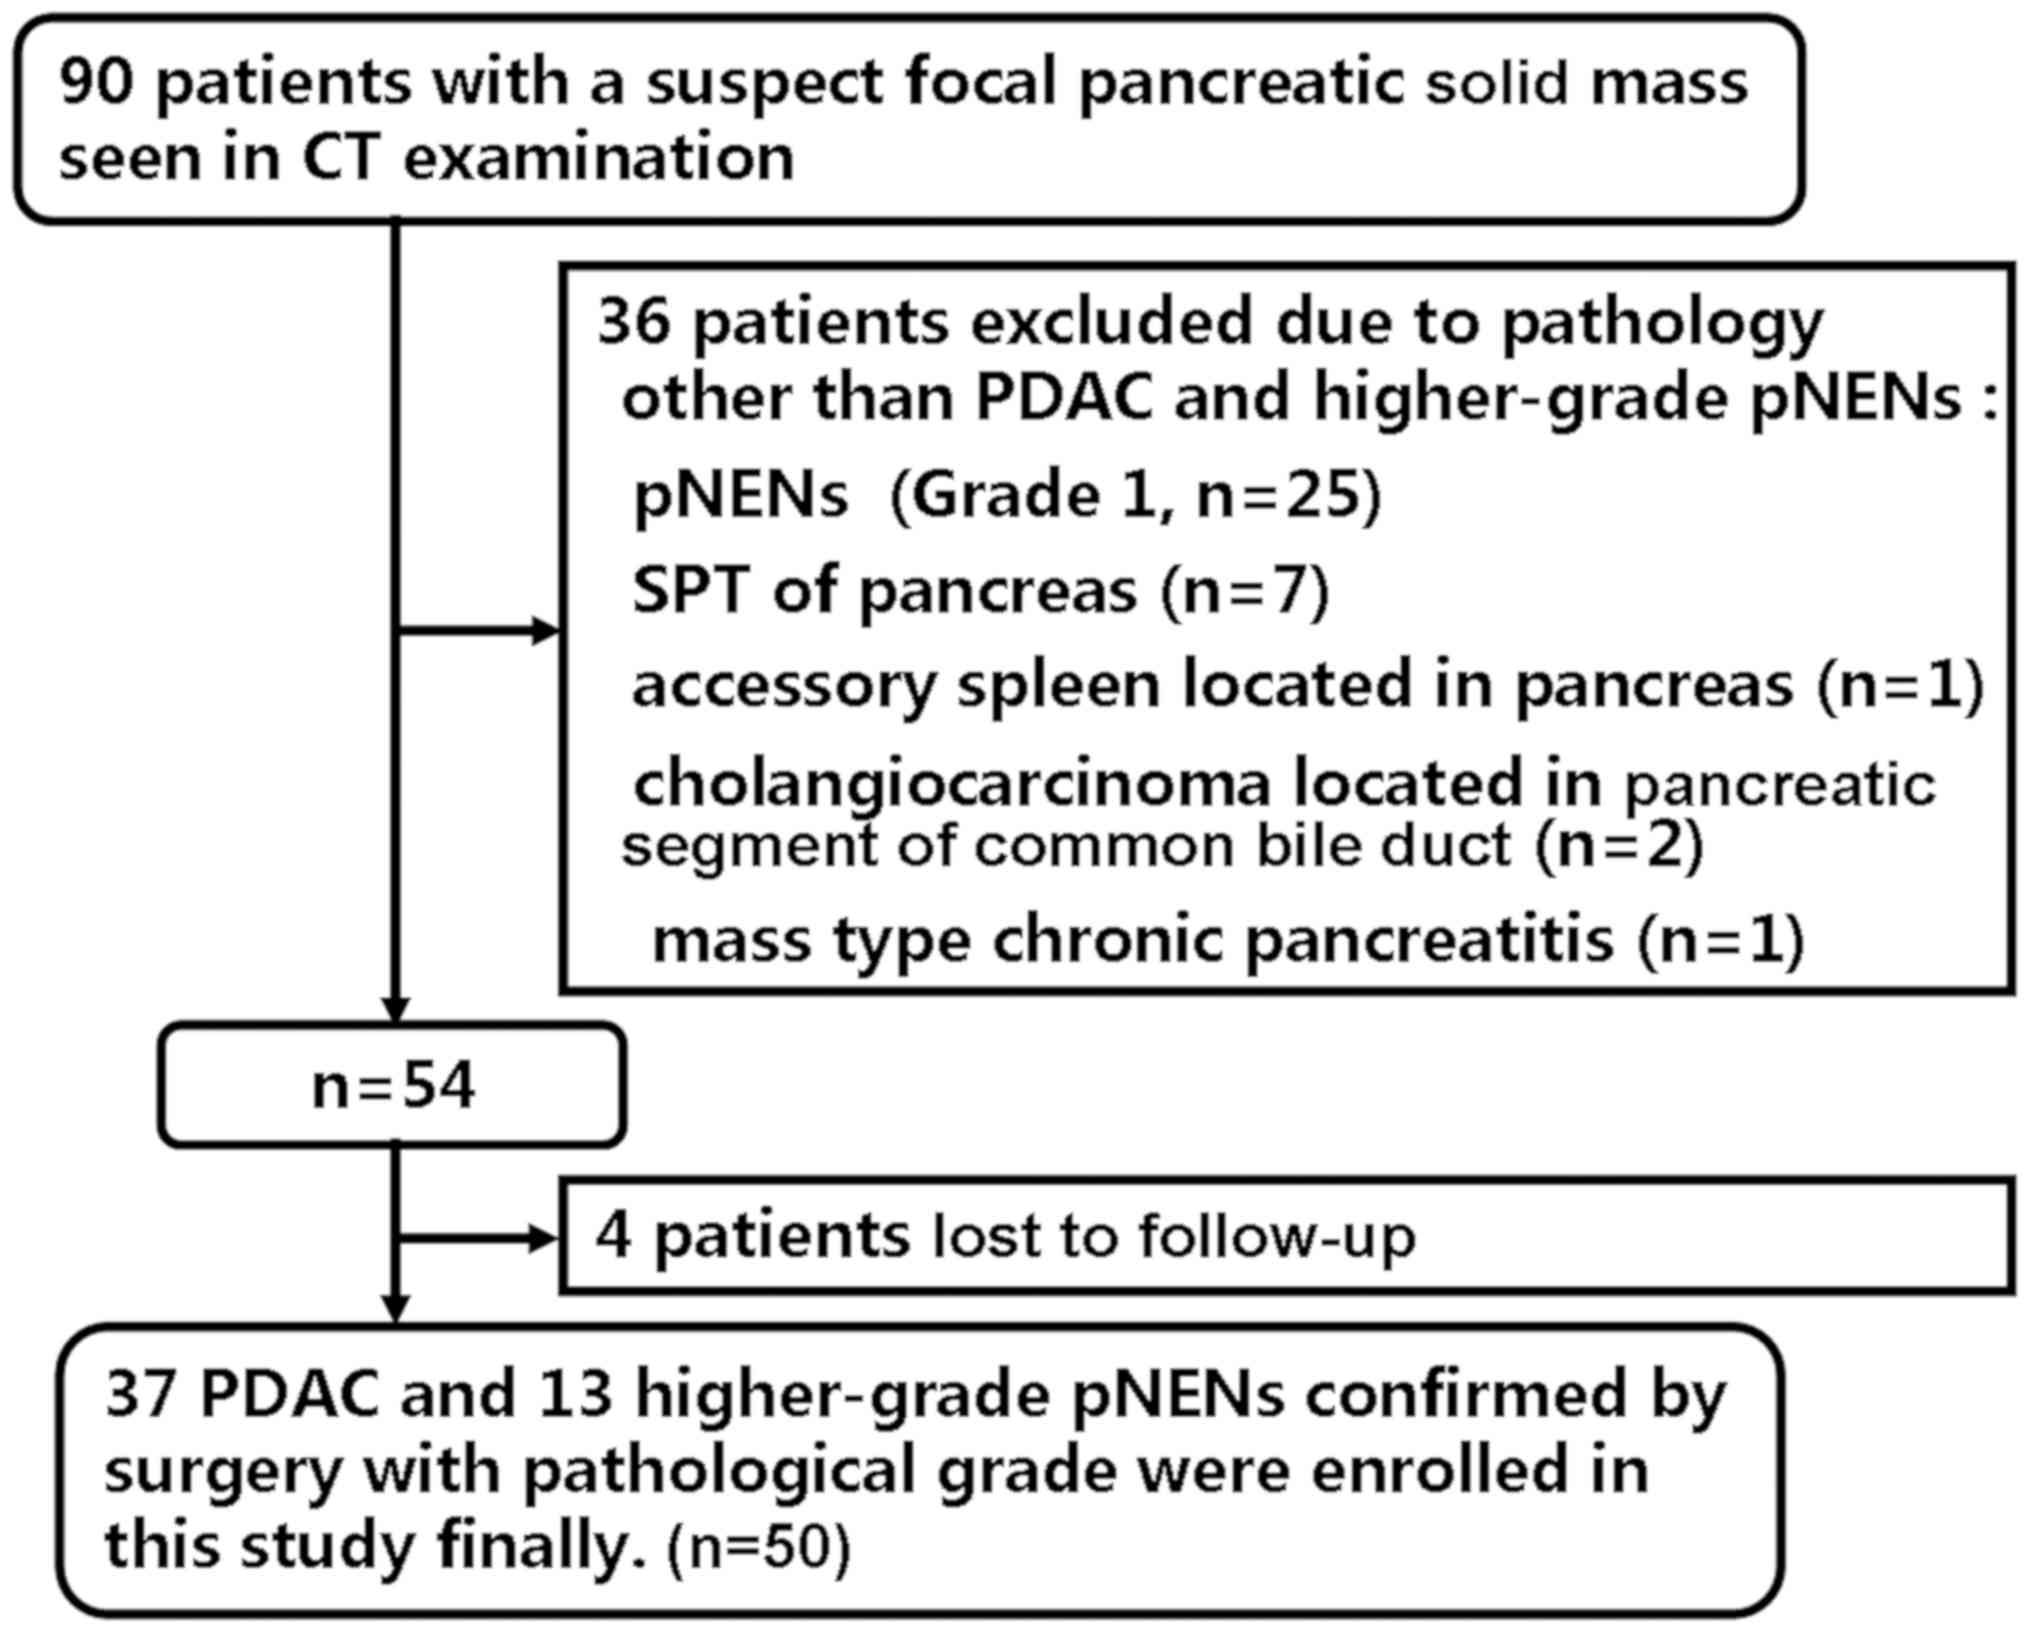
total of 90 patients with suspected pancreatic solid mass were
considered for inclusion in the present study between May 2014 and
April 2017. A total of 40 patients were excluded due to the
following exclusion criteria: i) Patients diagnosed with diseases
other than PDAC and high-grade pNENs (n=36) including grade 1 pNENs
(n=25), solid pseudopapillary tumor (n=7), accessory spleen located
in pancreas (n=1), cholangiocarcinoma located in pancreatic segment
of common bile duct (n=2) and mass-forming chronic pancreatitis
(n=1); ii) patients lost to the follow-up (n=4). The recruitment
process is illustrated in Fig.
1.
Image acquisition
All patients were examined on a Discovery MR750 3.0
T whole-body MR scanner (GE Healthcare Life Sciences) using a
32-channel phased-array coil. Pancreatic MR sequences comprised
axial fast spin echo transverse relaxation time-weighted images
(T2WI) with fat-suppression, axial breath-hold 3D liver
acquisition with volume acceleration Flex (LAVA Flex) and LAVA Flex
with contrast (Omniscan; GE Healthcare Life Sciences). Pancreatic
multiple b-value diffusion-weighted echo-planar imaging was
performed with 15 b-values, including 0, 10, 20, 40, 60, 80, 100,
150, 200, 400, 800, 1,000, 1,200, 1,500 and 2,000
sec/mm2. The detailed parameters of each sequence are
presented in Table I.
 | Table I.MRI parameters. |
Table I.
MRI parameters.
|
| Sequence |
|---|
|
|
|
|---|
| Parameters | Axial FSE
T2WI | Axial LAVA
Flex | DWI |
|---|
| Repetition time,
ms | 10,000 | 4.3 | 6600 |
| Echo time, ms | 70 | 1.6 | 81.5–82.3 |
| Slice thickness,
mm | 4.0 | 4.0 | 4.0 |
| Slice gap, mm | 0.5 | 0 | 1.0 |
| Matrix size,
slices | 320×320 × NS | 260×210 × NS | 128×128 × NS |
| Field of view,
mm | 360×360 | 360×324 | 380×304 |
| Number of
excitationsa | 1.5 | 1 | 1-8 |
| Flip angle, ° | 110 | 14 | 90 |
| Bandwidth,
Hz/pixel | 62.5 | 200 | 250 |
| Acquisition Time,
sec | 120-240 | 11 | 480-660 |
Image and data analysis
An abdominal radiologist with 11 years of MRI
experience blinded to the histopathological results analyzed the
acquired IVIM-DWI data. Following examination, all data were
transmitted to a built-in AW 4.6 workstation (GE Healthcare Life
Sciences) for post-processing. Functional maps of IVIM parameters
and a standard apparent diffusion coefficient
(ADCstandard) map were processed by mean ADC (MADC)
programs on the built-in AW 4.6 workstation.
ADCstandard was calculated using a
mono-exponential model including the total b-values. The equation
used was as follows: S(b)/S0=exp (-b ×
ADCstandard) (equation 1). IVIM parameters including
slow apparent diffusion coefficient (Dslow), fast
apparent diffusion coefficient (Dfast) and fraction of
fast apparent diffusion coefficient (ƒ) were calculated using
bi-exponential fitting by the segmented fitting method. The
equation used was as follows, as proposed by Le Bihan (20): S(b)/S0=(1-ƒ) × exp (-b ×
Dslow) + ƒ × exp (-b × Dfast) (equation 2),
where S(b) represents the mean signal intensity (SI) of a DW image
according to a specific b-value, S0 represents the mean
SI of a DW image when b=0, Dslow represents true tissue
diffusivity while tissue microcapillary perfusion is mainly
excluded, Dfast represents the mean velocity of the
flowing blood within capillaries and the microvascular architecture
and ƒ represents the ratio of molecular diffusion within
capillaries compared with the overall water molecular diffusion in
a voxel. As Dfast is larger compared with
Dslow by approximately one order of magnitude (22), -b × Dfast would be >-3
when the b>200 sec/mm2, and the ƒ × exp (-b ×
Dfast) value would be >0.05× ƒ. Therefore, ƒ × exp
(-b × Dfast) can be neglected and equation 2 can be
expressed as follows: S(b)/S0=(1-ƒ) × exp (-b ×
Dslow) (equation 3). As b-values were >200
sec/mm2, S(b) was fitted using equation 3 according to a
linear model, and Dslow was calculated. The ƒ value was
previously calculated according to equation 3; however, the
accuracy was unacceptable. Therefore, the ƒ-value was recalculated
according to equation 2. Subsequently, S(b) was fitted for all
b-values according to equation 2 with the Dslow value
fixed by the nonlinear Levenberg-Marquardt method (19). When equation 2 was fitted, the
initial estimated Dfast value was set as
10×10−3 mm2/sec, and the ƒ-value was set as
the previous ƒ-value calculated from equation 3. The
Dfast and ƒ values were then acquired.
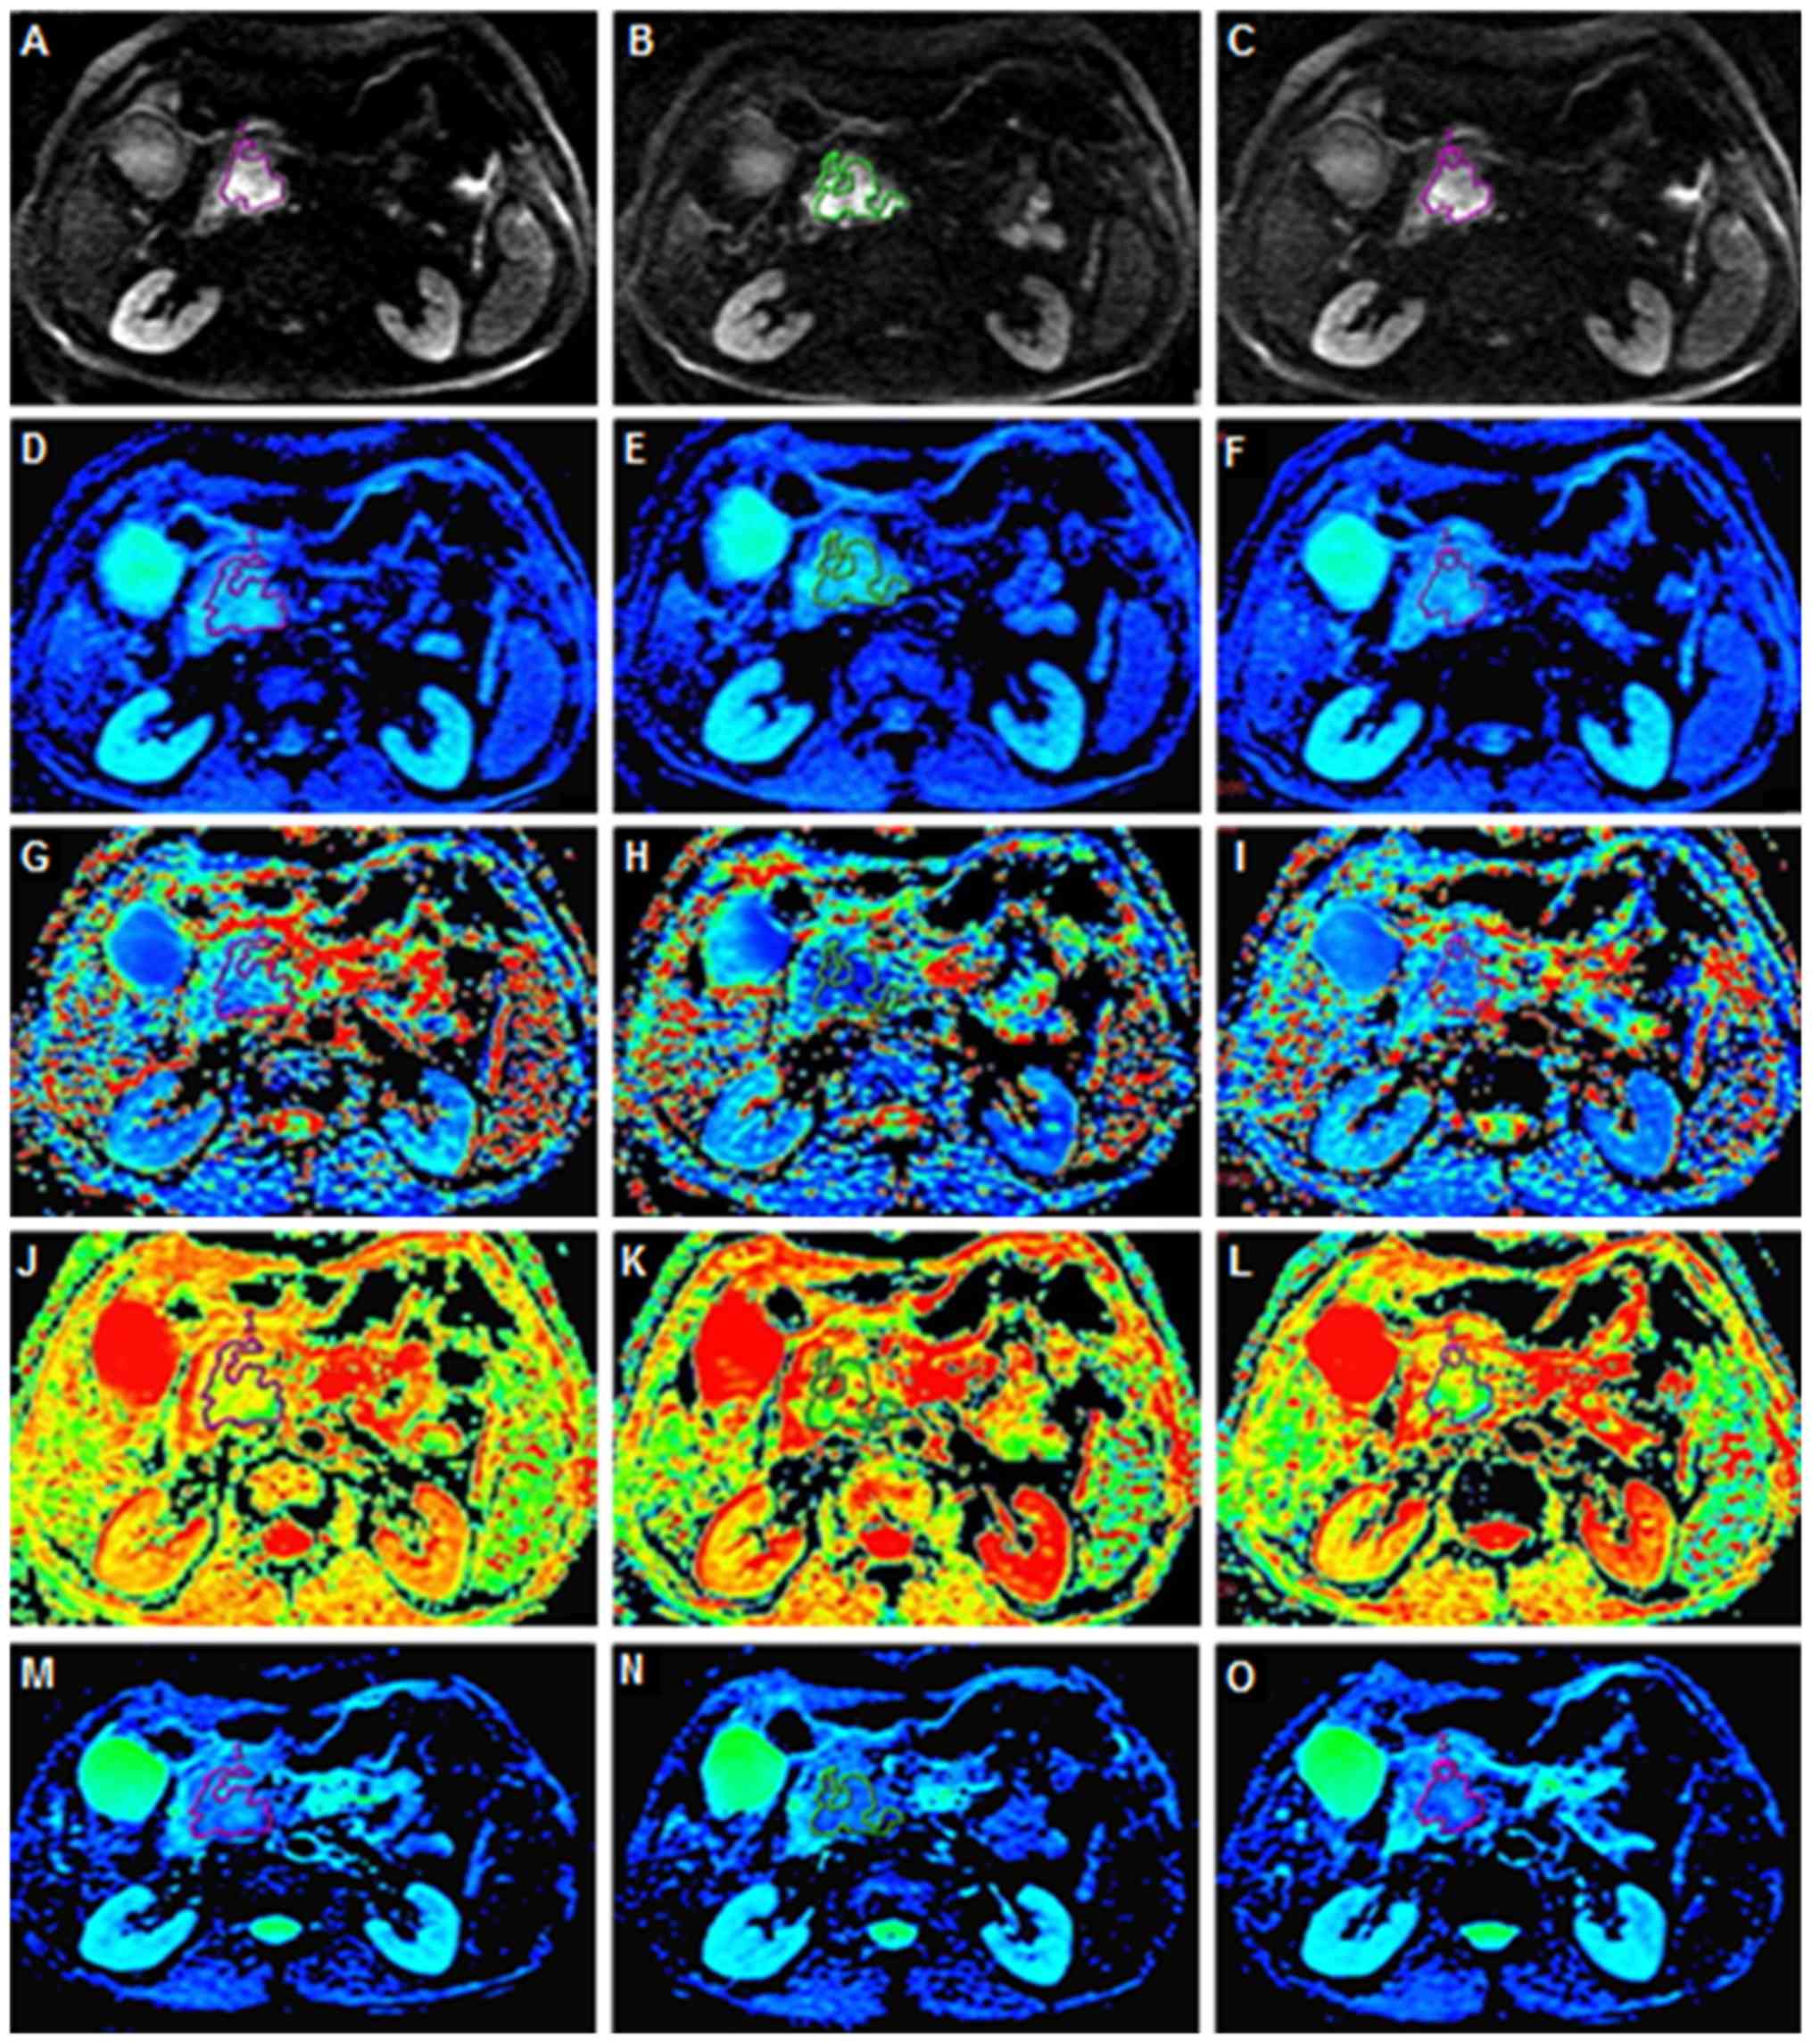
On the DW images that distinctly displayed the
tumors, irregular regions of interest (ROIs) for each PDAC and
pNENs were manually delineated along the edge of the tumor on three
consecutive largest lesion slices. During measurement, particular
efforts were made to exclude any areas of necrosis, the pancreatic
duct and vessels within the tumor. Well-matched ROI copies were
generated synchronously and appeared automatically on identical
locations in every functional map of IVIM-DWI parameters and
ADCstandard by built-in MADC software on an AW 4.6
workstation (GE Healthcare Life Sciences). The processes of ROI
setting on functional parameter maps are presented in Fig. 2. The mean value of the results of
three measurements was used as the final result. The ROI area range
of pNENs was between 22 and 1,379 mm2 with a mean area
of 372.22 mm2. The ROI area range of PDAC was between
136 and 1,025 mm2 with a mean area of 324.58
mm2.
Statistical analysis
All analyses were performed using SPSS software
version 17.0 for Windows (SPSS Inc.) and MedCalc software version
12.3 (MedCalc Software). The ADCstandard and IVIM-DWI
parameter values are presented as the mean ± standard deviation.
ADCstandard and IVIM-DWI parameter values were compared
using an independent sample Student's t-test. Receiver operating
characteristics (ROC) analysis was performed to evaluate the
diagnostic performance of IVIM-DWI parameters and to determine the
cut-off values using the maximum Youden index (the sum of
specificity and sensitivity). P<0.05 was considered to indicate
a statistically significant difference.
Results
Clinical and pathological
characteristics of patients and lesions
The clinical and pathological characteristics of
patients and lesions are summarized in Table II. A total of 50 patients including
13 cases of high-grade pNENs (grade 2, n=11; grade 3, n=2) and 37
cases of PDAC (well/moderately differentiated, n=21; poorly
differentiated, n=11; confirmed by biopsy without pathological
grades, n=5) confirmed by surgical pathology were included
(27). The pNENs cohort (mean age,
55.1 years; age range, 42–75 years) included 8 male and 5 female
patients. The clinical symptoms of the pNENs group included
hypoglycemia, epigastric pain and discomfort, thrombocytopenia and
splenomegaly. Among the pNENs group, one patient presented with
painless jaundice. The PDAC cohort (mean age, 57.5 years; age
range, 20–76 years) included 23 male and 14 female patients. The
clinical symptoms of the PDAC group included marasmus, dyspepsia
and abdominal and back pain. Among the PDAC group, 11 patients
presented with jaundice.
| Table II.Clinicopathological characteristics
of patients and lesions. |
Table II.
Clinicopathological characteristics
of patients and lesions.
|
Characteristics | PDAC | pNENs |
|---|
| Sex, n |
|
|
|
Male | 23 | 8 |
|
Female | 14 | 5 |
| Grading | a | b |
|
|
Well/moderately | Grade 2 |
|
| differentiated
(21) | (11) |
|
| Poorly | Grade 3 |
|
| differentiated
(11) | (2) |
|
| Confirmed by biopsy
without pathological grades (5) |
|
| Clinical
symptoms |
|
|
|
Painless jaundice | 11 | 1 |
|
Hypoglycemia | 0 | 3 |
|
Epigastric pain and
discomfort | 0 | 6 |
|
Thrombocytopenia and
splenomegaly | 0 | 1 |
|
Marasmus | 21 | 0 |
|
Dyspepsia | 13 | 0 |
|
Abdominal and back pain | 16 | 0 |
Conventional MRI results
The conventional MRI results of PDAC and pNENs are
presented in Table III. The mean
long diameter of pNENs was 3.31 cm (range, 0.89–5.58 cm). Among the
pNENs, 7 lesions were located in the head, 2 were in the body and 4
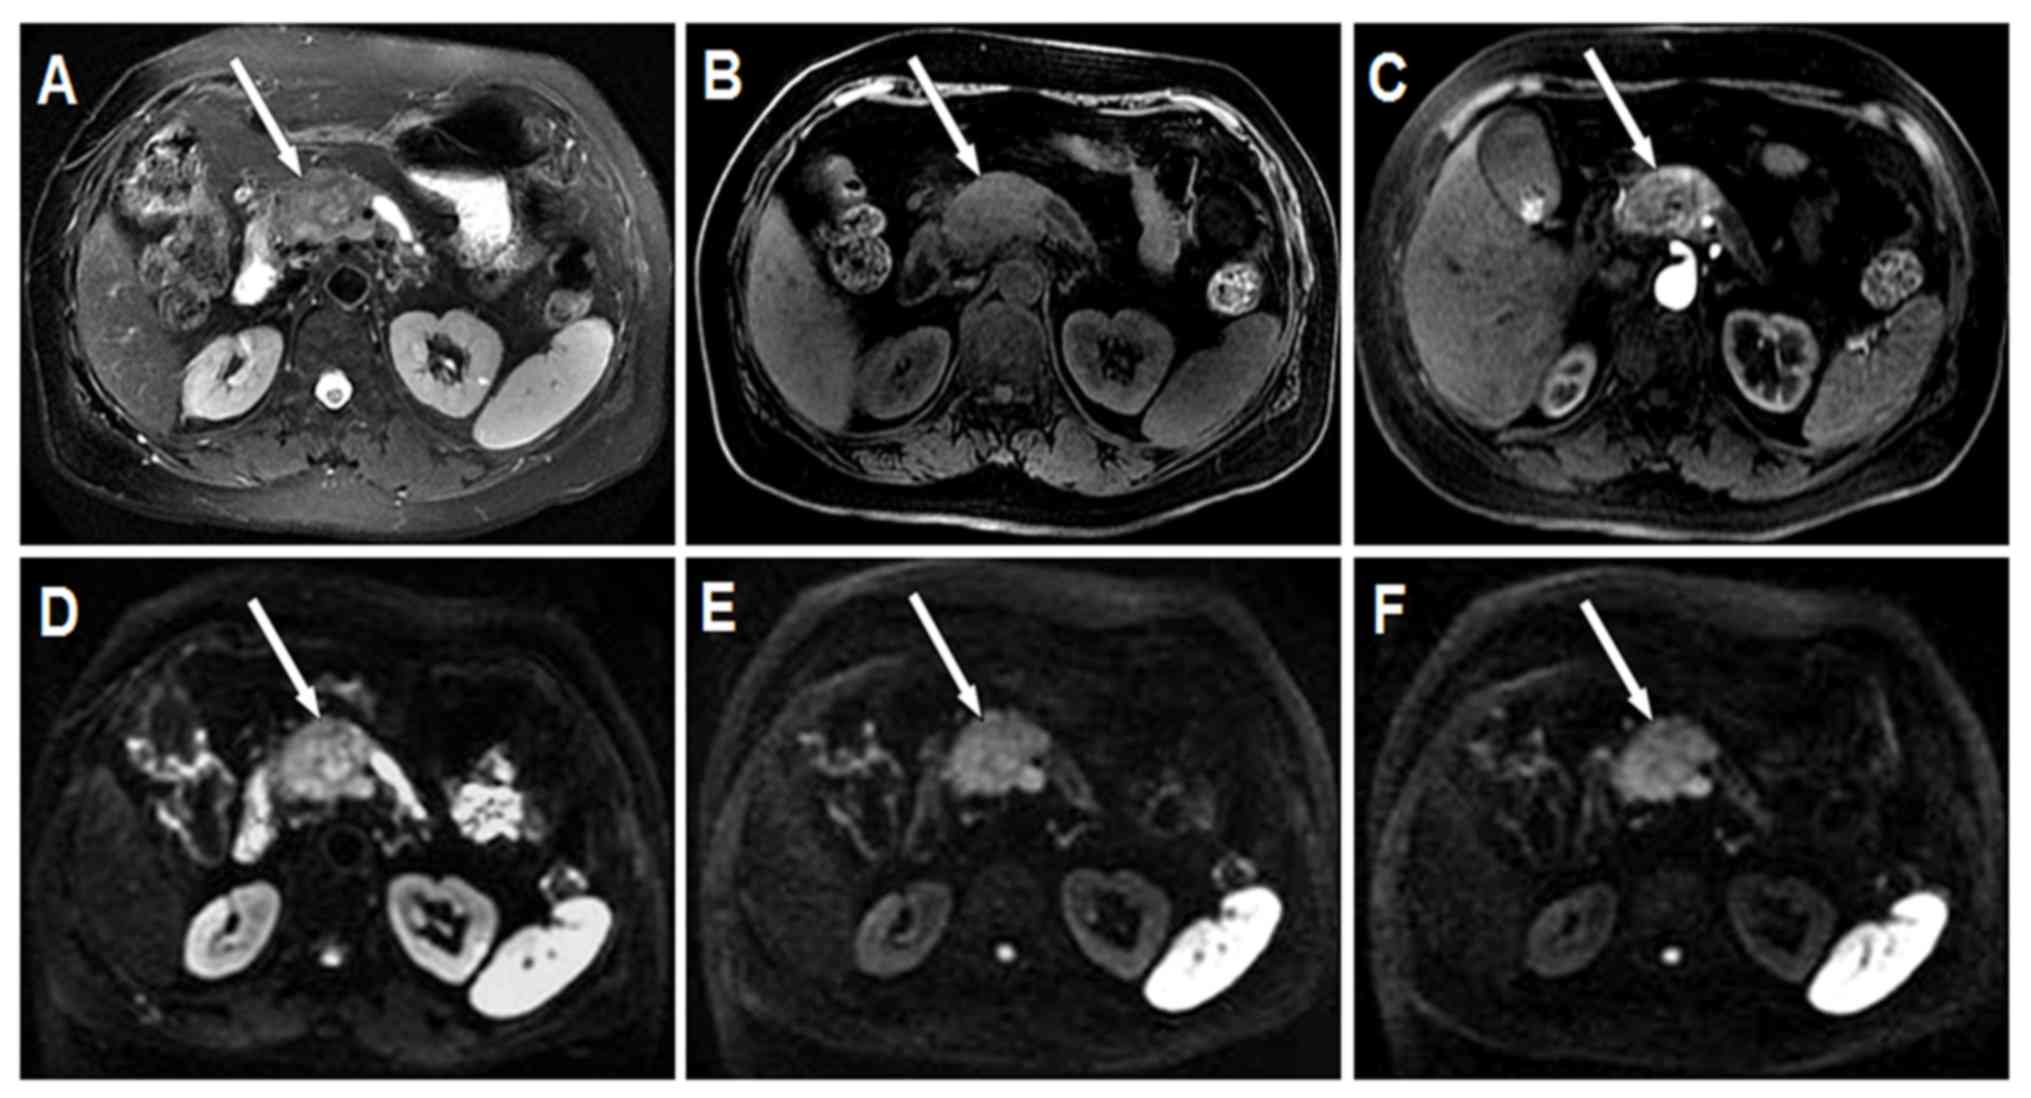
were in the tail of the pancreas. In the T2W images, 7
pNENs exhibited moderate hyperintensity, 4 exhibited slight
hyperintensity and 2 exhibited moderate hypointensity. In the LAVA
Flex water phase images, 12 pNENs exhibited moderate hypointensity
and 1 presented with slight hypointensity. In the LAVA Flex with
contrast images, all pNENs exhibited heterogeneous mild-to-moderate
hypo-enhancement on arterial phase imaging. Representative
conventional images of pNENs are presented in Fig. 3A-C. In the DW images, 12 pNENs
exhibited hyperintensity and 1 displayed hypointensity. Among the
12 hyperintensive pNENs, 5 (41.7%) exhibited heterogeneous SI and 7
(58.3%) exhibited homogeneous SI in DWI. In addition, 8 of 12
(66.7%) hyperintensive pNENs exhibited high SI in all b-value DW
images, including low b-value (b≤200 sec/mm2), moderate
b-value (200 sec/mm2<b≤1,500 sec/mm2) and
high b-value (b>1,500 sec/mm2). In addition, 4 of 12
(33.3%) hyperintensive pNENs demonstrated high SI in low and
moderate b-value DW images; however, they exhibited low SI in high
b-value DW images. Representative DW images of pNENs are presented
in Fig. 3D-F.
| Table III.Conventional magnetic resonance
imaging results. |
Table III.
Conventional magnetic resonance
imaging results.
| Characteristic | PDAC, n | pNENs, n |
|---|
| Site |
|
|
| Head of
pancreas | 20 | 7 |
| Neck of
pancreas | 6 | 0 |
| Body of
pancreas | 8 | 2 |
| Tail of
pancreas | 3 | 4 |
| T2W
images |
|
|
|
Moderate hyperintensity | 29 | 7 |
| Slight
hyperintensity | 5 | 4 |
|
Isointensity | 1 | 0 |
|
Moderate hypointensity | 0 | 2 |
| Slight
hypointensity | 2 | 0 |
| LAVA Flex water
phase images |
|
|
|
Moderate hypointensity | 26 | 12 |
| Slight
hypointensity | 7 | 1 |
|
Isointensity | 3 | 0 |
| Slight
hyperintensity | 1 | 0 |
| LAVA Flex with
contrast images |
|
|
|
Heterogeneous hypo-enhancement
with a different degree | 37 | 13 |
| DWI |
|
|
|
Hyperintensity | 36 | 12 |
| All
b-values | 27 | 8 |
| Low and
moderate b-value (0<b≤1,500 sec/mm2) | 9 | 4 |
|
Hypointensity | 1 | 1 |
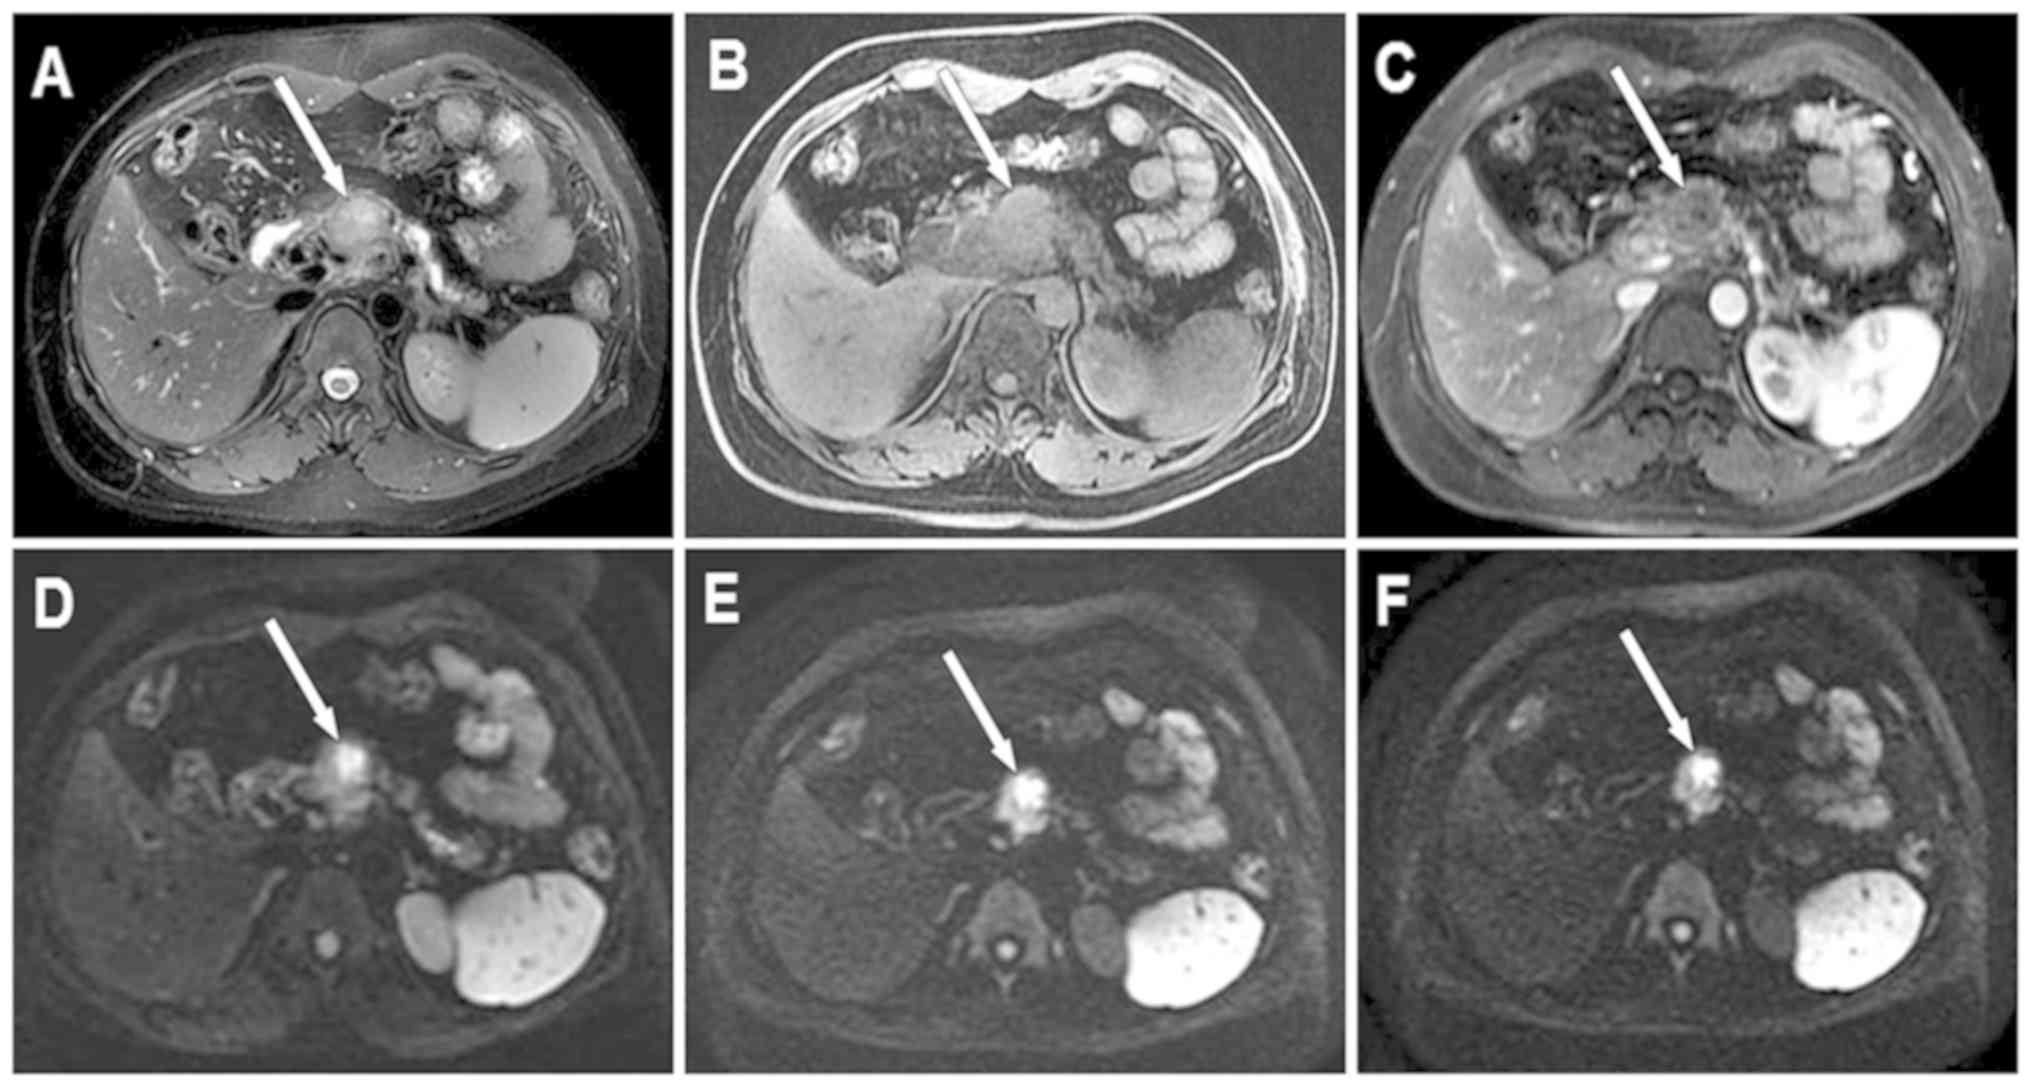
The mean long diameter of PDAC was 4.03 cm (range,
2.05–6.82 cm). Among the PDAC cohort, 20 lesions were located in
the head, 6 in the neck, 8 in the body and 3 in the tail of the
pancreas. In the T2W images, 29 PDAC exhibited moderate
hyperintensity, 5 exhibited slight hyperintensity, 1 exhibited
isointensity and 2 exhibited slight hypointensity. In the LAVA Flex
water phase images, 26 PDAC exhibited moderate hypointensity, 7
exhibited slight hypointensity, 1 exhibited slight hyperintensity
and 3 exhibited isointensity. In the LAVA Flex with contrast
images, all PDAC exhibited heterogeneous hypo-enhancement with
different degrees in arterial phase imaging. Representative
conventional images of PDAC are presented in Fig. 4A-C. In the DW images, 36 PDAC cases
exhibited significant hyperintensity and 1 exhibited slight
hypointensity. In addition, 27 of 36 (75%) hyperintensive PDAC
exhibited heterogeneous SI and 9 (25%) indicated homogeneous SI in
DWI. Among the 36 hyperintensive PDAC, 27 (75%) demonstrated high
SI in all b-value DW images; however, 9 (25%) exhibited high SI in
low and moderate b-value DW images only. Representative DW images
of PDAC are presented in Fig.
4D-F.
Comparison of IVIM-DWI parameters
IVIM-DWI parameters of PDAC and pNENs are presented
in Table IV. The mean
Dslow value was significantly lower in pNENs compared
with that in PDAC (0.460×10⁻³ vs. 0.579×10⁻³
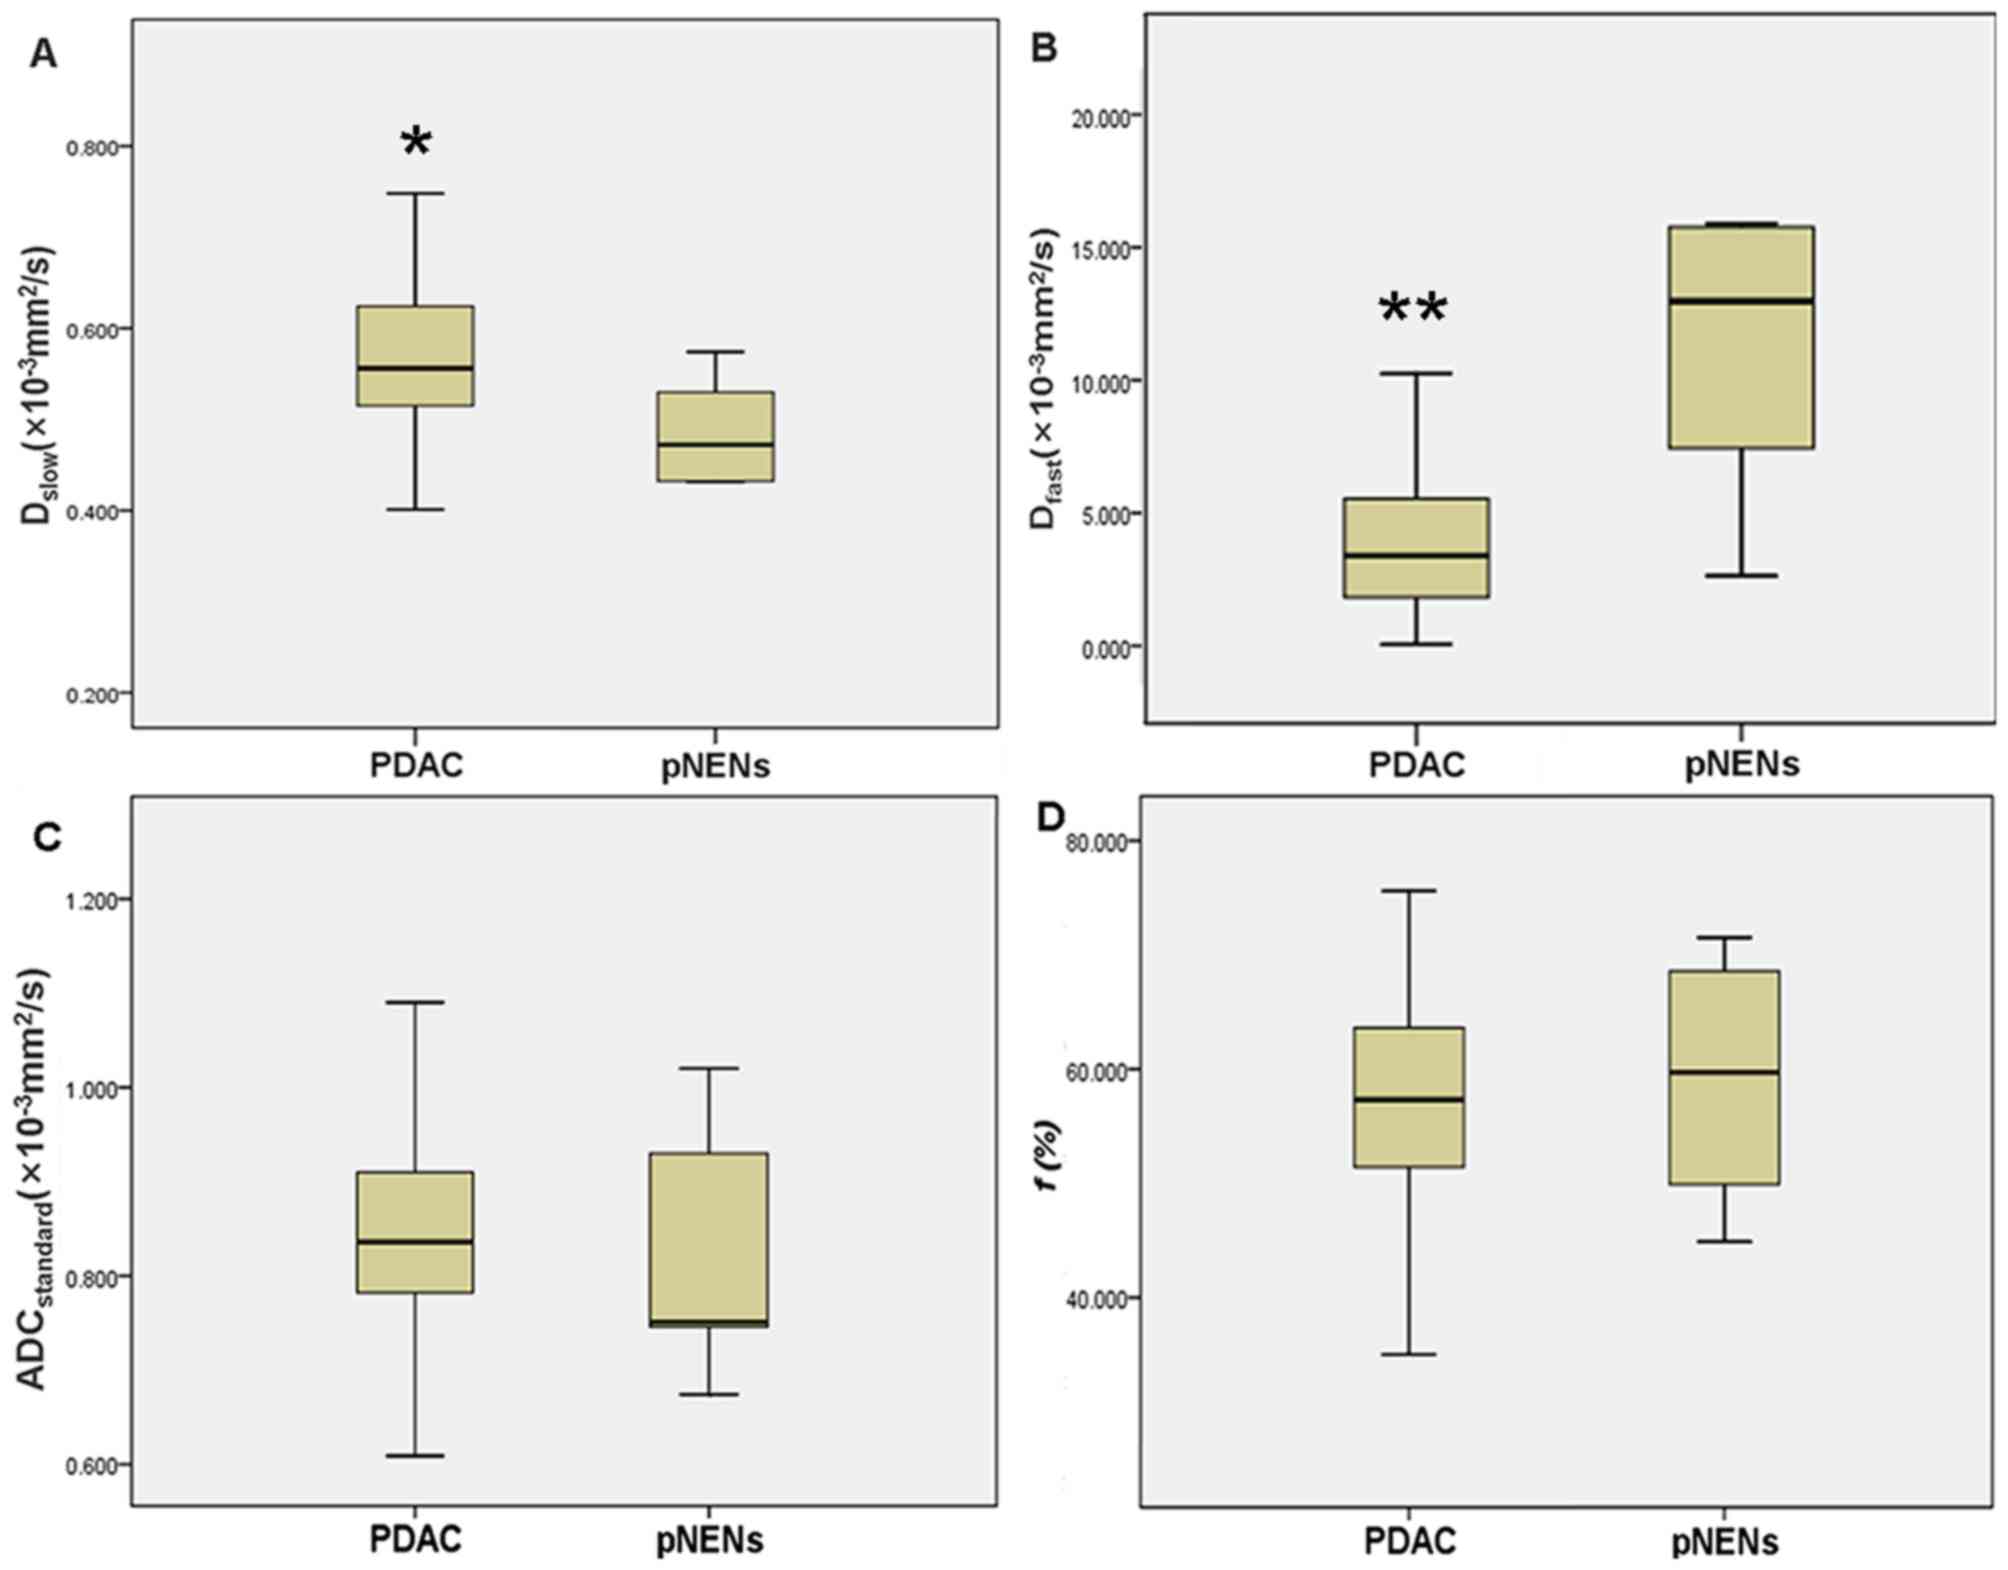
mm2/sec; t=3.509; P=0.001) (Fig. 5A), whereas the mean Dfast
value was significantly higher in pNENs compared with that in PDAC
(13.361×10⁻³ vs. 4.985×10⁻³
mm2/sec; t=5.071; P<0.001) (Fig. 5B). For ADCstandard and ƒ,
no significant differences were observed between pNENs and PDAC
(0.818×10⁻³ vs. 0.863×10⁻³
mm2/sec; t=0.961; P=0.341; and 59.5 vs. 55.8%; t=0.872;
P=0.388, respectively) (Fig. 5C and
D).
| Table IV.Intravoxel incoherent motion and
diffusion weighted imaging parameters of PDAC and pNENs. |
Table IV.
Intravoxel incoherent motion and
diffusion weighted imaging parameters of PDAC and pNENs.
| Coefficient | PDAC (n=37) | pNENs (n=13) | t-value | P-value |
|---|
|
ADCstandard (×10−3
mm2/sec) | 0.863±0.152 | 0.818±0.120 | 0.961 | 0.341 |
| Dslow
(×10−3 mm2/sec) | 0.579±0.104 | 0.460±0.108 | 3.509 | 0.001 |
| Dfast
(×10−3 mm2/sec) | 4.985±3.589 | 13.361±8.145 | 5.071 | <0.001 |
| ƒ (%) | 55.8±13.6 | 59.5±10.1 | 0.872 | 0.388 |
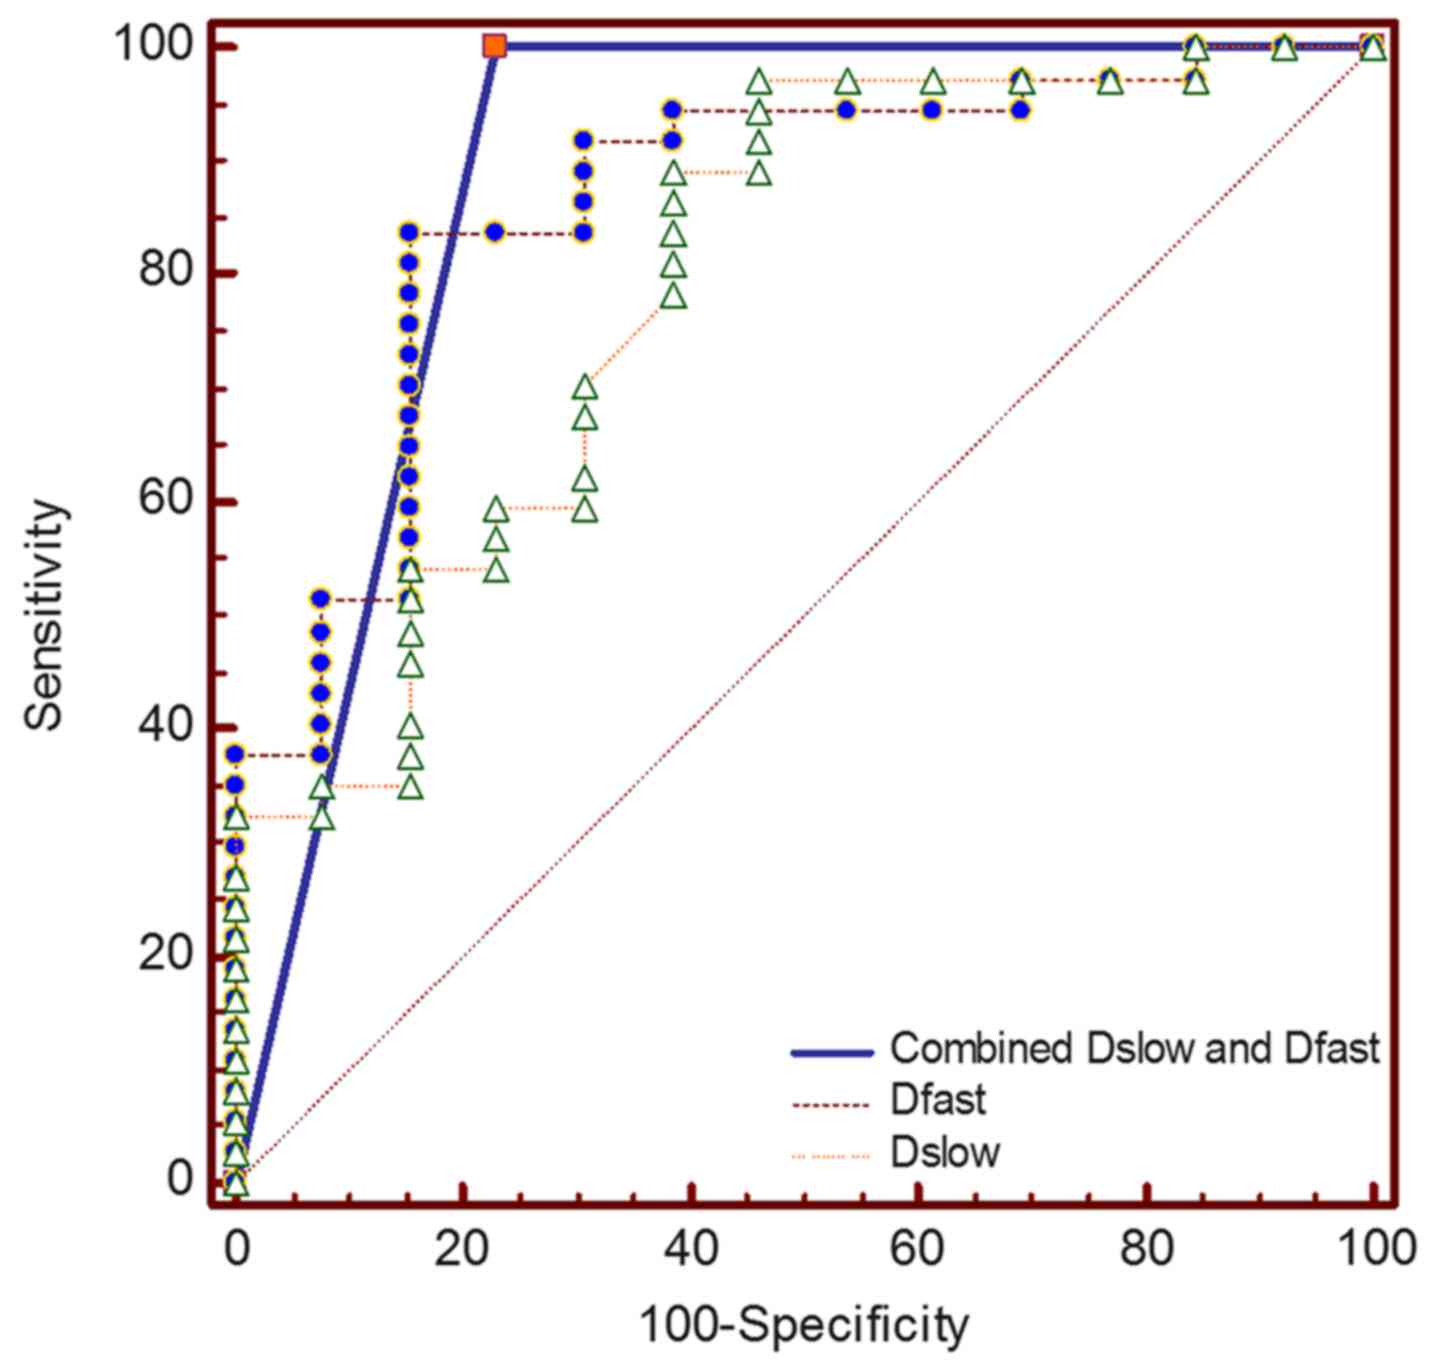
ROC curves for differentiating pNENs from PDAC using
Dslow and Dfast are presented in Fig. 6. The optimal cut-off values and AUC
in differentiating pNENs from PDAC are listed in Table V. The AUC for Dfast was
slightly larger compared with that for Dslow (0.863 vs.
0.793; P=0.499), whereas the AUC for combined Dslow and
Dfast was slightly larger compared with that for
Dslow or Dfast alone (0.885 vs. 0.793;
P=0.257; 0.885 vs. 0.863; P=0.757, respectively). When
Dslow value was ≤0.472×10⁻³
mm2/sec, the specificity and sensitivity for
differentiating pNENs from PDAC were 97.3 and 53.9%, respectively.
When Dfast value was >9.58×10⁻³
mm2/sec, the specificity and sensitivity for
differentiating pNENs from PDAC were 91.9 and 69.2%, respectively.
When Dslow and Dfast were combined, the
specificity and sensitivity for differentiating high-grade pNENs
from PDAC were 76.9 and 100%, respectively.
| Table V.Results of the receiver operating
characteristic analysis for Dslow and
Dfast. |
Table V.
Results of the receiver operating
characteristic analysis for Dslow and
Dfast.
| Coefficient | AUC (95% CI) | Optimal
cut-off | Sensitivity
(%) | Specificity
(%) | P-value |
|---|
|
Dslow | 0.793
(0.655–0.895) |
≤0.472×10⁻³
mm2/sec | 53.9 | 97.3 | 0.499a |
|
Dfast | 0.863
(0.736–0.944) |
>9.58×10⁻³
mm2/sec | 69.2 | 91.9 | 0.757b |
| Combined
Dslow and Dfast | 0.885
(0.763–0.958) | – | 100 | 76.9 | 0.257c |
Discussion
The present study identified statistically
significant differences in Dfast and Dslow
between PDAC and pNENs. The differences in ADCstandard
and ƒ exhibited no significance between PDAC and pNENs. The ADC
value is the most commonly used parameter for evaluating tissue
diffusion that serves as a marker of cellularity (28,29),
which is additionally decreased in solid malignant tumors compared
with benign tumors or cystic lesions (30). The ADC value can be a surrogate
biomarker for tumor cell proliferation and predict the grade of a
variety of neoplasms (31,32). However, previous studies have
demonstrated that not both water diffusion within tissue
microstructures and the undirected movement of particles within the
capillaries can influence the obtained ADC value (19,33). The
present study revealed that the ADCstandard of PDAC was
slightly higher compared with that of pNENs. The measurement of the
ADC value is biased by the effects of microcirculatory perfusion,
which may impact the accuracy of ADC in evaluating pancreatic
lesions (33).
The IVIM-derived parameter Dslow
represents the pure diffusion component reflecting tissue
microstructure without perfusion effects (34). The predominant histological features
of PDAC include not only the dense tumor cellularity, but also
progressive fibrosis (35).
Restrained molecular diffusion in PDAC may be attributed to an
exceeding cellular structure and extracellular fibrosis (36). Previous studies have demonstrated
that the lower Dslow value of pNENs (grade 2 or 3) may
be caused by the increased tumor cellularity (25,37).
However, necrosis is also one of the pathological features in PDAC
and may be associated with increasing diffusion (30). The results of the present study
demonstrated that 75.0% hyperintensive PDAC appeared as
heterogeneous SI in DW images, whereas only 41.7% hyperintensive
pNENs exhibited heterogeneous SI in DW images. This may be the
cause for the results obtained in the present study, as the
Dslow of PDAC was significantly higher compared with
that of pNENs. Therefore, Dslow may be more useful
compared with conventional ADC in differentiating pNENs and PDAC by
eliminating microperfusion effects in a capillary bed.
The results of the present study demonstrated that
Dfast of PDAC was notably lower compared with that of
pNENs. The ƒ of PDAC was slightly lower compared with that of
pNENs. Dfast is associated with blood flow and velocity
within microcirculation (19,22).
Parameter ƒ is associated with the proportion of protons in
microcirculation within a voxel (29). Poor blood supply leads to a lower
blood volume and flow in PDAC compared with a normal pancreas
(38). Due to abundant fibrosis and
relatively sparse vascularity of PDAC, the enhancement degree of
PDAC is lower compared with that of normal pancreatic tissue,
especially in early post-contrast images (35,38).
However, pNENs typically demonstrate fast and strong enhancement in
early contrast-enhanced images due to abundant vascularity
(7,39). A study by Kang et al (24) demonstrated that tissue perfusion may
be a more important factor compared with diffusion in
differentiating pNENs from PDAC. The results of the present study
indicated that Dfast and ƒ of pNENs were higher compared
with those of PDAC due to different vascular perfusion, which was
in agreement with the results obtained by Kang et al
(24), although no significant
differences in ƒ were identified between pNENs and PDAC. High-grade
pNENs including grade 2 and 3 exhibit a lower vascularity and MVD
(11–12), which leads to a decreased ƒ value of
pNENs, similar to that of PDAC. Unlike the study by Kang et
al (24), which stated that
Dslow was not useful in differentiating PDAC and pNENs,
the results obtained in the present study demonstrated that the
Dslow of PDAC was significantly higher compared with
that of pNENs. This may be due to Kang et al using only nine
b-values in IVIM-DWI; however, 15 b-values were used in the present
study. Therefore, in order to obtain high-quality IVIM-DWI, at
least 10 b-values should be used (40).
The present study demonstrated that the optimal AUC
was achieved by combining Dslow and Dfast
(AUC, 0.885), which was followed by Dfast and
Dslow alone (AUC, 0.863 and 0.793 respectively). The
highest specificity was identified for Dslow (97.3%),
which was closely followed by Dfast (91.9%). When
Dslow and Dfast were combined, the
sensitivity for differentiating high-grade pNENs from PDAC was
100.0%. Therefore, Dslow and Dfast may be the
ideal screening indicators in differentiating high-grade pNENs from
PDAC.
There were certain limitations to the present study.
For example, the sample size of the present study was relatively
small, particularly regarding the limited number of high-grade
pNENs due to its low incidence. However, all patients underwent
surgery and were confirmed by histopathology. Secondly, the present
study did not analyze the association between histopathology and
IVIM-DWI parameters. This was due to the small sample size of
different pathological grades pNENs and PDAC. Additional subjects
need to be recruited in order to investigate the association
between histopathology and IVIM-DWI parameters of pNENs and PDAC in
further studies. In addition, dynamic contrast enhancement
(DCE)-MRI was not performed in the present study due to the
patients' preferences. The association between DCE-MRI and IVIM-DWI
parameters will be investigated in our future studies. An
additional limitation of the present study was that the b-values
selected may have been suboptimal. Therefore, optimal b-values
should be selected in any future studies to balance the least
sampling time and the reliability of parameter estimation. Finally,
a control group with normal pancreas was not included in the
present study. This will be evaluated in further studies with
larger populations.
In conclusion, the results of the present study
demonstrated that the diffusion parameter Dslow and the
perfusion parameter Dfast derived from IVIM-DWI may be
reliable in differentiating high-grade pNENs from PDAC with high
diagnostic accuracy. In addition, IVIM-DWI may be a potential
technique to function as a surrogate biomarker in distinguishing
pancreatic neoplasms.
Acknowledgements
Not applicable.
Funding
The present study received funding from the National
Natural Science Foundation of China (grant nos. NSFC 81220108011
and NSFC 81370039) and Shaanxi Social Development Science and
Technology Plan (grant no. 2016SF-295).
Availability of data and materials
The datasets used and/or analyzed during the present
study are available from the corresponding author upon reasonable
request.
Authors' contributions
WM, MW and NL participated in the study conception
and design. ZH, YT, QP and GZ collected and analyzed the patients'
clinical data. WM, MW and JR collected and analyzed the patients'
imaging data. WM, MW, ZH, YT, QP, GZ, JR, YH and NL participated in
the interpretation of the patients' imaging data. WM and MW
prepared the first draft of the manuscript. YH and NL revised the
manuscript critically for important intellectual content. NL gave
final approval of the version to be published. All authors revised
and approved the final manuscript.
Ethics approval and consent to
participate
Ethical approval was acquired from the Institutional
Ethics Committee Board of Xijing Hospital (Xi'an, China), and
written informed consent was obtained from all participants prior
to collecting the data.
Patient consent for publication
Not applicable.
Competing interests
The authors declare that they have no competing
interests.
Glossary
Abbreviations
Abbreviations:
|
ADC
|
apparent diffusion coefficient
|
|
AUC
|
area under curve
|
|
DCE
|
dynamic contrast enhancement
|
|
DWI
|
diffusion weighted imaging
|
|
IVIM
|
intravoxel incoherent motion
|
|
IVIM-DWI
|
intravoxel incoherent motion diffusion
weighted imaging
|
|
LAVA
|
liver acquisition with volume
acceleration
|
|
pNENs
|
pancreatic neuroendocrine
neoplasms
|
|
MVD
|
microvascular density
|
|
PDAC
|
pancreatic ductal adenocarcinoma
|
|
ROC
|
receiver operating characteristics
|
|
ROIs
|
regions of interest
|
|
SI
|
signal intensity
|
References
|
1
|
Klimstra DS, Pitman MB and Hruban RN: An
algorithmic approach to the diagnosis of pancreatic neoplasms. Arch
Pathol Lab Med. 133:454–464. 2009.PubMed/NCBI
|
|
2
|
Keutgen XM, Nilubol N and Kebebew E:
Malignant-functioning neuroendocrine tumors of the pancreas: A
survival analysis. Surgery. 159:1382–1389. 2016. View Article : Google Scholar : PubMed/NCBI
|
|
3
|
Kim JY, Hong SM and Ro JY: Recent updates
on grading and classification of neuroendocrine tumors. Ann Diagn
Pathol. 29:11–16. 2017. View Article : Google Scholar : PubMed/NCBI
|
|
4
|
Parekh JR, Wang SC, Bergsland EK, Venook
AP, Warren RS, Kim GE and Nakakura EK: Lymph node sampling rates
and predictors of nodal metastasis in pancreatic neuroendocrine
tumor resections: The UCSF experience with 149 patients. Pancreas.
41:840–844. 2012. View Article : Google Scholar : PubMed/NCBI
|
|
5
|
Cloyd JM and Poultsides GA: Non-functional
neuroendocrine tumors of the pancreas: Advances in diagnosis and
management. World J Gastroenterol. 21:9512–9525. 2015. View Article : Google Scholar : PubMed/NCBI
|
|
6
|
Kloppel G and Heitz PU: Pancreatic
endocrine tumors. Pathol Res Pract. 183:155–168. 1988. View Article : Google Scholar : PubMed/NCBI
|
|
7
|
Philips S, Shah SN, Vikram R, Verma S,
Shanbhogue AK and Prasad SR: Pancreatic endocrine neoplasms: A
current update on genetics and imaging. Br J Radiol. 85:682–696.
2012. View Article : Google Scholar : PubMed/NCBI
|
|
8
|
Tesfaye AA, Kamgar M, Azmi A and Philip
PA: The evolution into personalized therapies in pancreatic ductal
adenocarcinoma: Challenges and opportunities. Expert Rev Anticancer
Ther. 18:131–148. 2018. View Article : Google Scholar : PubMed/NCBI
|
|
9
|
Kourie H, Auclin E, Cunha AS, Gaujoux S,
Bruzzi M, Sauvanet A, Lourenco N, Trouilloud I, Louafi S, El-Hajjar
A, et al: Characteristic and outcomes of patients with pathologic
complete response after preoperative treatment in borderline and
locally advanced pancreatic adenocarcinoma: An AGEO multicentric
retrospective cohort. Clin Res Hepatol Gastroenterol. Apr
24–2019.doi: 10.1016/j.clinre.2019.03.007 (Epub ahead of print).
View Article : Google Scholar : PubMed/NCBI
|
|
10
|
Couvelard A, O'Toole D, Turley H, Leek R,
Sauvanet A, Degott C, Ruszniewski P, Belghiti J, Harris AL, Gatter
K and Pezzella F: Microvascular density and hypoxia-inducible
factor pathway in pancreatic endocrine tumours: Negative
correlation of microvascular density and VEGF expression with
tumour progression. Br J Cancer. 92:94–101. 2005. View Article : Google Scholar : PubMed/NCBI
|
|
11
|
d'Assignies G, Couvelard A, Bahrami S,
Vullierme MP, Hammel P, Hentic O, Sauvanet A, Bedossa P,
Ruszniewski P and Vilgrain V: Pancreatic endocrine tumors: $umor
blood flow assessed with perfusion CT reflects angiogenesis and
correlates with prognostic factors. Radiology. 250:407–416. 2009.
View Article : Google Scholar : PubMed/NCBI
|
|
12
|
Jang KM, Kim SH, Lee SJ and Choi D: The
value of gadoxetic acid enhanced and diffusion-weighted MRI for
prediction of grading of pancreatic neuroendocrine tumors. Acta
Radiol. 55:140–148. 2014. View Article : Google Scholar : PubMed/NCBI
|
|
13
|
Herwick S, Miller FH and Keppke AL: MRI of
islet cell tumors of the pancreas. AJR Am J Roentgenol.
187:W472–W480. 2006. View Article : Google Scholar : PubMed/NCBI
|
|
14
|
Worhunsky DJ, Krampitz GW, Poullos PD,
Visser BC, Kunz PL, Fisher GA, Norton JA and Poultsides GA:
Pancreatic neuroendocrine tumours: Hypoenhancement on arterial
phase computed tomography predicts biological aggressiveness. HPB
(Oxford). 16:304–311. 2014. View Article : Google Scholar : PubMed/NCBI
|
|
15
|
Rodallec M, Vilgrain V, Couvelard A, Rufat
P, O'Toole D, Barrau V, Sauvanet A, Ruszniewski P and Menu Y:
Endocrine pancreatic tumours and helical CT: Contrast enhancement
is correlated with microvascular density, histoprognostic factors
and survival. Pancreatology. 6:77–85. 2006. View Article : Google Scholar : PubMed/NCBI
|
|
16
|
Pasaoglu E, Dursun N, Ozyalvacli G,
Hacihasanoglu E, Behzatoglu K and Calay O: Comparison of World
Health Organization 2000/2004 and World Health Organization 2010
classifications for gastrointestinal and pancreatic neuroendocrine
tumors. Ann Diagn Pathol. 19:81–87. 2015. View Article : Google Scholar : PubMed/NCBI
|
|
17
|
Karakuş E, Helvacı A, Ekinci O and Dursun
A: Comparison of WHO 2000 and WHO 2010 classifications of
gastroenteropancreatic neuroendocrine tumors. Turk J Gastroenterol.
25:81–87. 2014. View Article : Google Scholar
|
|
18
|
Le Bihan D, Breton E, Lallemand D, Grenier
P, Cabanis E and Laval-Jeantet M: MR imaging of intravoxel
incoherent motions: Application to diffusion and perfusion in
neurologic disorders. Radiology. 161:401–407. 1986. View Article : Google Scholar : PubMed/NCBI
|
|
19
|
Le Bihan D, Breton E, Lallemand D, Aubin
ML, Vignaud J and Laval-Jeantet M: Separation of diffusion and
perfusion in intravoxel incoherent motion MR imaging. Radiology.
168:497–505. 1988. View Article : Google Scholar : PubMed/NCBI
|
|
20
|
Le Bihan D and Turner R: The capillary
network: A link between IVIM and classical perfusion. Magn Reson
Med. 27:171–178. 1992. View Article : Google Scholar : PubMed/NCBI
|
|
21
|
Agarwal R, Brunelli SM, Williams K,
Mitchell MD, Feldman HI and Umscheid CA: Gadolinium-based contrast
agents and nephrogenic systemic fibrosis: A systematic review and
meta-analysis. Nephrol Dial Transplant. 24:856–63. 2009. View Article : Google Scholar : PubMed/NCBI
|
|
22
|
Le Bihan D: Intravoxel incoherent motion
perfusion MR imaging: A wake-up call. Radiology. 249:748–752. 2008.
View Article : Google Scholar : PubMed/NCBI
|
|
23
|
Lee HJ, Rha SY, Chung YE, Shim HS, Kim YJ,
Hur J, Hong YJ and Choi BW: Tumor perfusion-related parameter of
diffusion-weighted magnetic resonance imaging: Correlation with
histological microvessel density. Magn Reson Med. 71:1554–1558.
2014. View Article : Google Scholar : PubMed/NCBI
|
|
24
|
Kang KM, Lee JM, Yoon JH, Kiefer B, Han JK
and Choi BI: Intravoxel incoherent motion diffusion-weighted MR
imaging for characterization of focal pancreatic lesions.
Radiology. 270:444–453. 2014. View Article : Google Scholar : PubMed/NCBI
|
|
25
|
Hwang EJ, Lee JM, Yoon JH, Kim JH, Han JK,
Choi BI, Lee KB, Jang JY, Kim SW, Nickel MD and Kiefer B:
Intravoxel incoherent motion diffusion-weighted imaging of
pancreatic neuroendocrine tumors: Prediction of the histologic
grade using pure diffusion coefficient and tumor size. Invest
Radiol. 49:396–402. 2014. View Article : Google Scholar : PubMed/NCBI
|
|
26
|
Klau M, Mayer P, Bergmann F, Maier-Hein K,
Hase J, Hackert T, Kauczor HU, Grenacher L and Stieltjes B:
Correlation of histological vessel characteristics and
diffusion-weighted imaging intravoxel incoherent motion-derived
parameters in pancreatic ductal adenocarcinomas and pancreatic
neuroendocrine tumors. Invest Radiol. 50:792–797. 2015. View Article : Google Scholar : PubMed/NCBI
|
|
27
|
Li ZS and Li Q: The latest 2010 WHO
classification of tumors of digestive system. Zhonghua Bing Li Xue
Za Zhi. 40:351–354. 2011.(In Chinese). PubMed/NCBI
|
|
28
|
Thoeny HC and Ross BD: Predicting and
monitoring cancer treatment response with diffusion-weighted MRI. J
Magn Reson Imaging. 32:2–16. 2010. View Article : Google Scholar : PubMed/NCBI
|
|
29
|
Schnapauff D, Zeile M, Niederhagen MB,
Fleige B, Tunn PU, Hamm B and Dudeck O: Diffusion-weighted
echo-planar magnetic resonance imaging for the assessment of tumor
cellularity in patients with soft-tissue sarcomas. J Magn Reson
Imaging. 29:1355–1359. 2009. View Article : Google Scholar : PubMed/NCBI
|
|
30
|
Muraoka N, Uematsu H, Kimura H, Imamura Y,
Fujiwara Y, Murakami M, Yamaguchi A and Itoh H: Apparent diffusion
coefficient in pancreatic cancer: Characterization and
histopathological correlations. J Magn Reson Imaging. 27:1302–1308.
2008. View Article : Google Scholar : PubMed/NCBI
|
|
31
|
Wang Y, Chen ZE, Yaghmai V, Nikolaidis P,
McCarthy RJ, Merrick L and Miller FH: Diffusion-weighted MR imaging
in pancreatic endocrine tumors correlated with histopathologic
characteristics. J Magn Reson Imaging. 33:1071–1079. 2011.
View Article : Google Scholar : PubMed/NCBI
|
|
32
|
Vargas HA, Akin O, Franiel T, Mazaheri Y,
Zheng J, Moskowitz C, Udo K, Eastham J and Hricak H:
Diffusion-weighted endorectal MR imaging at 3 T for prostate
cancer: Tumor detection and assessment of aggressiveness.
Radiology. 259:775–784. 2011. View Article : Google Scholar : PubMed/NCBI
|
|
33
|
Chandarana H, Lee VS, Hecht E, Taouli B
and Sigmund EE: Comparison of biexponential and monoexponential
model of diffusion weighted imaging in evaluation of renal lesions:
Preliminary experience. Invest Radiol. 46:285–291. 2011. View Article : Google Scholar : PubMed/NCBI
|
|
34
|
Iima M and Le Bihan D: Clinical intravoxel
incoherent motion and diffusion MR Imaging: Past, Present, and
Future. Radiology. 278:13–32. 2016. View Article : Google Scholar : PubMed/NCBI
|
|
35
|
Jaster R and Emmrich J: Crucial role of
fibrogenesis in pancreatic diseases. Best Pract Res Clin
Gastroenterol. 22:17–29. 2008. View Article : Google Scholar : PubMed/NCBI
|
|
36
|
Padhani AR, Liu G, Koh DM, Chenevert TL,
Thoeny HC, Takahara T, Dzik-Jurasz A, Ross BD, Van Cauteren M,
Collins D, et al: Diffusion-weighted magnetic resonance imaging as
a cancer biomarker: Consensus and recommendations. Neoplasia.
11:102–125. 2009. View Article : Google Scholar : PubMed/NCBI
|
|
37
|
Ginat DT, Mangla R, Yeaney G, Johnson M
and Ekholm S: Diffusion-weighted imaging for differentiating benign
from malignant skull lesions and correlation with cell density. AJR
Am J Roentgenol. 198:W597–W601. 2012. View Article : Google Scholar : PubMed/NCBI
|
|
38
|
Xu J, Liang Z, Hao S, Zhu L, Ashish M, Jin
C, Fu D and Ni Q: Pancreatic adenocarcinomas: Dynamic 64-slice
helical CT with perfusion imaging. Abdom Imaging. 34:759–766. 2009.
View Article : Google Scholar : PubMed/NCBI
|
|
39
|
Takahashi Y, Akishima-Fukasawa Y,
Kobayashi N, Sano T, Kosuge T, Nimura Y, Kanai Y and Hiraoka N:
Prognostic value of tumor architecture, tumor-associated vascular
characteristics, and expression of angiogenic molecules in
pancreatic endocrine tumors. Clin Cancer Res. 13:187–196. 2007.
View Article : Google Scholar : PubMed/NCBI
|
|
40
|
Lemke A, Stieltjes B, Schad LR and Laun
FB: Toward an optimal distribution of b values for intravoxel
incoherent motion imaging. Magn Reson Imaging. 29:766–776. 2011.
View Article : Google Scholar : PubMed/NCBI
|