Introduction
Guanine nucleotide exchange factor T (GEFT) is a
member of the Rho guanine nucleotide exchange factor family, and is
capable of activating RhoA, Rac1 and Cdc42 by catalyzing the
exchange of Rho-bound GDP for GTP (1). GEFT is highly expressed in excitable
tissues such as the brain, heart and muscle, and it modulates the
myogenic vs. adipogenic cell fate decision of progenitor
mesenchymal cells, thus regulating muscle regeneration, myogenesis
and adipogenesis (2).
GEFT is located on chromosome 12q13.3, a
region frequently amplified in sarcomas (3). High copy numbers of the gene for
GEFT were observed in rhabdomyosarcoma samples in
microarray-based comparative genomic hybridization (4,5).
Immunohistochemical analyses suggested that GEFT protein levels
were upregulated in rhabdomyosarcoma samples, and was associated
with disease aggressiveness and metastasis (6). Furthermore, the mRNAs encoding
p63RhoGEF and GEFT, which are derived from the same gene, were both
present in the same individual cells (7). Notably, GPR116 regulates cell motility
and morphology through the p63RhoGEF-RhoA/Rac1 pathway in the
breast carcinoma cell line MDA-MB-231 cells in vitro
(8). In these cells, p63RhoGEF
mediated the formation of a single polarized lamellipodium which is
required for chemotactic migration (9). GEFT protein levels are also increased
during differentiation of neuroblastoma cells, where exogenous GEFT
expression promotes neurite outgrowth (10). Therefore, GEFT is expressed in a
variety of tumors and may be involved in their occurrence and
development.
Malignant digestive tract tumors, including gastric
malignancy, intestinal malignant tumor and malignant tumor of the
esophagus are increasingly prevalent, and seriously threaten
patient health (11). Esophageal
squamous cell carcinoma (ESCC) is a potentially lethal malignancy
with a 15–34% 5-year survival rates (12). Despite improvements in imaging,
surgical techniques and chemoradiation therapy, effective treatment
of patients with ESCC remains challenging (13). In addition, gastric cancer (GC)
constitutes a major cause of cancer-associated death worldwide,
particularly in developing countries (14). The incidence of GC is particularly
common in Eastern Asia, particularly in China (15). Amplification and/or upregulation of
human epidermal growth factor receptor-2 (HER2, also known as
ERBB2) is observed in 6.1–23.0% of GCs. HER2 functions as a
proto-oncogene and encodes a transmembrane receptor tyrosine kinase
expressed in different types of solid tumors (16–18).
However, the prognostic value of HER2 status in GC remains
controversial.
Colorectal cancer (CRC) comprises the third most
common malignancy in adults worldwide, accounting for 1.36 million
cases, after lung cancer (1.8 million) and breast cancer (1.6
million) (19). The mechanism
underlying the development of CRC involves two distinct pathways:
Chromosomal (85%) or microsatellite instability (MSI) (15%)
(20,21). MSI is a molecular fingerprint of a
deficient DNA mismatch repair (MMR) system. The inheritance of a
germline mutation in one of the MMR genes MLH1, MSH2, MSH6
or PMS2 causes MSI (22–25).
Analysis of the encoded MMR proteins (MMRP) by immunohistochemistry
(IHC) or MSI testing is used to evaluate MSI (26). KRAS, a member of the RAS family of
GTPases, is a small GTPase that is also frequently mutated in a
wide range of different types of cancer, including CRC (27). Numerous studies have confirmed that
patients with KRAS mutations do not benefit from
anti-epidermal growth factor receptor therapy (28–30).
To identify the key factors involved in the
occurrence and development of digestive tract tumors, the
expression of GEFT in digestive tract tumors on a global scale was
assessed. In addition, the association between GEFT expression and
the clinicopathological parameters of these patients was
determined.
Materials and methods
Patients and tissue specimen
A total of 180 formalin-fixed paraffin-embedded
tumor samples (60 ESCC, 60 gastric adenocarcinoma and 60 colorectal
adenocarcinoma) were included in the present study. In addition,
180 matched control samples were selected from normal mucosal
tissues ≥5 cm away from the tumor. The 60 ESCC samples consisted of
43 males and 17 females, aged 43–81 years with a median age of 65
years. The GC samples were from 46 males and 14 females, aged 31–79
years with a median age of 61 years. The CRC samples were obtained
from 27 females and 33 males, with an age range of 38–87 years and
a median age of 61 years. The sections were immersed in hematoxylin
for 3 min and in eosin for 5 sec at room temperature for
hematoxylin and eosin and staining (H&E). H&E sections were
independently analyzed by two senior gastrointestinal pathologists.
All patients were categorized according to the 7th American Joint
Committee on Cancer Tumor-Node-Metastasis (TNM) stage (31). All samples were collected after
surgery at the Department of Pathology, Henan Cancer Hospital
(Zhengzhou, China) between August and November 2016. Clinical
follow-up information was obtained by telephone from the surgical
date till May 2019. The total follow-up period was up to 33 months
post-surgery. Based on the hematoxylin and eosin slides, two
representative fields were selected for each tumor sample. Tissue
samples containing the selected fields were embedded in paraffin
blocks. Each area was confirmed to contain ≥70% tumor cells. Sample
blocks were sectioned (4 µm) for further use in IHC analysis. The
purpose of the present research was explained to the participants,
who all signed a written consent prior to the study. The present
study was approved by the Institutional Ethics Committee of the
Affiliated Cancer Hospital of Zhengzhou University.
Experimental reagents
Rabbit polyclonal antibody against human GEFT
(1:150; cat. no. ab127690; Abcam) and mouse monoclonal antibody
against human HER2 (1:500; cat. no. ab134182; Abcam) were used for
IHC. Antibodies against MMRPs, which included MLH1 (cat. no.
GT218907), MSH2 (cat. no. GT210507), MSH6 (cat. no. GT219507) and
PMS2 (cat. no. GT215907) were purchased as ready-to-use working
stocks (Gene Tech Biotechnology Co., Ltd.). The secondary antibody
used was purchased as ready-to-use working stocks (cat. no. SM802;
Dako; Agilent Technologies, Inc.) which included dextran and
peroxidase-conjugated goat secondary antibodies against rabbit and
mouse immunoglobulins.
IHC staining procedure
IHC staining was performed using the EnVision system
(Dako; Agilent technologies, GmbH). The tissues were fixed in 10%
formalin at room temperature for 24 h and embedded in paraffin.
Serial sections (4-µm thick) were deparaffinized in xylene and
rehydrated in a descending series of alcohol solutions (100, 95, 80
and 70%) for 5 min each. The samples were placed in citrate buffer
(pH 6.0) for antigen retrieval at 95°C for 15 min and subsequently
immersed in 3% hydrogen peroxide in methanol for 10 min at room
temperature to inhibit endogenous peroxidase activity. The sections
were incubated overnight at 4°C with each primary antibody. After a
washing in PBS, the sections were incubated with the secondary
antibody at room temperature for 30 min. For negative controls,
each antibody was replaced by phosphate buffered saline. GEFT
expression was evaluated using semi-quantitative scores as follows:
0, ≤5; 1, 6–35; 2, 36–65; and 3, 66–100%. Staining intensity was
scored as follows: 0, no staining; 1, buff; 2, yellow; and 3,
brown. A final staining score was obtained by multiplying the
expression and intensity scores as follow: -, 0; +, 1–3; 2+, 4–6;
and 3+, 7–9. Samples scored as 0 were negative, a score of 1–3 (1+)
represented weak expression and a score of 4–9 (2+/3+) represented
significantly increased positive expression (6). Samples were visualized on an Olympus
BX-41 light microscope (Olympus Corporation, magnification, ×400).
All samples were evaluated independently by two pathologists.
For determination of HER2 expression, the scoring
criteria used was adapted from Hofmann et al (32): 0, Absence of color or reaction in
<10% of neoplastic cells; 1+, weak and/or incomplete coloring of
the membrane in >10% of neoplastic cells; 2+, moderate and/or
incomplete coloring of the membrane in >10% of neoplastic cells;
and 3+, strong and complete and/or incomplete coloring of the
membrane in >10% of neoplastic cells. The scores were stratified
as follows: 0 and 1+, HER2-negative; 2+, indeterminate; and 3+,
HER2-positive. Samples scored as 2+ were analyzed using
fluorescence in situ hybridization (FISH) to confirm HER2
expression.
FISH
Tissues were analyzed using FISH using a Path Vysion
kit (cat. no. 02j01-030; Abbott Pharmaceutical Co. Ltd.). The
HER-2 DNA probe is a 190 kb SpectrumOrange™ directly labeled
fluorescent DNA probe specific for the HER-2/neu gene
locus (17q11.2-q12). The Chromosome Enumeration Probe (CEP) 17 DAN
probe is a 5.4 Kb SpectrumGreen directly labeled fluorescent DNA
probe specific for the alpha satellite DNA sequence at the
centromeric region of chromosome 17(17p11.1-q11.1). The 4 µm tissue
sections were deparaffinized in xylene, and placed in 100% alcohol
for 5 min, twice at room temperature. Slides were subsequently
immersed in pretreatment solution at 80°C for 30 min, and then in
protease solution at 37°C for 10 min (both form Abbott
Pharmaceutical Co., Ltd.). Tissue sections were fixed in 10%
neutral buffered formalin solution at room temperature for 10 min
and dried at 45–50°C for 2–5 min. The tissues were denatured in
denaturation solution at 72°C for 5 min. To each section, 1 µl
probe, 7 µl hybridization mix (50% formamide, 2× saline sodium
citrate, 10% dextran sulphate) and 2 µl deionized water was added
and allowed to hybridize overnight at 37°C. The sections were
immersed in post-hybridization solutions (2× saline sodium
citrate/0.3% NP-40) at room temperature and then at 72°C for 2 min
each. Slides were air dried in the dark and mounted in 10 µl
DAPI/antifade mounting agent (Abbott Pharmaceutical Co. Ltd.).
Slides were imaged with a fluorescence microscope (Olympus, BX53;
Olympus Corporation). In each slide, three areas were randomly
identified, and the average CEP17 and HER2 copy
number in 20 nuclei at ×1,000 magnification was determined.
HER2/CEP17 copy number ratio >2.0 was defined as a
positive result.
PCR-capillary electrophoresis. The PCR-capillary
electrophoresis method was used to detect MSI in CRC. DNA was
extracted from the samples using the QIAamp DNA Mini kit (Qiagen
GmbH). MSI detection used five microsatellite sites: BAT25,
BAT26, D2S123, D5S346 and D17S250, as recommended by the
National Cancer Institute (33). The
primer sequences were as follows: BAT25 forward,
5′TCGCCTCCAAGAATGTAAGT3′ and reverse, 5′TCTGGATTTTAACTATGGCTC3′);
BAT26 forward, 5′TGACTACTTTTGACTTCAGCC3′ and reverse,
5′AACCATTCAACATTTTTAACC3′); D2S123 forward,
5′AAACAGGATGCCTGCCTTTA3′ and reverse, 5′GGACTTTCCACCTATGGGAC3′;,
D5S346 forward, 5′ACTCACTCTAGTGATAAATCGGG3′ and reverse,
5′AGCAGATAAGACAAGTATTACTAG3′; and D17S250 forward,
5′GGAAGAATCAAATAGACAAT3′ and reverse, 5′GCTGGCCATATATATATTTAAACC3′.
A reaction mixture was composed of: 2 µl each of both forward and
reverse primers, 10 µl DNA polymerase (Gene Tech Biotechnology Co.
Ltd.), 1–8 µl (50–100 ng) template DNA and deionized water to a
final reaction volume of 20 µl. The PCR thermocycling conditions
were as follows: Denaturation, 42°C, 5 min followed by 94°C, 5 min;
40 cycles of 94°C for 15 sec, 55°C for 25 sec, and 72°C for 50 sec;
and a final extension step at 72°C for 10 min. The PCR products
were subsequently separated by capillary electrophoresis on an ABI
3500XL Genetic Analyzer (Applied Biosystems; Thermo Fisher
Scientific, Inc.). The results were analyzed using GeneMapper
version 4.1 (Applied Biosystems; Thermo Fisher Scientific, Inc.).
According to the MSI test results, patients with CRC could be
divided into three groups: High frequency MSI (MSI-H), where two or
more genes showed instability; low frequency MSI (MSI-L), where
only one locus showed gene deletion; and microsatellite stable
(MSS), with no gene loss.
Quantitative PCR (qPCR)
Extracted DNA was assayed by qPCR using the human
KRAS gene mutation detection kit (Amoy Diagnostics, Co.,
Ltd.). KRAS mRNA expression was analyzed using TaqMan probes
(Amoy Diagnostics, Co., Ltd.; sequences not provided). Assays were
performed in triplicate on an ABI Prism 7000 cycler (Applied
Biosystems; Thermo Fisher Scientific, Inc.). β-actin was used as
the internal control forward, 5′CCTTCAACACCCCAGCCA3′ and reverse
5′ACCCCTCGTAGATGGGCAC3′. The thermocycling conditions were: 95°C
for 5 min; followed by 15 cycles of 95°C for 25 sec, 64°C for 20
sec and 72°C for 20 sec; 31 cycles of 93°C for 25 sec, 60°C for 35
sec and 72°C for 20 sec; and a final extension step of 72°C for 10
min. The FAM and HEX signals were collected during the 60°C step.
KRAS gene expression was calculated using the
2−ΔΔCq method according to the manufacturer's
protocol.
Statistical analysis
SPSS version 21.0 (IBM Corp.) was used to analyze
all statistical data. Statistical significance was determined using
a χ2 or Fisher's exact test. The correlations between
GEFT/HER-2/MMRP/KRAS expression and the clinicopathological factors
were determined using the same methods. The correlation between
GEFT and HER-2/MMRP/KRAS was determined using Spearman's rank
correlation. Kaplan-Meier and log-rank methods were used to
calculate overall survival (OS) rates, and the OS curves were
compared with the log-rank test. P<0.05 was considered to
indicate a statistically significant difference.
Results
GEFT expression is elevated in
patients with ESCC
Positive GEFT protein expression rate in ESCC
samples was 80%, which was significantly higher than the normal
control samples (100% negative; χ2=80.000, P<0.001).
Representative images of GEFT protein expression in ESCC is shown
in Fig. 1A, and the negative control
samples are shown in (Fig. 1B). In
the 60 cases of ESCC, the GEFT (1+) expression rate was 56.67%
(34/60) and the GEFT (2+) expression rate was 23.33% (14/60). There
were no cases of GEFT (3+) expression. The GEFT-negative expression
rate was 20% (12/60) (Table I).
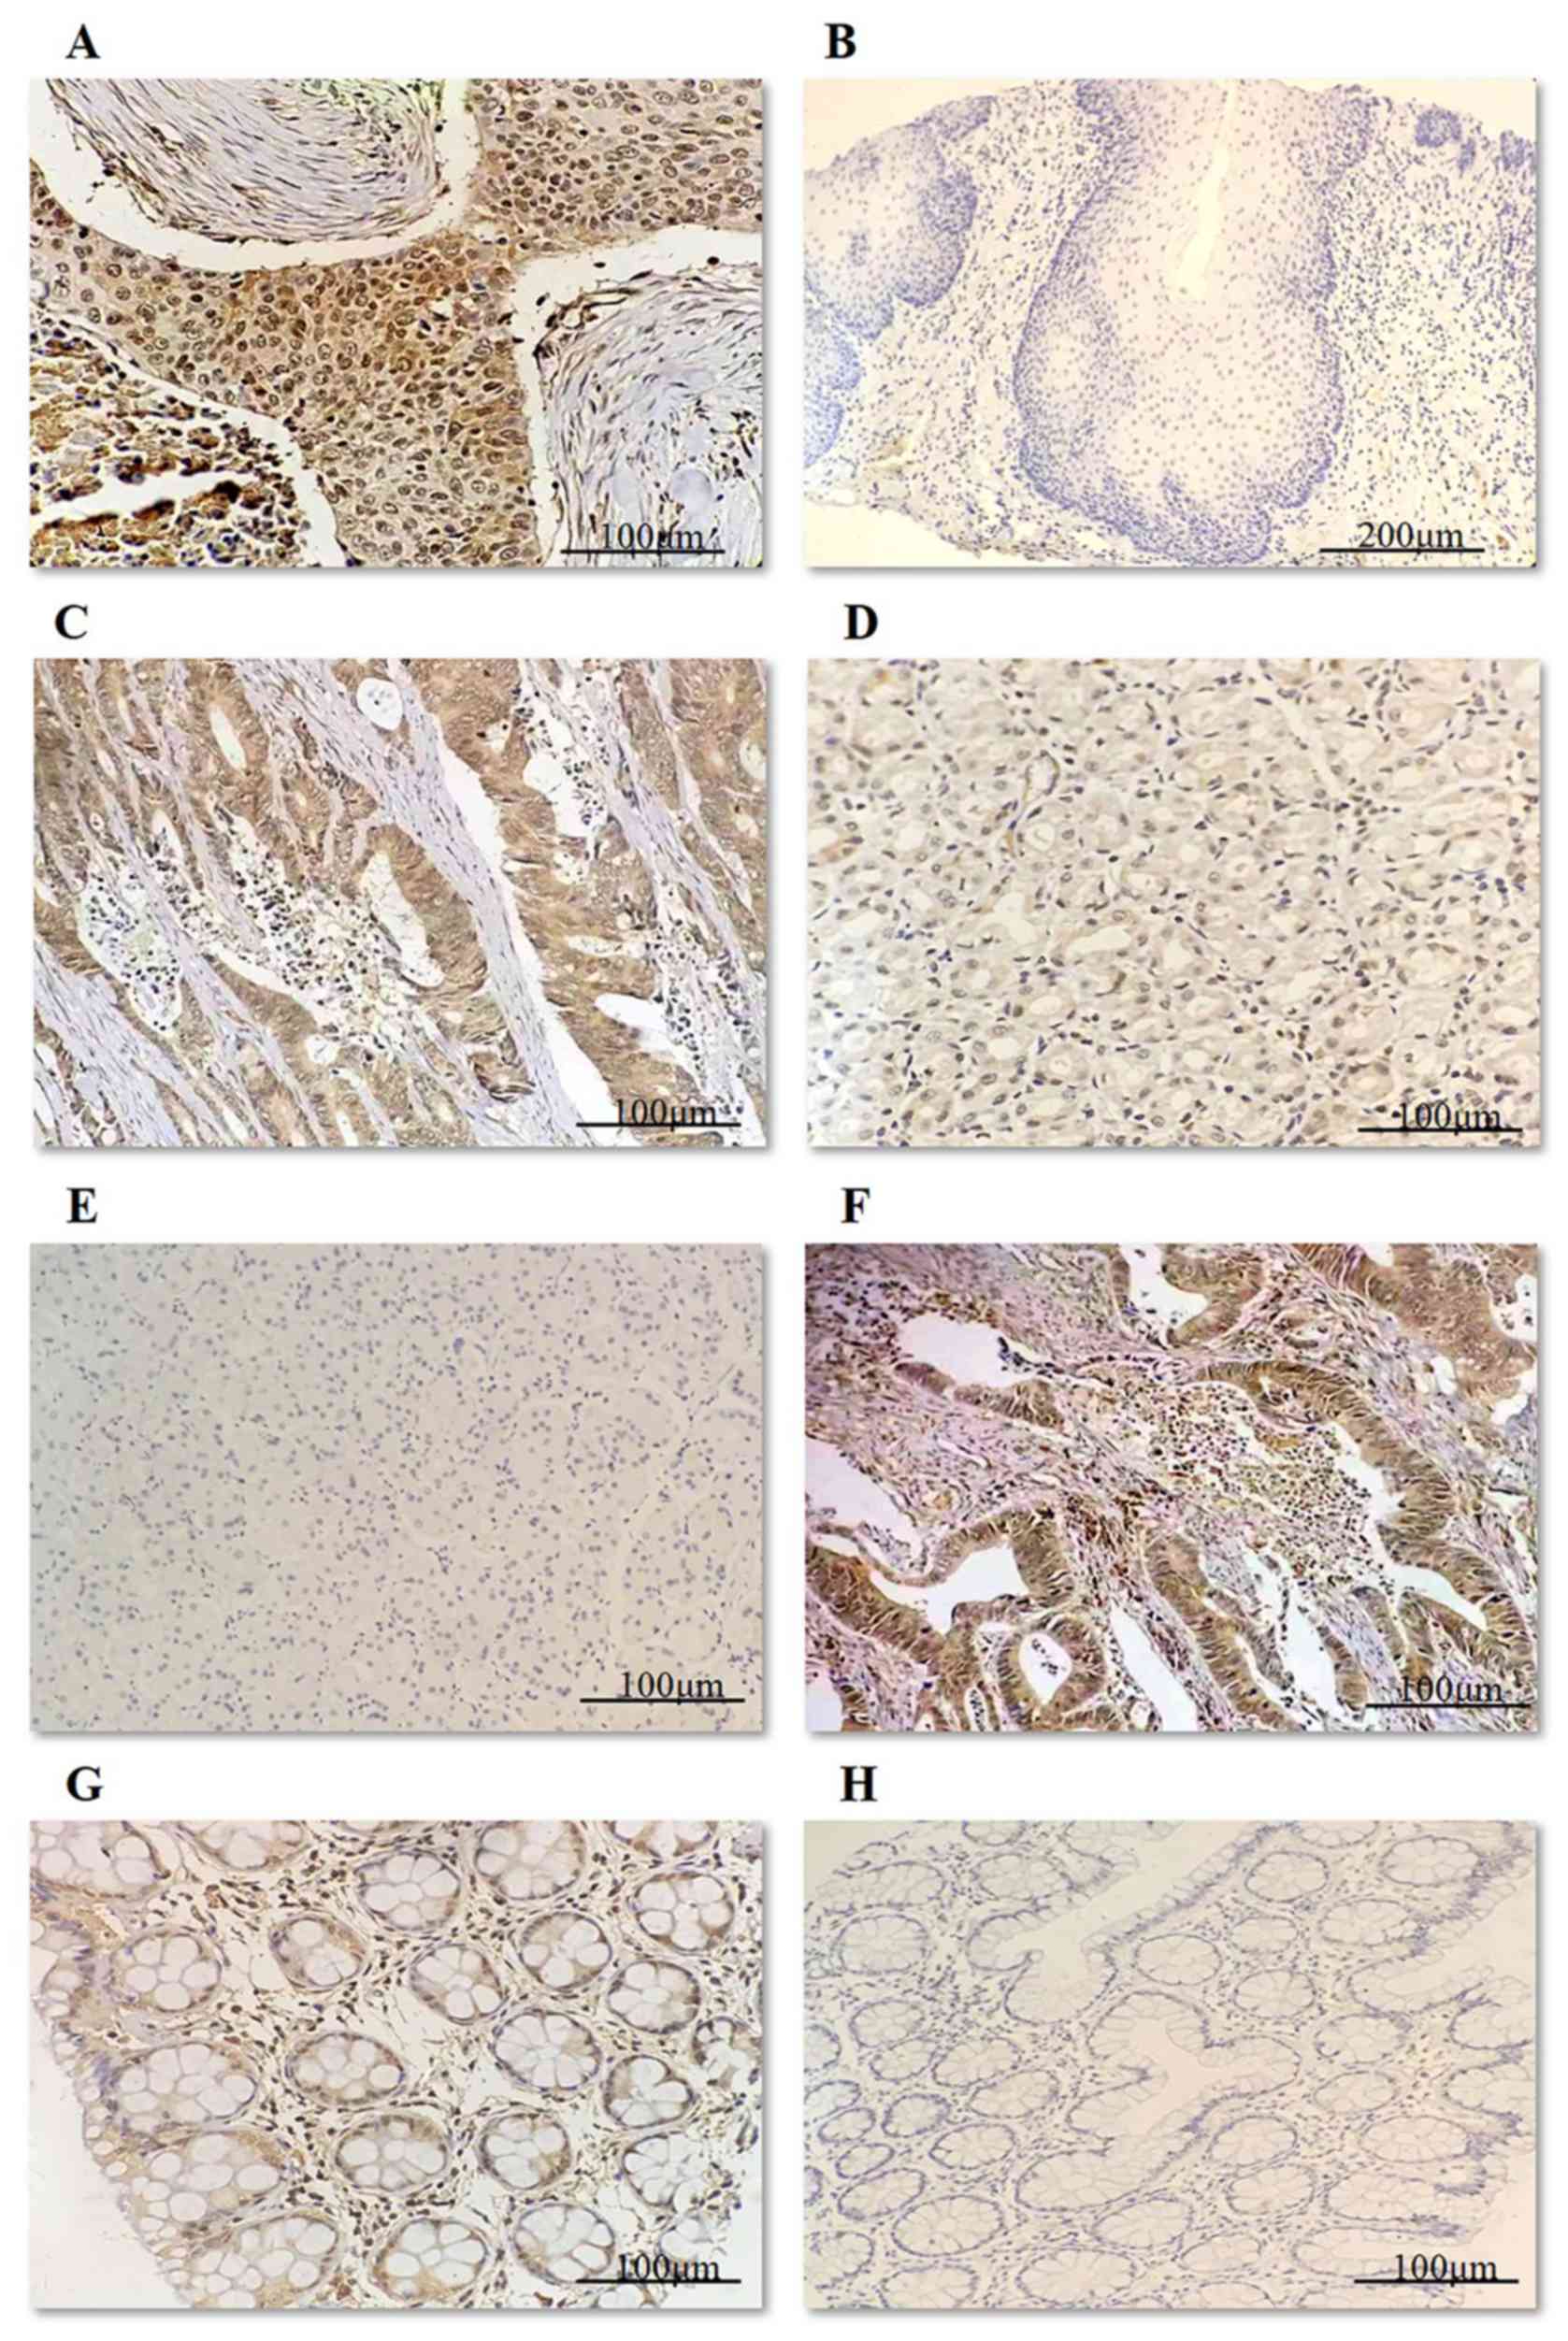 | Figure 1.Immunohistochemical staining for GEFT
in ESCC, GC and CRC shows positivity in the cytoplasm. (A)
GEFT-protein positivity in ESCC (2+). Scale bar, 100 µM. (B)
GEFT-protein negativity in normal esophageal mucosa. Scale bar, 200
µM. (C) GEFT-protein positivity in GC (3+). Scale bar, 100 µM. (D)
GEFT-protein positivity in normal gastric mucosa (1+). Scale bar,
100 µM. (E) GEFT-protein negativity in normal gastric mucosa. Scale
bar, 100 µM. (F) GEFT-protein positivity in CRC (3+). Scale bar,
100 µM. (G) GEFT-protein positivity in normal intestinal mucosa
(1+). Scale bar, 100 µM. (H) GEFT-protein negativity in normal
intestinal mucosa. Scale bar, 100 µM. GEFT, guanine nucleotide
exchange factor T; ESCC, esophageal squamous carcinoma; GC, gastric
carcinoma; CRC, colorectal cancer; 1+, weak expression; 2+/3+,
significantly increased positive expression. |
 | Table I.GEFT protein expression in ESCC, GC
and CRC samples. |
Table I.
GEFT protein expression in ESCC, GC
and CRC samples.
|
| ESCC | GC | CRC |
|---|
|
|
|
|
|
|---|
| GEFT | Tumor samples n
(%) | Control samples n
(%) | Tumor samples n
(%) | Control samples n
(%) | Tumor samples n
(%) | Control samples n
(%) |
|---|
| − | 12 (20.00) | 60
(100.00) | 10 (16.67) | 53 (88.33) | 8
(13.33) | 59 (98.33) |
| 1+ | 34 (56.67) | 0 (0.00) | 17 (28.33) | 7
(11.67) | 19 (31.67) | 1 (1.67) |
| 2+ | 14 (23.33) | 0 (0.00) | 23 (38.33) | 0 (0.00) | 27 (45.00) | 0 (0.00) |
| 3+ | 0
(0.000) | 0 (0.00) | 10 (16.67) | 0 (0.00) | 6
(10.00) | 0 (0.00) |
| χ2 | 80.000 | 61.788 | 87.896 |
| P-value |
<0.001a |
<0.001a |
<0.001a |
Association between the
clinicopathological parameters of ESCC with GEFT expression
Table II shows the
association between GEFT expression and ESCC clinicopathological
factors. Although the expression of GEFT was significantly higher
in tumor tissues compared with the control samples, GEFT levels
were not associated with any of the assessed clinicopathological
parameters (all P>0.05; Table
II).
| Table II.Association between GEFT protein
expression and clinicopathologic features in patients with
esophageal squamous cell carcinoma. |
Table II.
Association between GEFT protein
expression and clinicopathologic features in patients with
esophageal squamous cell carcinoma.
|
|
| GEFT |
|
|
|---|
|
|
|
|
|
|
|---|
| Variable | Cases | -/1+ (%) | 2+/3+ (%) | χ2 value | P-value |
|---|
| Sex |
|
|
| <0.001 | 1.000 |
|
Male | 43 | 33 (76.74) | 10 (23.26) |
|
|
|
Female | 17 | 13 (76.47) | 4 (23.53) |
|
|
| Age, years |
|
|
| 0.497 | 0.481 |
|
≥60 | 45 | 33 (73.33) | 12 (26.67) |
|
|
|
<60 | 15 | 13 (86.67) | 2 (13.33) |
|
|
| Location |
|
|
| 0.542 | 0.462 |
| Upper
esophagus | 5 | 5 (100.00) | 0 (0.00) |
|
|
|
Middle/lower esophagus | 55 | 41 (74.55) | 14 (25.45) |
|
|
| Tumor diameter,
cm |
|
|
| 0.001 | 0.982 |
| ≤3 | 17 | 13 (76.47) | 4 (23.53) |
|
|
|
>3 | 43 | 33 (76.74) | 10 (23.26) |
|
|
| Histological
type |
|
|
| 3.828 | 0.281 |
|
Ulcerative type | 28 | 21 (75.00) | 7 (25.00) |
|
|
|
Medullary type | 21 | 19 (90.48) | 2 (9.52) |
|
|
|
Constrictive type | 9 | 4 (44.44) | 5 (55.56) |
|
|
|
Fungating type | 2 | 2 (100.00) | 0 (0.00) |
|
|
| Tumor
differentiation |
|
|
| 0.836 | 0.361 |
|
Moderate/well | 46 | 34 (73.91) | 12 (26.09) |
|
|
|
Poor | 14 | 12 (85.71) | 2 (14.29) |
|
|
| Depth of
invasion |
|
|
| 0.023 | 0.879 |
|
T1/T2 | 12 | 9 (75.00) | 3 (25.00) |
|
|
|
T3/T4 | 48 | 37 (77.08) | 11 (22.92) |
|
|
| Nerve invasion |
|
|
| 0.586 | 0.444 |
|
Yes | 13 | 11 (84.62) | 2 (15.38) |
|
|
| No | 47 | 35 (74.47) | 12 (25.53) |
|
|
| Vessel carcinoma
embolus |
|
|
| 2.402 | 0.121 |
|
Yes | 28 | 24 (85.71) | 4 (14.29) |
|
|
| No | 32 | 22 (68.75) | 10 (31.25) |
|
|
| TNM stage |
|
|
| 0.106 | 0.744 |
| I and
II | 32 | 24 (75.00) | 8 (25.00) |
|
|
| III and
IV | 28 | 22 (78.57) | 6 (21.43) |
|
|
| Lymph node
metastasis |
|
|
| 0.034 | 0.854 |
|
Yes | 27 | 21 (77.78) | 6 (22.22) |
|
|
| No | 33 | 25 (75.76) | 8 (24.24) |
|
|
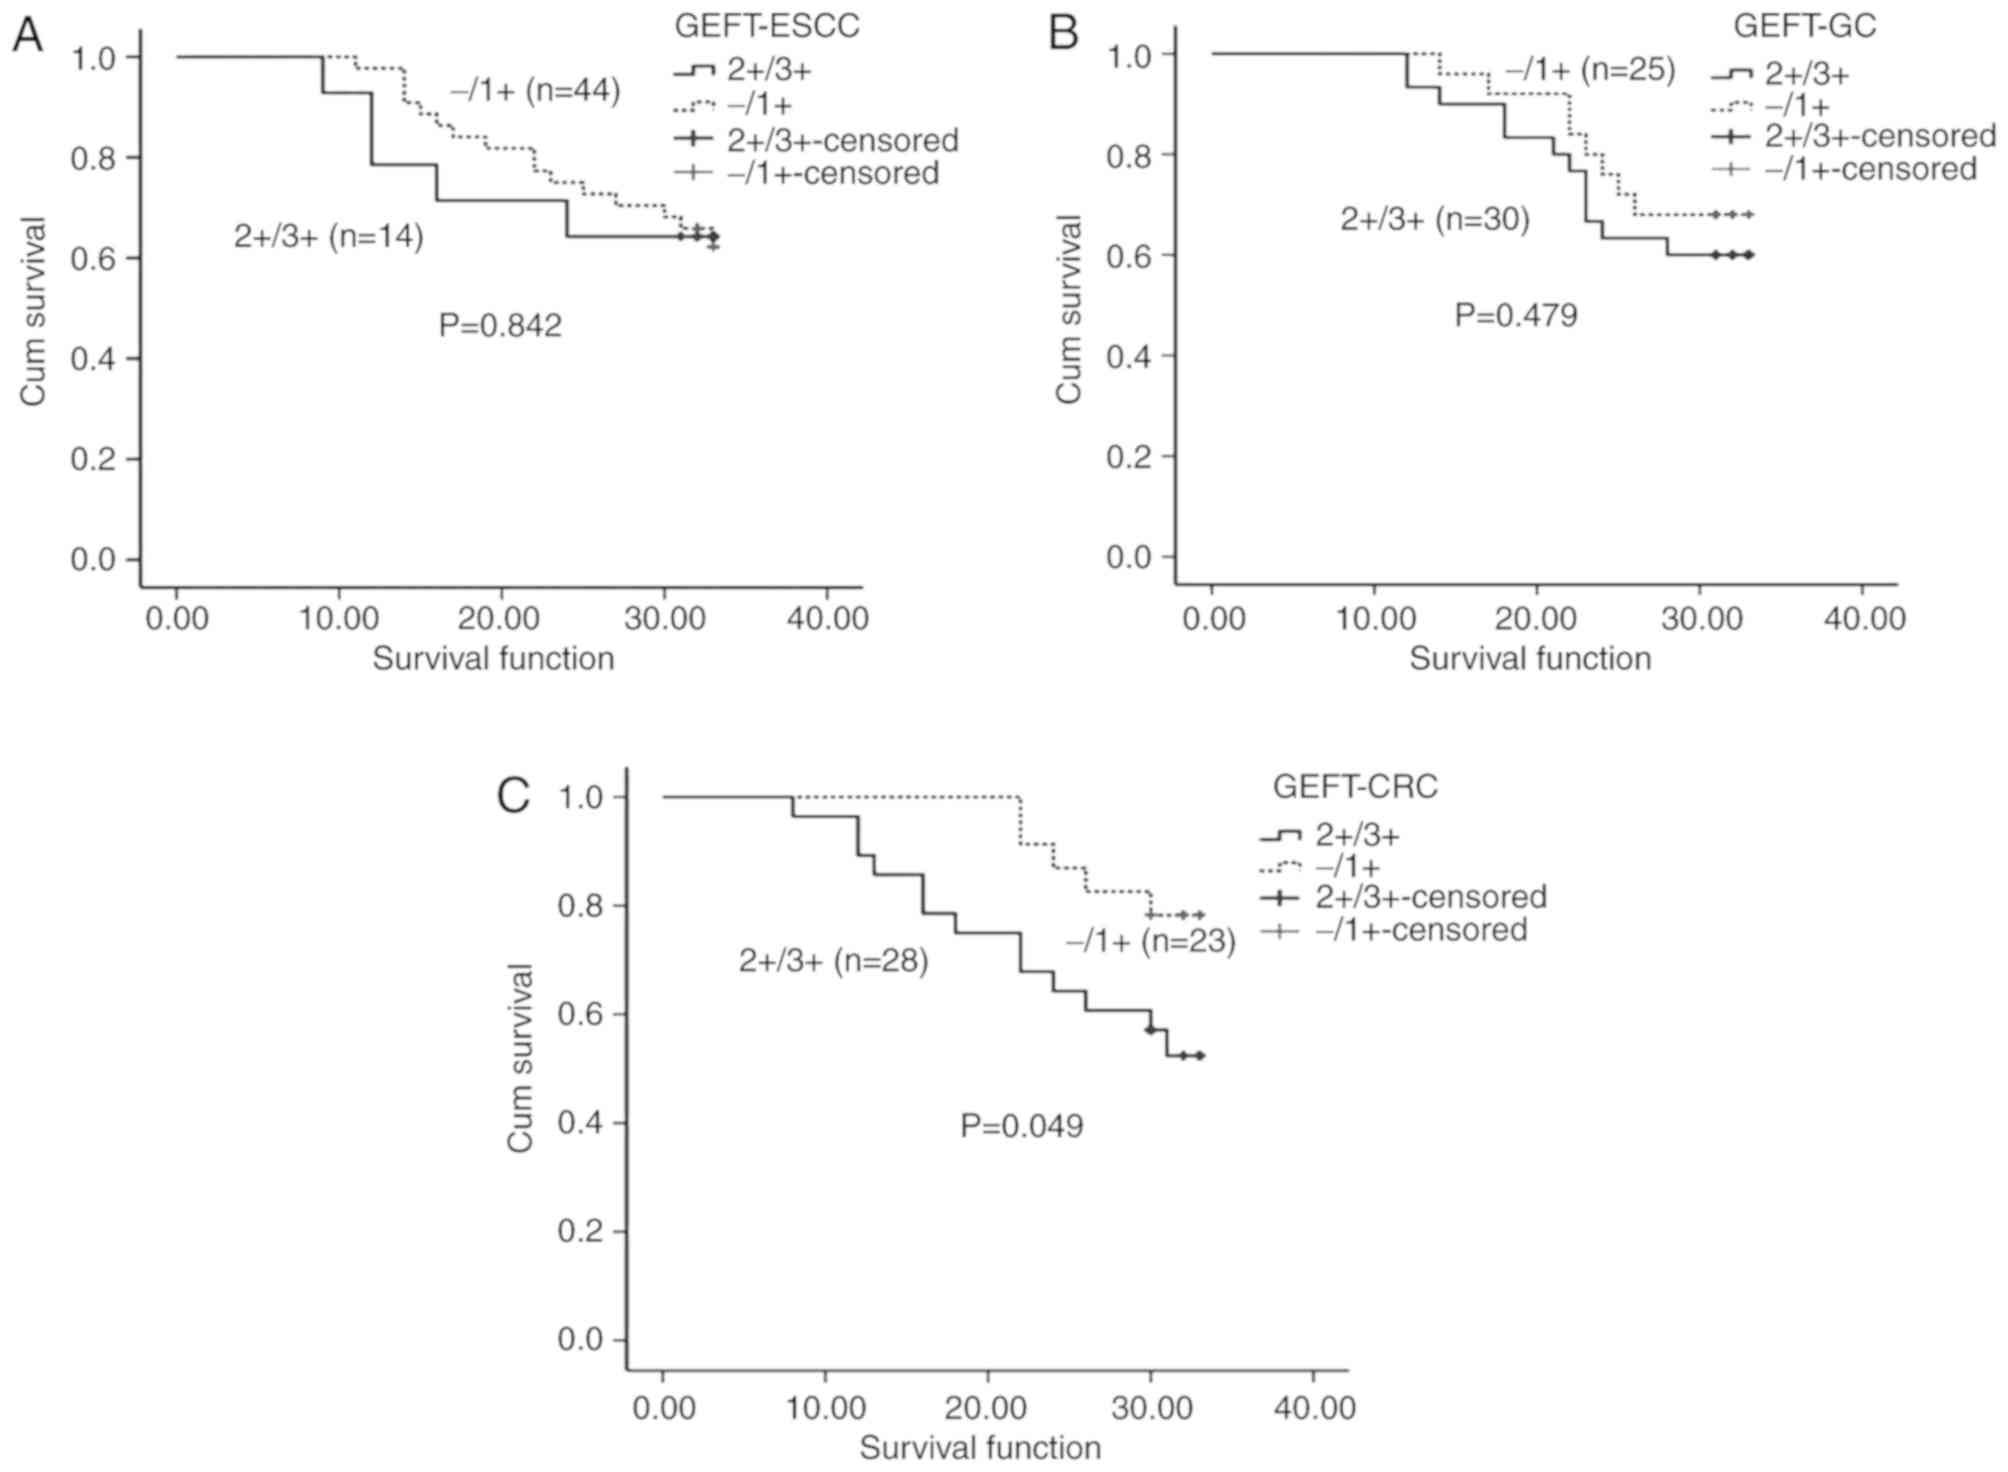
Association between GEFT expression and OS in
patients with ESCC. Of the 60 patients with ESCC included in the
present study, two patients were lost to follow-up, 38 cases
survived and 20 died. The collective OS time of all the patients
ranged from 9–33 months, with a median overall survival time of 32
months. Among the 14 patients with GEFT overexpression (2+/3+),
five patients died while nine survived. In the patient group with
lower GEFT expression (−/1+), 44 patients were available for
follow-up. Of those patients, 15 died and 29 survived. There was no
significant association between GEFT expression and OS
(χ2=0.040, P=0.842; Fig.
2A).
GEFT expression is increased in
patients with GC
GEFT protein expression in 60 GC tissues and 60
normal gastric mucosa samples was observed by IHC. The positive
GEFT expression rate in GC tissues was 83.33%, which was
significantly higher (χ2=61.788, P<0.001) compared
with the normal control samples. Of the control samples, seven
expressed GEFT protein (1+), but the rest were negative. Fig. 1C shows positive GEFT-protein
expression in GC (3+); and Fig. 1D and
E show 1+ and negative GEFT-protein expression, respectively,
in normal gastric mucosa samples. Among the 60 GC tissues samples,
the GEFT (1+) expression rate was 28.33% (17/60), the GEFT (2+)
expression rate was 38.33% (23/60) and the GEFT (3+) expression
rate was 16.67% (10/60). The GEFT-negative expression rate was
16.67% (10/60) in GC tissues (Table
I).
Association between the
clinicopathological parameters of GC and GEFT expression
Table III shows the
association between GEFT expression and the clinicopathological
features of gastric adenocarcinoma. GEFT expression was associated
with Lauren stage (χ2=12.525, P=0.002) and TNM stage
(χ2=4.033, P=0.045; Table
III), but was not associated with any of the other
clinicopathological parameters. The expression of GEFT protein was
highest (80%) in the diffuse Lauren stage classification type,
lowest (25%) in the intestinal type and 60% in the mixed type. GEFT
protein was moderately expressed (2+/3+) in 40.74% (11/27) of TNM
stage I/II samples, whereas expression (2+/3+) was lower (66.67%,
22/33) in TNM stage III/IV samples (Table III).
| Table III.Association between GEFT protein
expression, HER2 expression and clinicopathologic features in
patients with gastric cancer. |
Table III.
Association between GEFT protein
expression, HER2 expression and clinicopathologic features in
patients with gastric cancer.
| Variable | Cases | GEFT 2+/3+ (%) | P-value | HER2+ (%) | P-value |
|---|
| Sex |
|
| 0.297 |
| 0.142 |
|
Male | 46 | 27 (58.70) |
| 4 (8.70) |
|
|
Female | 14 | 6 (42.86) |
| 4 (28.57) |
|
| Age, years |
|
| 0.693 |
| 0.898 |
|
≥60 | 35 | 20 (57.14) |
| 4 (11.43) |
|
|
<60 | 25 | 13 (52.00) |
| 4 (16.00) |
|
| Tumor diameter |
|
| 0.373 |
| 0.644 |
| ≥5
cm | 34 | 17 (50.00) |
| 5 (14.71) |
|
| <5
cm | 26 | 16 (61.54) |
| 3 (11.54) |
|
| Lauren stage |
|
| 0.002b |
| 0.065 |
| Diffuse
type | 20 | 16 (80.00) |
| 3 (15.00) |
|
|
Intestinal type | 20 | 5 (25.00) |
| 5 (25.00) |
|
| Mixed
type | 20 | 12 (60.00) |
| 0 (0.00) |
|
| Tumor
differentiation |
|
| 0.053 |
| 0.577 |
|
Moderate/well | 21 | 8 (38.10) |
| 4 (19.05) |
|
|
Poor | 39 | 25 (64.10) |
| 4 (10.26) |
|
| Mucinous
adenocarcinoma |
|
| 0.807 |
| 0.811 |
|
Yes | 21 | 12 (57.14) |
| 2 (9.52) |
|
| No | 39 | 21 (53.85) |
| 6
(15.38) |
|
| Depth of
invasion |
|
| 0.481 |
| 1.000 |
|
T1/T2 | 5 | 2 (40.00) |
| 1 (20.00) |
|
|
T3/T4 | 55 | 31 (56.36) |
| 7 (12.73) |
|
| Nerve invasion |
|
| 0.035 |
| 0.045a |
|
Yes | 29 | 20 (68.97) |
| 7 (24.14) |
|
| No | 31 | 13 (41.94) |
| 1 (3.22) |
|
| Vessel carcinoma
embolus |
|
| 0.925 |
| 0.256 |
|
Yes | 47 | 26 (55.32) |
| 8 (17.02) |
|
| No | 13 | 7 (53.85) |
| 0 (0.00) |
|
| TNM stage |
|
| 0.045a |
| 0.018a |
| I and
II | 27 | 11 (40.74) |
| 0 (0.00) |
|
| III and
IV | 33 | 22 (66.67) |
| 8 (24.24) |
|
| Lymph node
metastasis |
|
| 1.000 |
| 0.150 |
|
Yes | 49 | 27 (55.10) |
| 8 (16.33) |
|
| No | 11 | 6 (54.55) |
| 0 (0.00) |
|
| Distant
metastasis |
|
| 0.386 |
| 1.000 |
|
Yes | 2 | 0 (0.00) |
| 0 (0.00) |
|
| No | 58 | 33 (56.90) |
| 8 (13.80) |
|
Association between GEFT expression
and OS in patients with GC
Of the 60 patients with GC enrolled in the study, 5
cases were lost during follow-up, 35 patients survived, and 20
patients died. The collective OS time of all the patients ranged
from 12–33 months, with a median overall survival time of 32
months. In the GEFT overexpression group (2+/3+), survival data for
30 patients were collected. Among them, 12 patients died and 18
survived. In the low GEFT expression group (−/1+), survival data
for 25 patients were acquired of which eight patients died and 17
survived. Although the survival rates of patients with GC with
higher GEFT expression was lower compared with patients with lower
GEFT expression (Fig. 2B), there was
no significant association between GEFT expression and survival in
patients with GC (χ2=0.501, P=0.479).
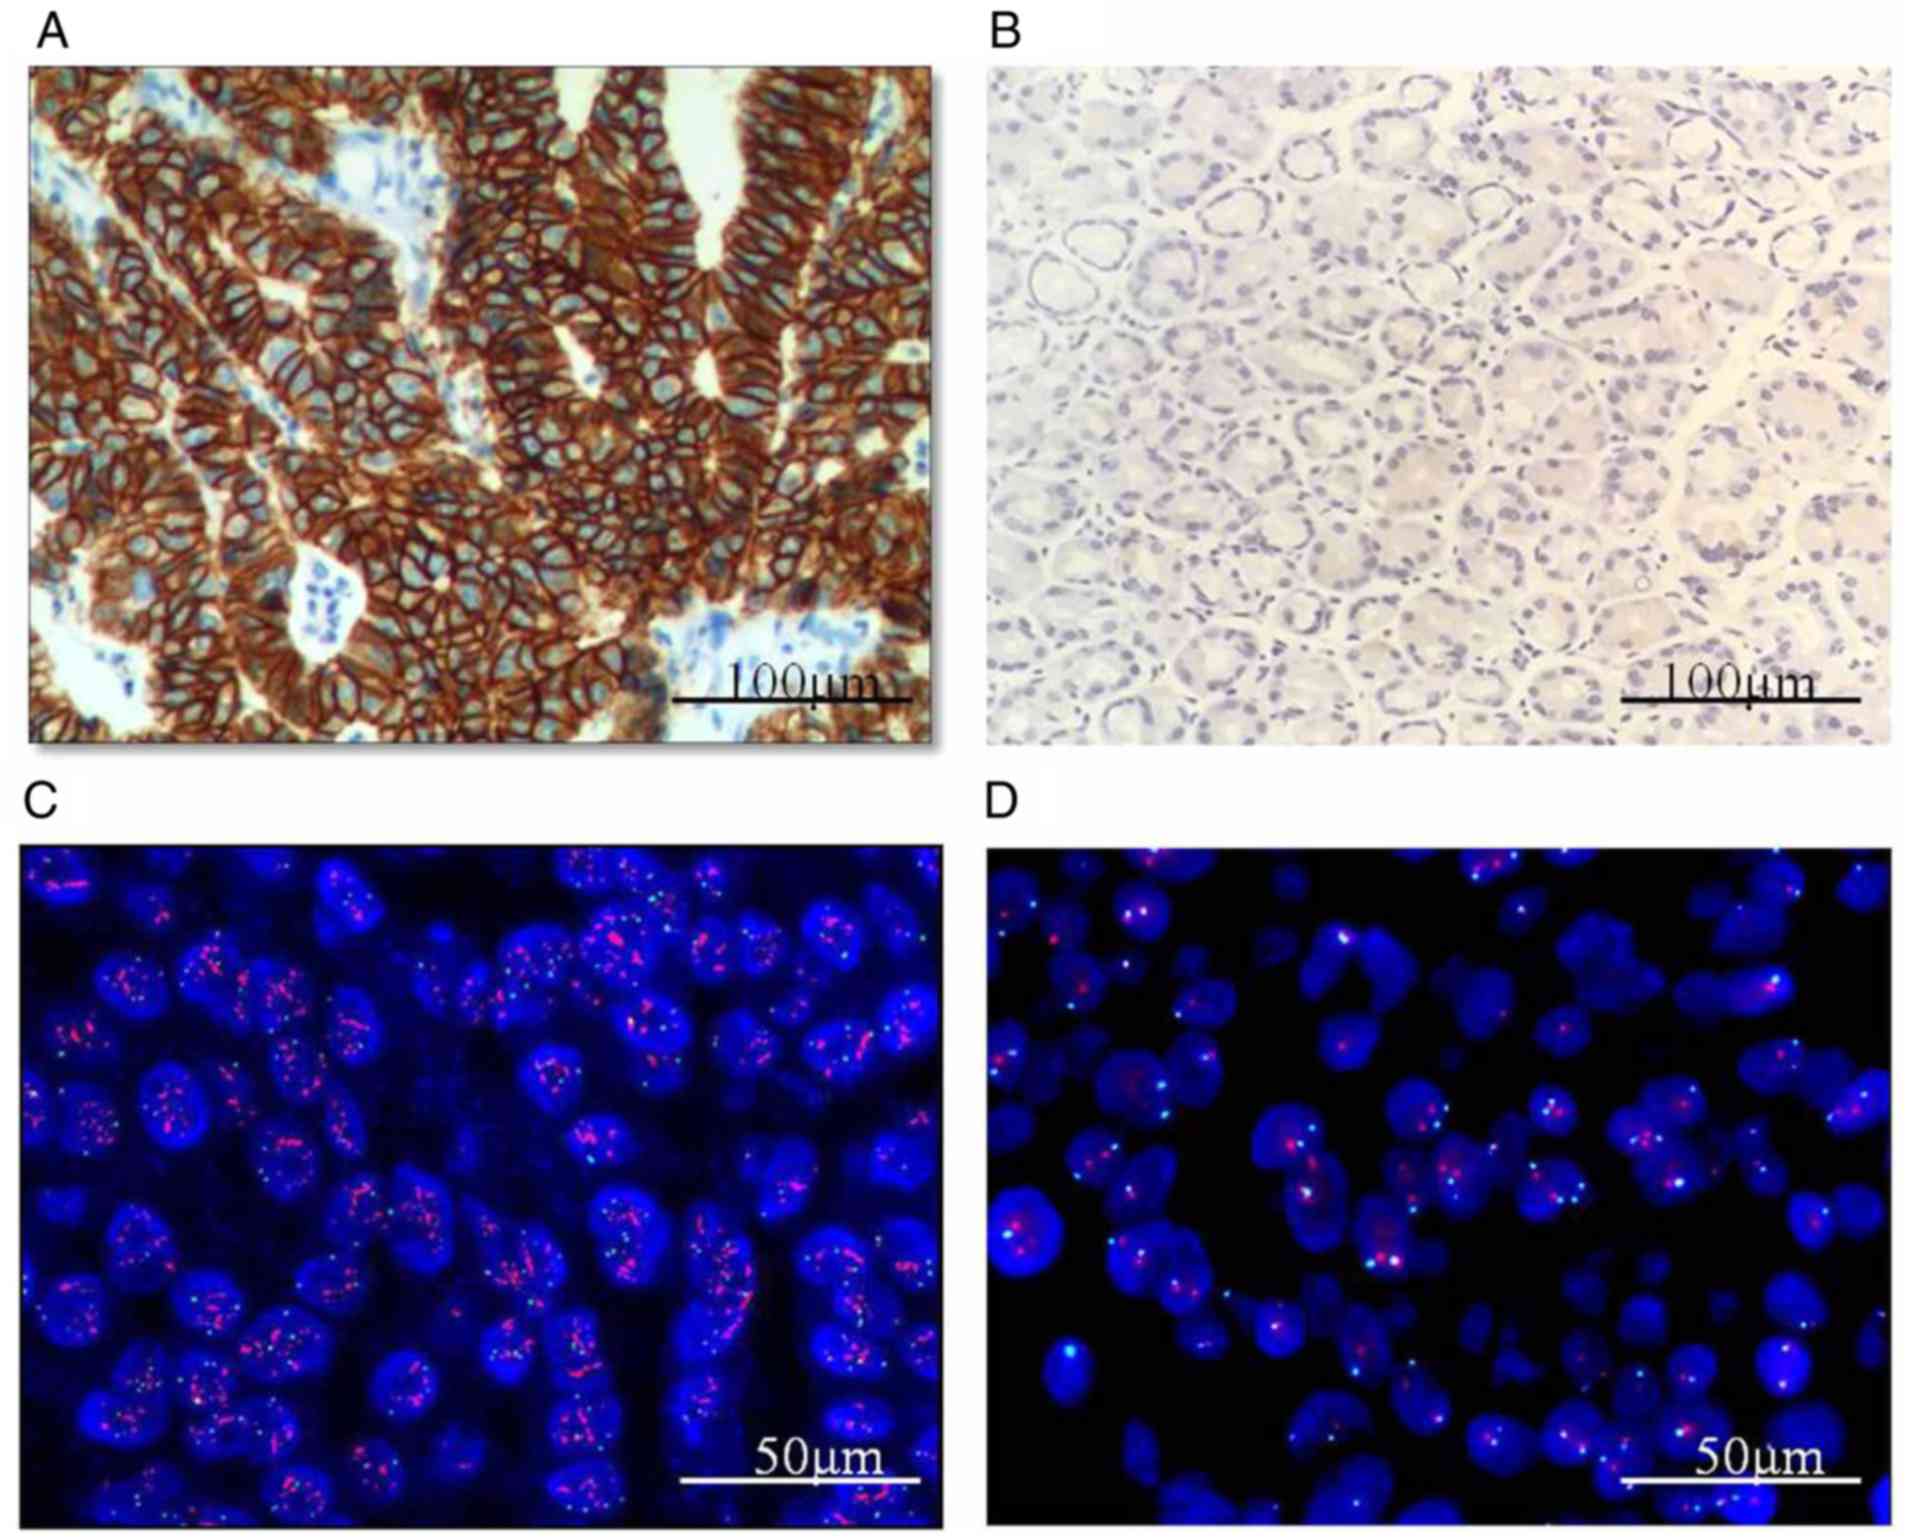
HER2 expression in patients with
GC
HER2 expression and the mRNA and protein levels in
GC are shown in Fig. 3. In the
present study, HER2 protein expression was 3+ in 5 of the 60 cases
of GC, 2+ in 18 cases, 1+ in 20 cases and 0 in 17 cases. The
expression of HER2 protein was absent in all of the normal control
samples (Table IV). In cases where
the sample was scored as 2+, FISH was used to detect HER2
gene amplification. Of these samples, 3 of 18 showed HER2
gene amplification, whereas normal control gastric mucosa samples
were negative for HER2 amplification (Table IV). Therefore, the HER2+ rate in the
60 GC samples was 13.33% (8/60) (Table
IV).
| Table IV.HER2 protein and gene expression in
the GC samples. |
Table IV.
HER2 protein and gene expression in
the GC samples.
| A, Negative |
|---|
|
|---|
| Variable | n (%) |
|---|
| IHC- | 17 (28.34) |
| IHC 1+ | 20 (33.33) |
| IHC 2+, FISH- | 15 (25.00) |
| Total | 52 (86.67) |
|
| B,
Positive |
|
|
Variable | n (%) |
|
| IHC 2+, FISH+ | 3 (5.00) |
| IHC 3+ | 5 (8.33) |
| Total | 8 (13.33) |
The association between HER2 protein expression and
the clinicopathological features in patients with gastric
adenocarcinoma is shown in Table
III. HER2 expression was associated with nerve invasion
(χ2=4.005, P=0.045) and TNM stage (χ2=5.600,
P=0.018), but was not associated with the other clinicopathological
parameters. The expression of HER2 protein was higher in cases with
nerve invasion (24.14%) compared with cases without nerve invasion
(3.22%). HER2 expression was absent in TNM stage I/II samples, and
its expression was relatively lower in TNM stage III/IV samples
(24.24%, 8/33). Of the 8 HER2 positive GC samples, 3 samples were
scored as 1+ GEFT expression, 1 case was scored as 2+ GEFT
expression, 1 case was scored as 3+ GEFT expression, and 3 cases
scored as negative for GEFT expression. No significant correlation
was identified between the levels of GEFT and HER2 expression
(r=0.197, P=0.132) (Table V).
| Table V.Association between GEFT and
HER-2/MMRP/KRAS. |
Table V.
Association between GEFT and
HER-2/MMRP/KRAS.
|
| HER2 | MMRP | KRAS mutation |
|---|
|
|
|
|
|
|---|
| GEFT | + | − | MMRD | MMRI | Yes | No |
|---|
| − | 3 | 7 | 4 | 4 | 3 | 5 |
| 1+ | 3 | 14 | 0 | 17 | 1 | 16 |
| 2+ | 1 | 22 | 2 | 25 | 8 | 19 |
| 3+ | 1 | 9 | 0 | 6 | 4 | 2 |
| r-value | 0.197 |
| −0.285 |
| 0.697 |
|
| P-value | 0.132 |
| 0.027a |
|
<0.001b |
|
GEFT is highly expressed in patients
with CRC
In the 60 CRC samples, 52 samples were positive for
GEFT protein expression, with 6 samples rated as strongly positive
(3+), 27 rated as positive (2+) and 19 rated as weakly positive
(1+). The overall GEFT protein expression rate was 86.67% (52/60)
which was significantly higher than the control group
(χ2=87.896, P<0.001), where only 1 of 60 normal
intestinal mucosa samples showed weakly positive GEFT expression
(1+) (Table I). Fig. 1F shows GEFT-protein positivity in CRC
(3+), and Fig. 1G and H show GEFT
protein expression (1+) and negative expression in normal
intestinal mucosa, respectively.
Association between the
clinicopathological parameters of CRC and GEFT expression
Table VI shows the
association between GEFT expression and the clinicopathological
factors of CRC. GEFT protein expression was associated with vessel
carcinoma embolus (χ2=7.890, P=0.005) and lymph node
metastasis (χ2=5.455, P=0.020), but was not associated
with any of the other clinicopathological parameters. Among the
samples with vessel carcinoma embolus (23/32) or lymph node
metastasis (21/30), high GEFT protein expression (2+/3+) was
significantly higher than in samples without vessel carcinoma
embolus (10/28) or lymph node metastasis (12/30).
| Table VI.Association between GEFT protein
expression, MMRD, KRAS mutations and clinicopathologic features in
patients with colorectal cancer. |
Table VI.
Association between GEFT protein
expression, MMRD, KRAS mutations and clinicopathologic features in
patients with colorectal cancer.
| Variable | Cases | GEFT 2+/3+ (%) | P-value | MMRD (%) | P-value | KRAS mutation
(%) | P-value |
|---|
| Sex |
|
| 0.983 |
| 0.299 |
| 0.907 |
|
Male | 33 | 18 (54.54) |
| 5 (15.15) |
| 9 (27.27) |
|
|
Female | 27 | 15 (55.56) |
| 1 (3.70) |
| 7 (25.93) |
|
| Age, years |
|
| 0.875 |
| 1.000 |
| 0.071 |
|
≥60 | 34 | 19 (55.88) |
| 3 (8.82) |
| 6 (17.65) |
|
|
<60 | 26 | 14 (53.85) |
| 3 (11.54) |
| 10 (38.46) |
|
| Tumor diameter |
|
| 1.000 |
| 0.022a |
| 0.836 |
| ≥5
cm | 40 | 22 (55.00) |
| 1 (7.50) |
| 11 (27.50) |
|
| <5
cm | 20 | 11 (55.00) |
| 5 (25.00) |
| 5 (25.00) |
|
| Location |
|
| 0.523 |
| 0.510 |
| 0.801 |
| Right
hemicolon | 12 | 5 (41.67) |
| 2 (16.67) |
| 3 (25.00) |
|
| Sigmoid
colon | 15 | 8 (53.33) |
| 2 (13.33) |
| 5 (33.33) |
|
|
Rectum | 33 | 20 (60.61) |
| 2 (6.06) |
| 8 (24.24) |
|
| Tumor
differentiation |
|
| 1.000 |
| 1.000 |
| 0.042a |
|
Moderate/well | 52 | 29 (55.76) |
| 5 (9.62) |
| 11 (21.15) |
|
|
Poor | 8 | 4 (50.00) |
| 1 (12.50) |
| 5 (62.50) |
|
| Mucinous
adenocarcinoma |
|
| 1.000 |
| 1.000 |
| 0.214 |
|
Yes | 7 | 4 (57.14) |
| 1 (14.29) |
| 0 (0.00) |
|
| No | 53 | 29 (54.72) |
| 5 (9.43) |
| 16 (30.19) |
|
| Depth of
invasion |
|
| 0.668 |
| 0.919 |
| 1.000 |
| T3 | 14 | 7 (50.00) |
| 2 (14.29) |
| 4 (28.57) |
|
| T4 | 46 | 26 (56.52) |
| 4 (8.70) |
| 12 (26.09) |
|
| Nerve invasion |
|
| 0.312 |
| 0.693 |
| 1.000 |
|
Yes | 3 | 3 (100.00) |
| 1 (33.33) |
| 1 (33.33) |
|
| No | 57 | 30 (52.63) |
| 5 (8.77) |
| 15 (26.32) |
|
| Vessel carcinoma
embolus |
|
| 0.005b |
| 1.000 |
| 0.785 |
|
Yes | 32 | 23 (71.87) |
| 3 (9.36) |
| 9 (28.13) |
|
| No | 28 | 10 (35.71) |
| 3 (10.71) |
| 7 (25.00) |
|
| TNM stage |
|
| 0.077 |
| 0.546 |
| 0.755 |
| I and
II | 32 | 21 (65.62) |
| 2 (6.25) |
| 8 (25.00) |
|
| III and
IV | 28 | 12 (42.86) |
| 4 (14.29) |
| 8 (28.57) |
|
| Lymph node
metastasis |
|
| 0.020a |
| 1.000 |
| 0.559 |
|
Yes | 30 | 21 (70.00) |
| 3 (10.00) |
| 9 (30.00) |
|
| No | 30 | 12 (40.00) |
| 3 (10.00) |
| 7 (23.33) |
|
| Distant
metastasis |
|
| 0.712 |
| 1.000 |
| 0.744 |
|
Yes | 11 | 5 (45.45) |
| 1 (9.09) |
| 2 (18.18) |
|
| No | 49 | 28 (57.14) |
| 5 (10.20) |
| 14 (28.57) |
|
Association between GEFT expression
and OS in CRC
Survival data were collected for 51 of the 60
patients with CRC in the present study. The remaining 9 cases were
lost during follow-up. Of these cases, 34 patients survived, and 17
patients died. The collective OS time ranged from 8–33 months, with
a median overall survival time of 30 months. GEFT protein
upregulation (2+/3+) was detected in 33 patients with CRC, but
survival data was available from only 28 patients, with 5 patients
lost to follow-up. In patients with increased GEFT expression, 12
patients died and 16 survived. In the low GEFT expression group
(−/1+), survival state information was collected for 23 patients.
In this group, 5 patients died and 18 survived. The survival rates
of patients with CRC with GEFT upregulation was lower compared with
patients with lower GEFT expression (χ2=3.876, P=0.049;
Fig. 2C). Additionally, patients
with CRC with upregulated expression of GEFT had a less favorable
outcome compared with patients with low expression of GEFT.
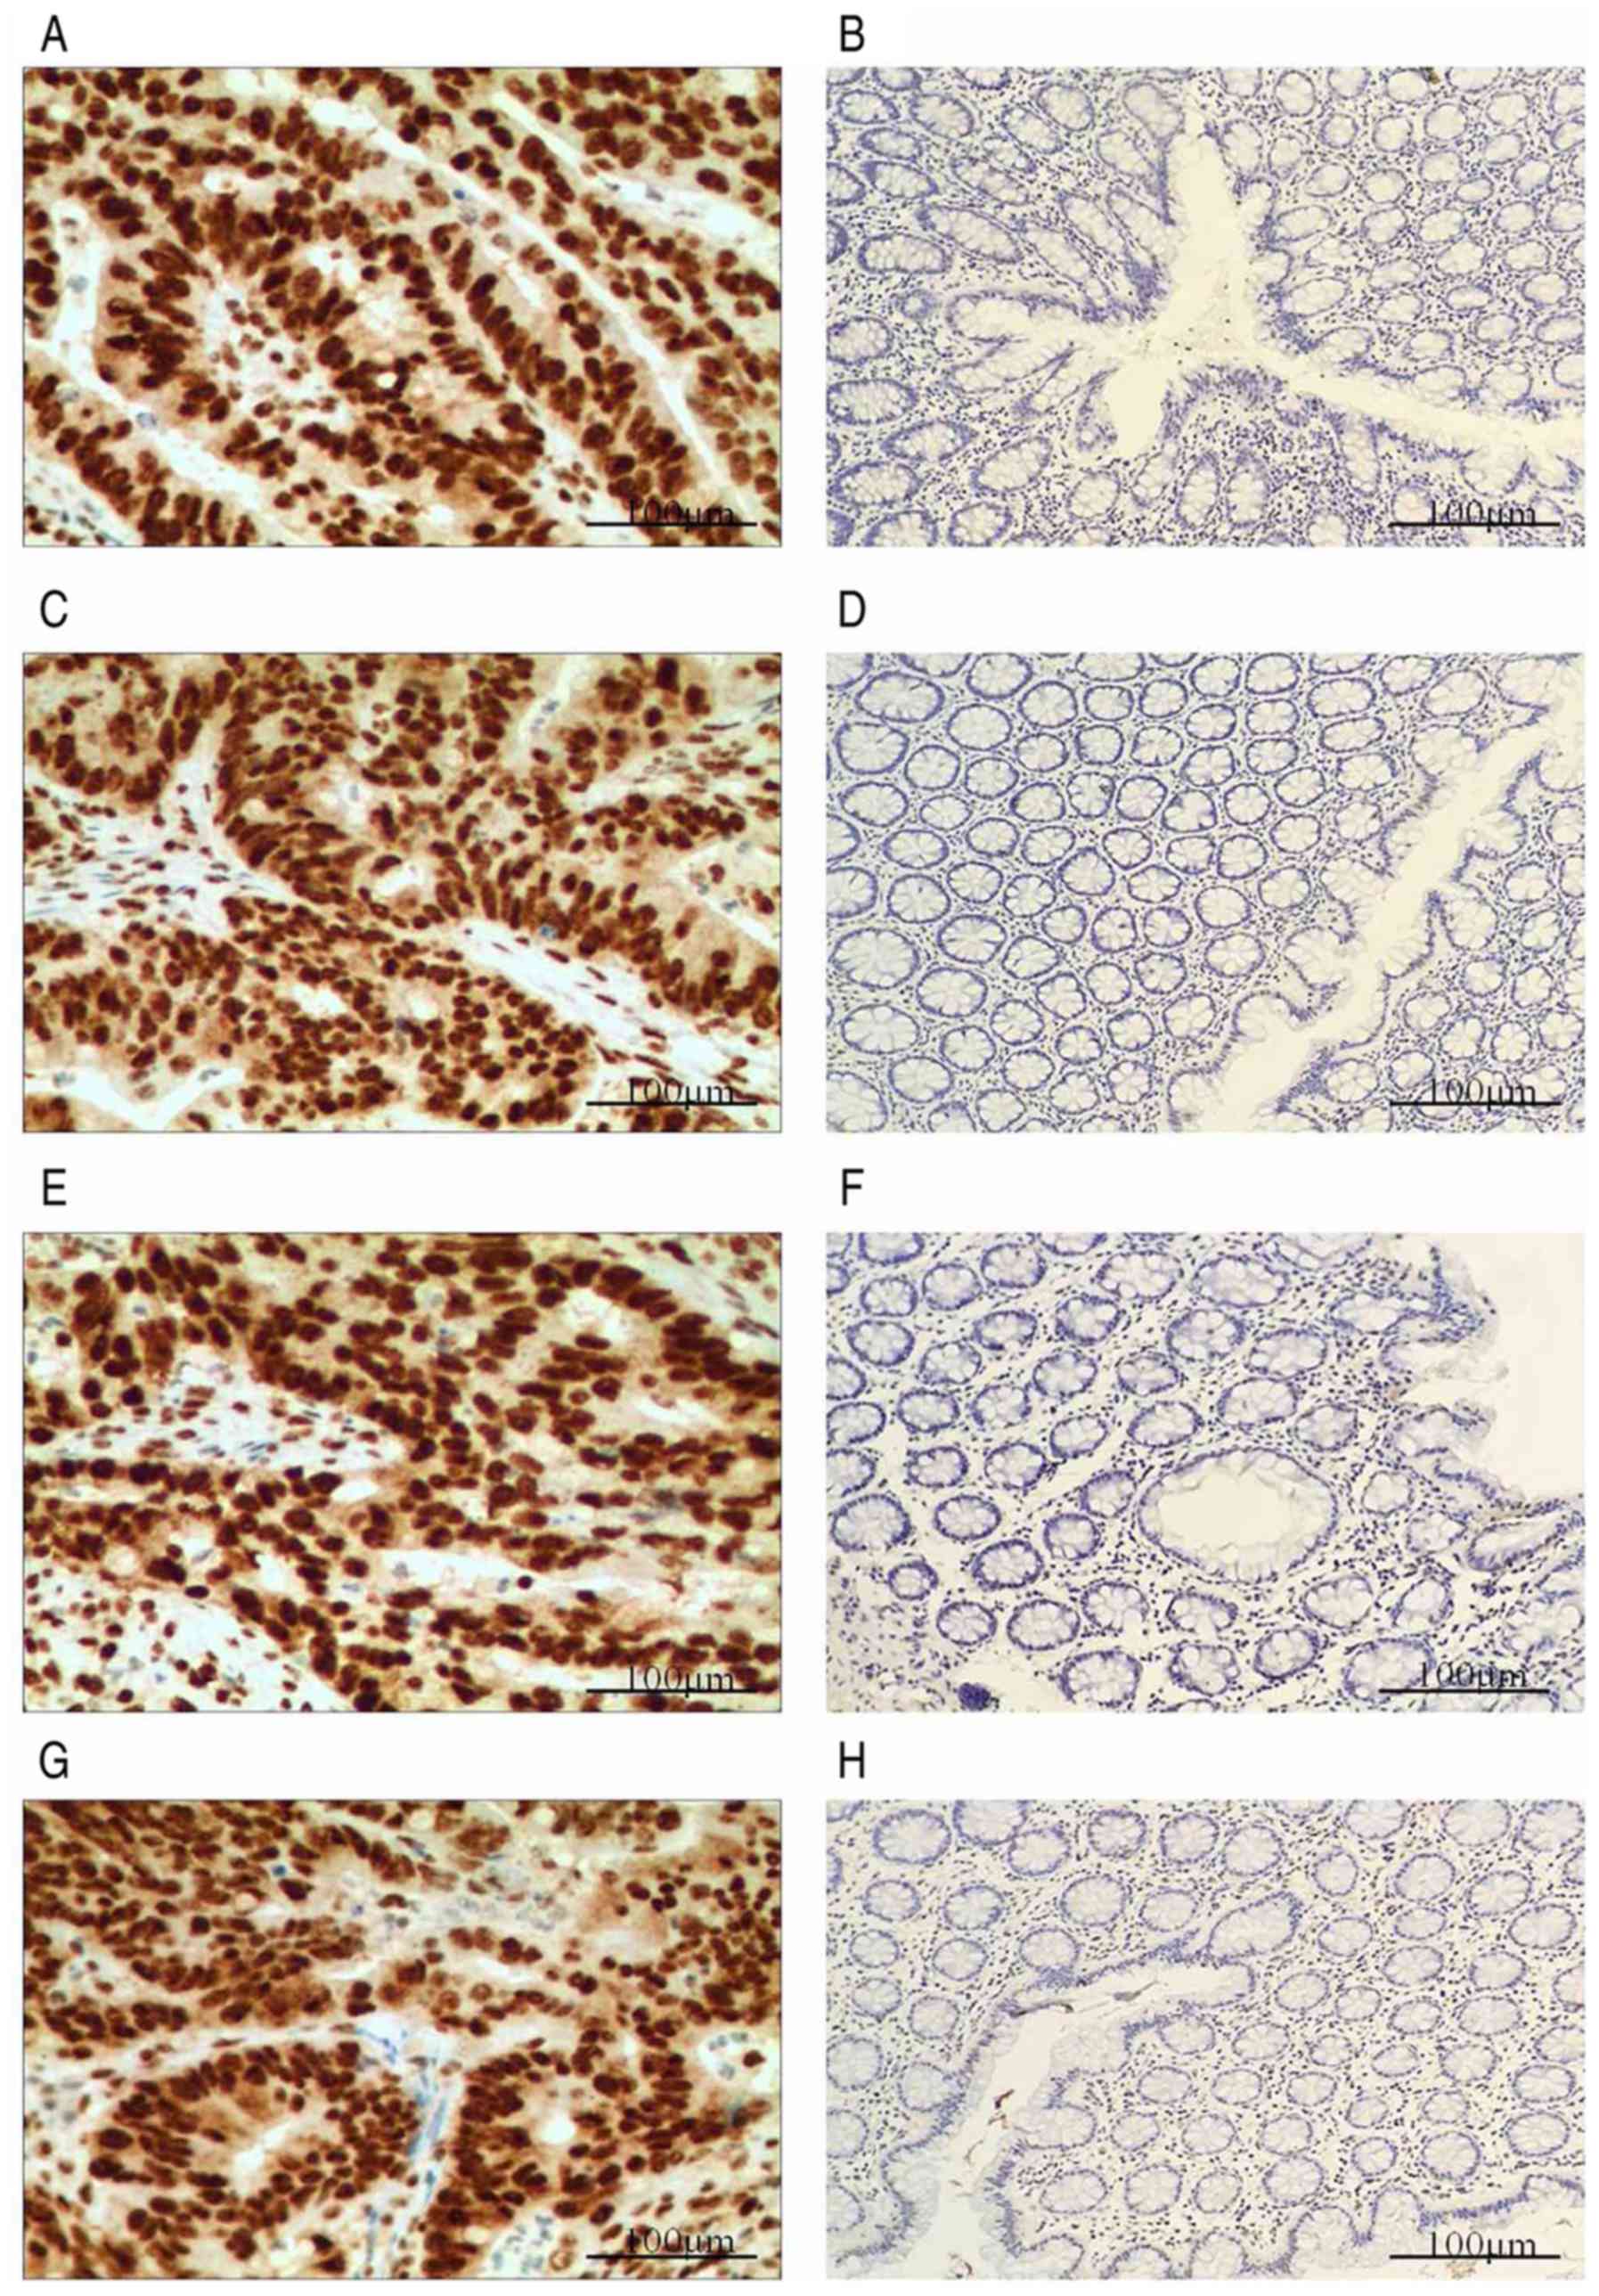
MMRPs are expressed in patients with CRC. The
expression of the four CRC-associated MMRPs, including MLH1, MSH2,
MSH6 and PMS2, were evaluated by IHC. Fig. 4 shows IHC staining of MMRP in CRC.
Loss of at least one MMRP was defined as MMRP-defective (MMR-D) and
no MMRP loss was defined as MMRP-intact (MMR-I). In the present
study, 6 cases of CRC were MMR-D and 54 were MMR-I. Among the MMR-D
group, 4 samples displayed loss of PMS2, 1 showed loss of MSH2 and
MSH6, and 1 exhibited loss of PMS2 and MLH1 (Table VII).
| Table VII.Expression of the four MMRPs in the
colorectal cancer samples. |
Table VII.
Expression of the four MMRPs in the
colorectal cancer samples.
| n | PMS2 | MSH2 | MSH6 | MLH1 |
|---|
| 4 | − | + | + | + |
| 1 | + | − | − | + |
| 1 | − | + | + | − |
| 54 | + | + | + | + |
Comparison of clinicopathological data
of the MMR-D and MMR-I groups in colorectal adenocarcinoma
The association between the MMR-D and MMR-I groups
in colorectal adenocarcinoma is shown in Table VI. MMR-D incidence was lower in
patients with a tumor maximal diameter ≥5 cm (χ2=5.208,
P=0.022; Table VI). However, there
was significant difference between MMR-D and MMR-I groups in any of
the other clinicopathological variables assessed in patients with
CRC (Table VI). In the 6 MMR-D
cases of CRC, 4 cases were GEFT expression negative, and 2 cases
were GEFT expression (2+). The association between GEFT and MMRPs
was further examined by correlational analyses, which identified a
significant inverse correlation (r=−0.285, P=0.027) (Table V).
MSI in colorectal adenocarcinoma
Among the 60 CRC specimens, 6 samples were MSI-H, 1
was MSI-L and 53 were MSS. Analysis of the microsatellite sites
showed that among the MSI-H group, 3 samples exhibited Bat25
and Bat26 mutations, 1 sample showed Bat25, Bat26 and
D5S346 mutations, 1 sample showed Bat25 and
D17S250 mutations and 1 sample exhibited Bat25 and
D2S123 mutations. Only one sample is MSI-L with Bat25
mutations (Table VIII). Using the
PCR test results as the standard, the positive conformity rate in
the present study was 83.33% (5/6) and the negative conformity rate
was 98.15% (53/54). The coincidence rate between PCR and IHC was
96.67% (58/60), and the consistency check result (κ) was 0.815
(P<0.001). The sensitivity of IHC was 83.33% (5/6) and the
specificity was 98.15% (53/54) (Table
IX). These results demonstrate that analysis via PCR and IHC
are well associated.
| Table VIII.MSI state in the colorectal cancer
samples. |
Table VIII.
MSI state in the colorectal cancer
samples.
| MSI | n | Bat26 | Bat25 | D5S346 | D2S123 | D17S250 |
|---|
| MSI-H | 3 | + | + | − | − | − |
|
| 1 | + | + | + | − | − |
|
| 1 | − | + | − | − | + |
|
| 1 | − | + | − | + | − |
| MSI-L | 1 | − | + | − | − | − |
| MSS | 53 | − | − | − | − | − |
| Table IX.MSI results in CRC. |
Table IX.
MSI results in CRC.
| Variable | MMR-D, n | MMR-I, n | Total |
|---|
| MSI-H | 5 | 1 | 6 |
| MSI-L | 1 | 0 | 1 |
| MSS | 0 | 53 | 53 |
| Total | 6 | 54 | 60 |
KRAS gene mutations in patients with
CRC
Mutations in the KRAS gene were detected by
qPCR in 16 of the 60 CRC samples (in codon 12 in 13 cases and in
codon 13 in 3 cases), with a mutation rate of 26.67%. Specific
mutation types and the incidence rates are listed in Table X.
| Table X.KRAS mutations in colorectal
cancer. |
Table X.
KRAS mutations in colorectal
cancer.
| Detected
region | Mutation | Base change | Incidence | Mutation rate
(%) |
|---|
| Codon 12 | G12V | 35G>T | 1 | 1.67 |
|
| G12D | 35G>A | 10 | 13.33 |
|
| G12R | 34G>C | 1 | 1.67 |
|
| G12S | 34G>C | 1 | 1.67 |
| Codon 13 | G13D | 38G>A | 3 | 5 |
Comparison of clinicopathological data
of KRAS gene mutations in patients with CRC
The association between KRAS mutations and
clinicopathological features in CRC is listed in Table VI. The KRAS mutation rate was
higher in poorly differentiated CRC (62.50%) compared with
well/moderately differentiated samples (21.15%,
χ2=4.131, P=0.042). No difference in KRAS
mutation status was identified with any of the other
clinicopathological variables assessed. Among the 16 KRAS gene
mutation samples of CRC, 1 sample was scored as 1+, for 8 samples
were scored as 2+, 4 samples were scored as 3+, and 3 samples were
scored as negative for GEFT protein expression. Further
investigation of the association between GEFT expression and
KRAS mutation by correlation analyses demonstrated a
significant correlation (r=0.697, P<0.001) (Table V).
Discussion
GEFT was initially identified in 2003 by Guo et
al (3), and it regulates
cellular processes by catalyzing GDP/GTP exchange on Rho GTPases,
including Rac1, Cdc42 and RhoA. These Rho GTPases are essential for
cytoskeletal dynamics and are particularly important in migration
of cancer cells (34,35). Although GEFT is expressed in a
variety of tumors, its expression in malignant digestive tract
tumors has not been studied, to the best of our knowledge. The
present study found that GEFT protein expression was higher in
malignant digestive tract tumors compared with normal tissues. GEFT
expression in ESCC samples was higher compared with normal squamous
epithelium, but weaker than in tumor samples from patients with GC
and CRC. The GEFT-positive samples primarily included samples with
1+ and 2+ GEFT protein expression. However, an association between
GEFT expression and the clinicopathological factors of ESCC was not
found. In the ESCC cohort, the median survival time was 32 months,
which is close to the maximum survival time (33 months). This is
the result of a short follow-up time, and thus the majority of
patients were still alive. As such, the survival time in the
present study is not really indicative of overall survival. This
was also true for the CRC and GC cohorts. The association between
GEFT protein expression and OS were further analyzed, and there was
no significant association between GEFT expression and OS in ESCC.
Therefore, increased GEFT protein expression in ESCC samples may
not represent an important factor in the pathogenesis of esophageal
cancer.
In GC tissues, GEFT protein expression was higher
compared with the gastric mucosa. According to Lauren staging, GEFT
protein expression was the highest in the diffuse type and lowest
in the intestinal type. Several studies have demonstrated that the
Lauren stage was closely associated with certain
clinicopathological characteristics such as age, sex, tumor size,
location, grade, invasion depth, lymphovascular invasion and
prognosis of GC (36,37). Patients with intestinal type GC were
predominantly older, male, had a smaller tumor size, had relatively
well differentiated tumors, and tumors which has less tumor
invasion depth and less lymphovascular invasion (37). Compared with proximal, middle and
whole stomach, the incidence of intestinal type GC was the highest
in distal stomach (37).
Specifically, patients with intestinal-type tumors exhibited more
favorable outcomes compared with patients with diffuse-type tumors
(38–40). The data from the present study
suggested that increased GEFT protein expression in diffuse-type
samples may be associated with a poor prognosis. Consistently, the
expression of GEFT protein was higher in TNM stage III/IV samples
(66.67%) compared with TNM stage I/II samples, suggesting that GEFT
may play an important role in the poor prognosis of these patients
with GC. Therefore, the association between GEFT protein expression
and OS was further analyzed. Although the survival rates of
patients with GC with elevated GEFT expression was lower compared
with patients with low GEFT expression, there was no significant
association. However, increased sample sizes and longer follow-up
time after surgery may be required to fully describe the
association between GEFT and prognosis in patients with GC.
Numerous studies have implicated HER2 in the
development of various types of cancer. HER2 expression was
detected in 6.1–23.0% of GCs cases (16–18).
Similarly, the HER2-positive rate in the 60 GC samples in the
present study was 13.33%. However, the prognostic value of HER2
status in GC is still controversial. Some studies report that HER2
overexpression is an adverse prognostic factor (41–44), but
others suggest that there is no association between HER2 expression
and survival rate (17,45–48). In
the present study, HER2 protein expression was higher in tumors
with nerve invasion, and significantly lower in TNM stage I/II
samples compared with TNM stage III/IV samples. These findings
corroborate another report showing that HER2 overexpression was
associated with poor prognosis in patients with GC (44). Because both GEFT protein and HER2
upregulation was associated with GC TNM stage in the present study,
further analysis of the correlation between GEFT and HER2
expression was performed. However, there was no significant
correlation between these two proteins.
The high mortality rate of CRC, another common
digestive tract tumor, stems from its metastatic potential
(49). In the present study, GEFT
protein expression levels were significantly higher in patients
with CRC compared with the control samples. Furthermore, GEFT
protein expression was higher in CRC samples with vessel carcinoma
embolus or lymph node metastasis. These results suggested that the
GEFT protein may promote CRC metastasis. The data in the present
study demonstrate that the survival rates of patients with CRC with
GEFT overexpression was lower compared with patients with lower
GEFT expression. These patients also had a less favorable outcome
compared with that of the low GEFT expression group. Therefore,
GEFT may contribute to the poor prognosis of patients with CRC by
promoting metastasis.
Several studies have reported that MSI is present in
~15% of patients with CRC. The results of the present study showed
that 10% of samples lost MMRP. Among the 60 CRC specimens, 6 were
MSI-H, 1 was MSI-L and 53 were MSS. In comparison, the MSI rate in
patients with CRC was ~11.67%. MSI status has been evaluated as a
prognostic and predictive biomarker in patients with CRC.
Specifically, patients diagnosed with CRC that are MSI-positive
present with an improved prognosis when not treated with
5-florouracil chemotherapy following surgery (50). MSH CRCs are frequently located in the
proximal colon (50–53), are poorly differentiated, and have
mucinous or medullary histology. Additionally, MSH incidence is
high in individuals <50 or >70 years old, but the incidence
is low in patients between these ages (54). In the present study, the incidence of
MMR-D was lower in patients with a maximal tumor diameter ≥5 cm,
but was not associated with any other clinicopathological
parameters in patients with CRC. However, there was a significant
inverse correlation between GEFT and MMRP expression. Therefore, it
was speculated that MSH/L may be more common in patients with CRC
with GEFT expression, though increased sample size and further
experiments are required to validate this hypothesis.
KRAS is a small GTPase and a member of the RAS
family. Activated KRAS promotes the regulation of cellular
proliferation through the receptor tyrosine kinase MAPK/PI3K
signaling cascades (55). The rate
of KRAS gene mutations in CRC is 35–45% (28,56,57). In
the present study, the rate of mutation was 26.67% in patients with
CRC, which was notably lower than previously reported. Although
KRAS gene mutation status in patients with CRC is used to
inform treatment options, particularly in the selection of targeted
therapeutic drugs such as cetuximab, the association between
KRAS gene mutations and the prognosis of patients with CRC
has not been definitively determined. In the present study, the
KRAS mutation rate was higher in poorly differentiated CRC
compared with well/moderately differentiated tumors, although a
difference in KRAS mutation status between other
clinicopathologic features was not identified. This suggests that
patients carrying tumors with KRAS mutations may exhibit
shorter overall survival. Furthermore, a significant correlation
between GEFT expression and KRAS mutation in CRC was
identified. Notably, as both GEFT and KRAS proteins are small
GTPases, both may be similarly involved in the development of
CRC.
The systematic study described here demonstrated,
for the first time, that the GEFT protein is expressed in malignant
digestive tract tumors. The results indicate that GEFT protein
expression is higher in ESCC, GC and CRC tumors compared with
normal adjacent tissues. GEFT may predominantly act as a tumor
promoter in adenocarcinomas of the stomach, as suggested by
associations with diffuse tumor type and TNM stages III/IV in GC.
In GC, HER2 was overexpressed and was associated with nerve
invasion and TNM stages III/IV. Therefore, HER2 likely promoted the
incidence of GC. Patients with CRC with upregulated protein
expression of GEFT frequently had vessel carcinoma embolus or lymph
node metastasis, and had a less favorable outcome. GEFT may
contribute to poor prognosis of patients with CRC by promoting
metastasis. The importance of MSI state and KRAS mutation
status in patients with CRC was demonstrated. Furthermore, GEFT
protein expression was associated with MSS and KRAS
mutations. GEFT expression and KRAS mutations, therefore,
may synergistically promote the incidence of CRC.
In conclusion, GEFT may be an oncogenic factor in
malignant digestive tract tumors, particularly in CRC. However, the
specific underlying mechanisms involved in the progression of these
tumors remain to be elucidated.
Acknowledgements
Not applicable.
Funding
The present study was supported by The Medical
Technology Research and Development Program of Henan Province
(Grant nos. 201701029 and 182102310343).
Availability of data and materials
The datasets used and/or analyzed during the present
study are available from the author on reasonable request.
Authors' contributions
QX conceived and designed the experiments. YW
performed the experiments, analyzed the data, and contributed to
the writing of the manuscript. BG, GG and YZ contributed to the
sample collection.
Ethics approval and consent to
participate
The purpose of the present research was explained to
the participants, who all signed a written consent prior to the
study. The present study was approved by The Institutional Ethics
Committee of the Affiliated Cancer Hospital of Zhengzhou University
(Zhengzhou, China).
Patient consent for publication
Not applicable.
Competing interests
The authors declare that they have no competing
interests.
References
|
1
|
Bryan B, Kumar V, Stafford LJ, Cai Y, Wu G
and Liu M: GEFT, a Rho family guanine nucleotide exchange factor,
regulates neurite outgrowth and dendritic spine formation. J Biol
Chem. 279:45824–45832. 2004. View Article : Google Scholar : PubMed/NCBI
|
|
2
|
Bryan BA, Mitchell DC, Zhao L, Ma W,
Stafford LJ, Teng BB and Liu M: Modulation of muscle regeneration,
myogenesis, and adipogenesis by the Rho family guanine nucleotide
exchange factor GEFT. Mol Cell Biol. 25:11089–11101. 2005.
View Article : Google Scholar : PubMed/NCBI
|
|
3
|
Guo X, Stafford LJ, Bryan B, Xia C, Ma W,
Wu X, Liu D, Songyang Z and Liu M: A Rac/Cdc42-specific exchange
factor, GEFT, induces cell proliferation, transformation, and
migration. J Biol Chem. 278:13207–13215. 2003. View Article : Google Scholar : PubMed/NCBI
|
|
4
|
Paulson V, Chandler G, Rakheja D, Galindo
RL, Wilson K, Amatruda JF and Cameron S: High-resolution array CGH
identifies common mechanisms that drive embryonal rhabdomyosarcoma
pathogenesis. Genes Chromosomes Cancer. 50:397–408. 2011.
View Article : Google Scholar : PubMed/NCBI
|
|
5
|
Liu C, Li D, Hu J, Jiang J, Zhang W, Chen
Y, Cui X, Qi Y, Zou H, Zhang W and Li F: Chromosomal and genetic
imbalances in Chinese patients with rhabdomyosarcoma detected by
high-resolution array comparative genomic hybridization. Int J Clin
Exp Pathol. 7:690–698. 2014.PubMed/NCBI
|
|
6
|
Sun C, Liu C, Li S, Li H, Wang Y, Xie Y,
Li B, Cui X, Chen Y, Zhang W and Li F: Overexpression of GEFT, a
Rho family guanine nucleotide exchange factor, predicts poor
prognosis in patients with rhabdomyosarcoma. Int J Clin Exp Pathol.
7:1606–1615. 2014.PubMed/NCBI
|
|
7
|
Lutz S, Freichel-Blomquist A, Rumenapp U,
Schmidt M, Jakobs KH and Wieland T: p63RhoGEF and GEFT are
Rho-specific guanine nucleotide exchange factors encoded by the
same gene. Naunyn Schmiedebergs Arch Pharmacol. 369:540–546. 2004.
View Article : Google Scholar : PubMed/NCBI
|
|
8
|
Tang X, Jin R, Qu G, Wang X, Li Z, Yuan Z,
Zhao C, Siwko S, Shi T, Wang P, et al: GPR116, an adhesion
G-protein-coupled receptor, promotes breast cancer metastasis via
the Galphaq-p63RhoGEF-Rho GTPase pathway. Cancer Res. 73:6206–6218.
2013. View Article : Google Scholar : PubMed/NCBI
|
|
9
|
Hayashi A, Hiatari R, Tsuji T, Ohashi K
and Mizuno K: p63RhoGEF-mediated formation of a single polarized
lamellipodium is required for chemotactic migration in breast
carcinoma cells. FEBS Lett. 587:698–705. 2013. View Article : Google Scholar : PubMed/NCBI
|
|
10
|
Bryan BA, Cai Y and Liu M: The Rho-family
guanine nucleotide exchange factor GEFT enhances retinoic acid- and
cAMP-induced neurite outgrowth. J Neurosci Res. 83:1151–1159. 2006.
View Article : Google Scholar : PubMed/NCBI
|
|
11
|
Siegel RL, Miller KD and Jemal A: Cancer
statistics, 2018. CA Cancer J Clin. 68:7–30. 2018. View Article : Google Scholar : PubMed/NCBI
|
|
12
|
Sjoquist KM, Burmeister BH, Smithers BM,
Zalcberg JR, Simes RJ, Barbour A and Gebski V; Australasian
Gastro-Intestinal Trials Group, : Survival after neoadjuvant
chemotherapy or chemoradiotherapy for resectable oesophageal
carcinoma: An updated meta-analysis. Lancet Oncol. 12:681–692.
2011. View Article : Google Scholar : PubMed/NCBI
|
|
13
|
Pennathur A, Gibson MK, Jobe BA and
Luketich JD: Oesophageal carcinoma. Lancet. 381:400–412. 2013.
View Article : Google Scholar : PubMed/NCBI
|
|
14
|
Hadi AA, Hindawi AE, Hareedy A, Khalil H,
Ashiry RA, Elia S, Sadek A, Magdy M, Atta R, Anas A, et al:
Her2/neu protein expression and oncogene amplification in gastric
carcinoma with clinico-pathological correlation in egyptian
patients. Open Access Maced J Med Sci. 4:535–542. 2016. View Article : Google Scholar : PubMed/NCBI
|
|
15
|
Moore MA, Eser S, Igisinov N, Igisinov S,
Mohagheghi MA, Mousavi-Jarrahi A, Ozentürk G, Soipova M, Tuncer M
and Sobue T: Cancer epidemiology and control in North-Western and
Central Asia-past, present and future. Asian Pac J Cancer Prev. 11
(Suppl 2):S17–S32. 2010.
|
|
16
|
Hsu JT, Chen TC, Tseng JH, Chiu CT, Liu
KH, Yeh CN, Hwang TL, Jan YY and Yeh TS: Impact of HER-2
overexpression/amplification on the prognosis of gastric cancer
patients undergoing resection: A single-center study of 1,036
patients. Oncologist. 16:1706–1713. 2011. View Article : Google Scholar : PubMed/NCBI
|
|
17
|
Sheng WQ, Huang D, Ying JM, Lu N, Wu HM,
Liu YH, Liu JP, Bu H, Zhou XY and Du X: HER2 status in gastric
cancers: A retrospective analysis from four Chinese representative
clinical centers and assessment of its prognostic significance. Ann
Oncol. 24:2360–2364. 2013. View Article : Google Scholar : PubMed/NCBI
|
|
18
|
Bang YJ, Van Cutsem E, Feyereislova A,
Chung HC, Shen L, Sawaki A, Lordick F, Ohtsu A, Omuro Y, Satoh T,
et al: Trastuzumab in combination with chemotherapy versus
chemotherapy alone for treatment of HER2-positive advanced gastric
or gastro-oesophageal junction cancer (ToGA): A phase 3,
open-label, randomised controlled trial. Lancet. 376:687–697. 2010.
View Article : Google Scholar : PubMed/NCBI
|
|
19
|
Ferlay J, Soerjomataram I, Dikshit R, Eser
S, Mathers C, Rebelo M, Parkin DM, Forman D and Bray F: Cancer
incidence and mortality worldwide: Sources, methods and major
patterns in GLOBOCAN 2012. Int J Cancer. 136:E359–E386. 2015.
View Article : Google Scholar : PubMed/NCBI
|
|
20
|
Kriegl L: In situ analyses of molecular
mechanisms of colorectal carcinogenesis. Pathologe. 34 (Suppl
2):S269–S273. 2013.(In German). View Article : Google Scholar
|
|
21
|
Zhang X and Li J: Era of universal testing
of microsatellite instability in colorectal cancer. World J
Gastrointest Oncol. 5:12–19. 2013. View Article : Google Scholar : PubMed/NCBI
|
|
22
|
Boland CR and Goel A: Microsatellite
instability in colorectal cancer. Gastroenterology.
138:2073–2087.e3. 2010. View Article : Google Scholar : PubMed/NCBI
|
|
23
|
Yamamoto H and Imai K: Microsatellite
instability: An update. Arch Toxicol. 89:899–921. 2015. View Article : Google Scholar : PubMed/NCBI
|
|
24
|
Peltomäki P, Lothe RA, Aaltonen LA,
Pylkkänen L, Nyström-Lahti M, Seruca R, David L, Holm R, Ryberg D,
Haugen A, et al: Microsatellite instability is associated with
tumors that characterize the hereditary non-polyposis colorectal
carcinoma syndrome. Cancer Res. 53:5853–5855. 1993.PubMed/NCBI
|
|
25
|
Herman JG, Umar A, Polyak K, Graff JR,
Ahuja N, Issa JP, Markowitz S, Willson JK, Hamilton SR, Kinzler KW,
et al: Incidence and functional consequences of hMLH1 promoter
hypermethylation in colorectal carcinoma. Proc Natl Acad Sci USA.
95:6870–6875. 1998. View Article : Google Scholar : PubMed/NCBI
|
|
26
|
Hampel H, Frankel WL, Martin E, Arnold M,
Khanduja K, Kuebler P, Clendenning M, Sotamaa K, Prior T, Westman
JA, et al: Feasibility of screening for Lynch syndrome among
patients with colorectal cancer. J Clin Oncol. 26:5783–5788. 2008.
View Article : Google Scholar : PubMed/NCBI
|
|
27
|
Vaughn CP, Zobell SD, Furtado LV, Baker CL
and Samowitz WS: Frequency of KRAS, BRAF, and NRAS mutations in
colorectal cancer. Genes Chromosomes Cancer. 50:307–312. 2011.
View Article : Google Scholar : PubMed/NCBI
|
|
28
|
Amado RG, Wolf M, Peeters M, Van Cutsem E,
Siena S, Freeman DJ, Juan T, Sikorski R, Suggs S, Radinsky R, et
al: Wild-type KRAS is required for panitumumab efficacy in patients
with metastatic colorectal cancer. J Clin Oncol. 26:1626–1634.
2008. View Article : Google Scholar : PubMed/NCBI
|
|
29
|
Lièvre A, Bachet JB, Le Corre D, Boige V,
Landi B, Emile JF, Côté JF, Tomasic G, Penna C, Ducreux M, et al:
KRAS mutation status is predictive of response to cetuximab therapy
in colorectal cancer. Cancer Res. 66:3992–3995. 2006. View Article : Google Scholar : PubMed/NCBI
|
|
30
|
Sorich MJ, Wiese MD, Rowland A,
Kichenadasse G, McKinnon RA and Karapetis CS: Extended RAS
mutations and anti-EGFR monoclonal antibody survival benefit in
metastatic colorectal cancer: A meta-analysis of randomized,
controlled trials. Ann Oncol. 26:13–21. 2015. View Article : Google Scholar : PubMed/NCBI
|
|
31
|
Edge SB and Compton CC: The American Joint
Committee on Cancer: The 7th edition of the AJCC cancer staging
manual and the future of TNM. Ann Surg Oncol. 17:1471–1474. 2010.
View Article : Google Scholar : PubMed/NCBI
|
|
32
|
Hofmann M, Stoss O, Shi D, Büttner R, van
de Vijver M, Kim W, Ochiai A, Rüschoff J and Henkel T: Assessment
of a HER2 scoring system for gastric cancer: Results from a
validation study. Histopathology. 52:797–805. 2008. View Article : Google Scholar : PubMed/NCBI
|
|
33
|
Boland CR, Thibodeau SN, Hamilton SR,
Sidransky D, Eshleman JR, Burt RW, Meltzer SJ, Rodriguez-Bigas MA,
Fodde R, Ranzani GN and Srivastava S: A National Cancer Institute
Workshop on Microsatellite Instability for cancer detection and
familial predisposition: Development of international criteria for
the determination of microsatellite instability in colorectal
cancer. Cancer Res. 58:5248–5257. 1998.PubMed/NCBI
|
|
34
|
Fukata M, Nakagawa M and Kaibuchi K: Roles
of Rho-family GTPases in cell polarisation and directional
migration. Curr Opin Cell Biol. 15:590–597. 2003. View Article : Google Scholar : PubMed/NCBI
|
|
35
|
Sahai E and Marshall CJ: RHO-GTPases and
cancer. Nat Rev Cancer. 2:133–142. 2002. View Article : Google Scholar : PubMed/NCBI
|
|
36
|
Stiekema J, Cats A, Kuijpers A, van
Coevorden F, Boot H, Jansen EP, Verheij M, Balague Ponz O,
Hauptmann M and van Sandick JW: Surgical treatment results of
intestinal and diffuse type gastric cancer. Implications for a
differentiated therapeutic approach? Eur J Surg Oncol. 39:686–693.
2013. View Article : Google Scholar : PubMed/NCBI
|
|
37
|
Chen YC, Fang WL, Wang RF, Liu CA, Yang
MH, Lo SS, Wu CW, Li AF, Shyr YM and Huang KH: Clinicopathological
variation of lauren classification in gastric cancer. Pathol Oncol
Res. 22:197–202. 2016. View Article : Google Scholar : PubMed/NCBI
|
|
38
|
Tanner M, Hollmén M, Junttila TT, Kapanen
AI, Tommola S, Soini Y, Helin H, Salo J, Joensuu H, Sihvo E, et al:
Amplification of HER-2 in gastric carcinoma: Association with
Topoisomerase IIalpha gene amplification, intestinal type, poor
prognosis and sensitivity to trastuzumab. Ann Oncol. 16:273–278.
2005. View Article : Google Scholar : PubMed/NCBI
|
|
39
|
Yamashita K, Sakuramoto S, Katada N,
Futawatari N, Moriya H, Hirai K, Kikuchi S and Watanabe M: Diffuse
type advanced gastric cancer showing dismal prognosis is
characterized by deeper invasion and emerging peritoneal cancer
cell: The latest comparative study to intestinal advanced gastric
cancer. Hepatogastroenterology. 56:276–281. 2009.PubMed/NCBI
|
|
40
|
Zheng H, Takahashi H, Murai Y, Cui Z,
Nomoto K, Miwa S, Tsuneyama K and Takano Y: Pathobiological
characteristics of intestinal and diffuse-type gastric carcinoma in
Japan: An immunostaining study on the tissue microarray. J Clin
Pathol. 60:273–277. 2007. View Article : Google Scholar : PubMed/NCBI
|
|
41
|
Gravalos C and Jimeno A: HER2 in gastric
cancer: A new prognostic factor and a novel therapeutic target. Ann
Oncol. 19:1523–1529. 2008. View Article : Google Scholar : PubMed/NCBI
|
|
42
|
Liang JW, Zhang JJ, Zhang T and Zheng ZC:
Clinicopathological and prognostic significance of HER2
overexpression in gastric cancer: A meta-analysis of the
literature. Tumour Biol. 35:4849–4858. 2014. View Article : Google Scholar : PubMed/NCBI
|
|
43
|
Dang HZ, Yu Y and Jiao SC: Prognosis of
HER2 over-expressing gastric cancer patients with liver metastasis.
World J Gastroenterol. 18:2402–2407. 2012. View Article : Google Scholar : PubMed/NCBI
|
|
44
|
Lei YY, Huang JY, Zhao QR, Jiang N, Xu HM,
Wang ZN, Li HQ, Zhang SB and Sun Z: The clinicopathological
parameters and prognostic significance of HER2 expression in
gastric cancer patients: A meta-analysis of literature. World J
Surg Oncol. 15:682017. View Article : Google Scholar : PubMed/NCBI
|
|
45
|
Janjigian YY, Werner D, Pauligk C,
Steinmetz K, Kelsen DP, Jäger E, Altmannsberger HM, Robinson E,
Tafe LJ, Tang LH, et al: Prognosis of metastatic gastric and
gastroesophageal junction cancer by HER2 status: A European and USA
International collaborative analysis. Ann Oncol. 23:2656–2662.
2012. View Article : Google Scholar : PubMed/NCBI
|
|
46
|
Kunz PL, Mojtahed A, Fisher GA, Ford JM,
Chang DT, Balise RR, Bangs CD, Cherry AM and Pai RK: HER2
expression in gastric and gastroesophageal junction adenocarcinoma
in a US population: Clinicopathologic analysis with proposed
approach to HER2 assessment. Appl Immunohistochem Mol Morphol.
20:13–24. 2012. View Article : Google Scholar : PubMed/NCBI
|
|
47
|
Grabsch H, Sivakumar S, Gray S, Gabbert HE
and Muller W: HER2 expression in gastric cancer: Rare,
heterogeneous and of no prognostic value-conclusions from 924 cases
of two independent series. Cell Oncol. 32:57–65. 2010.PubMed/NCBI
|
|
48
|
Qiu M, Zhou Y, Zhang X, Wang Z, Wang F,
Shao J, Lu J, Jin Y, Wei X, Zhang D, et al: Lauren classification
combined with HER2 status is a better prognostic factor in Chinese
gastric cancer patients. BMC Cancer. 14:8232014. View Article : Google Scholar : PubMed/NCBI
|
|
49
|
Elferink MA, de Jong KP, Klaase JM,
Siemerink EJ and de Wilt JH: Metachronous metastases from
colorectal cancer: A population-based study in North-East
Netherlands. Int J Colorectal Dis. 30:205–212. 2015. View Article : Google Scholar : PubMed/NCBI
|
|
50
|
Gryfe R, Kim H, Hsieh ET, Aronson MD,
Holowaty EJ, Bull SB, Redston M and Gallinger S: Tumor
microsatellite instability and clinical outcome in young patients
with colorectal cancer. N Engl J Med. 342:69–77. 2000. View Article : Google Scholar : PubMed/NCBI
|
|
51
|
Jeong SY, Shin KH, Shin JH, Ku JL, Shin
YK, Park SY, Kim WH and Park JG: Microsatellite instability and
mutations in DNA mismatch repair genes in sporadic colorectal
cancers. Dis Colon Rectum. 46:1069–1077. 2003. View Article : Google Scholar : PubMed/NCBI
|
|
52
|
Thibodeau SN, Bren G and Schaid D:
Microsatellite instability in cancer of the proximal colon.
Science. 260:816–819. 1993. View Article : Google Scholar : PubMed/NCBI
|
|
53
|
Bertagnolli MM, Redston M, Compton CC,
Niedzwiecki D, Mayer RJ, Goldberg RM, Colacchio TA, Saltz LB and
Warren RS: Microsatellite instability and loss of heterozygosity at
chromosomal location 18q: Prospective evaluation of biomarkers for
stages II and III colon cancer-a study of CALGB 9581 and 89803. J
Clin Oncol. 29:3153–3162. 2011. View Article : Google Scholar : PubMed/NCBI
|
|
54
|
Samowitz WS, Curtin K, Ma KN, Schaffer D,
Coleman LW, Leppert M and Slattery ML: Microsatellite instability
in sporadic colon cancer is associated with an improved prognosis
at the population level. Cancer Epidemiol Biomarkers Prev.
10:917–923. 2001.PubMed/NCBI
|
|
55
|
Ahearn IM, Haigis K, Bar-Sagi D and
Philips MR: Regulating the regulator: Post-translational
modification of RAS. Nat Rev Mol Cell Biol. 13:39–51. 2011.
View Article : Google Scholar : PubMed/NCBI
|
|
56
|
Karapetis CS, Khambata-Ford S, Jonker DJ,
O'Callaghan CJ, Tu D, Tebbutt NC, Simes RJ, Chalchal H, Shapiro JD,
Robitaille S, et al: K-ras mutations and benefit from cetuximab in
advanced colorectal cancer. N Engl J Med. 359:1757–1765. 2008.
View Article : Google Scholar : PubMed/NCBI
|
|
57
|
Peeters M, Price TJ, Cervantes A, Sobrero
AF, Ducreux M, Hotko Y, André T, Chan E, Lordick F, Punt CJ, et al:
Randomized phase III study of panitumumab with fluorouracil,
leucovorin, and irinotecan (FOLFIRI) compared with FOLFIRI alone as
second-line treatment in patients with metastatic colorectal
cancer. J Clin Oncol. 28:4706–4713. 2010. View Article : Google Scholar : PubMed/NCBI
|