Introduction
Kidney cancers are among the 10 most frequently
diagnosed malignancies worldwide (1). Clear cell renal cell carcinoma (ccRCC)
represents the most common as well as the most aggressive
histopathological subtype (2). The
5-year survival rate for systematically spread kidney cancers is
approximately 12% (3). Therefore,
there is an urgent need for research which may establish new
molecular targets responsible for ccRCC initiation and progression
(4).
The Sonic Hedgehog (SHH) pathway plays an important
role during embryogenesis and in the maintenance of tissue
homeostasis during postnatal life (5–7). SHH
full-length protein (424aa) is cleaved intracellularly (8) to provide two biologically active
products. C-terminal SHH protein (227aa) acts as an autoprocessing
domain, while N-terminal SHH protein (174aa) is secreted and may
act as a ligand either via auto- or paracrine signaling (9). The binding of N-terminal SHH molecule
to the Patched-1 (PTCH1) cell membrane receptor initiates
intracellular signal transduction through Smoothened (SMO)
co-receptor and GLI zinc finger proteins, which, acting as
transcription factors, activate transcription of several target
genes, e.g. MYCN, bcl2 or VEGF (10).
Aberrant expression of SHH, PTCH1, SMO and
GLI1 genes associated with cancer progression and patients
survival has been reported in a broad range of human malignancies
such as basal cell carcinoma (11),
breast cancer (12) and other
neoplasms (13,14). However, the results of SHH pathway
genes expression, both at the mRNA as well as protein level, in
ccRCC human tissues are contradictory (15–17).
Therefore, we decided to perform the analysis of the
expression of SHH pathway genes at the mRNA level in ccRCC tumor
and paired unchanged kidney tissue. Moreover, we assessed the level
of full-length SHH protein as well as the C-terminal SHH domain
protein in kidney tumor lysates by western blot method. The results
were statistically analyzed in terms of clinicopathological
features of ccRCC patients and their overall survival (OS).
Materials and methods
Patients and samples
The ccRCC tumor tissue and morphologically unchanged
kidney samples were obtained during radical nephrectomy from 37
patients operated in the Department of Urology, Medical University
of Gdańsk, Poland. The exclusion criteria for the study were:
diagnosis of VHL disease, multifocal or/and bilateral kidney
tumors, other than ccRCC histological subtypes of RCC. The study
was approved by the local Ethics Committee (decision no.
NKEBN/4/2011 and NKBBN/370/2016); written consent was acquired
before the surgery from each patient. The clinicopathological
features of the patients were presented in Table I.
 | Table I.Clinicopathological characteristics
of patients and association between SHH pathway molecular
assessments with clinical data. |
Table I.
Clinicopathological characteristics
of patients and association between SHH pathway molecular
assessments with clinical data.
|
| SHH qPCR results
(%) | PTCH1 qPCR results
(%) | SMO qPCR results
(%) | GLI1 qPCR results
(%) | Full-length SHH WB
results (%) | C-terminal SHH WB
results (%) |
|---|
|
|
|
|
|
|
|
|
|---|
| Patient
characteristic n=37 | ↓ (≤0.117) | ↑ (>0.117) | Pa | ↓ (≤0.056) | ↑ (>0.056) | Pa | ↓ (≤0.073) | ↑ (>0.073) | Pa | ↓ (≤0.004) | ↑ (>0.004) | Pa | ↓ (≤0.372) | ↑ (>0.372) | Pa | ↓ (≤1.951) | ↑ (>1.951) | Pa |
| Age [y]
mean±SD: |
| 60.70±11.08 |
| Range: 33–82 |
| ≤62
n=19 | 5
(14.3)b | 12
(34.3)b | 0.229 | 7
(20.6)b | 11
(32.4)b | 0.041 | 7
(24.1)b | 5
(17.2)b | 0.046 | 1
(2.9)b | 16
(45.7)b | 0.486 | 7
(21.9)b | 10
(31.3)b | 0.726 | 13
(43.3)b | 3
(10.0)b | 0.675 |
| >62
n=18 | 2
(5.7)b | 16
(45.7)b |
| 13
(38.2)b | 4
(11.8)b |
| 3
(10.3)b | 14
(48.3)b |
| 0
(0.0)b | 18
(51.4)b |
| 5
(15.6)b | 10
(31.3)b |
| 10
(33.3)b | 4
(13.3)b |
|
| Sex |
| Female
n=13 | 3
(8.6)b | 8
(22.9)b | 0.652 | 5
(14.7)b | 6
(17.6)b | 0.458 | 3
(10.3)b | 6
(20.7)b | 1.000 | 1
(2.9)b | 11
(31.4)b | 0.343 | 5
(15.6)b | 8
(25.0)b | 1.000 | 6
(20.0)b | 6
(20.0)b | 0.034 |
| Male
n=24 | 4
(11.4)b | 20
(57.1)b |
| 15
(44.1)b | 8
(23.5)b |
| 7
(24.1)b | 13
(44.8)b |
| 0
(0.0)b | 23
(65.7)b |
| 7
(21.9)b | 12
(37.5)b |
| 16
(53.3)b | 2
(6.7)b |
|
| Tumor size
[cm] |
| ≤7 cm
n=23 | 4
(11.4)b | 18
(51.4)b | 1.000 | 13
(38.2)b | 9
(26.5)b | 1.000 | 7
(24.1)b | 12
(41.4)b | 1.000 | 0
(0.0)b | 22
(62.9)b | 0.371 | 9
(28.1)b | 10
(31.3)b | 0.267 | 13
(43.3)b | 5
(16.7)b | 0.669 |
| >7
cm n=14 | 3
(8.6)b | 10
(28.6)b |
| 7
(20.6)b | 5
(14.7)b |
| 3
(10.3)b | 7
(24.1)b |
| 1
(2.9)b | 12
(34.3)b |
| 3
(9.4)b | 10
(31.3)b |
| 10
(33.3)b | 2
(6.7)b |
|
| Fuhrman's
Histological grade |
| 1 + 2
n=16c | 3
(8.6)b | 12
(34.3)b | 1.000 | 9
(27.3)b | 6
(18.2)b | 1.000 | 3
(10.3)b | 9
(31.0)b | 0.450 | 0
(0.0)b | 16
(45.7)b | 1.000 | 4
(12.9)b | 10
(32.3)b | 0.707 | 10
(34.5)b | 3
(10.3)b | 1.000 |
| 3 + 4
n=20c | 4
(11.4)b | 16
(45.7)b |
| 10
(30.3)b | 8
(24.2)b |
| 7
(24.1)b | 10
(34.5)b |
| 1
(2.9)b | 18
(51.4)b |
| 7
(22.6)b | 10
(32.3)b |
| 12
(41.4)b | 4
(13.8)b |
|
| TNM stage |
|
Non-metastatic | 3
(8.6)b | 16
(45.7)b | 0.677 | 9
(26.5)b | 11
(32.4)b | 0.079 | 6
(20.7)b | 11
(37.9)b | 1.000 | 0
(0.0)b | 20
(57.1)b | 0.429 | 9
(28.1)b | 9
(28.1)b | 0.147 | 12
(40.0)b | 4
(13.3)b | 1.000 |
|
T1-2N0M0 n=20 |
|
Metastatic | 4
(11.4)b | 12
(34.3)b |
| 11
(32.4)b | 3
(8.8)b |
| 4
(13.8)b | 8
(27.6)b |
| 1
(2.9)b | 14
(40.0)b |
| 3
(9.4)b | 11
(34.4)b |
| 11
(36.7)b | 3
(10.0)b |
|
|
T1-2N1M0 |
|
T3N0-2M0 |
|
T4N0-2M0 |
|
T1-4N0-2M1 n=17 |
| Sunitinib |
| Yes
n=11 | 1
(2.9)b | 10
(28.6)b | 0.392 | 4
(11.8)b | 6
(17.6)b | 0.252 | 3
(10.3)b | 6
(20.7)b | 1.000 | 0
(0.0)b | 11
(31.4)b | 1.000 | 6
(18.8)b | 4
(12.5)b | 0.119 | 8
(26.7)b | 2
(6.7)b | 1.000 |
| No
n=26 | 6
(17.1)b | 18
(51.4)b |
| 16
(47.1)b | 8
(23.5)b |
| 7
(24.1)b | 13
(44.8)b |
| 1
(2.9)b | 23
(65.7)b |
| 6
(18.8)b | 16
(50.0)b |
| 15
(50.0)b | 5
(16.7)b |
|
Material acquisition
Small (ca. 7×2, 7×2, 7×2 mm) pieces of ccRCC and
morphologically unchanged tissues (resected from at least 2 cm from
the tumor) (18) were placed into
test tubes in the operating theater, no longer than 20 min after
kidney resection. One of the three sectioned pieces of obtaining
material was placed into about 5 volumes of RNA later (Ambion
Inc.), and after 24 h placed at −80°C until analyzed by qPCR and
western blotting. The other two samples of tumor tissue were fixed
in 4% buffered formalin solution, embedded in paraffin, sectioned
and stained with hematoxylin and eosin (H&E) for
histopathological assessment. The tumor samples were subjected to
qPCR and WB analyses only if >60% cells in the respective
histological sections in tumor samples presented characteristic
features of ccRCC while all cells of unchanged (control) samples
presented normal morphology (18,19). If
both conditions were not fulfilled, the patient was excluded from
the study.
Total RNA isolation
Total RNA from the collected samples was isolated
using the ExtractMe Total RNA kit (Blirt) according to the
manufacturer's protocol. The collected samples were homogenized in
2 ml tubes with 300 µl lysis buffer and ceramic beads using the
MagnaLyser apparatus (Roche Diagnostics) for 40 sec at 6,000 rpm.
The obtained RNA was dissolved in 70 µl of nuclease-free water. The
quantity and quality of RNA were measured with a spectrophotometer
(NanoDrop ND 1000; Thermo Fisher Scientific). RNA samples were
stored at −80°C until further analysis.
First-strand cDNA synthesis
1 µg RNA was reversibly transcribed using 1 µl
RevertAid reverse transcriptase (Fermentas; Thermo Fischer
Scientific) and 0,5 µg dT18 primers (Sigma-Aldrich, Munich,
Germany) in a total volume of 20 µl. The reaction was performed
according to the manufacturer's (Fermentas; Thermo Fischer
Scientific) protocol. cDNA samples were collected at −20°C until
further analysis.
Assessment of gene mRNA level
The mRNA assessment was performed by the qPCR
technique. Primers' sequences were designed using the Primer-BLAST
software; their concentrations, as well as experimentally
established reaction conditions, are presented in Table II. The measurements were performed
in duplicate using 1 µl of 4× diluted cDNA and SensiFast Sybr™
No-Rox kit (Bioline) chemistry in a total volume of 10 µl. The
reaction was conducted on separate PCR plate (4titude) for each
gene with negative control (water instead of cDNA) and 10× diluted
pooled cDNA as a precision control. StepOne Plus apparatus with
accompanying software ver. 2.3 (Life Technologies; Applied
Biosystems) was used for the amplification process and data
analysis. Geometric mean of Ct (threshold cycle) values for each
gene was normalized to the reference gene (GUSB), according
to our previous normalization study on ccRCC (20), using the Livak's equation (21): X=2∆Ct, where X
stands for expression of gene Y and ∆Ct=Ct Gusb-Ct gene Y. Obtained
raw expression data for each tumor sample were calibrated to
average expression data of control samples (fold change; control
sample=1).
| Table II.Details of qPCR assays. |
Table II.
Details of qPCR assays.
| Gene | Primer sequence and
concentration in qPCR reaction | Amplicon size | qPCR efficiency
(%) | qPCR
conditions |
|---|
| SHH |
5′-GCAAAGCAAAAAGACACTCGG-3′ | 269 | 95.8 | 95°C, 2 min; 40×
(95°C, 5 sec; 59°C, 10 sec; 72°C, 12 sec; 77°C, 10 sec, sample
reading) |
| mRNA |
5′-ATTTAAGGCTCTTGAAGGTCCG-3′200 nM
each |
|
| Melting curve:
95°C, 15 sec; 60°C, 1 min; 68°C→95°C reading every 0, 3°C |
| PTCH1 |
5′-GAATCCCTTTTGAGGACAGGAC-3′ | 387 | 103.6 | 95°C, 2 min; 40×
(95°C, 5 sec; 59°C, 10 sec; 72°C, 12 sec; 77°C, 10 sec, sample
reading) |
| mRNA |
5′-GCATGGTAATCTGCGTTTCATG-3′200 nM
each |
|
| Melting curve:
95°C, 15 sec; 60°C, 1 min; 68°C→95°C reading every 0, 3°C |
| SMO |
5′-ACTTCTTCAACCAGGCTGAGT-3′ | 288 | 106.7 | 95°C, 2 min; 40×
(95°C, 5 sec; 59°C, 10 sec; 72°C, 12 sec; 77°C, 10 sec, sample
reading) |
| mRNA |
5′-TCATCTTGCTCTTCTTGATCCG-3′300 nM
each |
|
| Melting curve:
95°C, 15 sec; 60°C, 1 min; 68°C→95°C reading every 0, 3°C |
| GLI1 |
5′-CTACATCAACTCCGGCCAATAG-3′ | 151 | 96.4 | 95°C, 2min; 40×
(95°C, 5 sec; 58°C, 10 sec; 72°C, 12 sec; 77°C, 10 sec, sample
reading) |
| mRNA |
5′-TGACAGTATAGGCAGAGCTGAT-3′300 nM
each |
|
| Melting curve:
95°C, 15 sec; 60°C, 1 min; 68°C→95°C reading every 0, 3°C |
| GUSB |
5′-ATGCAGGTGATGGAAGAAGTGGTG-3′ | 177 | 99.6 | 95°C, 3 min; 35×
(95°C, 5 sec; 57°C, 10 sec; 72°C, 10 sec; 75°C, 10 sec, sample
reading) |
| mRNA |
5′-AGAGTTGCTCACAAAGGTCACAGG-3′200 nM
each |
|
| Melting curve:
95°C, 15 sec; 60°C, 1 min; 60°C → 95°C reading every 0.3°C |
Western blot analysis
Renal biopsies were gently fragmented with Mammalian
Cell Extraction Kit (Biovision, Inc.) in tissue homogenizer
MagnaLyzer (Roche Diagnostics). Measurement of protein
concentration in homogenates was performed by Bradford protein
assay with Coomasie Brillant Blue dye (Sigma-Aldrich). Bovine serum
albumin (BSA; Sigma-Aldrich) was used as a standard for the
preparation of the calibration curve. The proteins were next
separated by their weight using SDS-PAGE (12%; Mini-Protean Tetra
System; Bio-Rad). Electrotransfer from an electrophoretic gel to
PVDF membrane was carried out in the Mini-Protean Tetra System
apparatus (Bio-Rad). The membrane was next incubated with 3% BSA
(Sigma-Aldrich) in TBS (Tris-buffered saline; pH 7.5) at room
temperature (RT) for 1 h. To detect SHH protein, PVDF membrane was
first incubated with the monoclonal rabbit anti-human SHH antibody
[EP1190Y] (dilution 1:1,000; Abcam) overnight at 4°C, and then with
the peroxidase conjugate polyclonal anti-rabbit IgG produced in
goat [A6154] (dilution 1:10,000; Sigma-Aldrich) for 2 h at RT.
After each incubation step, the TBST solution (0.1% Tween-20 in
TBS) was used for washing the membrane. To obtain the
electrophoretic bands Chemiluminescent Peroxidase Substrate
(Sigma-Aldrich) was used. Afterward, the PVDF membrane was also
incubated with a monoclonal anti-GAPDH peroxidase antibody produced
in mouse (dilution 1:50,000; Sigma-Aldrich) for 1 h at RT to obtain
the signal from the reference protein. Densitometric analysis of
electrophoretic bands was conducted through the Quantity One
Software (Bio-Rad). The values of band intensity/mm2 for
full-length or C-terminal SHH protein were normalized to those from
the GAPDH protein examination. Final semi-quantitative results for
tumor samples were obtained as a ratio=mean
unitsTumor/mean unitsControl for full-length
or C-terminal SHH protein.
Statistical analysis
Statistics were performed with the use of GraphPad
Prism ver. 5.00 (GraphPad Software, Inc.) and Statistica ver. 13.1
(Statsoft Inc.). To compare clinicopathological and molecular data
Wilcoxon signed-rank and Fisher's 2×2 exact tests were used. Any
correlation analysis presented in the study was performed by
Spearman's test. Kaplan-Meier analysis was performed to verify the
associations between obtained molecular data and patients'
clinicopathological parameters as well as overall survival. In all
statistical analyses, a two-sided P<0.05 was considered as
statistically significant with a 95% confidence interval.
Results
Clinicopathological characteristics of
patients
The study encompassed 37 ccRCC patients, 13 female,
and 24 male, with mean age 60.70±11.08 years (Table I). According to AJCC/UICC TNM
classification of malignant tumors (1), 17 patients were diagnosed as stage I
(T1N0M0), 3 as stage II (T2N0M0), 13 as stage III (T1-2N1M0 or
T3N0-2M0) and 4 as stage IV (T4N0-2M0 or T1-4N0-2M1).
Histopathological examination of ccRCC tissues indicated 2 patients
with grade 1, 14 patients with grade 2, 12 patients with grade 3
and 8 patients with grade 4 (1 patient with no grade given)
following to Fuhrman grading system. For some samples, the results
of molecular assessments were excluded due to negative results
(e.g. no amplification or no visible bands; Table I). The mean follow-up period was 38
months (range, 3–72). All deaths were associated with ccRCC
progression. The median overall survival (OS) rate was 24 months.
During follow-up, metastases occurred in 11 patients.
Expression of the SHH pathway genes at
the mRNA level
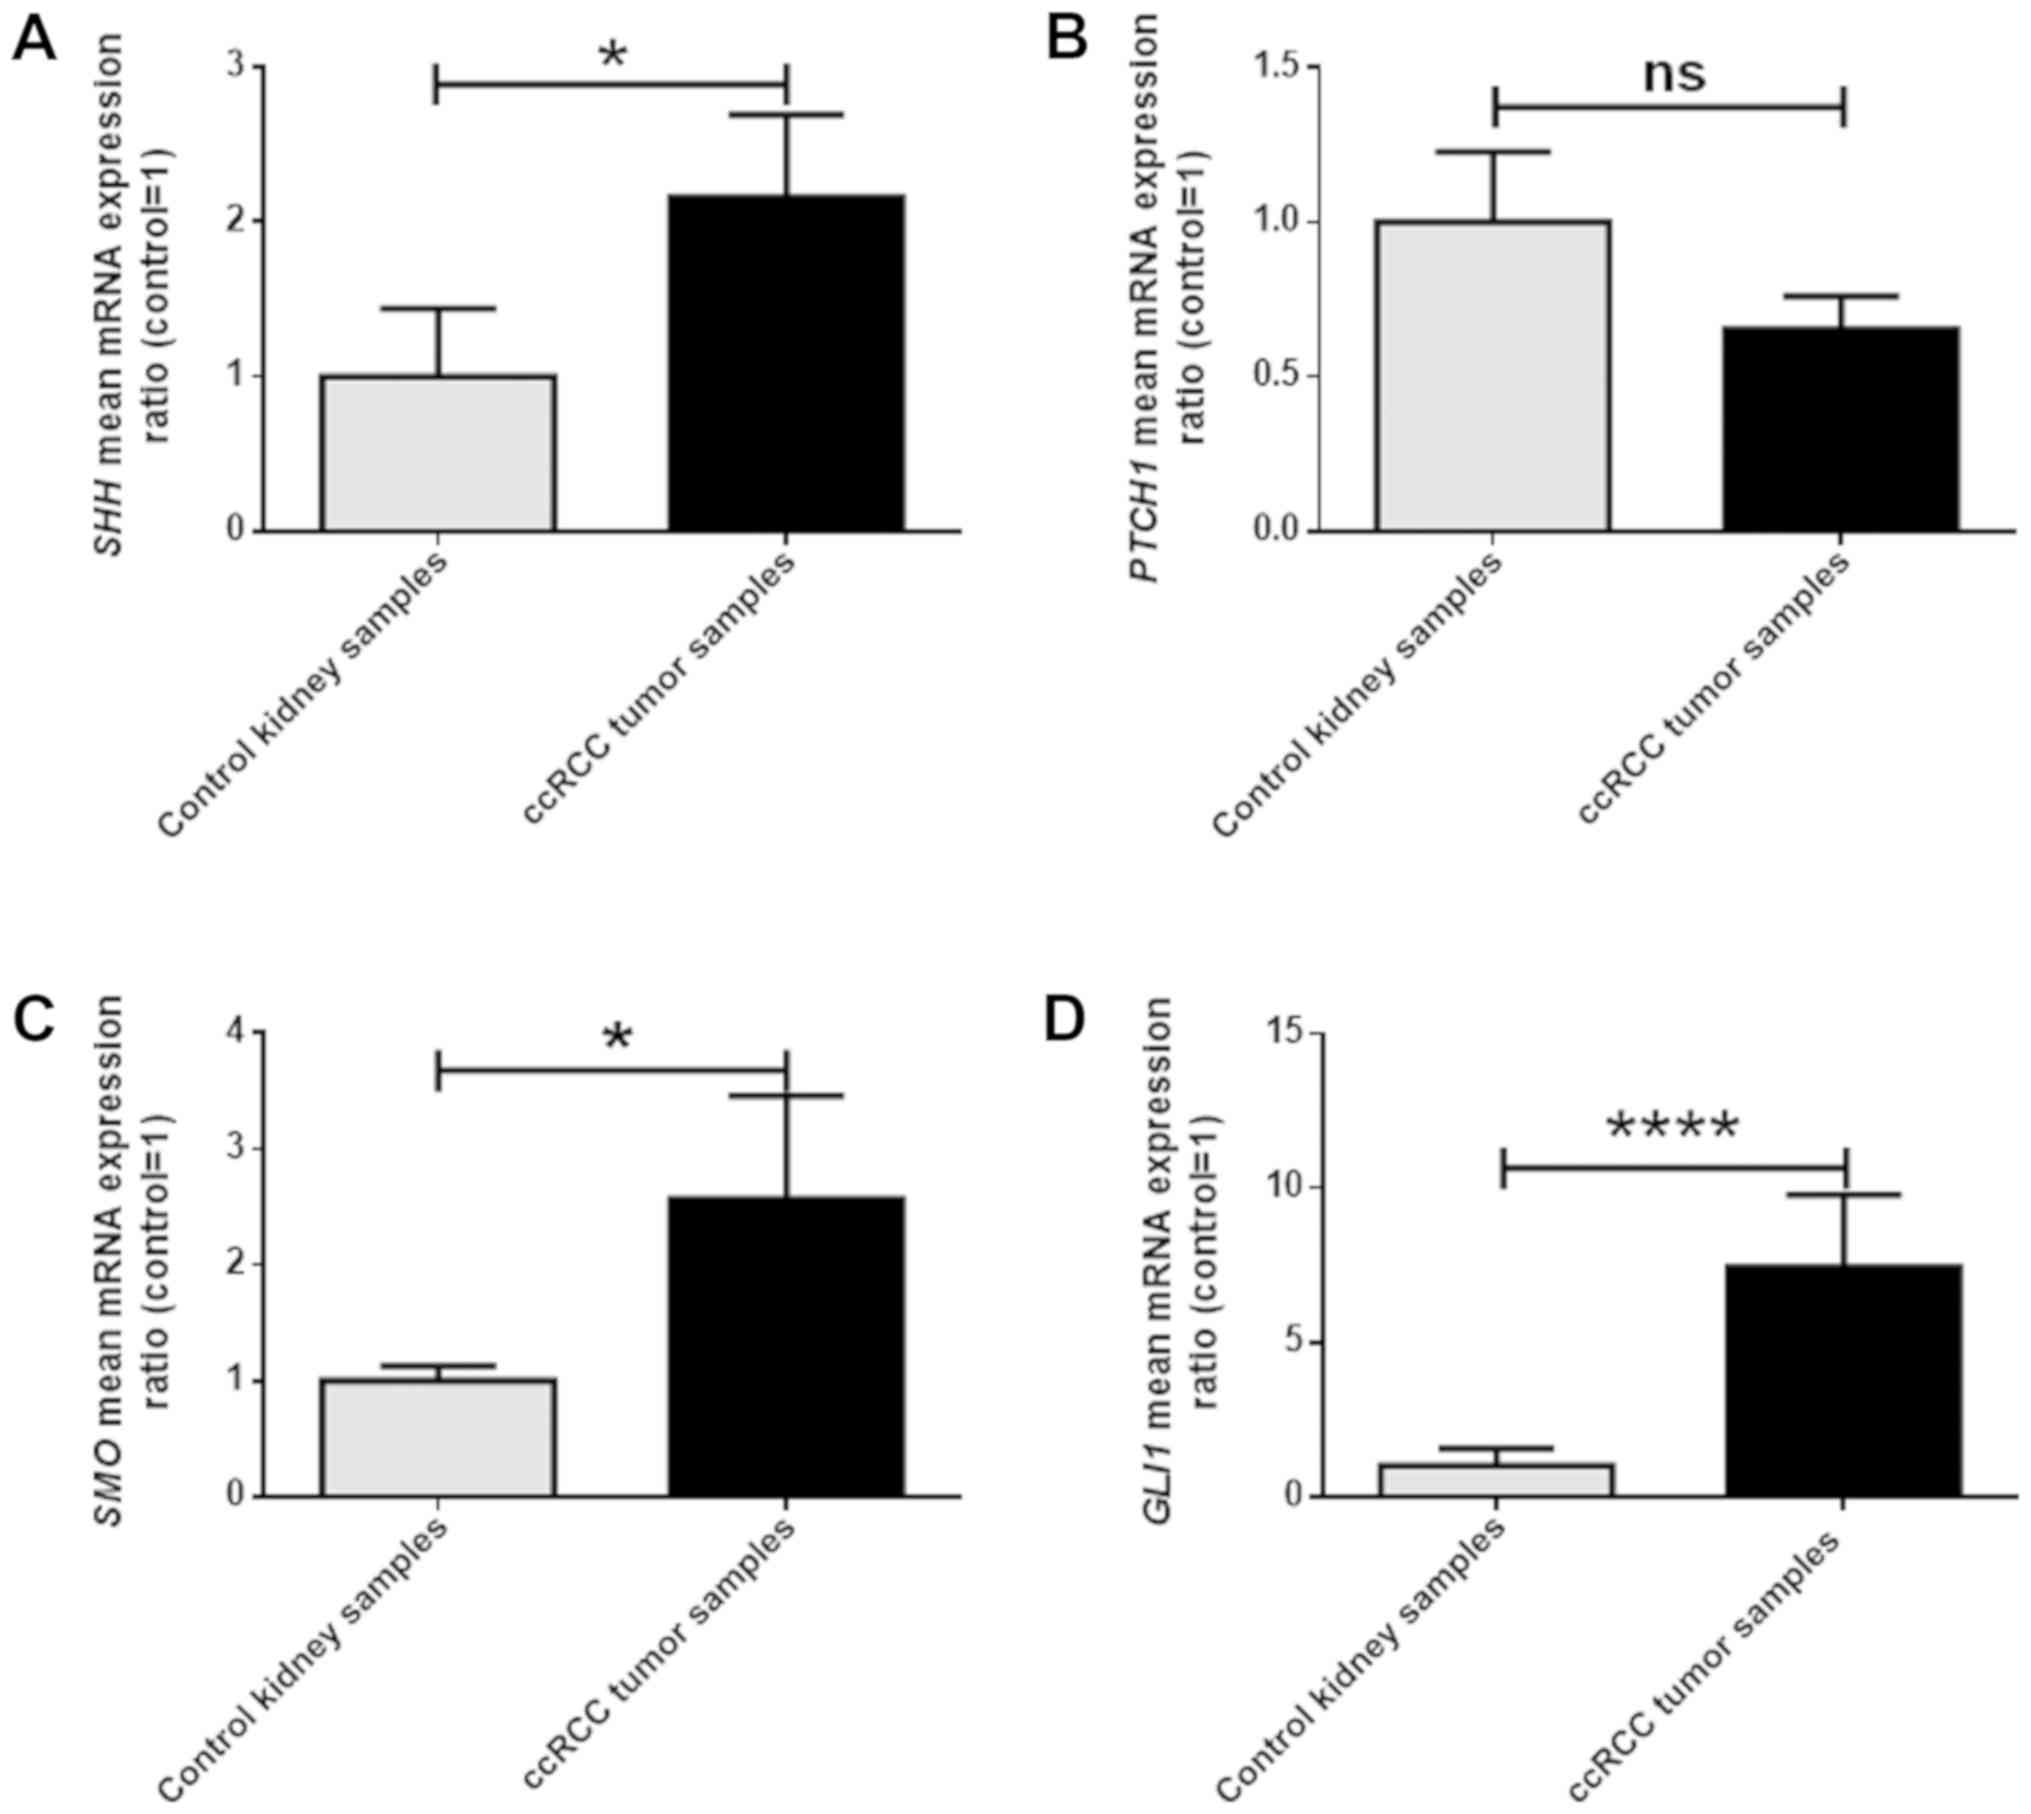
qPCR analysis revealed significantly, approximately
2-, 2,5- and 7-fold higher SHH, SMO and GLI1 mRNA
levels, respectively, in ccRCC samples, compared to morphologically
unchanged kidney tissue (Fig. 1A, C and
D). There were no statistically significant differences between
the expression of the PTCH1 gene in cancer and control
tissues (Fig. 1B). Correlation
analysis between mRNA levels of SHH pathway genes and patients
clinicopathological factors revealed lower expression of
PTCH1 as well as higher mRNA level of SMO in tumor
samples derived from older patients (age >62; P<0,05;
Table I). Moreover, the level of
C-terminal SHH protein in ccRCC samples was significantly lower in
a group of males than females (Table
I).
Association between mRNA levels of the
analyzed genes
The results of Spearman's test revealed a strong
(rs=0.729) positive correlation between SMO and GLI1
expression (Fig. 2F). Moreover,
medium positive correlations were observed between the mRNA levels
of SHH and SMO (Fig.
2B) as well as SHH and GLI1 (Fig. 2C) genes (rs=0.561 and rs=0.646,
respectively). A negative correlation was found between
PTCH1 and SMO (Fig.
2D; rs=−0.579) as well as PTCH1 and GLI1
(Fig. 2E; rs=−0.378) expression.
There was no statistically significant correlation between the
expression of SHH and PTCH1 (Fig. 2A) genes.
Semi-quantitative SHH protein level
assessment
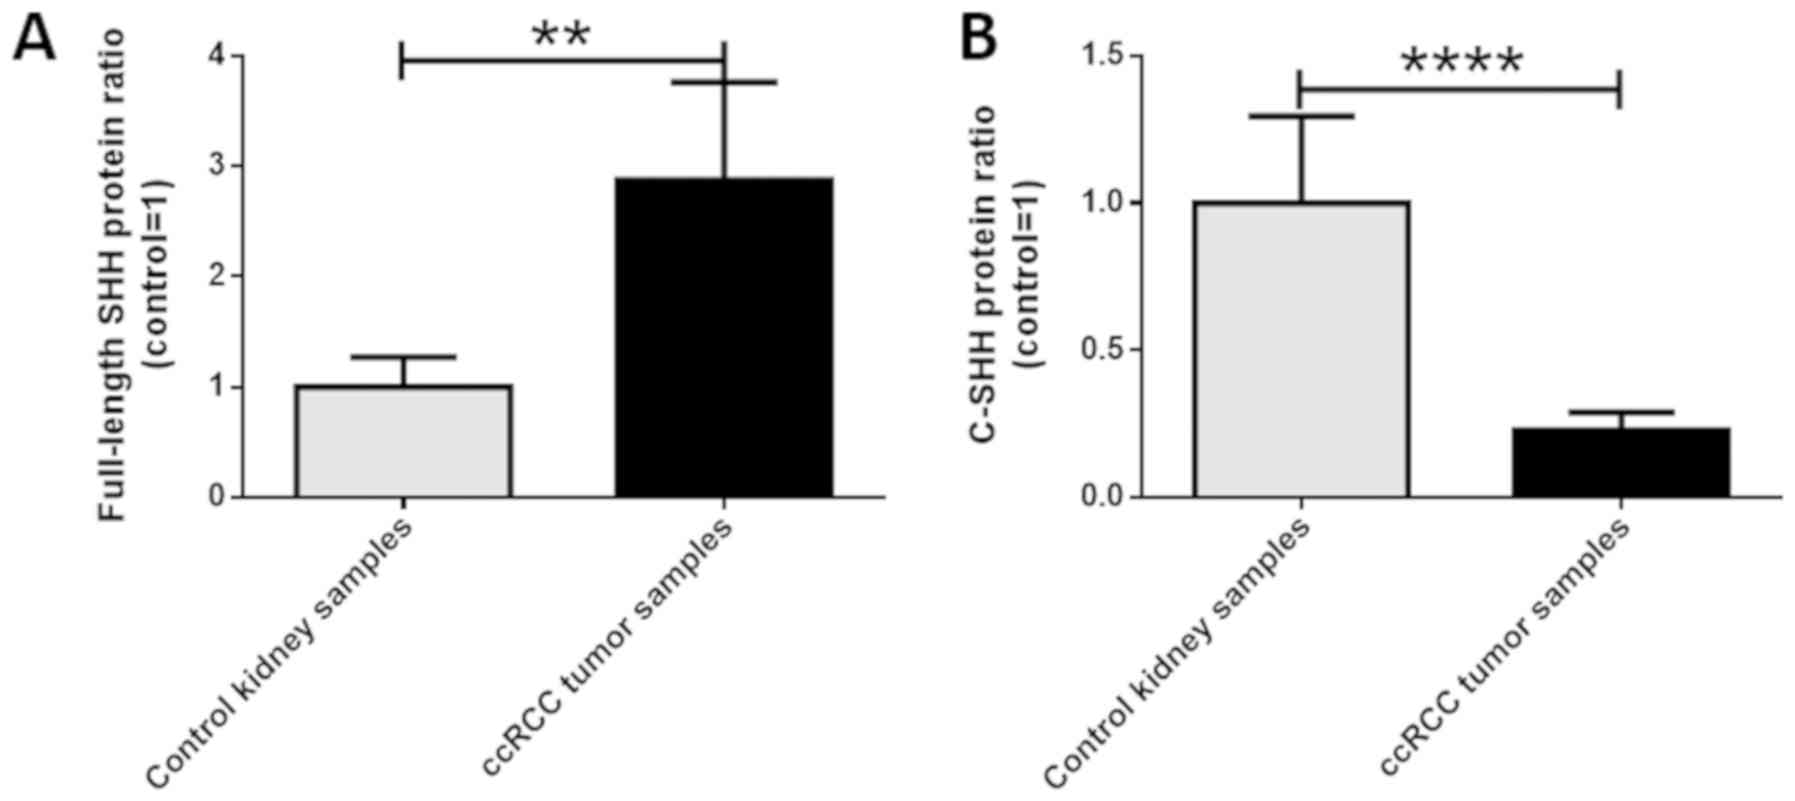
Western blot analysis demonstrated some differences
in full-length and C-terminal SHH protein levels between tumor and
control samples. According to Fig.
3, which presents obtained representative electrophoretic
bands, in 5/8 matched tissue pairs the level of full-length SHH
protein was higher in tumor samples compared to control. A similar
or lower level of full-length SHH protein in ccRCC tissues was
observed in 3 cases. We also observed a remarkable difference
between the C-terminal SHH protein content, which was much higher
in control tissues and very low or undetectable in ccRCC samples.
These findings were confirmed by the densitometric analysis which
revealed approximately 3-fold higher as well as a 4-fold lower
level of full-length and C-terminal SHH proteins respectively, in
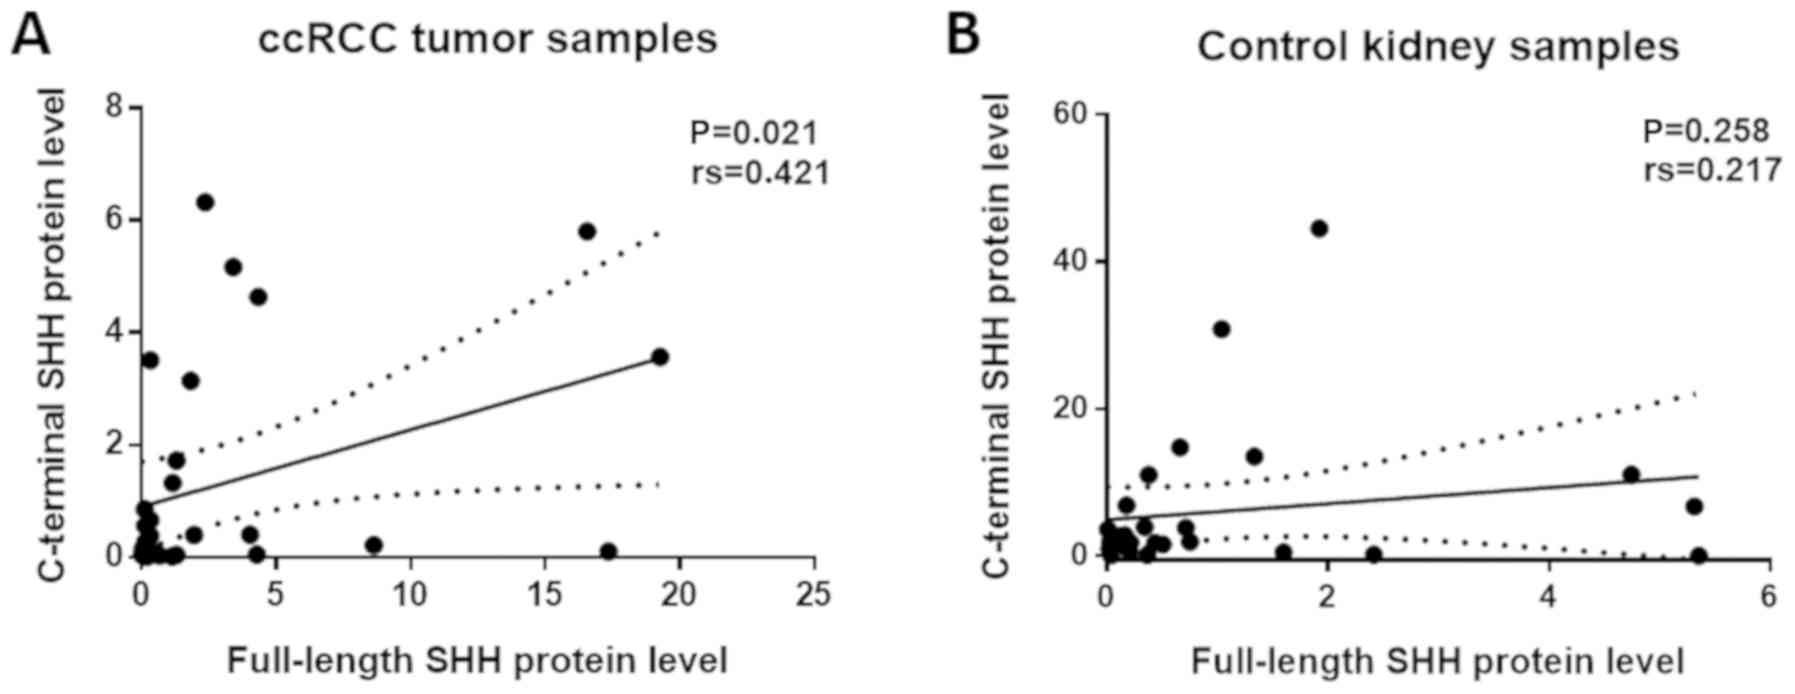
ccRCC tissues compared to control samples (P<0.05; Fig. 4A and B). Spearman's test did not show
any correlation between SHH mRNA level and neither
full-length nor C-terminal SHH protein levels (data not shown).
However, there was a positive correlation between the levels of
both analyzed SHH protein fragments in cancer tissues, but not in
control samples (rs=0,421, P=0,021 and, rs=0,217, P=0.258,
respectively; Fig. 5).
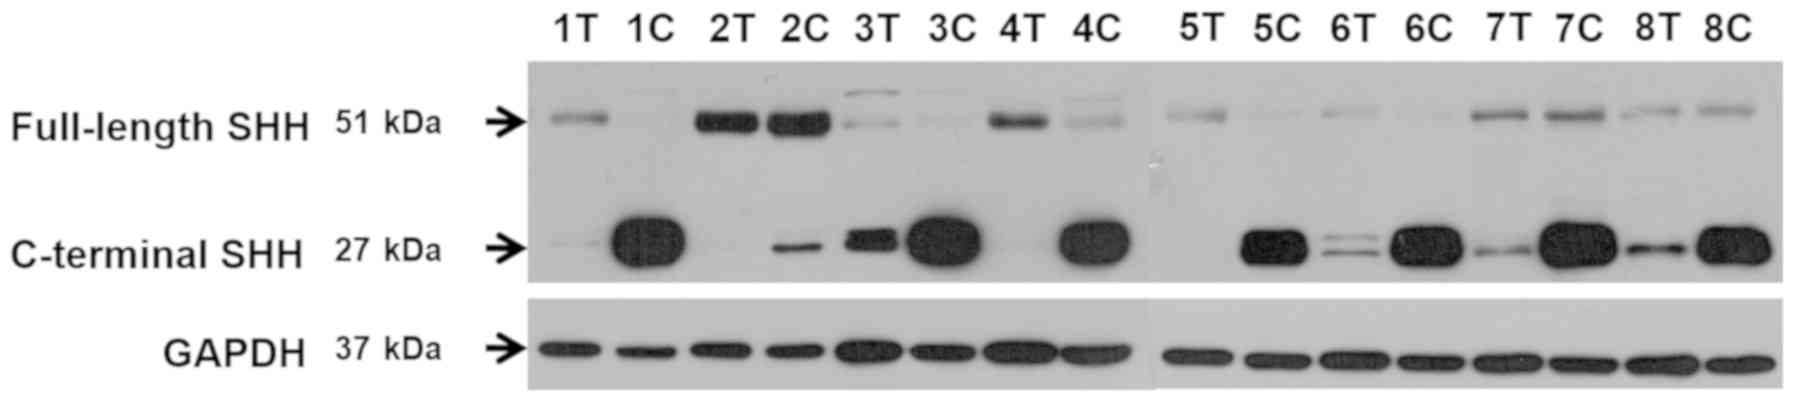 | Figure 3.Western blot analysis of full-length
and C-terminal SHH protein levels. Representative electrophoretic
bands for eight patients (1–8) of full-length (424aa) and C-terminal
(227aa) SHH proteins in tumor (T) and control kidney (C) samples.
GAPDH was used as a reference protein. In 5 matched tissue pairs, a
higher level of full-length SHH protein was indicated in tumor
samples compared with the control (patients no. 1, 3, 4, 5 and 6).
A similar or lower level of full-length SHH protein in ccRCC
tissues was observed in 3 cases (patients no. 2, 7, 8). A marked
difference between the C-terminal SHH protein content which was
revealed to be increased in control tissues (patients no. 3, 6, 7
and 8) and significantly decreased or undetectable in ccRCC samples
(patients no. 1, 2, 4 and 5). SHH, Sonic Hedgehog Signaling
Molecule; ccRCC, clear cell renal cell carcinoma. |
Survival analysis
The overall survival of patients with ccRCC was
strongly associated with higher Fuhrman grading and male sex
(Fig. 6A and B). However, TNM
staging, SHH, PTCH1 and SMO mRNA levels as well as
full-length and C-terminal SHH protein levels were not correlated
with patients' survival (Fig.
6C-H).
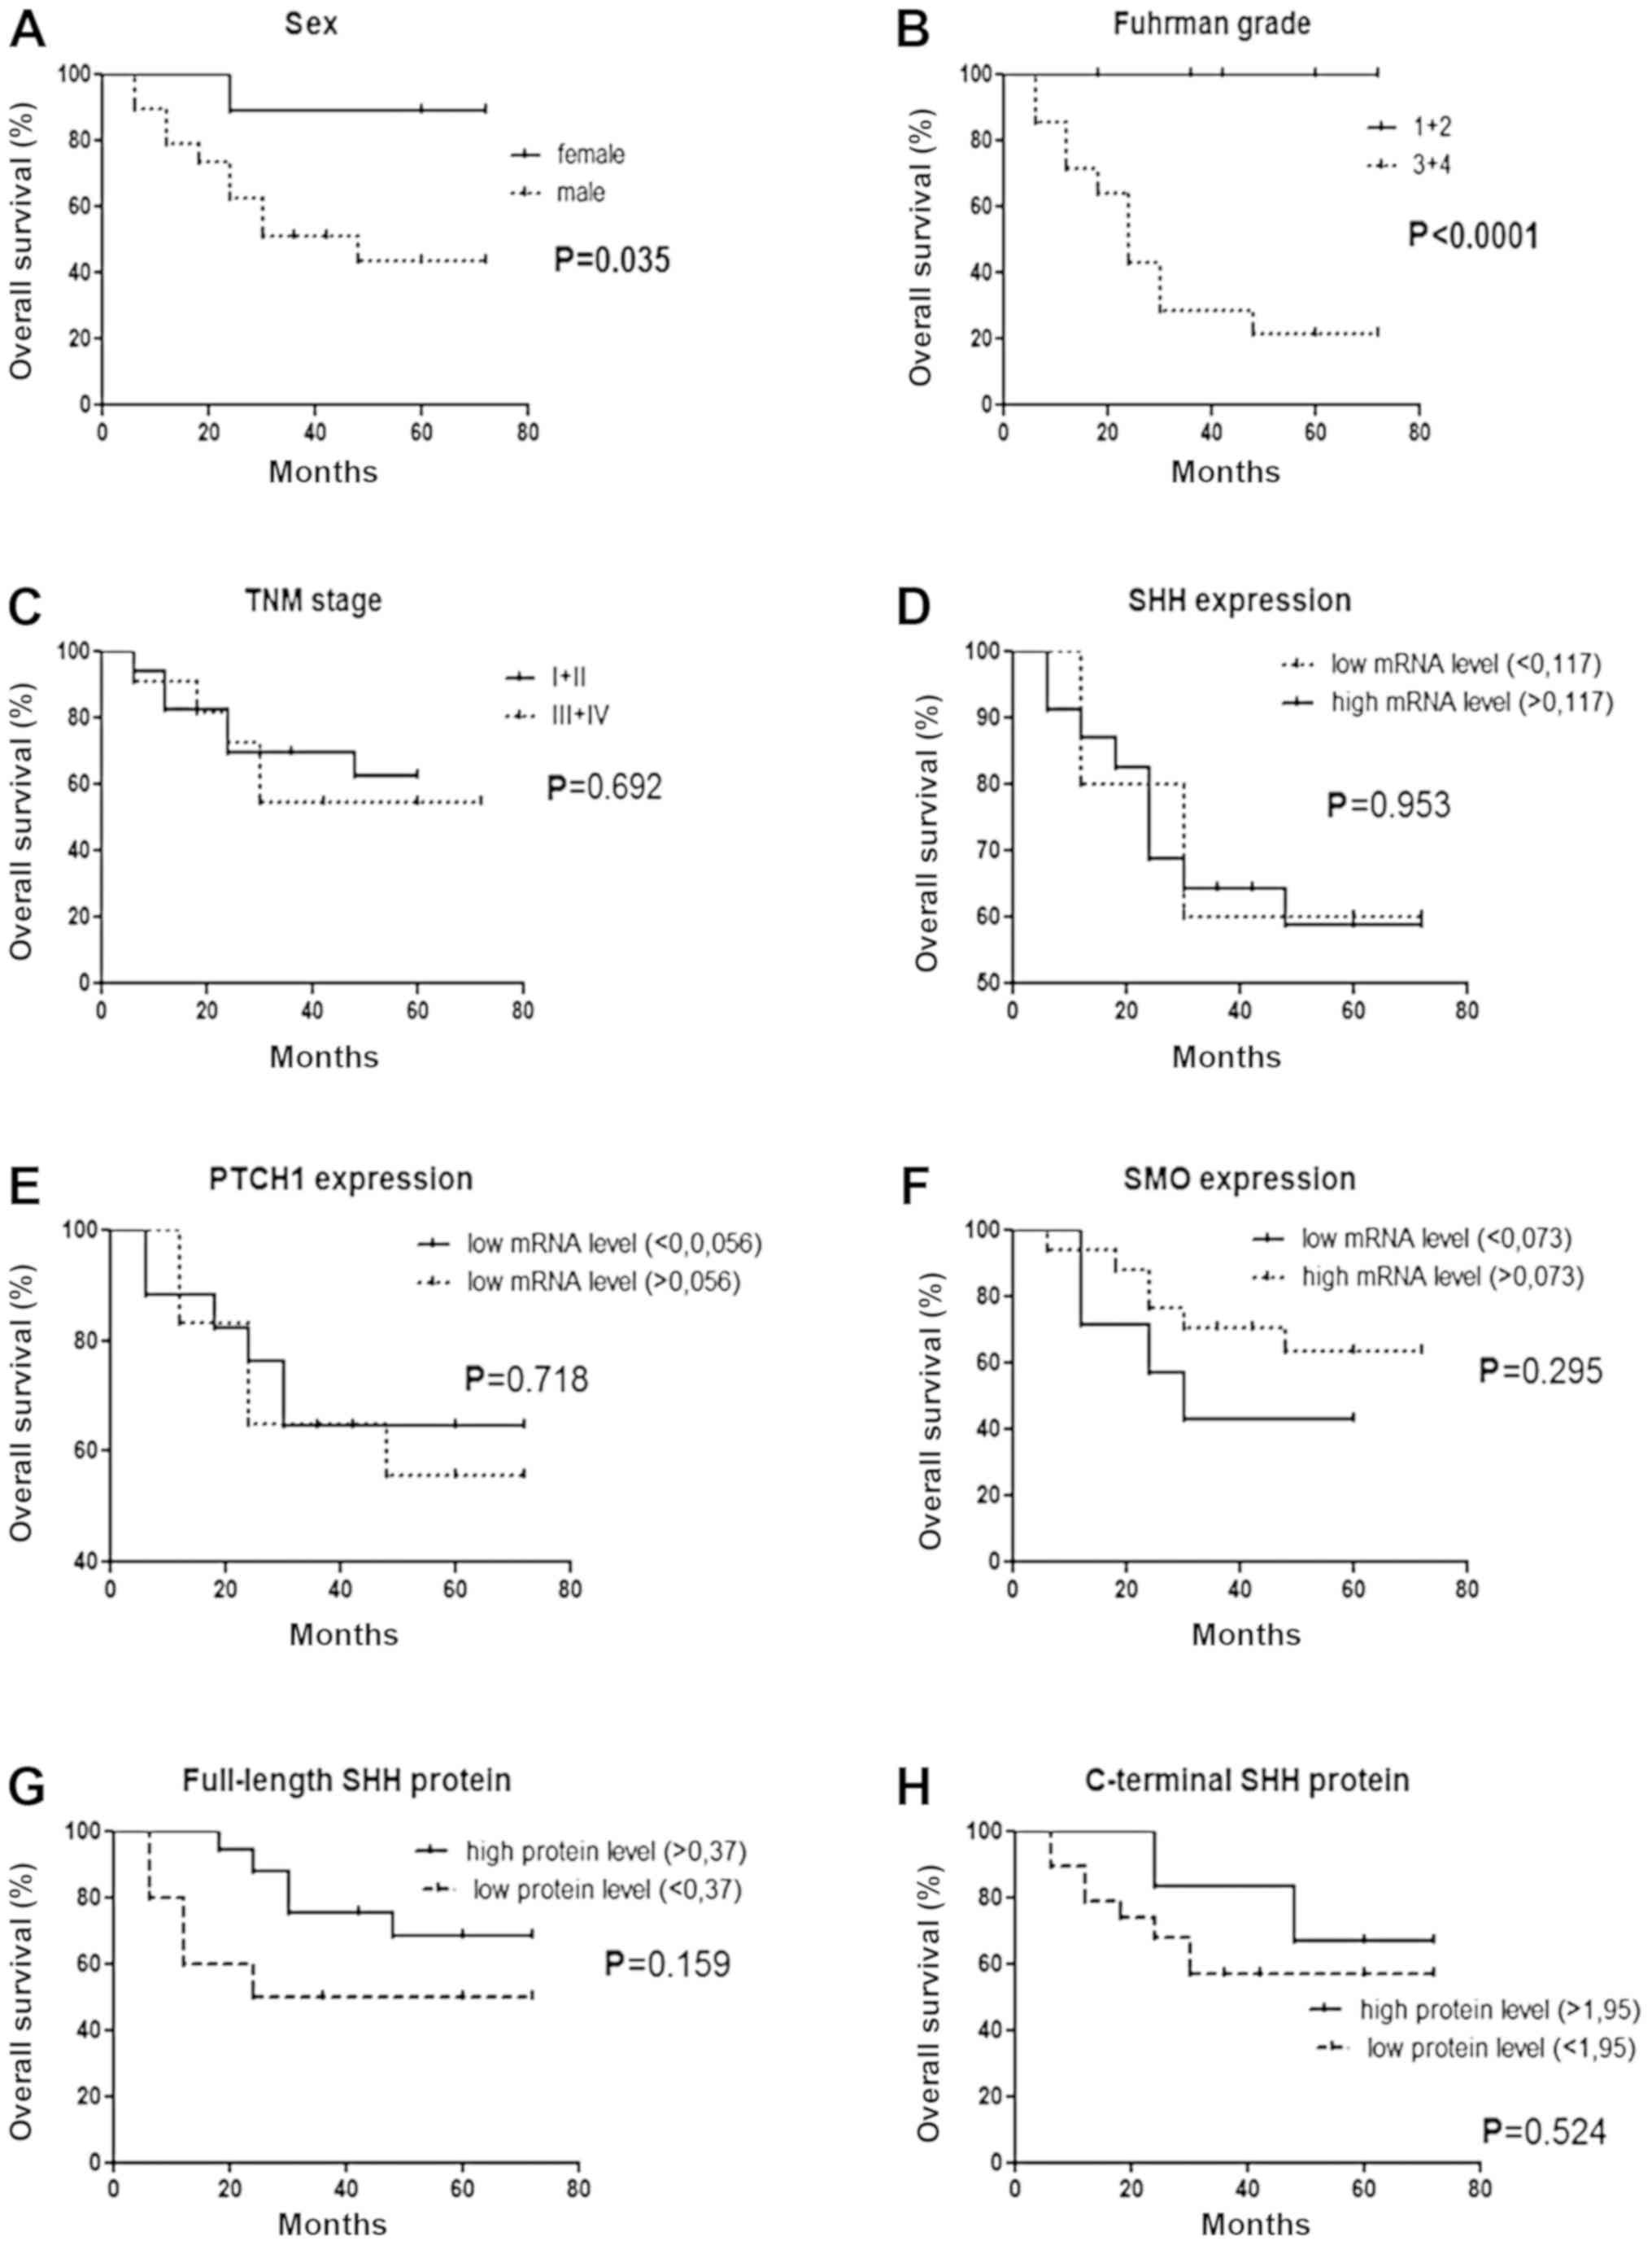 | Figure 6.Kaplan-Meier's survival analysis for
28 patients with ccRCC related to (A, B, C) clinicopathological and
(D, E, F, G, H) molecular data. The threshold value for each
analyzed gene based on the median of (D) SHH, (E)
PTCH1 and (F) SMO mRNA levels or (G) full-length and
(H) C-terminal SHH protein levels in control samples. ccRCC, clear
cell renal cell carcinoma; SHH, Sonic Hedgehog Signaling Molecule;
PTCH1, Patched 1 Receptor; SMO, Smoothened, Frizzled Class G
protein-coupled Receptor; GLI1, glioma-associated oncogene 1. |
Discussion
It has been suggested that the processes of
tumorigenesis and embryogenesis display some similar biological
features such as increased cell proliferation, differentiation, and
migration (22). Indeed, increased
activity of the SHH signaling, which is normally limited to the
embryonic development, was also observed in basal cell carcinoma
(11), breast (12), colon (13) and gastric (14) cancers. However, the contribution of
the SHH pathway to ccRCC development remains unclear.
Thirty-seven ccRCC patients were enrolled in the
present study. Although the number of participants is relatively
small their clinical-pathological data corresponds with
characteristic features of ccRCC reported for larger ccRCC cohorts,
e.g. mean age of ccRCC manifestation at 61 (19) with our median age of 62 years old.
Most of our patients were males, however the M/F ratio (1.83) is
comparable M/F ratio (1.56) in the USA in 2011 (23).
To the best of our knowledge, the present study
seems to be the first to report increased SHH gene
expression in ccRCC at the mRNA and protein level. Zhou et
al, which evaluated the expression of the main SHH pathway
components in 58 cases of ccRCC, indicated the lower level of
SHH mRNA in cancer samples compared to normal kidney tissues
(16). Possible explanation
concerning the discrepancy between Zhou et al and our
results may be associated with differences in research methodology,
such as different reference gene used in the analysis of the qPCR
results. Interestingly, the overexpression of the SHH gene
at the mRNA level was observed in non-small cell lung cancer
compared to matched normal lung samples derived from 83 patients
(24). Moreover, a higher level of
SHH mRNA was observed in lung tumors assessed as TNM-2 than
TNM-1 and cases in which pleural invasion was presented (24). These findings suggest that SHH
mRNA level may act as a potential prognostic factor in lung
cancer.
To complete our observation of increased SHH
mRNA level in ccRCC, we performed the measurement of full-length
and C-terminal SHH protein contents by the western blot method. Our
analysis revealed a considerable increase of the full-length SHH
protein level, which confirms the results of the qPCR analysis. We
also found a significant decrease of the C-terminal SHH domain in
ccRCC tissues, what is the novel observation in cancer tissues.
Further experiments are required to find out what is the mechanism
of these changes. It has to be mentioned that our analysis did not
include the N-terminal SHH domain due to the lack of commercially
available highly specific antibodies.
The difference between the level of full-length SHH
protein in ccRCC and normal kidney tissue has not been observed so
far (9). However, there were some
changes at the SHH protein level in other cancer types. Bian et
al (25) examined 142 papillary
thyroid carcinoma samples by immunohistochemical (IHC) method. They
demonstrated a statistically higher immunoreactivity of full-length
SHH protein in most tumor tissue samples, compared to adjacent
non-cancerous thyroid samples as well as the association between
SHH protein level and tumor size, clinical staging, and lymph node
metastasis (25). Furthermore,
aberrant SHH gene expression was indicated not only in
cancers derived from epithelial cells but also other types of
malignancies such as retinoblastoma. IHC staining of 79
retinoblastoma samples revealed that SHH protein was presented in
most cases of neoplastic tissues unlike normal retina samples and
high SHH immunoreactivity was correlated with advanced disease
status including local invasion and metastasis (26).
The Patched1 (PTCH1) receptor is a 12-pass
transmembrane protein, which inhibits Sonic Hedgehog signaling when
it is unliganded (27). In ccRCC
Zhou et al found a considerable decrease of PTCH1
mRNA level (16). Our study also
revealed the tendency towards a lower level of PTCH1
expression at the mRNA level, but the results are not statistically
significant.
The SHH pathway signaling transducer, Smoothened
protein (SMO), is the main target for several molecular antitumor
agents, which are tested in clinical trials (28). To date, two of them, vismodegib and
sonidegib, have been approved by the US Food and Drug
Administration (FDA) for treating locally advanced and metastatic
basal cell carcinoma (BCC) (29).
Our results revealed a statistically significant increase of the
SMO gene expression at the mRNA level in ccRCC samples,
compared to control tissues. The previous report about the
expression of SHH pathway genes in ccRCC tissues did not indicate
differences between SMO mRNA level in ccRCC tissues and
normal kidney sections (16).
However, Dormoy et al observed that cyclopamine, the
substance that acts as an SMO protein inhibitor, decreases ccRCC
cells proliferation and stimulates their apoptosis in vitro
as well as in vivo (15).
These findings suggest that, as in the BCC tumors, SMO may act as a
potential drug target for ccRCC.
Among other types of cancers, increased content of
SMO protein, assessed by the IHC method, was demonstrated by Ding
et al in colon cancer tissues, obtained from 96 patients.
Moreover, the level of SMO protein was positively related to the
presence of lymph node metastases and higher T stages, which
suggested the contribution of this gene in the colon cancer
progression (30).
Glioma-Associated Oncogene 1 (GLI1), together with
GLI2 and GLI3, are the members of zinc finger transcription factors
family (10). Our study indicated a
considerable increase of GLI1 mRNA level in cancer tissues,
what is consistent with previous reports regarding ccRCC tissues
(15,16). Moreover, Furukawa et al, which
assessed immunoreactivity of GLI1 and GLI2 proteins in ccRCC
tissues derived from 39 patients, observed that strong GLI2
expression, but not GLI1, was correlated with a shorter period of
progression free survival (31). Our
results also did not indicate an association between GLI1
mRNA level and patients' survival (data not shown). Elevated GLI1
protein immunoreactivity, assessed by IHC staining of 204 tissue
samples, was also observed in breast cancer cells and additionally
it was correlated with unfavorable overall survival as well as
higher tumor stage (32).
Furthermore, increased GLI1 protein immunoreactivity was observed
in the other tumor types such as the bladder (33) or ovarian cancers (34).
Our statistical analysis revealed that the
expression rates of almost all the SHH pathway components in tumor
tissues at the mRNA levels were correlated with each other. These
findings suggest that SHH signaling is reactivated in ccRCC through
canonical way, dependent on the amount of its upstream regulator,
SHH protein (35) The same way of
SHH pathway activation has been observed also in breast cancer
(36) and non-small cell lung
carcinoma cell lines (37), however,
such suggestion needs confirmation based on in vitro studies
with the use of RCC cell lines.
The association between the expression of SHH
pathway components and cancer prognostic factors was reported in
pancreatic adenocarcinoma (38),
glioma (39) and other cancer types
(24–26,30,32).
Moreover, the expression profiles of SHH signaling genes in some
cancer types correlated with the patients' overall survival
(14,40). Our statistical analysis did not
reveal any relationships between SHH pathway genes mRNA level and
ccRCC prognostic factors, however, most of the cited studies based
on different techniques (IHC) and semi-quantification of SHH
signaling proteins. Due to technical limitations, the IHC method
could not be applied to our study, since the selection and
antibodies and prior to IHC technique, western blot optimization
took too long. Therefore, we plan to perform immunohistochemical
studies in a larger cohort of ccRCC patients. There was also no
correlation between the level of SHH, PTCH1 and SMO
mRNA as well as SHH proteins and patients' overall survival. Thus,
according to our preliminary findings, observed changes in SHH
pathway genes expression in tumor tissues probably are not
associated with the ccRCC progression and patients' outcome.
In summary, increased expression of SHH, SMO,
Gli1 genes and full-length SHH protein level, as well as
decrease of C-terminal SHH protein level in tumor ccRCC tissues,
suggest the involvement of SHH signaling in ccRCC initiation.
Acknowledgements
Not applicable.
Funding
The current study was founded by ST-12 and
ST-02-0117/07 statutory funds of the Medical University of
Gdańsk.
Availability of data and materials
The datasets used and/or analyzed during the current
study are available from the corresponding author on reasonable
request.
Authors' contributions
AKC performed molecular analysis, performed the
statistical tests and prepared the manuscript. JK acquired tissue
samples and patient data and revised the manuscript. MM acquired
tissue samples and patients' data and revised the manuscript. ZK
substantially contributed to the interpretation of the results and
revised the manuscript. PMW designed and supervised the study and
revised the manuscript. All authors read and approved the final
manuscript.
Ethics approval and consent to
participate
The study received the approval of the Independent
Bioethics Commission at the Medical University of Gdańsk (decision
no. NKEBN/4/2011 and NKBBN/370/2016) and written consent was
obtained before the surgery from each patient. All experimental
procedures were performed according to the regulations and internal
biosafety and bioethics guidelines.
Patient consent for publication
Not applicable.
Competing interests
The authors declare that they have no competing
interests.
References
|
1
|
Hsieh JJ, Purdue MP, Signoretti S, Swanton
C, Albiges L, Schmidinger M, Heng DY, Larkin J and Ficarra V: Renal
cell carcinoma. Nat Rev Dis Primers. 3:170092017. View Article : Google Scholar : PubMed/NCBI
|
|
2
|
Lu J, Zhu L, Zheng LP, Cui Q, Zhu HH, Zhao
H, Shen ZJ, Dong HY, Chen SS, Wu WZ and Tan JM: Overexpression of
ULK1 represents a potential diagnostic marker for clear cell renal
carcinoma and the antitumor effects of SBI-0206965. EBioMedicine.
34:85–93. 2018. View Article : Google Scholar : PubMed/NCBI
|
|
3
|
Sanchez DJ and Simon MC: Genetic and
metabolic hallmarks of clear cell renal cell carcinoma. Biochim
Biophys Acta Rev Cancer. 1870:23–31. 2018. View Article : Google Scholar : PubMed/NCBI
|
|
4
|
Escudier B, Porta C, Schmidinger M,
Rioux-Leclercq N, Bex A, Khoo V, Grünwald V, Gillessen S and
Horwich A; ESMO Guidelines Committee, : Renal cell carcinoma: ESMO
clinical practice guidelines for diagnosis, treatment and
follow-up†. Ann Oncol. 30:706–720. 2019. View Article : Google Scholar : PubMed/NCBI
|
|
5
|
Gupta S, Takebe N and LoRusso P: Targeting
the hedgehog pathway in cancer. Ther Adv Med Oncol. 2:237–250.
2010. View Article : Google Scholar : PubMed/NCBI
|
|
6
|
Fattahi S, Pilehchian Langroudi M and
Akhavan-Niaki H: Hedgehog signaling pathway: Epigenetic regulation
and role in disease and cancer development. J Cell Physiol.
233:5726–5735. 2018. View Article : Google Scholar : PubMed/NCBI
|
|
7
|
Choudhry Z, Rikani AA, Choudhry AM, Tariq
S, Zakaria F, Asghar MW, Sarfraz MK, Haider K, Shafiq AA and
Mobassarah NJ: Sonic hedgehog signalling pathway: A complex
network. Ann Neurosci. 21:28–31. 2014. View Article : Google Scholar : PubMed/NCBI
|
|
8
|
Giroux Leprieur E, Tolani B, Li H, Leguay
F, Hoang NT, Acevedo LA, Jin JQ, Tseng HH, Yue D, Kim IJ, et al:
Membrane-bound full-length sonic hedgehog identifies cancer stem
cells in human non-small cell lung cancer. Oncotarget.
8:103744–103757. 2017.PubMed/NCBI
|
|
9
|
Skoda AM, Simovic D, Karin V, Kardum V,
Vranic S and Serman L: The role of the hedgehog signaling pathway
in cancer: A comprehensive review. Bosn J Basic Med Sci. 18:8–20.
2017. View Article : Google Scholar
|
|
10
|
Didiasova M, Schaefer L and Wygrecka M:
Targeting GLI transcription factors in cancer. Molecules.
23:E10032018. View Article : Google Scholar : PubMed/NCBI
|
|
11
|
Buetti-Dinh A, Jensen R and Friedman R: A
computational study of hedgehog signalling involved in basal cell
carcinoma reveals the potential and limitation of combination
therapy. BMC Cancer. 18:5692018. View Article : Google Scholar : PubMed/NCBI
|
|
12
|
Kubo M, Nakamura M, Tasaki A, Yamanaka N,
Nakashima H, Nomura M, Kuroki S and Katano M: Hedgehog signaling
pathway is a new therapeutic target for patients with breast
cancer. Cancer Res. 64:6071–6074. 2004. View Article : Google Scholar : PubMed/NCBI
|
|
13
|
Xu M, Li X, Liu T, Leng A and Zhang G:
Prognostic value of hedgehog signaling pathway in patients with
colon cancer. Med Oncol. 29:1010–1016. 2012. View Article : Google Scholar : PubMed/NCBI
|
|
14
|
Saze Z, Terashima M, Kogure M, Ohsuka F,
Suzuki H and Gotoh M: Activation of the sonic hedgehog pathway and
its prognostic impact in patients with gastric cancer. Dig Surg.
29:115–123. 2012. View Article : Google Scholar : PubMed/NCBI
|
|
15
|
Dormoy V, Danilin S, Lindner V, Thomas L,
Rothhut S, Coquard C, Helwig JJ, Jacqmin D, Lang H and Massfelder
T: The sonic hedgehog signaling pathway is reactivated in human
renal cell carcinoma and plays orchestral role in tumor growth. Mol
Cancer. 8:1232009. View Article : Google Scholar : PubMed/NCBI
|
|
16
|
Zhou J, Zhu G, Huang J, Li L, Du Y, Gao Y,
Wu D, Wang X, Hsieh JT, He D and Wu K: Non-canonical GLI1/2
activation by PI3K/AKT signaling in renal cell carcinoma: A novel
potential therapeutic target. Cancer Lett. 370:313–323. 2016.
View Article : Google Scholar : PubMed/NCBI
|
|
17
|
Behnsawy HM, Shigemura K, Meligy FY,
Yamamichi F, Yamashita M, Haung WC, Li X, Miyake H, Tanaka K,
Kawabata M, et al: Possible role of sonic hedgehog and
epithelial-mesenchymal transition in renal cell cancer progression.
Korean J Urol. 54:547–554. 2013. View Article : Google Scholar : PubMed/NCBI
|
|
18
|
Eble JN; Weltgesundheitsorganisation and
International Agency for Research on Cancer, : Pathology and
genetics of tumours of the urinary system and male genital organs:
Editorial and consensus conference in Lyon, FranceDecember
14-18–2002, IARC Press; Lyon: 2006
|
|
19
|
Cancer Genome Atlas Research Network, .
Comprehensive molecular characterization of clear cell renal cell
carcinoma. Nature. 499:43–49. 2013. View Article : Google Scholar : PubMed/NCBI
|
|
20
|
Wierzbicki PM, Klacz J, Rybarczyk A,
Slebioda T, Stanislawowski M, Wronska A, Kowalczyk A, Matuszewski M
and Kmiec Z: Identification of a suitable qPCR reference gene in
metastatic clear cell renal cell carcinoma. Tumor Biol.
35:12473–12487. 2014. View Article : Google Scholar
|
|
21
|
Livak KJ and Schmittgen TD: Analysis of
relative gene expression data using real-time quantitative PCR and
the 2(-Delta Delta C(T)) method. Methods. 25:402–408. 2001.
View Article : Google Scholar : PubMed/NCBI
|
|
22
|
Ma Y, Zhang P, Wang F, Yang J, Yang Z and
Qin H: The relationship between early embryo development and
tumourigenesis. J Cell Mol Med. 14:2697–2701. 2010. View Article : Google Scholar : PubMed/NCBI
|
|
23
|
Siegel R, Ward E, Brawley O and Jemal A:
Cancer statistics, 2011: The impact of eliminating socioeconomic
and racial disparities on premature cancer deaths. CA Cancer J
Clin. 61:212–236. 2011. View Article : Google Scholar : PubMed/NCBI
|
|
24
|
Jiang WG, Ye L, Ruge F, Sun PH, Sanders
AJ, Ji K, Lane J, Zhang L, Satherley L, Weeks HP, et al: Expression
of sonic hedgehog (SHH) in human lung cancer and the impact of
YangZheng XiaoJi on SHH-mediated biological function of lung cancer
cells and tumor growth. Anticancer Res. 35:1321–1331.
2015.PubMed/NCBI
|
|
25
|
Bian X, Sun H, Xue H, Zhang G, Zhang CH,
Liu XL, Su J and Li SJ: Expression and clinical significance of
Shh/Gli-1 in papillary thyroid carcinoma. Tumour Biol.
35:10523–10528. 2014. View Article : Google Scholar : PubMed/NCBI
|
|
26
|
Choe JY, Yun JY, Jeon YK, Kim SH, Choung
HK, Oh S, Park M and Kim JE: Sonic hedgehog signalling proteins are
frequently expressed in retinoblastoma and are associated with
aggressive clinicopathological features. J Clin Pathol. 68:6–11.
2015. View Article : Google Scholar : PubMed/NCBI
|
|
27
|
Qi X, Schmiege P, Coutavas E, Wang J and
Li X: Structures of human patched and its complex with native
palmitoylated sonic hedgehog. Nature. 560:128–132. 2018. View Article : Google Scholar : PubMed/NCBI
|
|
28
|
Lin T and Matsui W: Hedgehog pathway as a
drug target: Smoothened inhibitors in development. Onco Targets
Ther. 5:47–58. 2012. View Article : Google Scholar : PubMed/NCBI
|
|
29
|
Xin M, Ji X, De La Cruz LK, Thareja S and
Wang B: Strategies to target the Hedgehog signaling pathway for
cancer therapy. Med Res Rev. 38:870–913. 2018. View Article : Google Scholar : PubMed/NCBI
|
|
30
|
Ding YL, Wang QS, Zhao WM and Xiang L:
Expression of smoothened protein in colon cancer and its prognostic
value for postoperative liver metastasis. Asian Pac J Cancer Prev.
13:4001–4005. 2012. View Article : Google Scholar : PubMed/NCBI
|
|
31
|
Furukawa J, Miyake H and Fujisawa M: GLI2
expression levels in radical nephrectomy specimens as a predictor
of disease progression in patients with metastatic clear cell renal
cell carcinoma following treatment with sunitinib. Mol Clin Oncol.
5:186–192. 2016. View Article : Google Scholar : PubMed/NCBI
|
|
32
|
ten Haaf A, Bektas N, von Serenyi S, Losen
I, Arweiler EC, Hartmann A, Knüchel R and Dahl E: Expression of the
glioma-associated oncogene homolog (GLI) 1 in human breast cancer
is associated with unfavourable overall survival. BMC Cancer.
9:2982009. View Article : Google Scholar : PubMed/NCBI
|
|
33
|
He HC, Chen JH, Chen XB, Qin GQ, Cai C,
Liang YX, Han ZD, Dai QS, Chen YR, Zeng GH, et al: Expression of
hedgehog pathway components is associated with bladder cancer
progression and clinical outcome. Pathol Oncol Res. 18:349–355.
2012. View Article : Google Scholar : PubMed/NCBI
|
|
34
|
Ciucci A, De Stefano I, Vellone VG, Lisi
L, Bottoni C, Scambia G, Zannoni GF and Gallo D: Expression of the
glioma-associated oncogene homolog 1 (Gli1) in advanced serous
ovarian cancer is associated with unfavorable overall survival.
PLoS One. 8:e601452013. View Article : Google Scholar : PubMed/NCBI
|
|
35
|
Carballo GB, Honorato JR, de Lopes GPF and
Spohr TCLSE: A highlight on Sonic hedgehog pathway. Cell Commun
Signal. 16:112018. View Article : Google Scholar : PubMed/NCBI
|
|
36
|
Mukherjee S, Frolova N, Sadlonova A, Novak
Z, Steg A, Page GP, Welch DR, Lobo-Ruppert SM, Ruppert JM, Johnson
MR and Frost AR: Hedgehog signaling and response to cyclopamine
differ in epithelial and stromal cells in benign breast and breast
cancer. Cancer Biol Ther. 5:674–683. 2006. View Article : Google Scholar : PubMed/NCBI
|
|
37
|
Singh S, Wang Z, Liang Fei D, Black KE,
Goetz JA, Tokhunts R, Giambelli C, Rodriguez-Blanco J, Long J, Lee
E, et al: Hedgehog-producing cancer cells respond to and require
autocrine hedgehog activity. Cancer Res. 71:4454–4463. 2011.
View Article : Google Scholar : PubMed/NCBI
|
|
38
|
Maréchal R, Bachet JB, Calomme A, Demetter
P, Delpero JR, Svrcek M, Cros J, Bardier-Dupas A, Puleo F, Monges
G, et al: Sonic hedgehog and Gli1 expression predict outcome in
resected pancreatic adenocarcinoma. Clin Cancer Res. 21:1215–1224.
2015. View Article : Google Scholar : PubMed/NCBI
|
|
39
|
Li Q, Zhang Y, Zhan H, Yuan Z, Lu P, Zhan
L and Xu W: The Hedgehog signalling pathway and its prognostic
impact in human gliomas. ANZ J Surg. 81:440–445. 2011. View Article : Google Scholar : PubMed/NCBI
|
|
40
|
Cheng J, Gao J and Tao K: Prognostic role
of Gli1 expression in solid malignancies: A meta-analysis. Sci Rep.
6:221842016. View Article : Google Scholar : PubMed/NCBI
|