Introduction
Head and neck squamous cell carcinoma (HNSCC) is the
sixth most common type of human malignancy in United States
(1,2)
and represents ~4% of all new cancer cases in United States
(1,2). According to the latest statistics,
>700,000 patients are affected every year worlwide, there are
358,000 cases of HNSCC-associated mortality cases and the incidence
of HNSCC has significantly increased (3). Progress in clinical therapy technique
has not significantly improved the survival rates of patients with
HNSCC, and the 5-year survival rate of patients with HNSCC is only
40–50%. Investigating the underlying mechanism of HNSCC development
may offer novel strategies for its prevention, diagnosis and
treatment through the development of potential biomarkers or
therapeutic targets (4).
Long non-coding RNAs (lncRNAs) are defined as
transcripts of over 200 nucleotides in length that possess no
protein-coding function (5,6). The human genome encodes tens of
thousands of lncRNAs, which are associated with numerous
physiological processes, including the regulation of transcription,
translation, localization, and function of proteins (6). LncRNAs exert regulatory roles through
different mechanisms. They can affect chromatin remodeling and
methylation and be used as a functional sponge to competitively
inhibit micro (mi)RNA and regulate the stability of protein
complexes (7). It has been
demonstrated that the abnormal expression of lncRNAs is associated
with the occurrence of various types of human disease, including
cancer (8). Furthermore, lncRNA has
been reported to be involved in the regulation of HNSCC cell
proliferation, differentiation and metastasis and to be associated
with drug resistance (9,10). However, the role of lncRNA in the
development of HNSCC remains unclear. In particular, strong
molecular markers that could be used to predict HNSCC prognosis are
still missing.
The present study aimed therefore to identify
differentially expressed (DE)lncRNAs between HNSCC and normal
tissues via The Cancer Genome Atlas (TCGA) database. In addition,
further analysis of TCGA will be performed to explore the
prognostic value of these DElncRNAs. Eventually, the potential
function and molecular mechanism of these DElncRNAs will be
investigated through the lncRNA-miRNA-mRNA network.
Materials and methods
Data download and identification of
DElncRNAs
The RNA sequence data (RNAseq) of HNSCC tissues and
corresponding normal tissues were downloaded from TCGA database
(https://www.cancer.gov/tcga). A total of
544 samples from 500 patients with HNSCC and 44 normal controls
were collected in December 2018. The normal controls included
normal tissues from the oral cavity, oral tongue, larynx, floor of
the mouth and base of the tongue. The raw data were downloaded and
limma package (version 3.2.5; http://www.r-project.org/) was used to screen
DElncRNAs between HNSCC and normal tissues. A |logFC|>2 and
adjusted P-value <0.05 were set as the cut-off criteria.
Kaplan-Meier survival analysis
In order to determine whether the screened DElncRNAs
possessed prognostic value, Kaplan-Meier survival analysis and
log-rank test were performed by using Gene Expression Profiling
Interactive Analysis (GEPIA) database (http://gepia.cancer-pku.cn/) (11). In GEPIA, the ‘Methods’ and ‘Group
Cutoff’ were set as ‘overall survival’ and ‘Median’, respectively.
Regarding mRNAs, their prognostic value was also verified by
conducting log-rank analysis in UALCAN database (http://ualcan.path.uab.edu/analysis.html) (12).
Construction of lncRNA-miRNA-mRNA
regulatory network
The DIANA-LncBase v.2 (DIANA Tools) (13,14) was
used to predict the target miRNAs of DElncRNA, and a score >0.95
was set as the screening threshold. The miRWalk 3.0 database
(http://mirwalk.umm.uni-heidelberg.de/) was used to
predict and screen the target mRNAs of the aforementioned miRNAs
(15), and the filters were set as
‘0.95’, ‘3UTR’ and ‘miRTarBase’. The Cytoscape software (version,
3.6.0; http://cytoscape.org/) (16) was used to visualize all the predicted
results.
Gene Ontology (GO) and Kyoto
Encyclopedia of Genes and Genomes (KEGG) pathway enrichment
analysis of target mRNAs
GO analysis (http://geneontology.org/) and KEGG pathway (https://www.genome.jp/) enrichment of differentially
expressed genes (DEGs) were performed by using the Database for
Annotation, Visualization, and Integrated Discovery (DAVID; version
6.7; http://david-d.ncifcrf.gov/) to screen
the potential biological processes and signaling pathways in which
the mRNAs are involved (17). The
resulting data were imported into Cytoscape software to conduct
visual analysis. P<0.05 was considered to indicate a
statistically significant difference.
Protein-protein interaction (PPI)
network construction and hub genes identification
PPI networks were built by using the Search Tool for
the Retrieval of Interacting Genes (STRING) software (version 11.0;
http://string-db.org). The PPI network was
visualized using Cytoscape software (18). By considering the node degree,
Cytoscape CentiScaPe app (version, 3.6.0; http://apps.cytoscape.org/apps/centiscape) was used to
screen hub genes in the network (19). Genes with a node degree >5 were
considered to be candidate key genes.
Gene expression analysis
GEPIA was used to analyze the expression of
DElncRNAs and mRNAs in HNSCC and normal tissues. Furthermore, the
correlation between lncRNAs and mRNAs expression was analyzed using
Pearson correlation in GEPIA (11).
P<0.05 was considered to indicate a statistically significant
difference.
Results
Identification of DElncRNAs in HNSCC
tissues
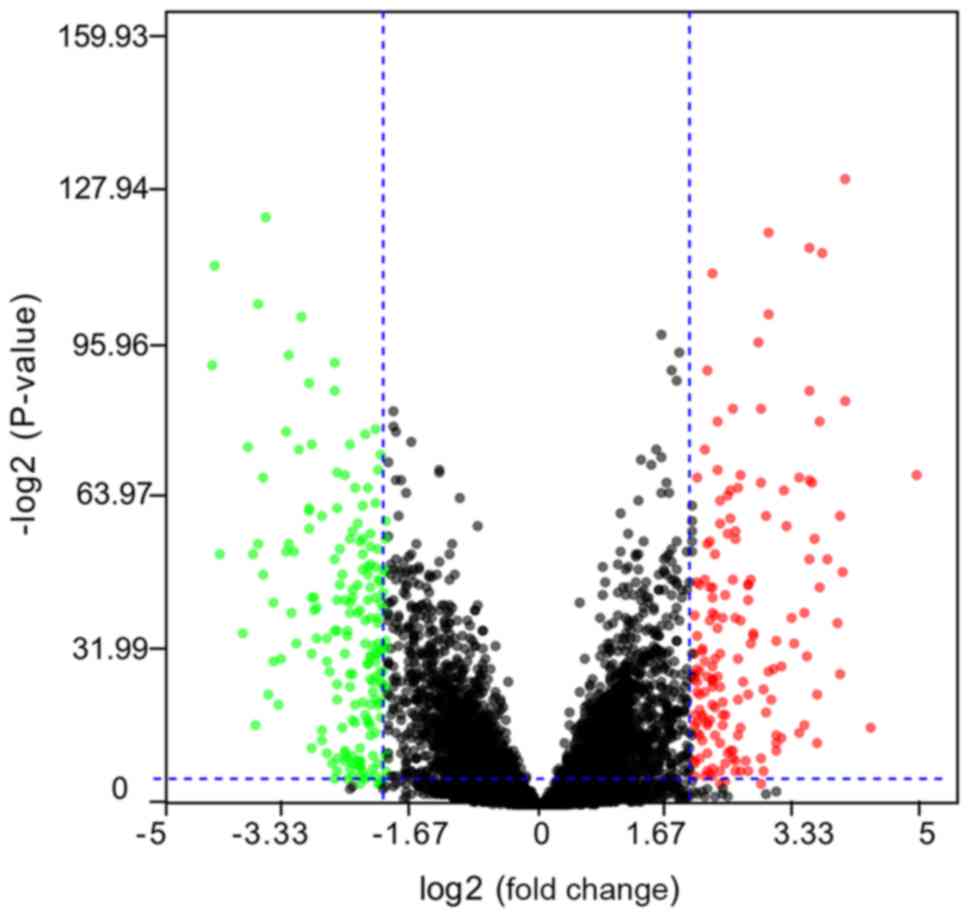
In the present study, RNAseq of HNSCC and
corresponding normal tissue samples were downloaded from TCGA
database. Following data screening, a total of 343 dysregulated
lncRNAs were obtained, including 162 upregulated and 181
downregulated lncRNAs (Fig. 1).
Prognostic values of DElncRNAs
The association between the 343 DElncRNAs and the
overall survival (OS) rate of patients with HNSCC was analyzed
using GEPIA. The results demonstrated that the abnormal expression
of 46 DElncRNAs was associated with the OS rate of patients with
HNSCC (P<0.05). Furthermore, by applying more rigorous criteria
(P<0.01), only 12 DElncRNAs were significantly associated with
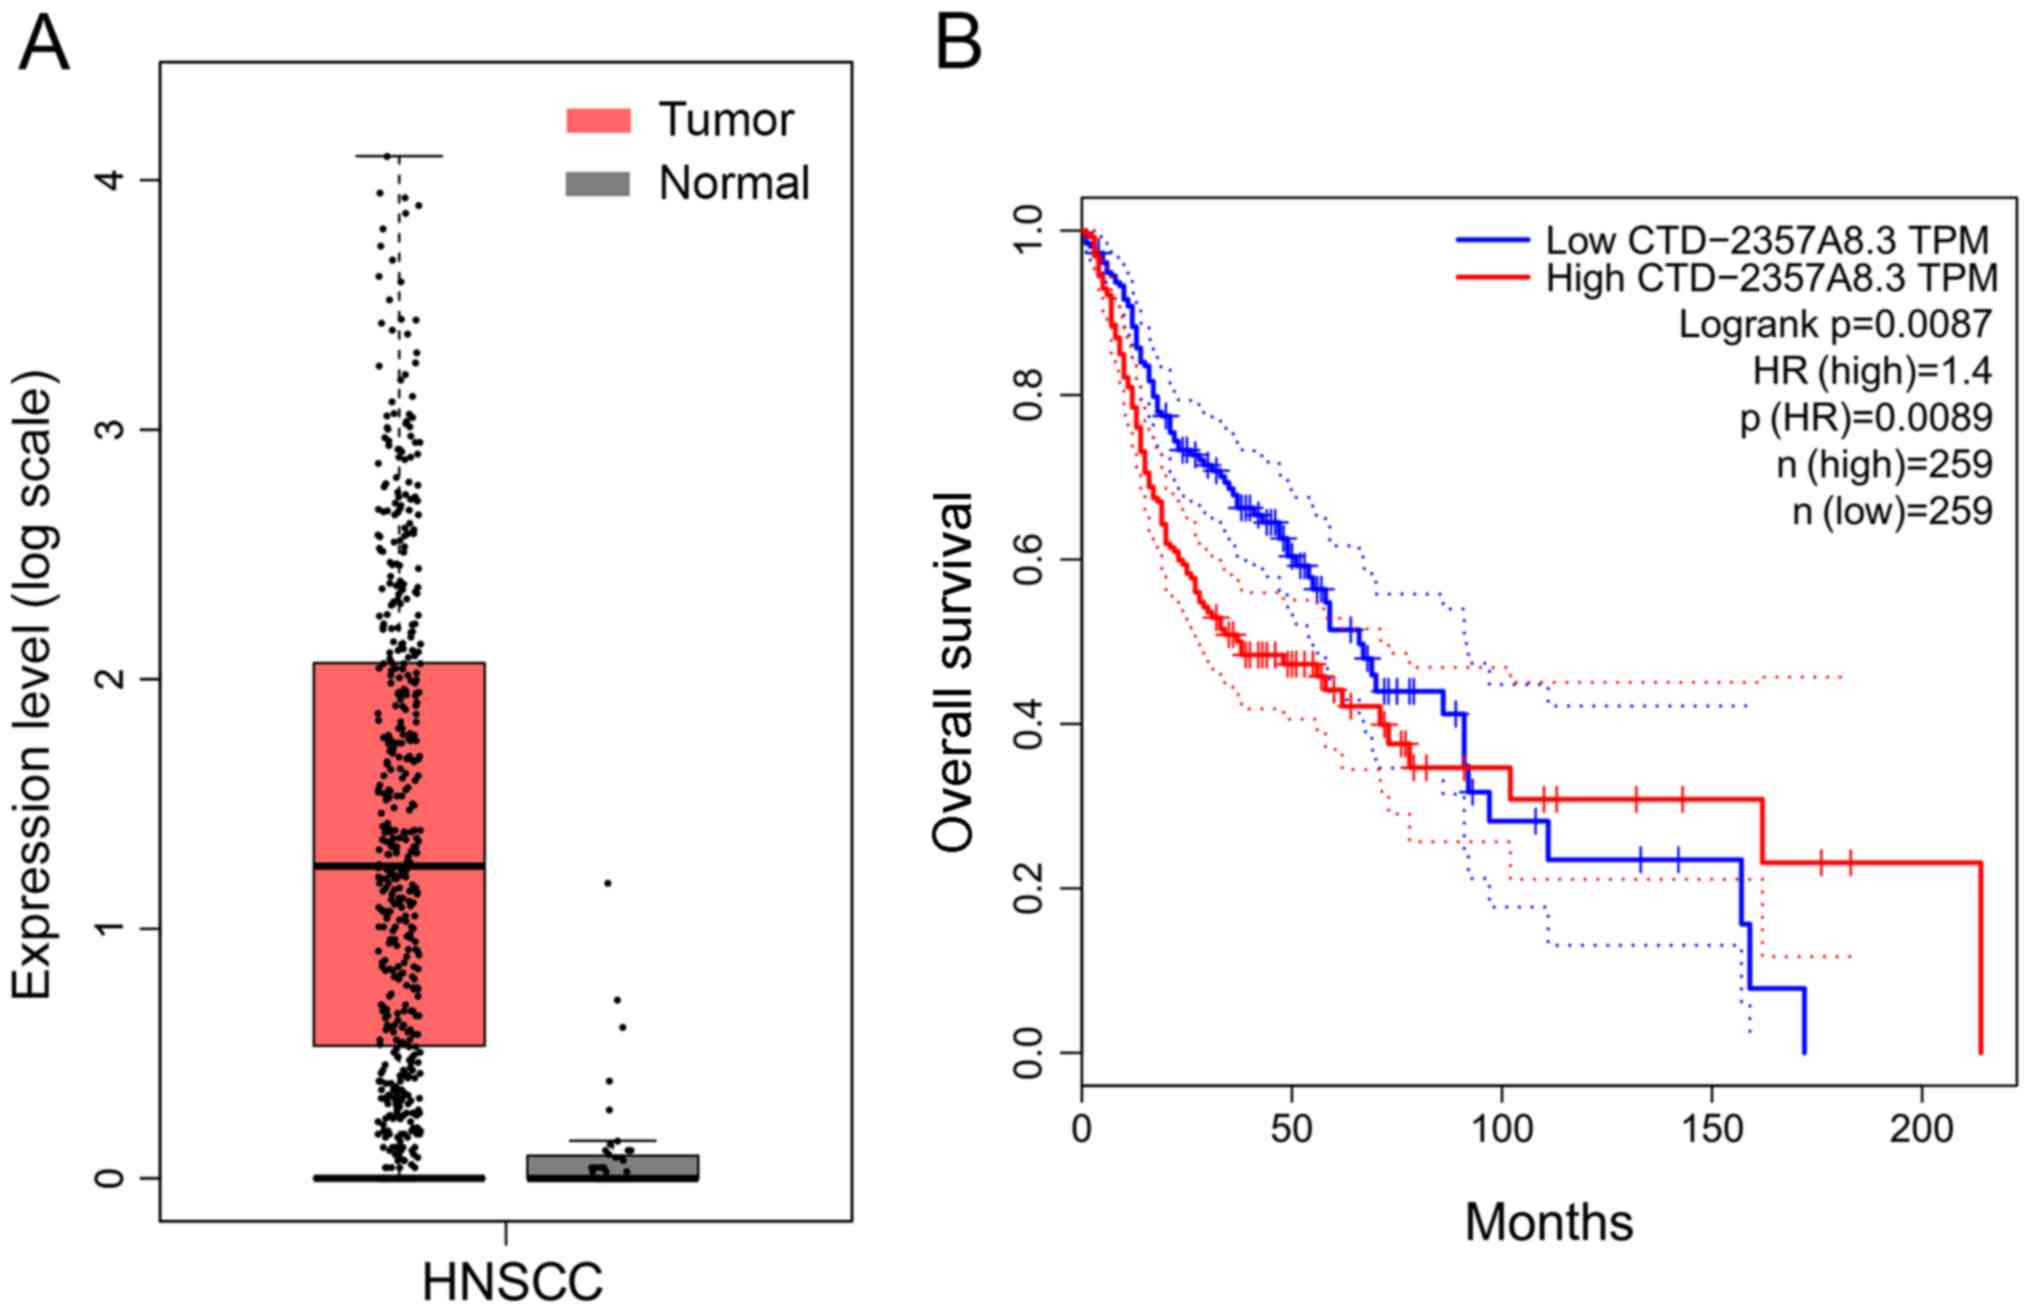
the OS rate of patients with HNSCC (Table I). CTD-2357A8.3, which was an lncRNA
with the largest upregulation multiple, was selected for further
analysis. GEPIA analysis demonstrated that CTD-2357A8.3 expression
in HNSCC tissues was significantly increased compared to adjacent
normal tissues, and was associated with OS rate of patients with
HNSCC (Fig. 2).
 | Table I.Information of 12 frequently
dysregulated long non-coding RNAs in head and neck squamous cell
carcinoma identified by The Cancer Genome Atlas. |
Table I.
Information of 12 frequently
dysregulated long non-coding RNAs in head and neck squamous cell
carcinoma identified by The Cancer Genome Atlas.
| Ensembl ID | Gene symbol | Fold change | P-value | Up or down
regulation | Log-rank P-value |
|---|
| ENSG00000267123 | CTD-2357A8.3 | 3.96 |
3.43×10⁻²⁶ | Upregulated | 0.0087 |
| ENSG00000250874 | CTC-480C2.1 | 3.62 |
1.25×10⁻⁴ | Upregulated | 0.001 |
| ENSG00000275216 | RP11-54H7.4 | 3.46 |
8.75×10⁻¹³ | Upregulated | 0.0023 |
| ENSG00000233532 | LINC00460 | 3.31 |
6.37×10⁻¹¹ | Upregulated | 0.0019 |
| ENSG00000231131 | LNCAROD | 2.98 |
3.56×10−09 | Upregulated | 0.0061 |
| ENSG00000277268 | LHX1-DT | 2.96 |
1.18×10−06 | Upregulated | 0.0028 |
| ENSG00000259692 | RP11-499F3.2 | 2.36 |
2.63×10⁻¹⁰ | Upregulated | 0.0029 |
|
ENSG00000251185 | RP11-542G1.1 | 2.03 |
8.57×10−08 | Upregulated | 0.0063 |
|
ENSG00000215386 | MIR99AHG | −2.09 |
1.57×10⁻¹³ | Downregulated | 0.00065 |
|
ENSG00000176728 | TTTY14 | −2.48 |
6.02×10−09 | Downregulated | 0.0037 |
|
ENSG00000267709 | AC024592.9 | −2.60 |
7.76×10⁻¹⁷ | Downregulated | 0.0068 |
|
ENSG00000228789 | HCG22 | −4.29 |
1.99×10⁻²⁸ | Downregulated | 0.00065 |
LncRNA-miRNA-mRNA regulatory
network
One of the important regulatory mechanisms of lncRNA
is its competitive adsorption of miRNA as a ‘sponge’, which can be
used to regulate the expression of target genes. The LncBase v.2
from DIANA Tools was used to predict the target miRNAs of
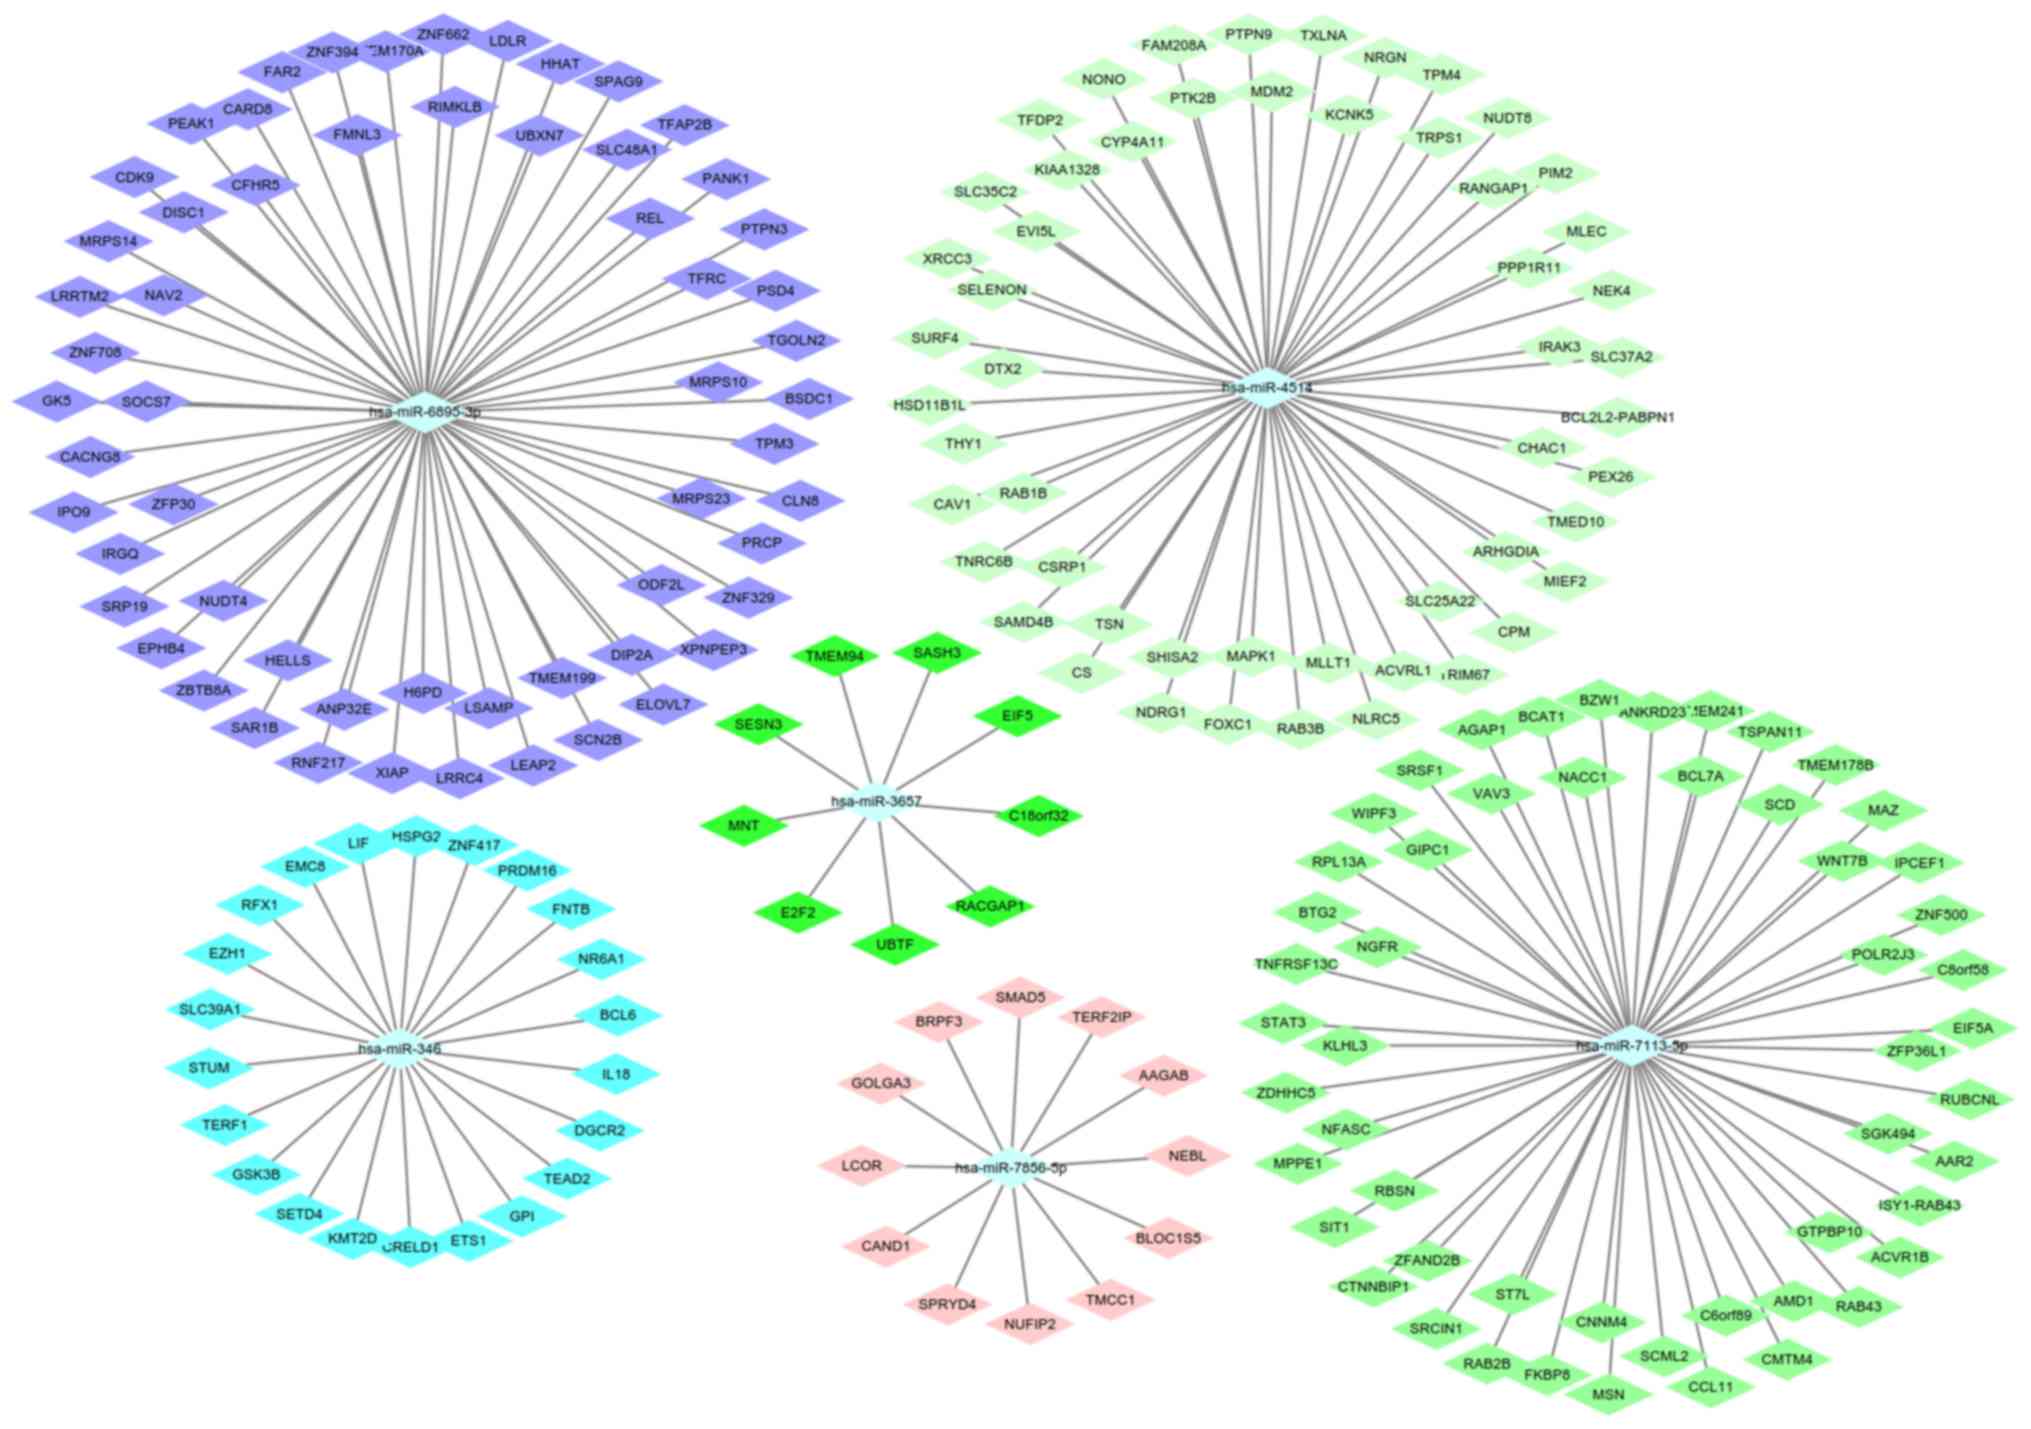
DElncRNAs. For CTD-2357A8.3, hsa-miR-7113-5p, hsa-miR-6895-3p,
hsa-miR-3657, hsa-miR-7856-5p, hsa-miR-346, hsa-miR-3119 and
hsa-miR-4514 were identified as candidate target miRNAs (Table II). In addition, miRWalk 3.0 was
used to predict and screen the target mRNAs of these miRNAs. These
mRNAs were eventually validated by using miRTarBase. A total of 213
mRNAs were identified as the target genes of the aforementioned
miRNAs and were visualized by using Cytoscape (Fig. 3).
| Table II.miRNAs targeting CTD-2357A8.3
predicted by LncBase Predicted v.2. |
Table II.
miRNAs targeting CTD-2357A8.3
predicted by LncBase Predicted v.2.
| miRNAs | MirBase ID | Score |
|---|
|
hsa-miR-7113-5p | MIMAT0028123 | 0.984 |
|
hsa-miR-6895-3p | MIMAT0027691 | 0.984 |
| hsa-miR-3657 | MIMAT0018077 | 0.965 |
|
hsa-miR-7856-5p | MIMAT0030431 | 0.964 |
| hsa-miR-346 | MIMAT0000773 | 0.96 |
| hsa-miR-3119 | MIMAT0014981 | 0.955 |
| hsa-miR-4514 | MIMAT0019051 | 0.955 |
GO analysis and KEGG pathway
enrichment of target genes
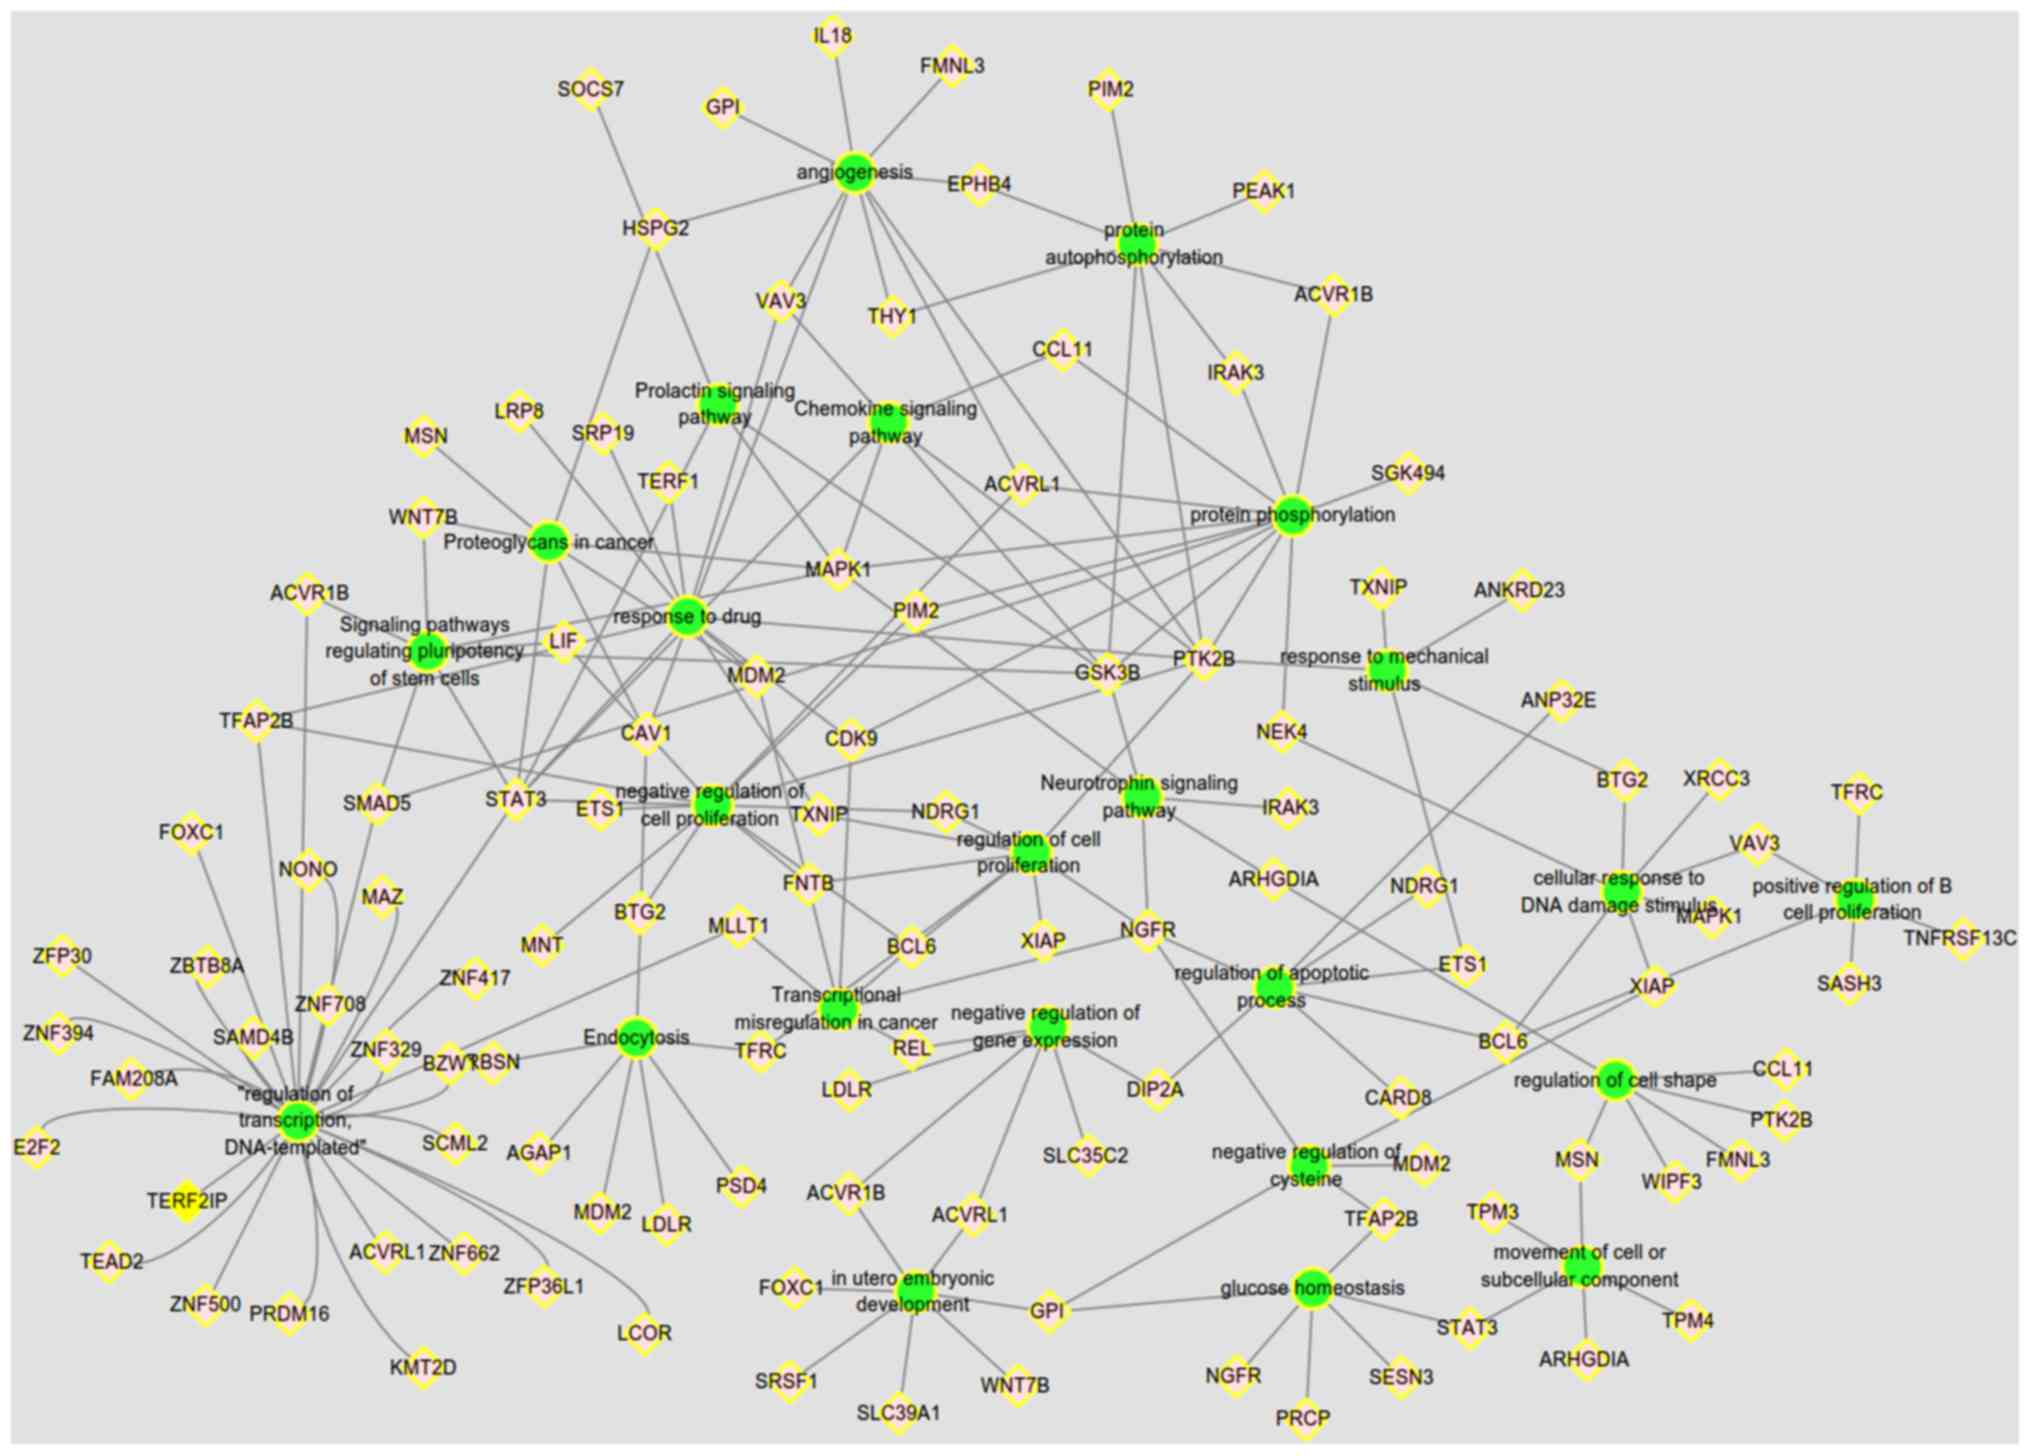
GO and KEGG pathway analysis of the 213 mRNAs were
performed using DAVID database. The criterion was P<0.05. As
presented in Fig. 4, the results
from KEGG pathway enrichment demonstrated that mRNAs were
associated with ‘signaling pathways regulating pluripotency of stem
cells’ (hsa04550, P=0.003), ‘proteoglycans in cancer’ (hsa05205,
P=0.02), ‘transcriptional misregulation in cancer’ (hsa05202,
P=0.033) and ‘chemokine signaling pathway’ (hsa04062, P=0.049). In
addition, the GO terms of biological functions were mainly
associated with ‘regulation of transcription’ (GO:0006355,
P=0.014), ‘negative regulation of cell proliferation’ (GO:0008285,
P=0.006) and ‘angiogenesis’ (GO:0001525, P=0.001).
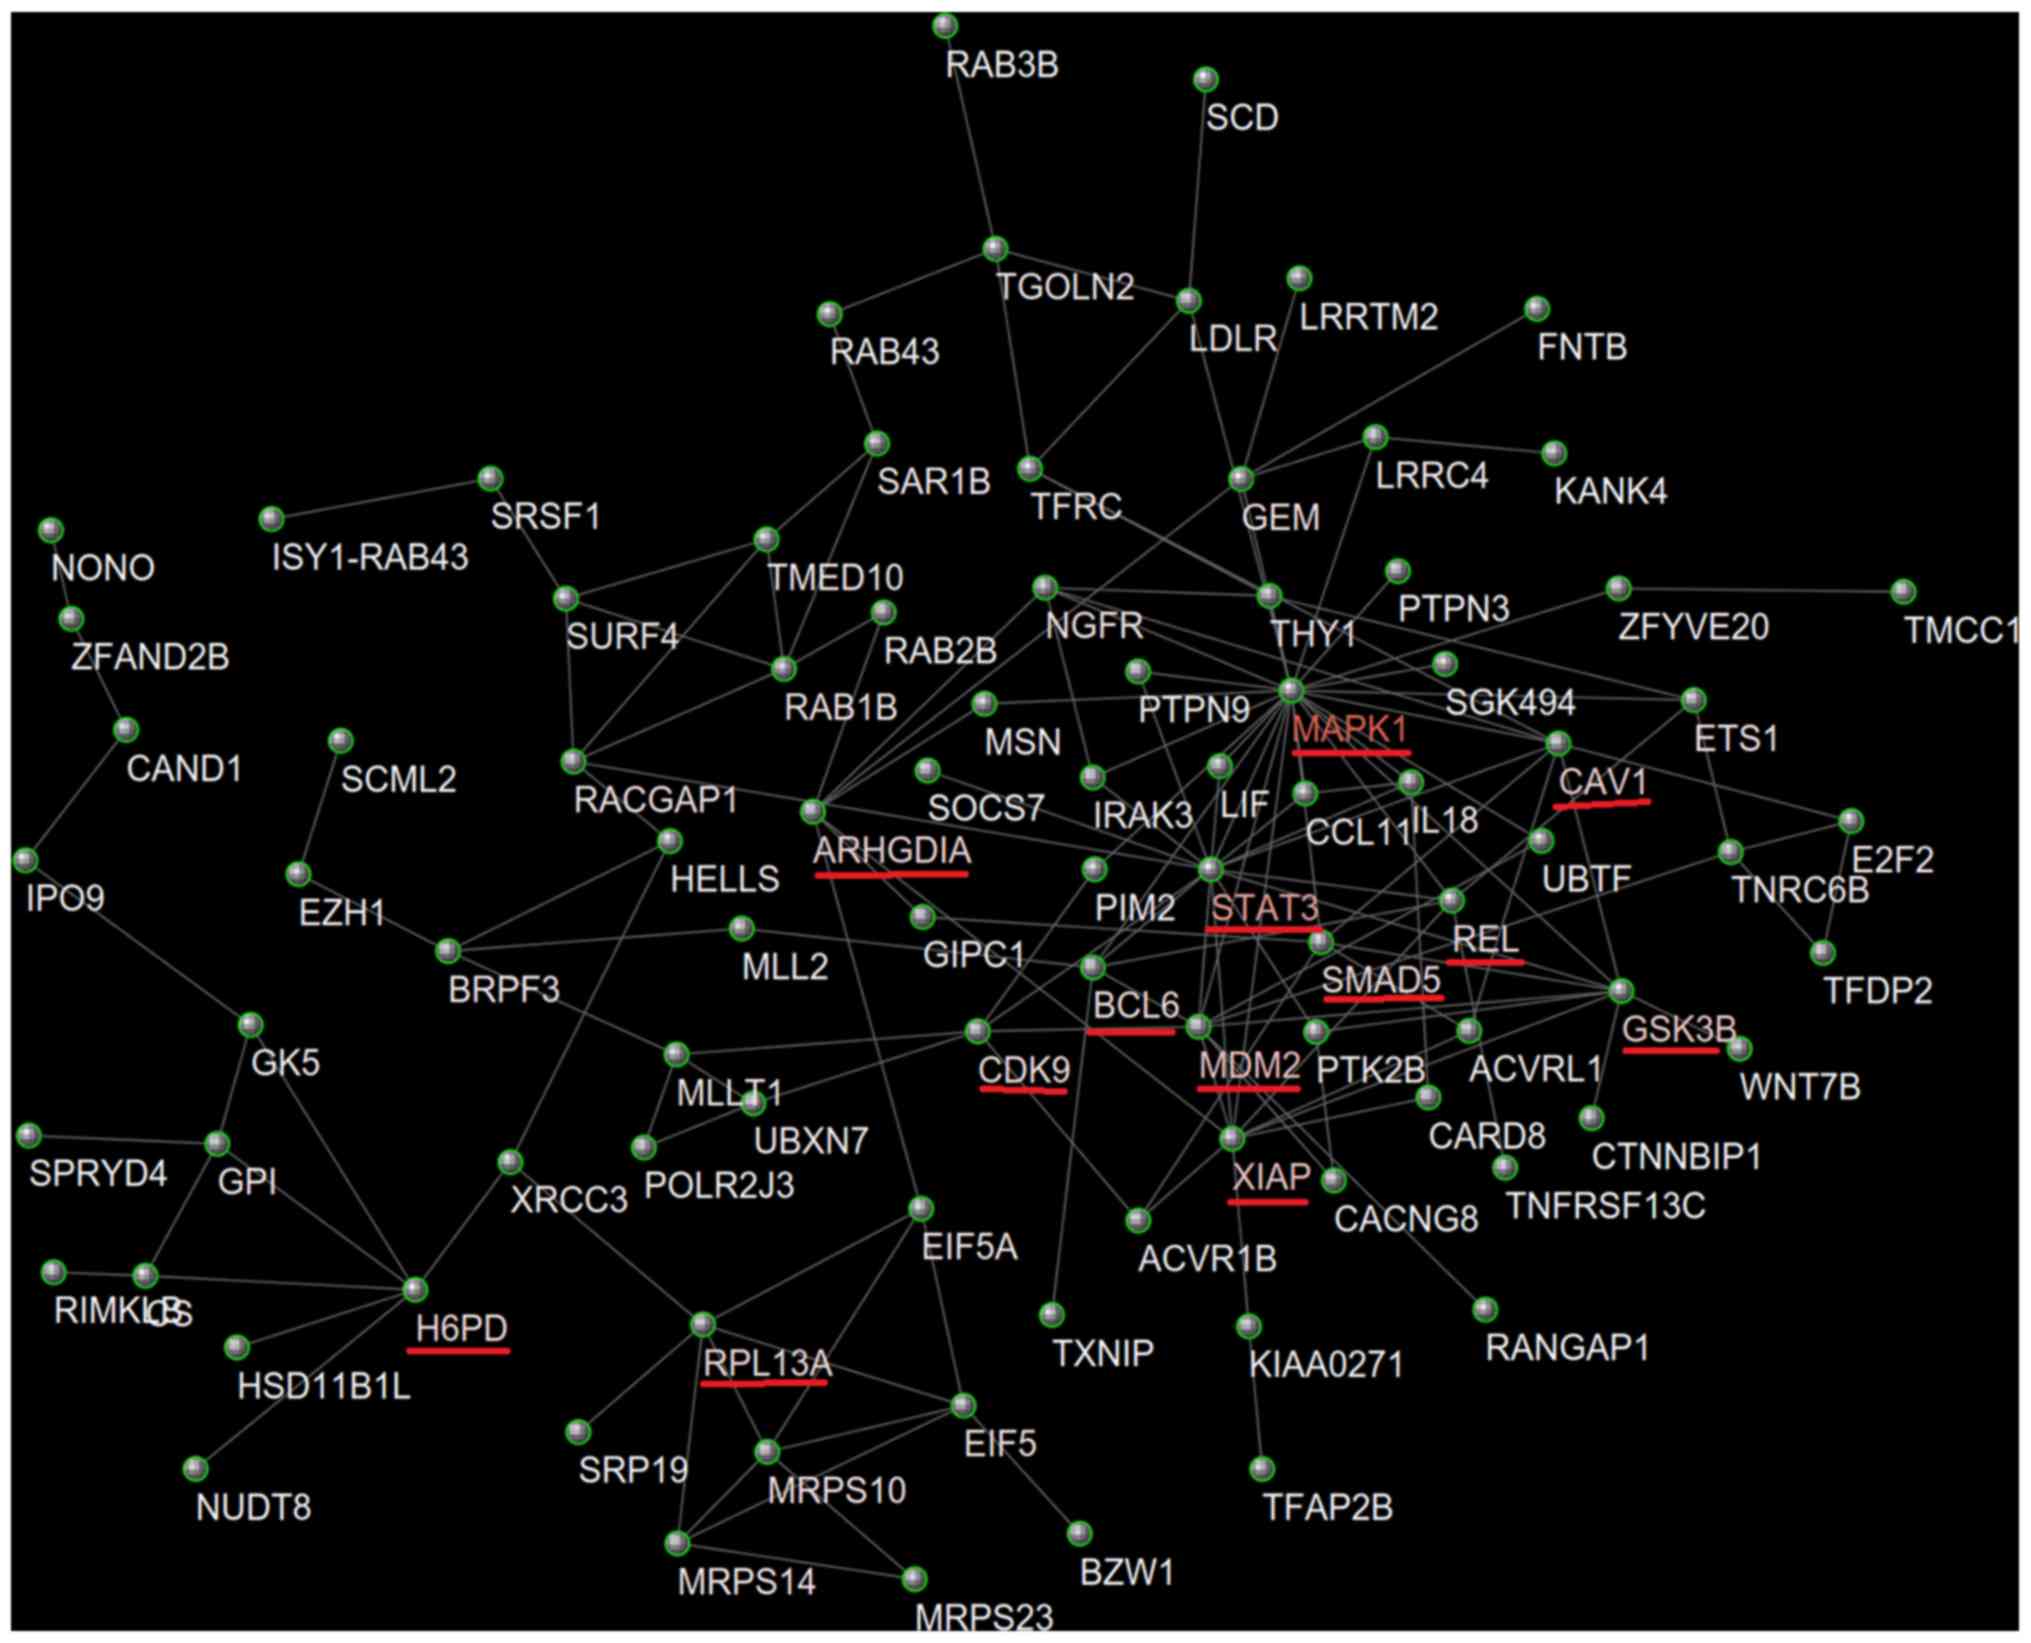
Caveolin 1 (CAV1) was identified as
the target gene of CTD-2357A8.3
The PPI network of the candidate target mRNAs was
constructed using STRING database and visualized by Cytoscape
software. In total, 110 mRNAs were entered into the PPI network
complex (Fig. 5). With node degree
>5 as inclusion criteria, the Cytoscape CentiScaPe was used to
screen candidate key genes in the network. A total of 13 genes met
the criteria and will be further investigated (Table III). Pearsons correlation between
CTD-2357A8.3 and these 13 genes was analyzed using GEPIA, and the
results demonstrated that the expression of glycogen synthase
kinase 3 β (GSK3B), CAV1, Rho GDP dissociation inhibitor α
(ARHGDIA) and cyclin dependent kinase 9 (CDK9) was positively
correlated with CTD-2357A8.3 (Table
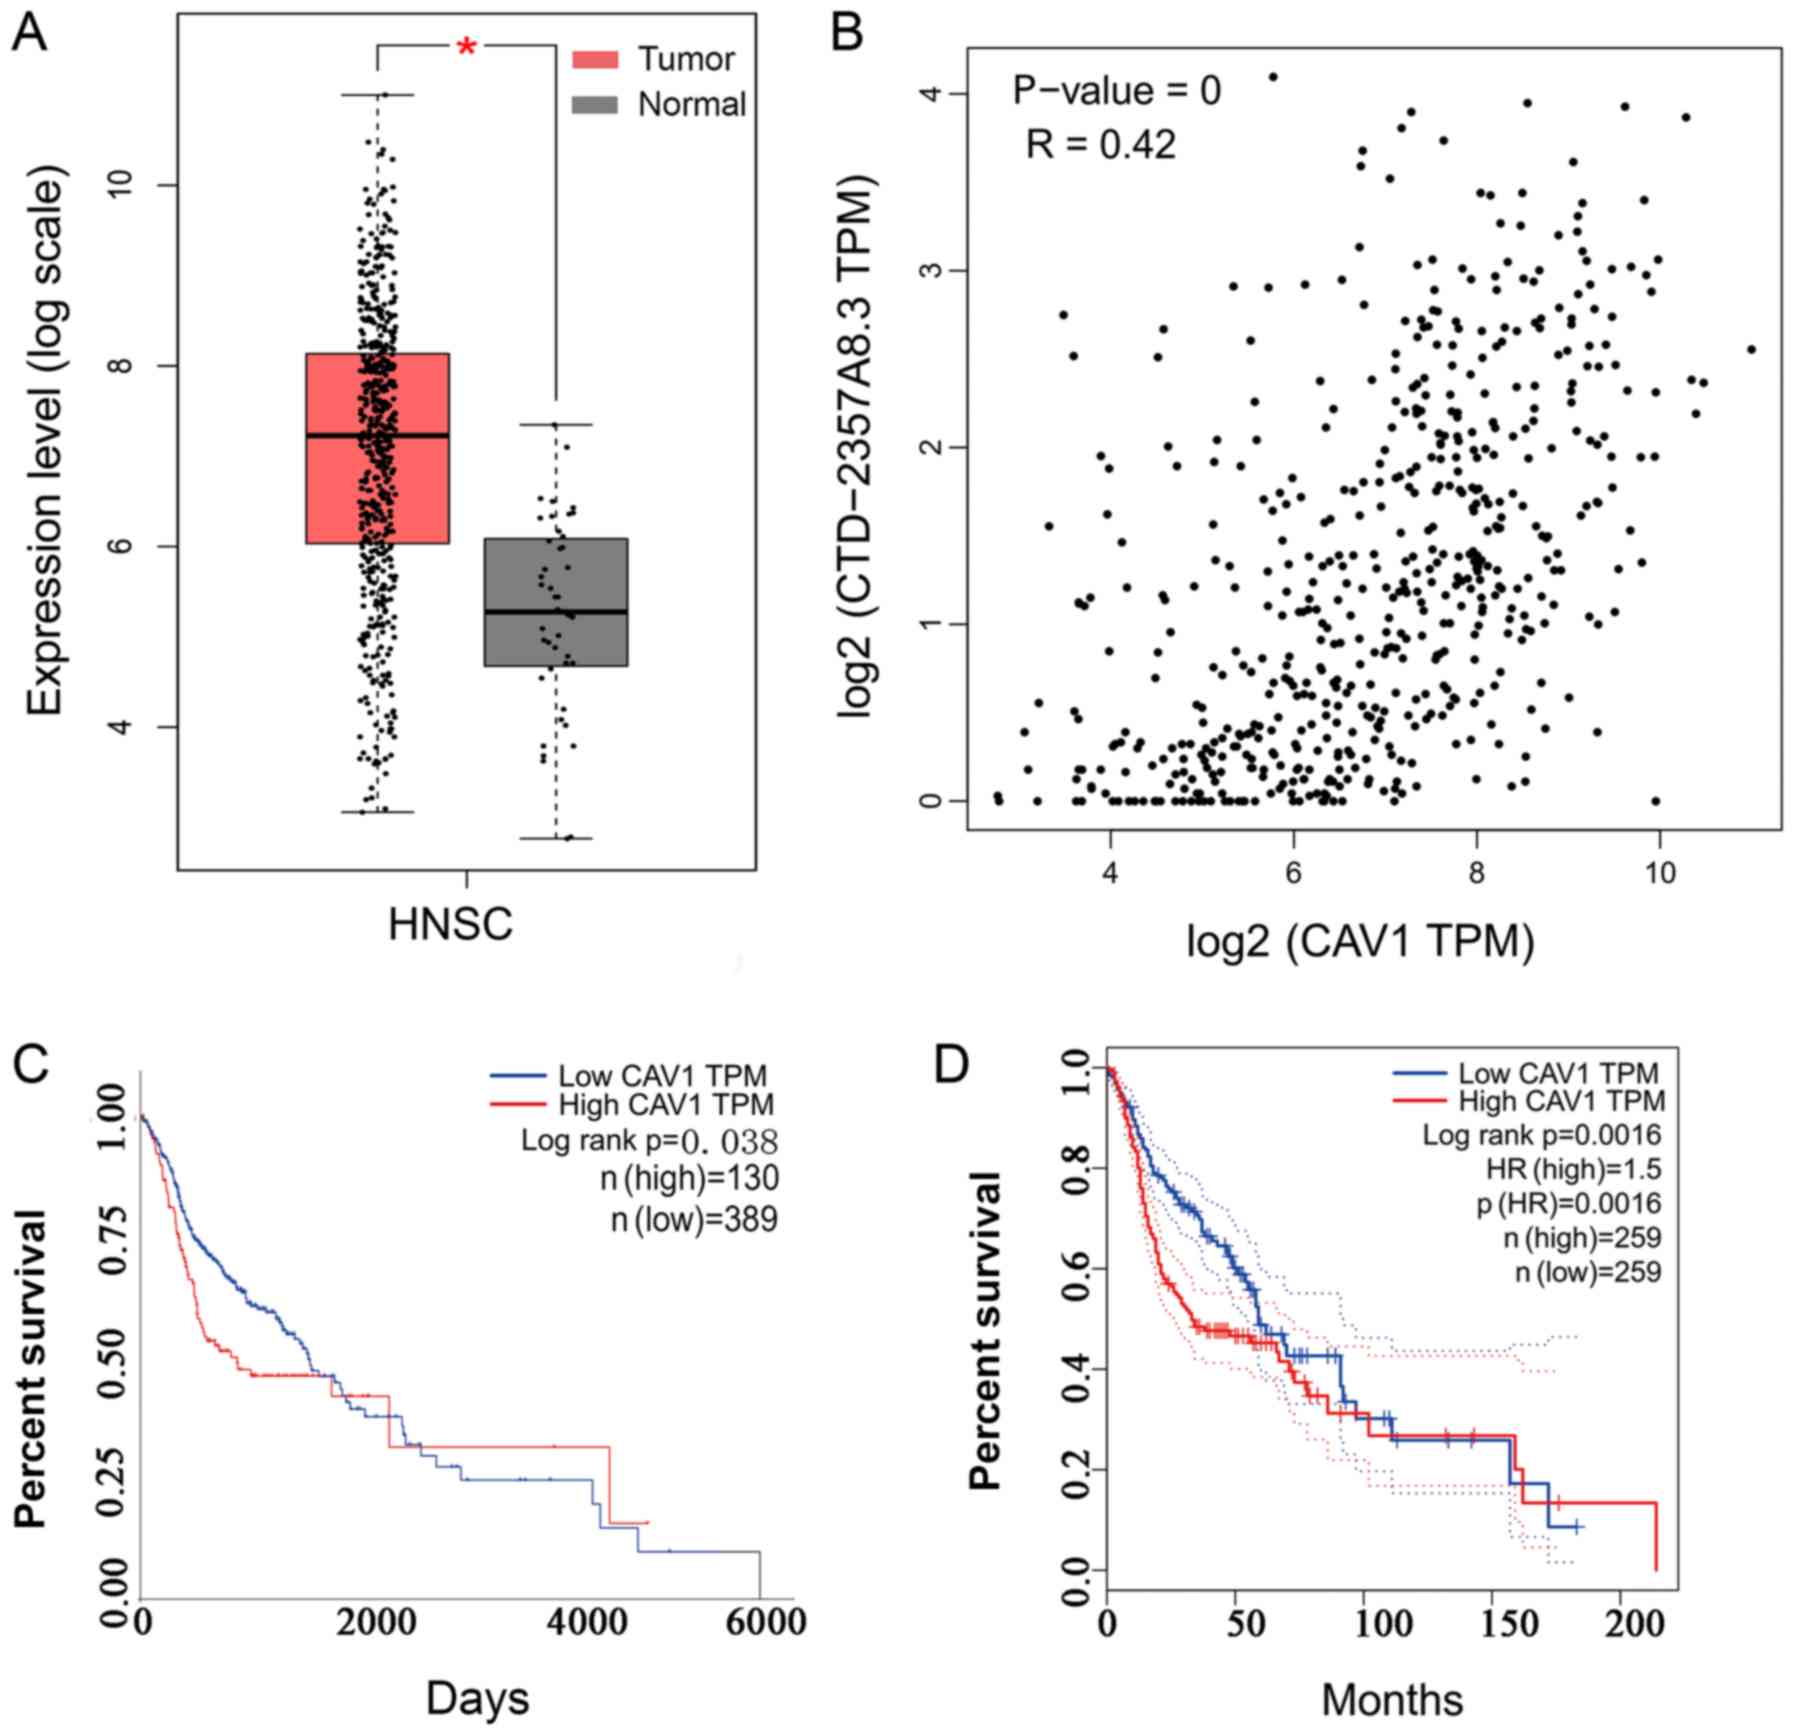
III and Fig. 6). In addition,
GEPIA and UALCAN were used to assess the association between these
hub genes and OS of patients with HNSCC. The results demonstrated
that only CAV1 was significantly associated with OS in the two
databases, and CAV1 expression in HNSCC tissues was significantly
higher than that in normal tissues (Table III and Fig. 6). Therefore, according to ‘ceRNA
Hypothesis’, messenger RNAs, transcribed pseudogenes and lncRNAs
can ‘talk’ to each other using microRNA response elements as
letters of a new language (20). So,
CAV1 may therefore be considered as a potential target of
CTD-2357A8.3 in patients with HNSCC.
| Table III.Pearson correlation analysis between
CTD-2357A8.3 and 12 hub genes expressions and the log-rank analysis
of these genes. |
Table III.
Pearson correlation analysis between
CTD-2357A8.3 and 12 hub genes expressions and the log-rank analysis
of these genes.
| mRNA | r (Pearson) | P-value
(Pearson) | Log-rank P-value
(GEPIA) | Log-rank P-value
(UALCAN) |
|---|
| MAPK1 | 0.029 | 0.49 | 0.54 | 0.8 |
| STAT3 | −0.13 | 0.002 | 0.1 | 0.12 |
| MDM2 | −0.11 | 0.0095 | 0.53 | 0.096 |
| XIAP | 0.075 | 0.076 | 0.53 | 0.66 |
| GSK3B | 0.14 | 0.0013 | 0.13 | 0.42 |
| CAV1 | 0.42 | 0 | 0.0016 | 0.038 |
| ARHGDIA | 0.37 | 0 | 0.0028 | 0.26 |
| H6PD | −0.021 | 0.61 | 0.44 | 0.038 |
| RPL13A | −0.12 | 5.2×10⁻³ | 0.9 | 0.2 |
| SMAD5 | −0.11 | 0.013 | 0.3 | 0.96 |
| CDK9 | 0.2 | 1.3×10-06 | 0.043 | 0.083 |
| BCL6 | −0.21 | 4.4×10-07 | 0.16 | 0.88 |
| REL | −0.015 | 0.73 | 0.45 | 0.18 |
Discussion
HNSCC is one of the most common types of human
malignancy. HNSCC is characterized by a rapid progression, high
migratory capacity and high mortality rate; however, almost no
biomarkers or targets exist for the diagnosis and therapy of HNSCC
(2). The determination of DEGs
between tumor and normal tissues may therefore help exploring the
pathogenesis of HNSCC and providing potential novel biomarkers or
targets for early diagnosis and therapy of HSNCC.
Recently, lncRNAs have attracted increasing
interest. In cancer, some lncRNAs have been demonstrated to
function as oncogenes, whereas others inhibit invasion and
metastasis by participating in various cellular processes,
including proliferation and differentiation (21). Some lncRNAs serve important role in
the development and progression of HNSCC, and it has been reported
that these lncRNAs could be used as novel biomarkers and monitoring
tools and as potential therapeutic targets in HNSCC treatment
(22). Exploring the lncRNA
differences between HNSCC and normal tissues could therefore
provide a better understanding of the mechanism involved in the
occurrence and development of HNSCC, and offer a basis for the
development of novel diagnostic markers and therapeutic targets of
HNSCC.
In the present study, the abnormally expressed
lncRNAs in HSNCC were explored using TCGA database, and 343
dysregulated lncRNAs were identified, of which 162 lncRNAs were
upregulated and 181 were downregulated. Following log-rank survival
analysis, 12 lncRNAs were found to be significantly associated with
the OS of patients with HNSCC. Among these lncRNAs, CTD-2357A8.3
had the largest |logFC| and was therefore further analyzed. The
results demonstrated that CTD-2357A8.3 expression in HNSCC tissues
was significantly increased compared to normal tissues and was
associated with the OS rate of patients with HNSCC. However,
following a detailed analysis of the literature, no relevant study
on the role of CTD-2357A8.3 in HNSCC was found so far.
Subsequently, it is really necessary and imperative to make further
in-depth study investigating the specific role of CTD-2357A8.3 in
HNSCC.
One of the important regulatory mechanisms of lncRNA
is its competitive adsorption of miRNA as a ‘sponge’. Subsequently,
lncRNA serves a crucial role in regulating the expression of target
genes. The candidate target miRNAs and mRNAs of CTD-2357A8.3 were
therefore predicted in the present study. The GO and KEGG pathway
analysis of the 213 target mRNAs reported that, ‘signaling pathways
regulating pluripotency of stem cells’, ‘proteoglycans in cancer’,
‘transcriptional misregulation in cancer’ and ‘chemokine signaling
pathway’ were the top significantly enriched gene sets and were all
associated with cancer.
According to the mechanism of lncRNA, the expression
of lncRNA and mRNA should be consistent. In the present study, the
hub genes were identified by integrating centrality analysis with
Pearson correlation and log-rank survival analysis. The results
demonstrated that GSK3B, CAV1, ARHGDIA and CDK9 expression was
positively correlated with CTD-2357A8.3. Furthermore, only CAV1 was
significantly associated with the OS of patients with HNSCC
according to GEPIA and UALCAN databases. These results suggested
that CAV1 may be considered as a potential target gene for
CTD-2357A8.3. CAV1 is a membrane-bound scaffold protein that can
modulate signal transduction; however, the role of CAV1 in cancer
is dependent on the tissue source (23). It has been reported that CAV1
inhibits cell migration and invasion by inhibiting epithelial
mesenchymal transformation in pancreatic cancer (24). Furthermore, CAV1 has been reported to
be highly expressed in colon cancer cells that have low metastatic
ability, but not in colon cancer cells with high metastatic
ability. These results suggest that CAV1 is involved in the
negative regulation of tumor cell metastatic ability (25). Furthermore, in clear cell renal cell
carcinoma and lung cancer, the increased expression of CAV1 was
demonstrated to promote cell proliferation and invasion, and was
positively correlated with poor prognosis (26,27).
Further investigation is therefore required to verify whether
CTD-2357A8.3 could regulate CAV1 expression through miRNA, and to
explore the functional roles of CTD-2357A8.3 in the tumorigenesis
of HNSCC. In addition, the present study used the GEPIA database to
analyze the association between CTD-2357A8.3, CAV1 and the OS in
HNSCC. This database contains RNA sequencing expression data of
HNSCC from different primary sites, including the tonsil,
oropharynx, oral cavity, larynx and hypopharynx. Further
investigation is therefore required to determine whether
CTD-2357A8.3 from different primary sites would remain positively
correlated with the OS of patients with HNSCC. In addition, it may
be also or even more important to consider the disease-free
survival in HNSCC analysis.
Acknowledgements
Not applicable.
Funding
This study was supported by the Medicine and Health
Science Technology Development Plan Project, Shandong Province
(grant no. 2017WSA15041), the National Natural Science Foundation
of China (grant nos. 81472530 and 81602374) and the Natural Science
Foundation of Shandong Province (grant no. 2016ZRA15065).
Availability of data and materials
All data generated or analyzed during the present
study are included in this published article.
Authors contributions
BoZ and XG downloaded the data, performed the
identification of DElncRNAs and PPI network construction and
drafted the manuscript. WZ and DW performed the survival analysis
and constructed the lncRNA-miRNA-mRNA regulatory network. KX
performed GO analysis and KEGG pathway enrichment analysis. DY was
involved in the PPI network construction. ZM analyzed the
association between the candidate genes and prognosis, and also
participated the design of the study. BiZ was the major contributor
in designing the present study. All authors read and approved the
final version of the manuscript.
Ethics approval and consent to
participate
Not applicable.
Patient consent for publication
Not applicable.
Competing interests
The authors declare that they have no competing
interests.
References
|
1
|
Siegel RL, Miller KD and Jemal A: Cancer
statistics, 2019. CA Cancer J Clin. 69:7–34. 2019. View Article : Google Scholar : PubMed/NCBI
|
|
2
|
Siegel RL, Miller KD and Jemal A: Cancer
statistics, 2018. CA Cancer J Clin. 68:7–30. 2018. View Article : Google Scholar : PubMed/NCBI
|
|
3
|
Bray F, Ferlay J, Soerjomataram I, Siegel
RL, Torre LA and Jemal A: Global cancer statistics 2018: GLOBOCAN
estimates of incidence and mortality worldwide for 36 cancers in
185 countries. CA Cancer J Clin. 68:394–424. 2018. View Article : Google Scholar : PubMed/NCBI
|
|
4
|
Goossens N, Nakagawa S, Sun X and Hoshida
Y: Cancer biomarker discovery and validation. Transl Cancer Res.
4:256–269. 2015.PubMed/NCBI
|
|
5
|
Iyer MK, Niknafs YS, Malik R, Singhal U,
Sahu A, Hosono Y, Barrette TR, Prensner JR, Evans JR, Zhao S, et
al: The landscape of long noncoding RNAs in the human
transcriptome. Nat Genet. 47:199–208. 2015. View Article : Google Scholar : PubMed/NCBI
|
|
6
|
Wilusz JE, Sunwoo H and Spector DL: Long
noncoding RNAs: Functional surprises from the RNA world. Genes Dev.
23:1494–1504. 2009. View Article : Google Scholar : PubMed/NCBI
|
|
7
|
Li T, Mo X, Fu L, Xiao B and Guo J:
Molecular mechanisms of long noncoding RNAs on gastric cancer.
Oncotarget. 7:8601–8612. 2016.PubMed/NCBI
|
|
8
|
Park S, Lee M, Chun CH and Jin EJ: The
lncRNA, nespas, is associated with osteoarthritis progression and
serves as a potential new prognostic biomarker. Cartilage.
10:148–156. 2019. View Article : Google Scholar : PubMed/NCBI
|
|
9
|
Wang R, Ma Z, Feng L, Yang Y, Tan C, Shi
Q, Lian M, He S, Ma H and Fang J: LncRNA MIR31HG targets HIF1A and
P21 to facilitate head and neck cancer cell proliferation and
tumorigenesis by promoting cell-cycle progression. Mol Cancer.
17:1622018. View Article : Google Scholar : PubMed/NCBI
|
|
10
|
Wang Y, Wu C, Zhang C, Li Z, Zhu T, Chen
J, Ren Y, Wang X, Zhang L and Zhou X: TGF-β-induced STAT3
overexpression promotes human head and neck squamous cell carcinoma
invasion and metastasis through malat1/miR-30a interactions. Cancer
Lett. 436:52–62. 2018. View Article : Google Scholar : PubMed/NCBI
|
|
11
|
Tang Z, Li C, Kang B, Gao G, Li C and
Zhang Z: GEPIA: A web server for cancer and normal gene expression
profiling and interactive analyses. Nucleic Acids Res. 45((W1)):
W98–W102. 2017. View Article : Google Scholar : PubMed/NCBI
|
|
12
|
Chandrashekar DS, Bashel B, Balasubramanya
SAH, Creighton CJ, Ponce-Rodriguez I, Chakravarthi BVSK and
Varambally S: UALCAN: A portal for facilitating tumor subgroup gene
expression and survival analyses. Neoplasia. 19:649–658. 2017.
View Article : Google Scholar : PubMed/NCBI
|
|
13
|
Vlachos IS and Hatzigeorgiou AG:
Functional analysis of miRNAs using the DIANA tools online suite.
Methods Mol Biol. 1517:25–50. 2017. View Article : Google Scholar : PubMed/NCBI
|
|
14
|
Paraskevopoulou MD, Vlachos IS and
Hatzigeorgiou AG: DIANA-TarBase and DIANA suite tools: Studying
experimentally supported microRNA targets. Curr Protoc
Bioinformatics. 55:12.14.1–12.14.18. 2016. View Article : Google Scholar
|
|
15
|
Sticht C, De La Torre C, Parveen A and
Gretz N: miRWalk: An online resource for prediction of microRNA
binding sites. PLoS One. 13:e02062392018. View Article : Google Scholar : PubMed/NCBI
|
|
16
|
Kohl M, Wiese S and Warscheid B:
Cytoscape: Software for visualization and analysis of biological
networks. Methods Mol Biol. 696:291–303. 2011. View Article : Google Scholar : PubMed/NCBI
|
|
17
|
Huang da W, Sherman BT and Lempicki RA:
Systematic and integrative analysis of large gene lists using DAVID
bioinformatics resources. Nat Protoc. 4:44–57. 2009. View Article : Google Scholar : PubMed/NCBI
|
|
18
|
Franceschini A, Szklarczyk D, Frankild S,
Kuhn M, Simonovic M, Roth A, Lin J, Minguez P, Bork P, von Mering C
and Jensen LJ: STRING v9.1: Protein-protein interaction networks,
with increased coverage and integration. Nucleic Acids Res.
41((Database Issue)): D808–D815. 2013.PubMed/NCBI
|
|
19
|
Scardoni G, Tosadori G, Faizan M, Spoto F,
Fabbri F and Laudanna C: Biological network analysis with
CentiScaPe: Centralities and experimental dataset integration.
F1000Res. 3:1392014. View Article : Google Scholar : PubMed/NCBI
|
|
20
|
Salmena L, Poliseno L, Tay Y, Kats L and
Pandolfi PP: A ceRNA hypothesis: The Rosetta Stone of a hidden RNA
language? Cell. 146:353–358. 2011. View Article : Google Scholar : PubMed/NCBI
|
|
21
|
Sun M and Kraus WL: From discovery to
function: The expanding roles of long non-coding RNAs in physiology
and disease. Endocr Rev. er00009999. 2015.(Epub ahead of print).
View Article : Google Scholar
|
|
22
|
Song W, Sun Y, Lin J and Bi X: Current
research on head and neck cancer-associated long noncoding RNAs.
Oncotarget. 9:1403–1425. 2017.PubMed/NCBI
|
|
23
|
Parton RG and Simons K: The multiple faces
of caveolae. Nat Rev Mol Cell Biol. 8:185–194. 2007. View Article : Google Scholar : PubMed/NCBI
|
|
24
|
Salem AF, Bonuccelli G, Bevilacqua G,
Arafat H, Pestell RG, Sotgia F and Lisanti MP: Caveolin-1 promotes
pancreatic cancer cell differentiation and restores membranous
E-cadherin via suppression of the epithelial-mesenchymal
transition. Cell Cycle. 10:3692–3700. 2011. View Article : Google Scholar : PubMed/NCBI
|
|
25
|
Nimri L, Barak H, Graeve L and Schwartz B:
Restoration of caveolin-1 expression suppresses growth,
membrane-type-4 metalloproteinase expression and
metastasis-associated activities in colon cancer cells. Mol
Carcinog. 52:859–870. 2013. View
Article : Google Scholar : PubMed/NCBI
|
|
26
|
Joo HJ, Oh DK, Kim YS, Lee KB and Kim SJ:
Increased expression of caveolin-1 and microvessel density
correlates with metastasis and poor prognosis in clear cell renal
cell carcinoma. BJU Int. 93:291–296. 2004. View Article : Google Scholar : PubMed/NCBI
|
|
27
|
Liu W, Yin NC, Liu H and Nan KJ: Cav-1
promote lung cancer cell proliferation and invasion through lncRNA
HOTAIR. Gene. 641:335–340. 2018. View Article : Google Scholar : PubMed/NCBI
|