Introduction
Gastric cancer (GC) is one of the most common
malignant diseases globally (1).
Although substantial advances have been made in the diagnosis and
therapy of this disease, the prognosis of GC remains poor and the
5-year survival rate is still comparatively low (2,3).
Therefore, it is essential to investigate the molecular mechanism
including potential biomarkers and therapeutic targets of GC.
In previous years, a large number of microarrays and
bioinformatics methods have been conducted to investigate the
molecular mechanism underlying cancer progression including
diagnosis, treatment and prognosis (4–6). For
example, bioinformatics analysis has been used to elucidate the
potential key candidate genes and pathways in colorectal cancer
from four cohort profile datasets (7). In addition, target genes and the
prognostic value in non-small cell lung cancer have been discovered
previously via bioinformatics analysis (8). Similarly, bioinformatics analysis has
been performed to identify long non-coding RNA (lnc-RNA)-microRNA
(miRNA/miR)-mRNA networks via the combination of lncRNA, miRNA and
mRNA expression profiles based on competitive endogenous RNA in
rheumatoid arthritis (9). In
conclusion, it is necessary to perform further investigation of the
molecular mechanism underlying GC using integrated bioinformatics
analysis.
In the present study, differentially expressed mRNAs
(DEMs) and differentially expressed miRNAs (DEMis) were screened
out from the Gene Expression Omnibus (GEO) database. Gene Ontology
(GO) and Kyoto Encyclopedia of Genes and Genomes (KEGG) pathway
enrichment analyses of DEMs were also performed. The
lncRNA-miRNA-mRNA network was subsequently established, which may
provide additional information on the molecular mechanism of
GC.
Materials and methods
Gene expression profiles
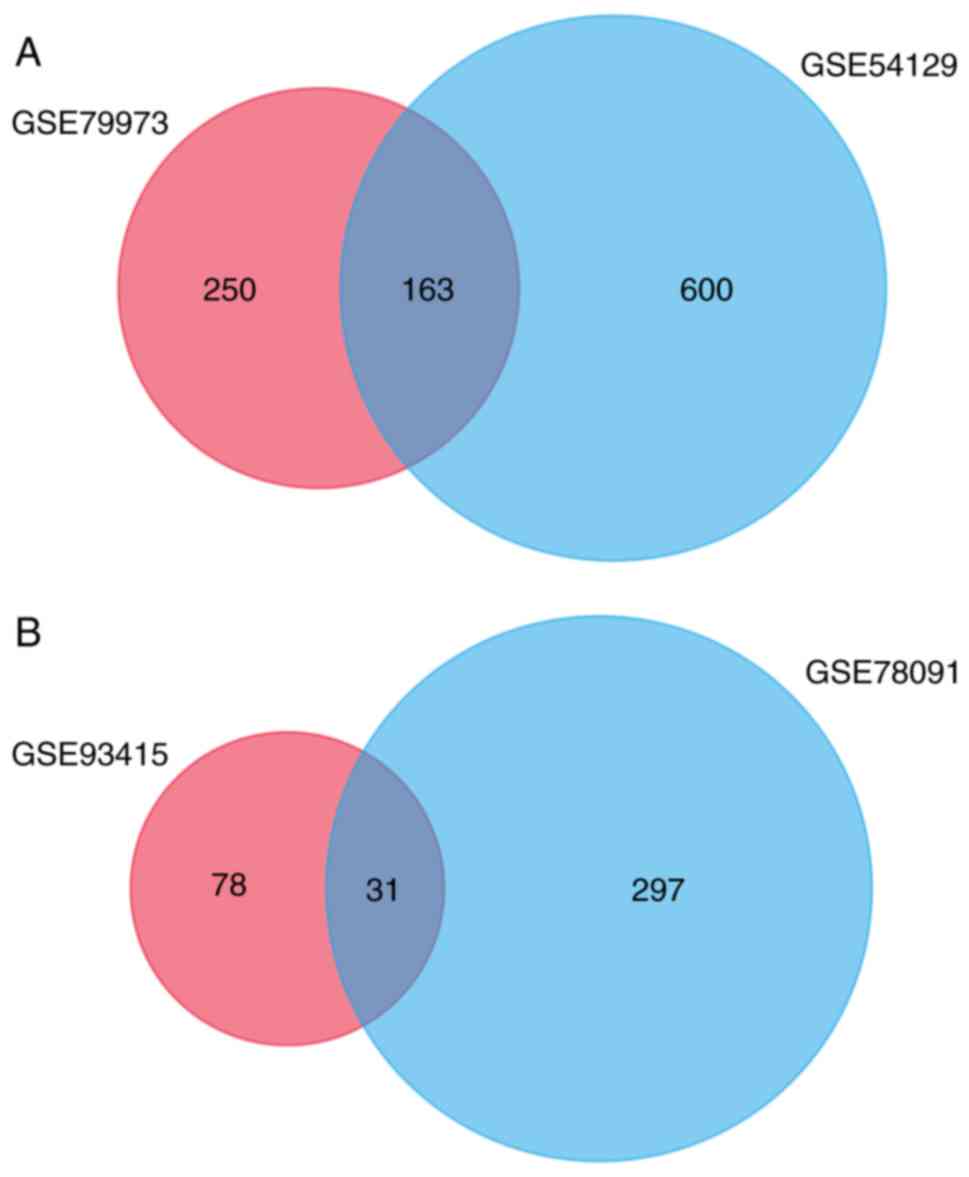
Two human mRNA expression profiles, GSE79973 and
GSE54129, were acquired from the GEO database (ncbi.nlm.nih.gov/geo/) (10), which included 121 GC and 31 normal
samples. Two human miRNA expression profiles, GSE93415 and
GSE78091, were also downloaded from the GEO database, which
included 23 GC and 23 normal samples. FunRich version 3.1.3 was
used to draw the venn diagram (11).
Identification of DEMs and DEMis
Two mRNA and two miRNA databases were analyzed using
the GEO2R web tool comparing samples in the GC and control groups
(12). In order to select the DEMs,
an adjusted (adj.) P-value of ≤0.05 and |log2 fold change (FC)| ≥2
were selected as the cut-off values for the two mRNA databases. For
DEMis, adj.P-value ≤0.05 and |log2FC| ≥1 were regarded as the
cut-off criteria values.
Function analysis of DEMs
GO function and KEGG pathway enrichment analysis of
the up- and downregulated genes and 10 hub genes were analyzed
using the online Database for Annotation, Visualization and
Integrated Discovery (DAVID; david.abcc.ncifcrf.gov/). P<0.05 was considered to
indicate a statistically signicant difference.
Protein-protein interaction (PPI)
network construction and sub-network identification
Search Tool for the Retrieval of Interacting Genes
(STRING; string-db.org/) was used to analyze the
PPI network of DEMs (13). The PPIs
of DEMs were selected using a combined score of >0.9. Cytoscape
version 3.5.1 (cytoscape.org/) software was utilized
to construct the PPI network (14).
Cytohubba in Cytoscape software was employed to identify the 10 top
hub genes by degree. The sub-network in the PPI network was then
visualized by MCODE with a cut-off criterion of k-score=2 (15). P<0.05 was considered to indicate a
statistically signicant difference.
Survival analysis of the 10 top hub
genes
The publicly available database Kaplan-Meier Plotter
(www.kmplot.com) was used to identify the
prognostic effect of the 10 top hub genes (16). P<0.05 was considered to indicate a
statistically signicant difference.
Determining the expression level of
the significantly up- and downregulated DEMs
A total of 5 significantly upregulated DEMs (inhibin
bA, collagen type VIII α1, secreted frizzle related protein 4,
secreted phosphoprotein 1 and thormbospondin 2) and 5 significantly
downregulated DEMs [Gastrokine 2 (GKN2), GKN1, gastric intrinsic
factor, Mucin like 3 and Keratin 20 (KRT20)] were selected for
further analysis. The Gene Expression Profiling Interactive
Analysis (GEPIA; gepia.cancer-pku.cn/) database was used to
determine the expression of 10 DEMs in GC tissues (17). In order to provide more sufficient
evidence to support the results, the present study investigated the
data in the Cancer Cell Line Encyclopedia (CCLE) portals
(broadinstitute.org/ccle/about)
database, which supplied information on the expression of 10 DEMs
in GC cell lines (18). P<0.05
was considered to indicate a statistically signicant
difference.
Reconstruction of the
lncRNA-miRNA-mRNA networks
The miRNA-targeted genes were screened out using the
miRWalk database (mirwalk.umm.uni-heidelberg.de/) with a score of
>0.9 (19,20). The targeted genes and DEMs mentioned
above were merged to identify the number of miRNA-regulated target
gene pairs. The prediction of lncRNA-miRNA interactions was based
on the analysis of the lncRNASNP (www.lncRNAblog.com) database (21). The networks between miRNA-mRNA and
lncRNA-miRNA were visualized using Cytoscape version 3.5.1.
P<0.05 was considered to indicate a statistically signicant
difference.
Statistical analysis
All statistical analysis was performed using
corresponding databases. Data was presented as the mean ± standard
deviation. A paired Student's t-test or one-way analysis of
variance (ANOVA) or two-way ANOVA were used to evaluate the degree
of differential expression. A log-rank test was applied to analyse
the association between expression and prognosis. Post-hoc tests
(least significant difference and Tukey's tests) were performed
following ANOVA. P<0.05 was considered to indicate a
statistically significant difference.
Results
Identification of DEMs and DEMis
A total of 158 DEMs (5 of the 163 genes were
identified as unreconized genes) were identified based on the
cut-off criteria using FunRich, including 40 upregulated DEMs and
118 downregulated DEMs (Fig. 1A).
Furthermore, 31 DEMis were obtained between GC and control samples.
A total of 30 upregulated miRNAs and 1 downregulated miRNA were
identified as DEMis (Fig. 1B). All
DEMs and DEMis are presented in Table
I.
 | Table I.158 DEMs were obtained from two
datasets, including 40 upregulated DEMs and 118 downregulated DEMs.
31 DEMis were obtained between gastric cancer samples and control
samples, including 30 upregulated miRNAs and 1 downregulated
miRNA. |
Table I.
158 DEMs were obtained from two
datasets, including 40 upregulated DEMs and 118 downregulated DEMs.
31 DEMis were obtained between gastric cancer samples and control
samples, including 30 upregulated miRNAs and 1 downregulated
miRNA.
| DEMs | Gene name |
|---|
| Upregulated | COL11A1, INHBA,
IGF2BP3, COL10A1, FNDC1, FAP, THBS2, SULF1, CST1, COL8A1, SFRP4,
SPP1, COL1A1, ADAMTS2, WISP1, CTHRC1, COL12A1, ASPN, CRISPLD1,
THY1, COL1A2, FN1, BGN, RARRES1, CAP2, MFAP2, PDPN, PRRX1, TIMP1,
SPARC, COL6A3, COL4A1, THBS1, NRP2, PDLIM7, LY6E, SPOCK1, PI15,
CEMIP, CXCL8 |
| Downregulated | GKN2, GKN1, ATP4A,
ATP4B, GIF, LIPF, KCNJ16, DPCR1, SOSTDC1 KCNE2, CWH43, ESRRG, PGC,
SLC28A2, PSAPL1, KRT20, VSIG1, LTF, CXCL17, AKR1B10, LOC643201,
GSTA1, ADH7, ADH1C, GC, CAPN9, MAL, SLC26A9, HRASLS2, MFSD4A,
MUC5AC, FBP2, ALDH3A1, ADGRG2, VSTM2A, LINC00982, CAPN13, KIAA1324,
CA9, TPCN2, PIK3C2G, RDH12, SLC26A7, SSTR1, VSIG2, GATA6-AS1, HPGD,
UPK1B, KCNJ15, SULT1C2, LINC00675, BTNL8, AXDND1, LINC00992,
KAZALD1, TMED6, UGT2B15, SCNN1B, HAPLN1, AKR1C1, LYPD6B, FCGBP,
ADTRP, IGH, CA2, RFX6, ACER2, CYP2C9, PCAT18, PKIB, SH3RF2, HHIP,
HEPACAM2, AADAC, CYP2C18, RAB27B, MGAM, SPINK7, CNTN3, LINC01133,
BCAS1, SULT1B1, CAPN8, SMIM6, AMPD1, JCHAIN, PBLD, ATP13A4, RNASE1,
PLLP, B4GALNT3, STYK1, CYP2C19, SMIM24, LRRC66, RASSF6, ADAM28,
FA2H, GATA5, SCIN, SGK2, TPH1, PROM2, APOBEC1, ACKR4, ADH1A,
AKR7A3, OASL, SMPD3, XK, KLHDC7A, STX19, CYP3A5, STS, VILL, ANG,
S100P, DDX60 |
|
| DEMis | miRNA
name |
|
| Upregulated | hsa-let-7i-3p,
hsa-miR-100-5p, hsa-miR-106b-5p, hsa-miR-10a-5p, hsa-miR-151a-5p,
hsa-miR-15a-5p, hsa-miR-195-5p, hsa-miR-199a-3p, hsa-miR-199a-5p,
hsa-miR-199b-5p, hsa-miR-19a-3p, hsa-miR-20a-5p, hsa-miR-214-3p,
hsa-miR-214-5p, hsa-miR-218-5p, hsa-miR-223-3p, hsa-miR-301a-3p,
hsa-miR-331-3p, hsa-miR-335-5p, hsa-miR-342-3p, hsa-miR-377-3p,
hsa-miR-4262, hsa-miR-4291, hsa-miR-4317, hsa-miR-454-3p,
hsa-miR-455-3p, hsa-miR-4791, hsa-miR-93-5p, hsa-miR-99a-5p,
hsa-miR-99b-5p |
| Downregulated | hsa-miR-375 |
Functional analysis of DEMs
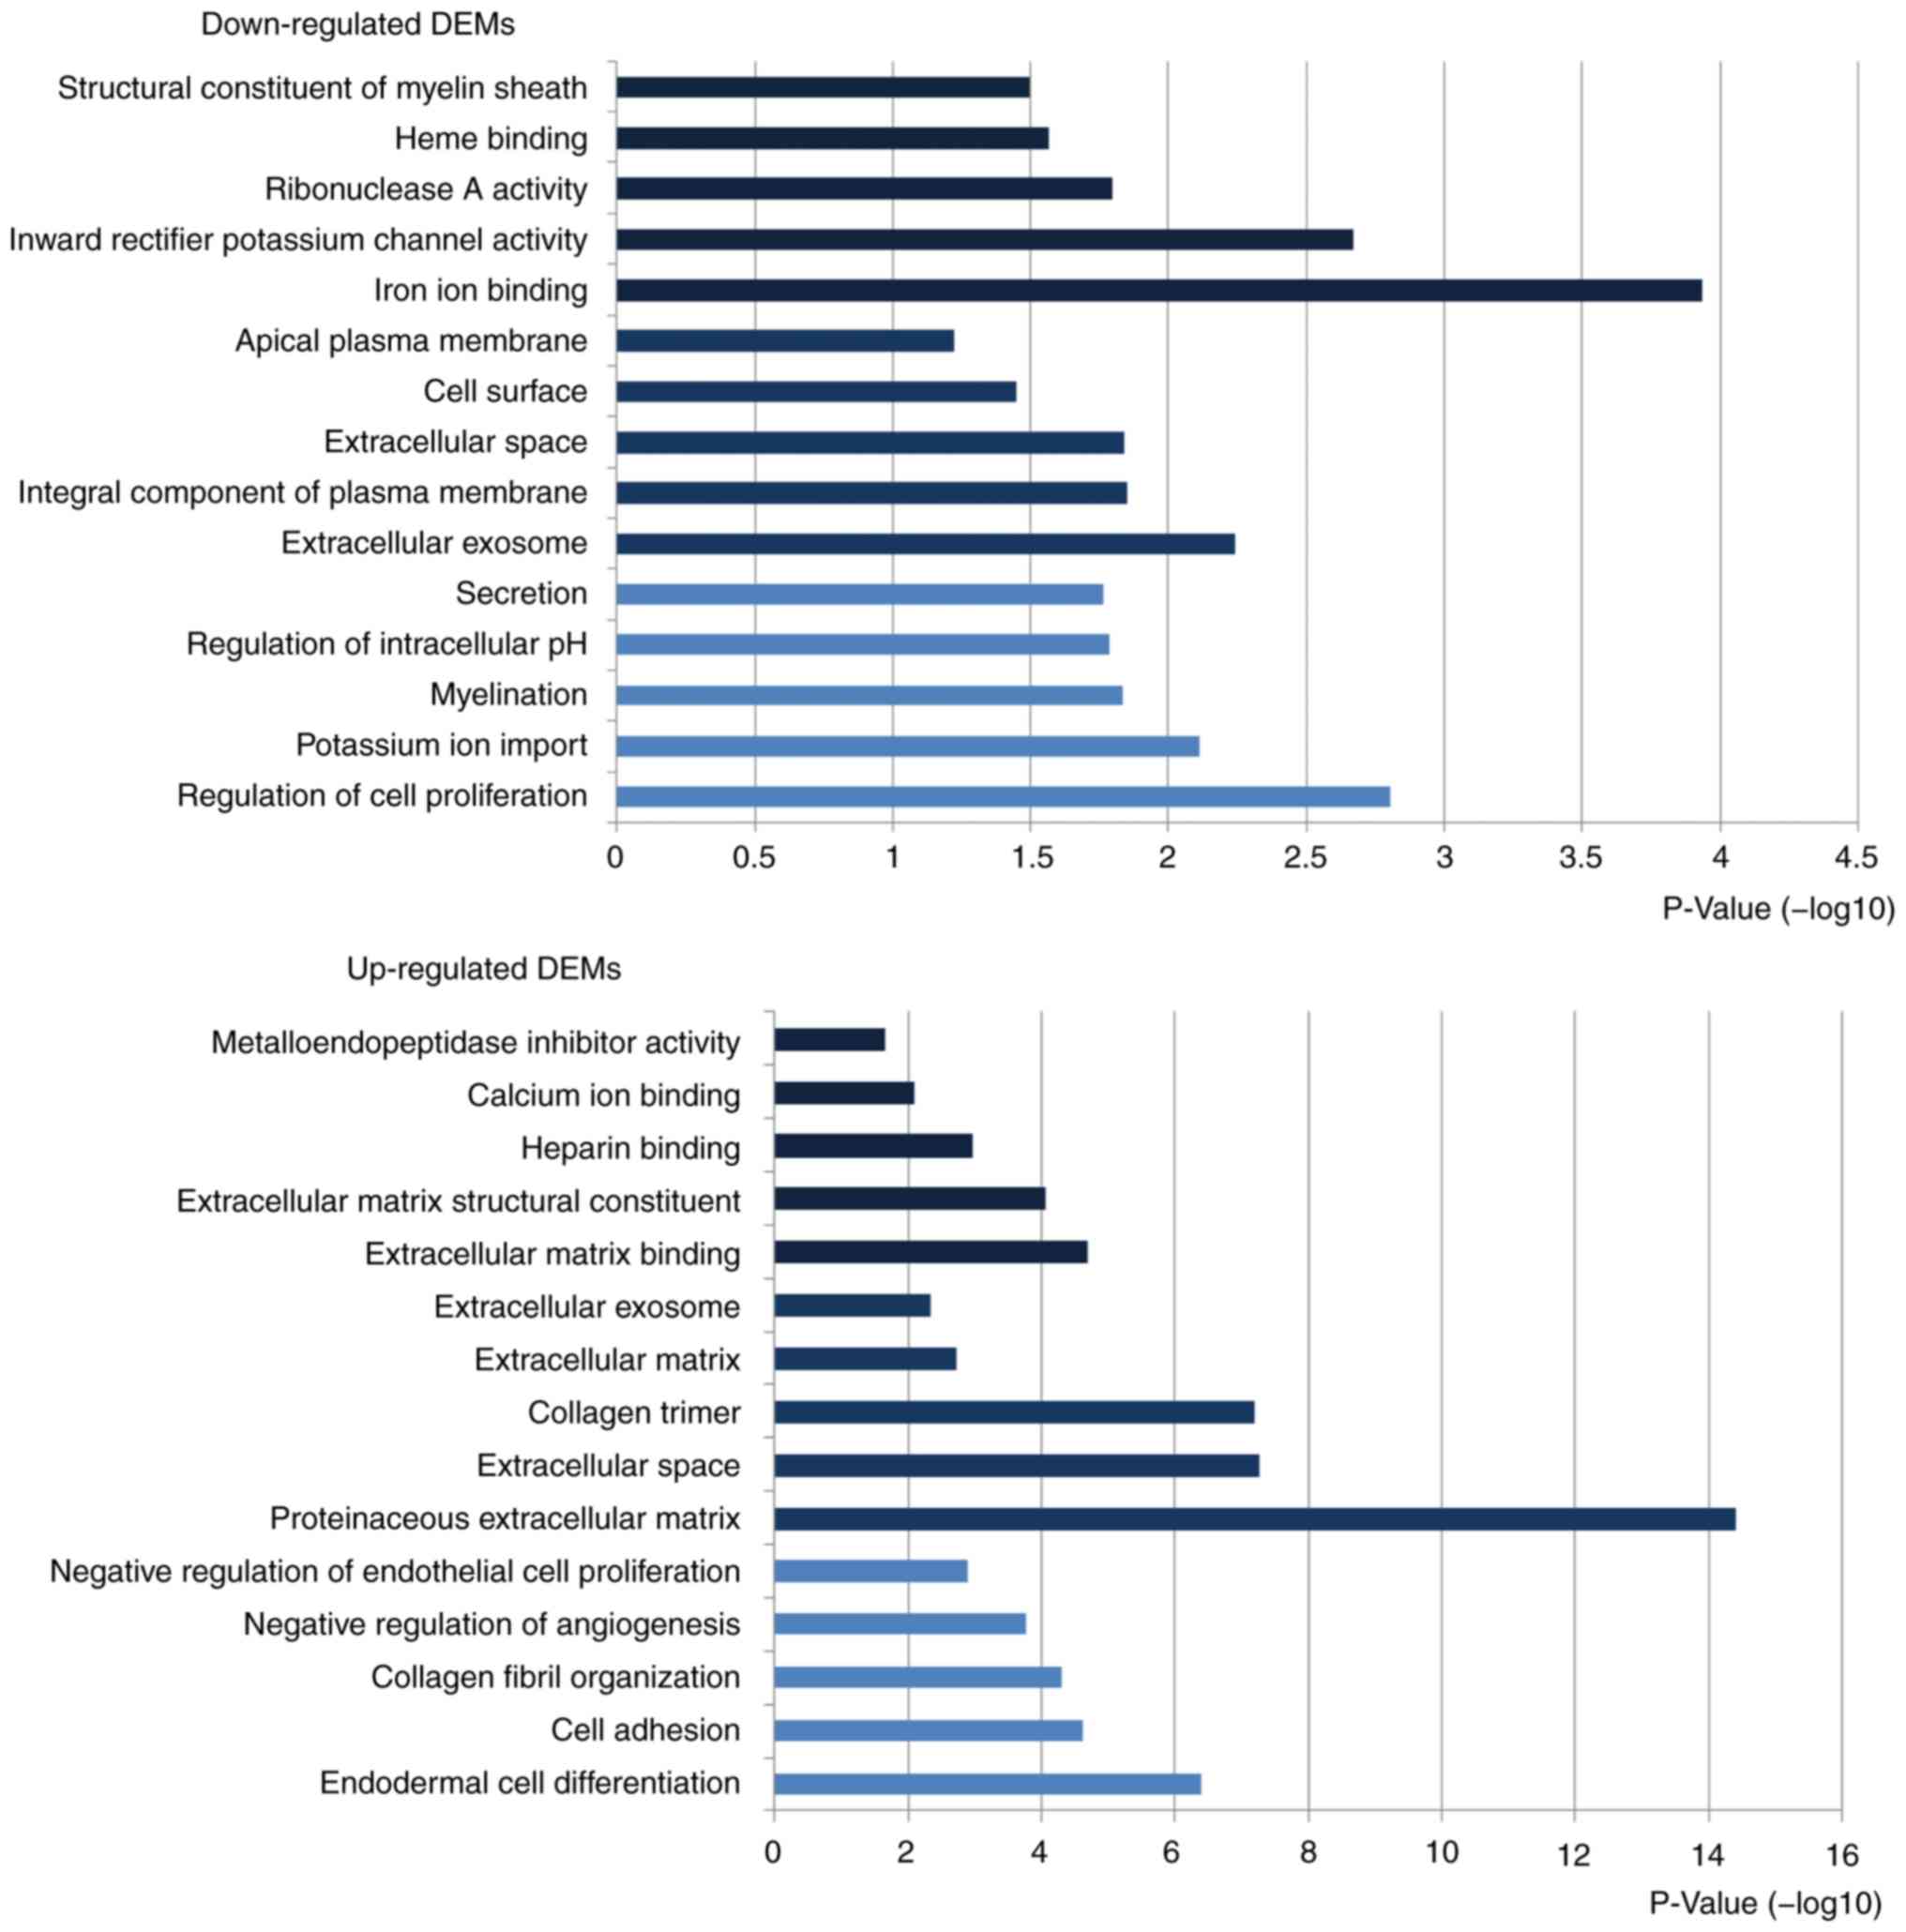
According to GO functional enrichment analysis for
up- and downregulated DEMs, the significantly enriched biological
process (BP), cellular component (CC) and molecular function (MF)
terms were selected (Fig. 2). The
values in the x-axes represent the quantification of -log10
(P-value). The GO terms enriched by upregulated DEMs were mainly
associated with ‘endodermal cell differentiation’, ‘proteinaceous
extracellular’ and ‘extracellular matrix binding’ while the GO
terms enriched by downregulated DEMs were mainly associated with
‘regulation of cell proliferation’, ‘extracellular exosome’ and
‘iron ion binding’ (Table II).
Following KEGG pathway enrichment analysis, upregulated
differentially expressed genes (DEGs) were revealed to be mainly
involved in ‘ECM-receptor interaction’, ‘focal adhesion’ and
‘phosphoinositide-3-kinase (PI3K)-protein kinase B (Akt) signaling
pathway’. Downregulated DEGs were associated with ‘gastric acid
secretion’, ‘retinol metabolism’ and ‘chemical carcinogenesis’
(Table III).
| Table II.Top 5 enriched GO terms of
upregulated and downregulated differentially expressed mRNAs. |
Table II.
Top 5 enriched GO terms of
upregulated and downregulated differentially expressed mRNAs.
| Upregulated | Term | Count | P-value |
|---|
| BP |
|
GO:0035987 | Endodermal cell
differentiation | 5 | 4.00
×10−07 |
|
GO:0007155 | Cell adhesion | 6 | 2.44
×10−05 |
|
GO:0030199 | Collagen fibril
organization | 4 | 5.04
×10−05 |
|
GO:0016525 | Negative regulation
of angiogenesis | 4 | 1.66
×10−04 |
|
GO:0001937 | Negative regulation
of endothelial cell proliferation | 3 | 0.001248824 |
| CC |
|
GO:0005578 | Proteinaceous
extracellular matrix | 13 | 4.06
×10−15 |
|
GO:0005615 | Extracellular
space | 14 | 5.60
×10−08 |
|
GO:0005581 | Collagen
trimer | 6 | 6.88
×10−08 |
|
GO:0031012 | Extracellular
matrix | 4 | 0.002041798 |
|
GO:0070062 | Extracellular
exosome | 13 | 0.004832505 |
| MF |
|
GO:0050840 | Extracellular
matrix binding | 4 | 2.15
×10−05 |
|
GO:0005201 | Extracellular
matrix structural constituent | 4 | 9.22
×10−05 |
|
GO:0008201 | Heparin
binding | 4 | 0.001122327 |
|
GO:0005509 | Calcium ion
binding | 6 | 0.008415225 |
|
GO:0008191 |
Metalloendopeptidase inhibitor
activity | 2 | 0.02384997 |
| Downregulated |
| BP |
|
GO:0042127 | Regulation of cell
proliferation | 6 | 0.001561961 |
|
GO:0010107 | Potassium ion
import | 3 | 0.007733402 |
|
GO:0042552 | Myelination | 3 | 0.014660727 |
|
GO:0051453 | Regulation of
intracellular pH | 3 | 0.01645907 |
|
GO:0046903 | Secretion | 2 | 0.017262077 |
| CC |
|
GO:0070062 | Extracellular
exosome | 22 | 0.00577329 |
|
GO:0005887 | Integral component
of plasma membrane | 11 | 0.014280261 |
|
GO:0005615 | Extracellular
space | 12 | 0.014702585 |
|
GO:0009986 | Cell surface | 6 | 0.036068461 |
|
GO:0016324 | Apical plasma
membrane | 4 | 0.06075832 |
| MF |
|
GO:0005506 | Iron ion
binding | 7 | 1.17
×10−04 |
|
GO:0005242 | Inward rectifier
potassium channel activity | 3 | 0.002175164 |
|
GO:0004522 | Ribonuclease A
activity | 2 | 0.016178947 |
|
GO:0020037 | Heme binding | 4 | 0.027324696 |
|
GO:0019911 | Structural
constituent of myelin sheath | 2 | 0.032099763 |
| Table III.Top 5 enriched Kyoto Encyclopedia of
Genes and Genomes pathway analysis of upregulated and downregulated
differentially expressed mRNAs. |
Table III.
Top 5 enriched Kyoto Encyclopedia of
Genes and Genomes pathway analysis of upregulated and downregulated
differentially expressed mRNAs.
| ID | Term | Count | P-value |
|---|
| Upregulated |
|
GO:cfa04512 | Extracellular
matrix-receptor interaction | 9 |
3.17×10⁻¹² |
|
GO:cfa04510 | Focal adhesion | 9 |
3.53×10−09 |
|
GO:cfa04974 | Protein digestion
and absorption | 7 |
1.38×10−08 |
|
GO:cfa04151 |
Phosphoinositide-3-kinase-protein kinase B
signaling pathway | 9 |
1.62×10−07 |
|
GO:cfa05146 | Amoebiasis | 6 |
2.25×10−06 |
|
| ID | Term | Count | P-value |
|
| Downregulated |
|
GO:bta04971 | Gastric acid
secretion | 7 |
1.29×10−06 |
|
GO:bta00830 | Retinol
metabolism | 6 |
8.34×10−06 |
|
GO:bta05204 | Chemical
carcinogenesis | 6 |
2.30×10−05 |
|
GO:bta01100 | Metabolic
pathways | 16 |
5.74×10−04 |
|
GO:bta00140 | Steroid hormone
biosynthesis | 4 | 0.002819276 |
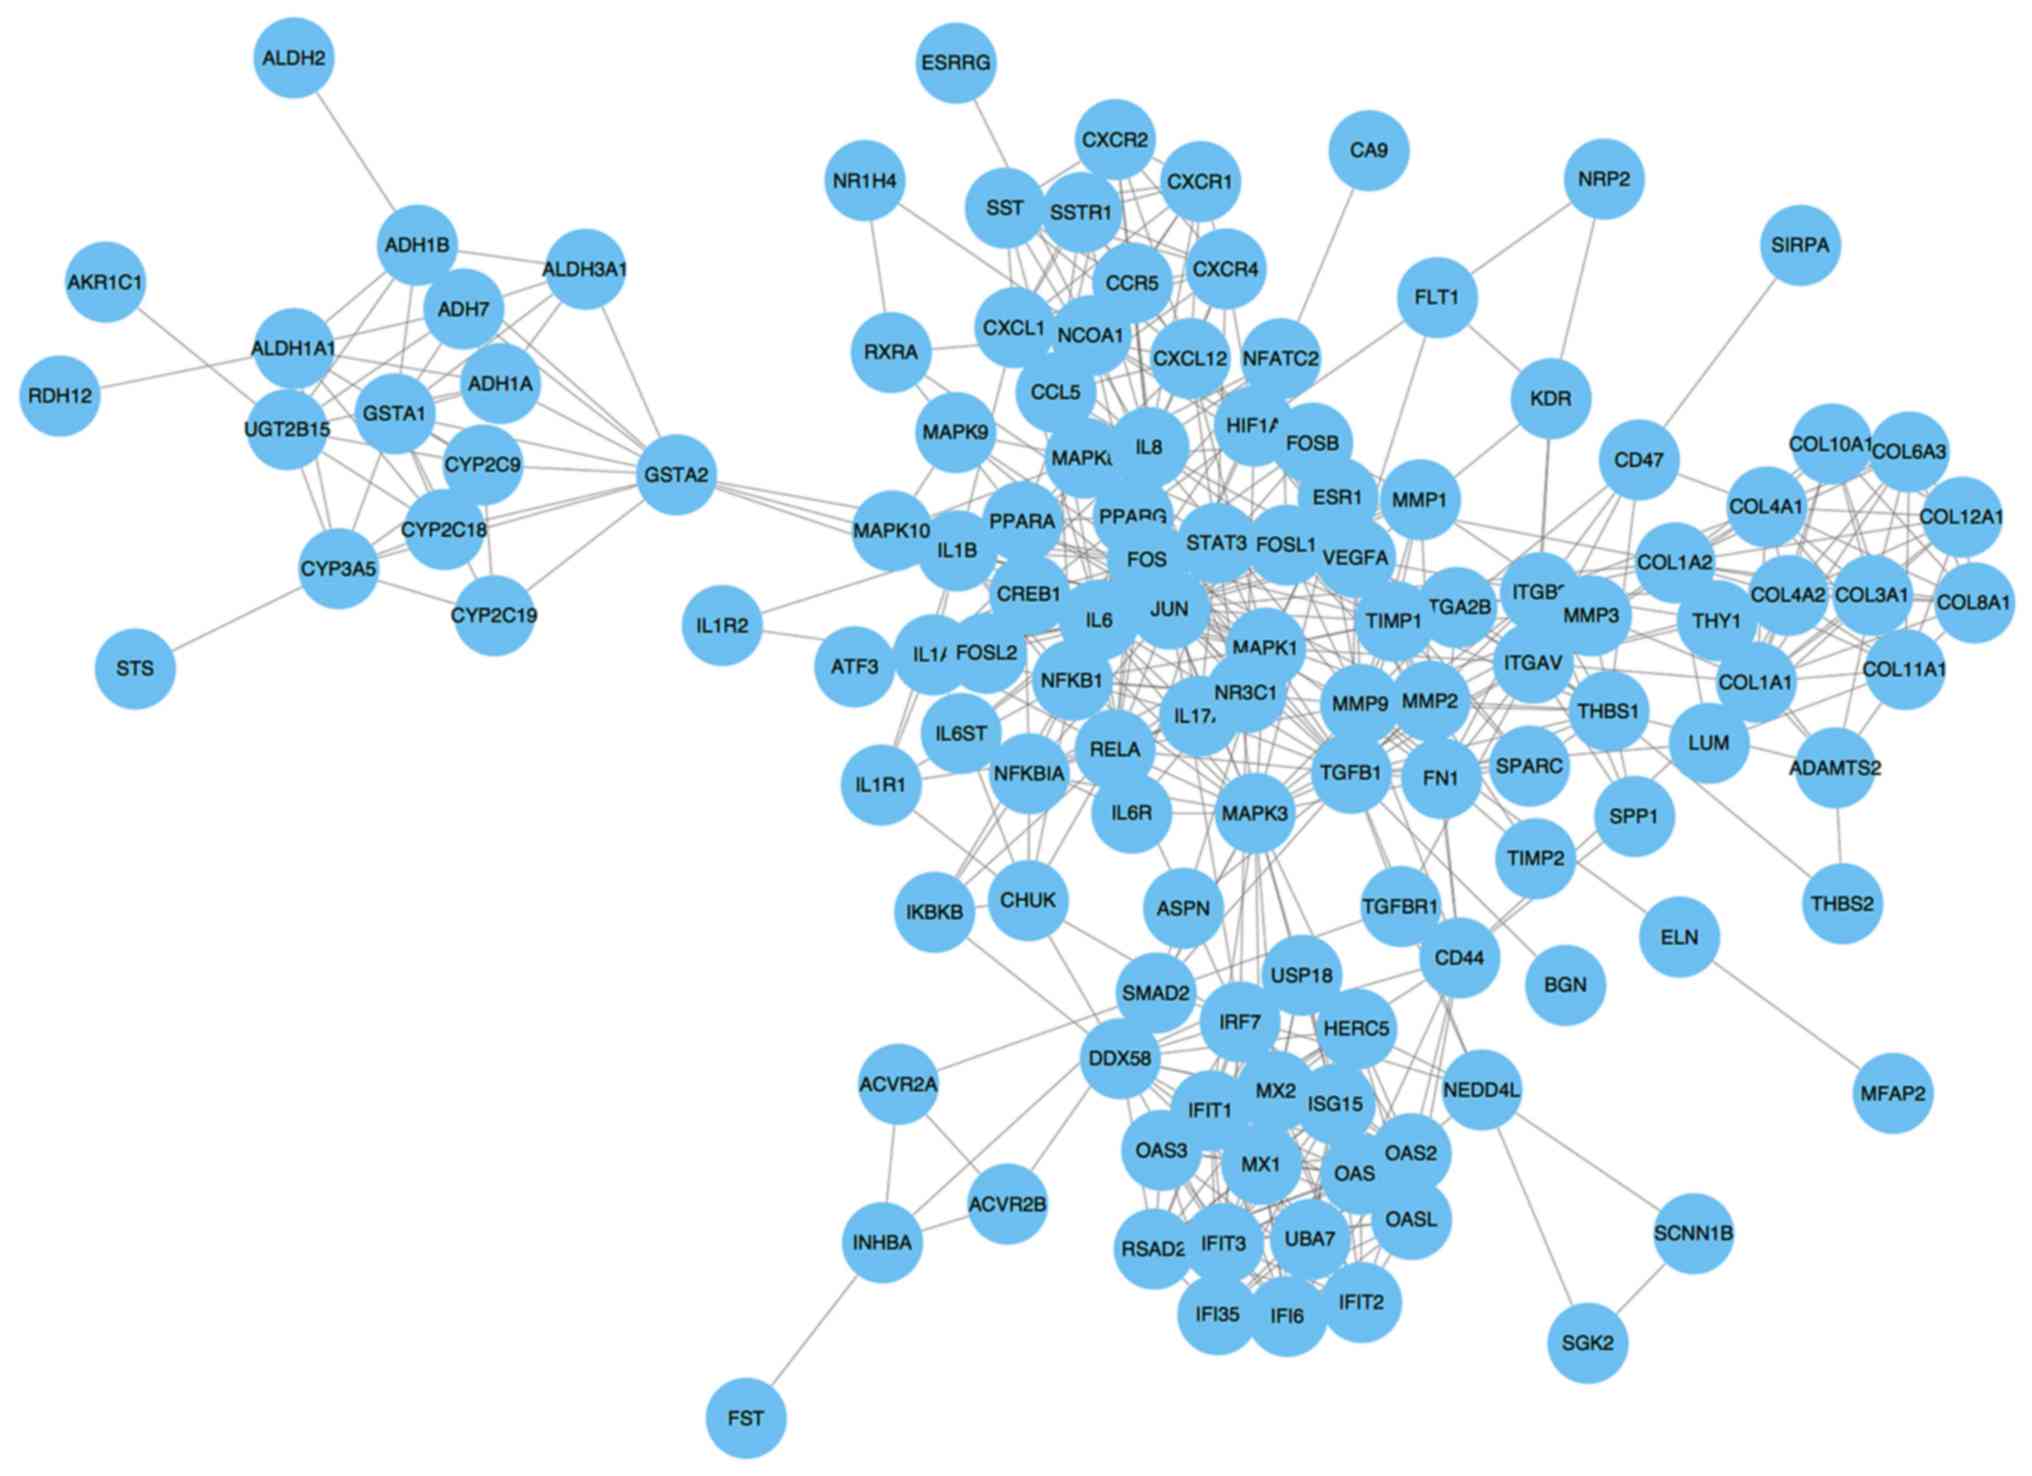
PPI network construction and
sub-network identification
The PPI network consisted of 129 nodes and 572
interactions (Fig. 3). Following the
use of Cytohubba in Cytoscape software, 10 top hub genes Jun
proto-oncogene (JUN), mitogen activated protein kinase (MAPK)3,
transforming growth factor-β1, Fos proto-oncogene, AP-1
transcription factor subunit (FOS), interleukin (IL)-8, MAPK1, RELA
proto-oncogene nuclear factor κβ (NF-κB) subunit (RELA), interferon
regulatory factor 7 (IRF7), ubiquitin like modifier (ISG15) and
vascular endothelial growth factor A (VEGFA) were evaluated by
degree in the PPI network (Fig. 4).
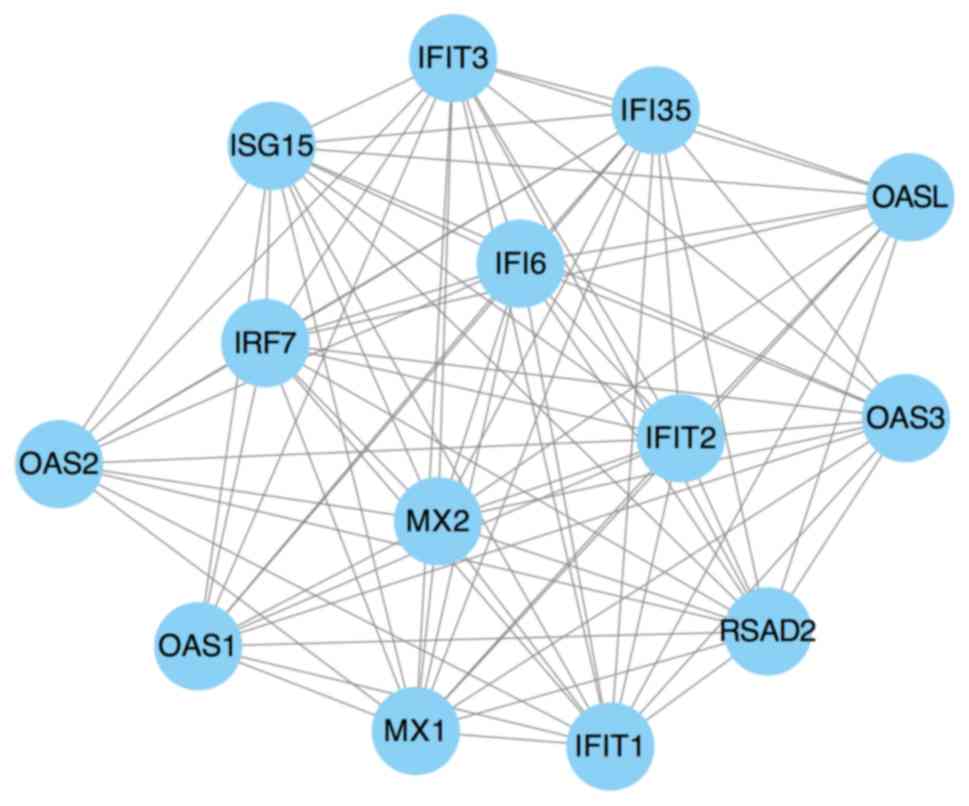
The sub-network in the PPI network was then visualized using MCODE
with a cut-off criterion of k-score=2. The sub-network was obtained
from the PPI network with 14 nodes and 86 interactions (Fig. 5).
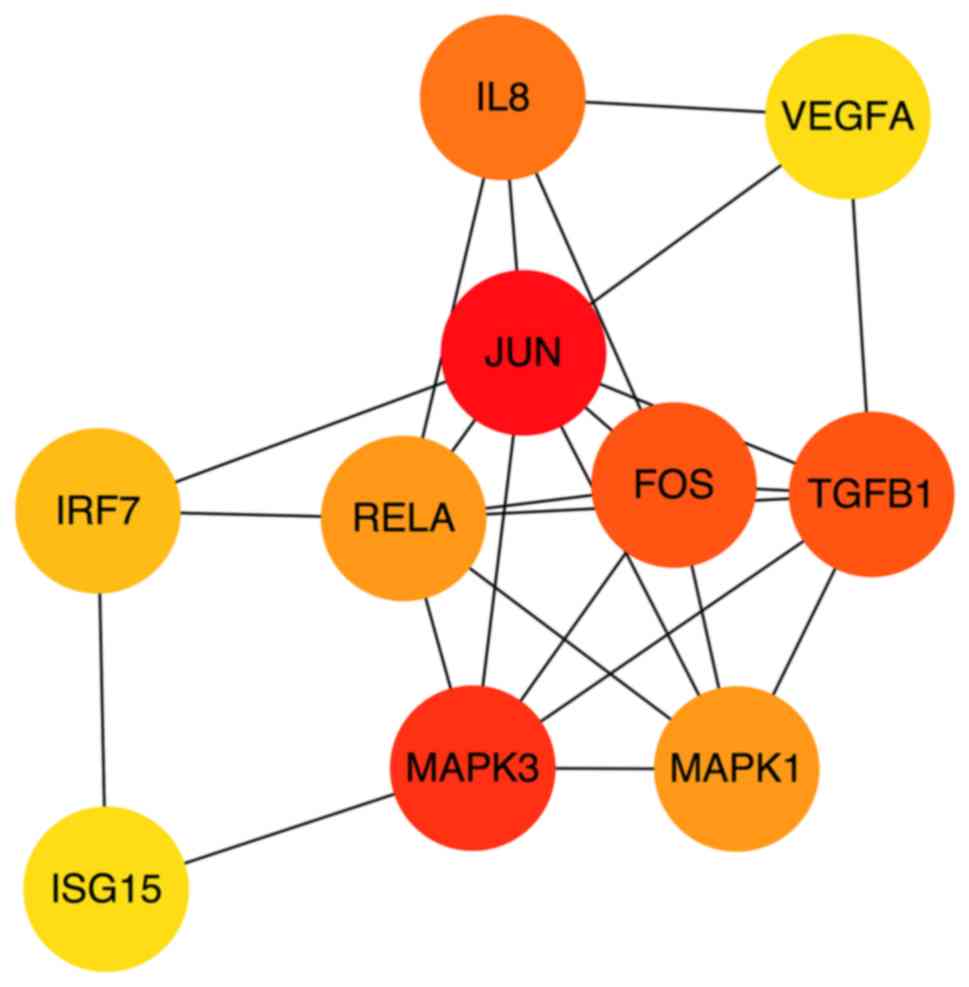 | Figure 4.Top 10 hub genes by degree in the
protein-protein interaction network using the Cytohubba in
Cytoscape software. P<0.05. JUN, Jun proto-oncogene; TGFB1,
transforming growth factor-β1; FOS, Fos proto-oncogene, AP-1
transcription factor subunit; IL-8, interleukin 8; MAPK,
mitogen-activated protein kinase; RELA, RELA proto-oncogene NF-ein
kinase; IRF7, interferon regulatory factor 7; VEGFA, vascular
endothelial growth factor A; ISG15, ISG15 ubiquitin like
modifier. |
Survival analysis of the 10 top hub
genes
The present study used the Kaplan-Meier Plotter
database to evaluate the prognostic effect of the 10 top hub genes
by overall survival (OS; Fig. 6).
The Kaplan-Meier curves indicated that a higher expression of
MAPK3, TGFB1, RELA, IRF7, ISG15 and VEGFA was significantly
associated with poor survival in GC. On the other hand, a lower
expression of JUN, FOS, IL8 and MAPK1 was significantly associated
with poor survival in GC.
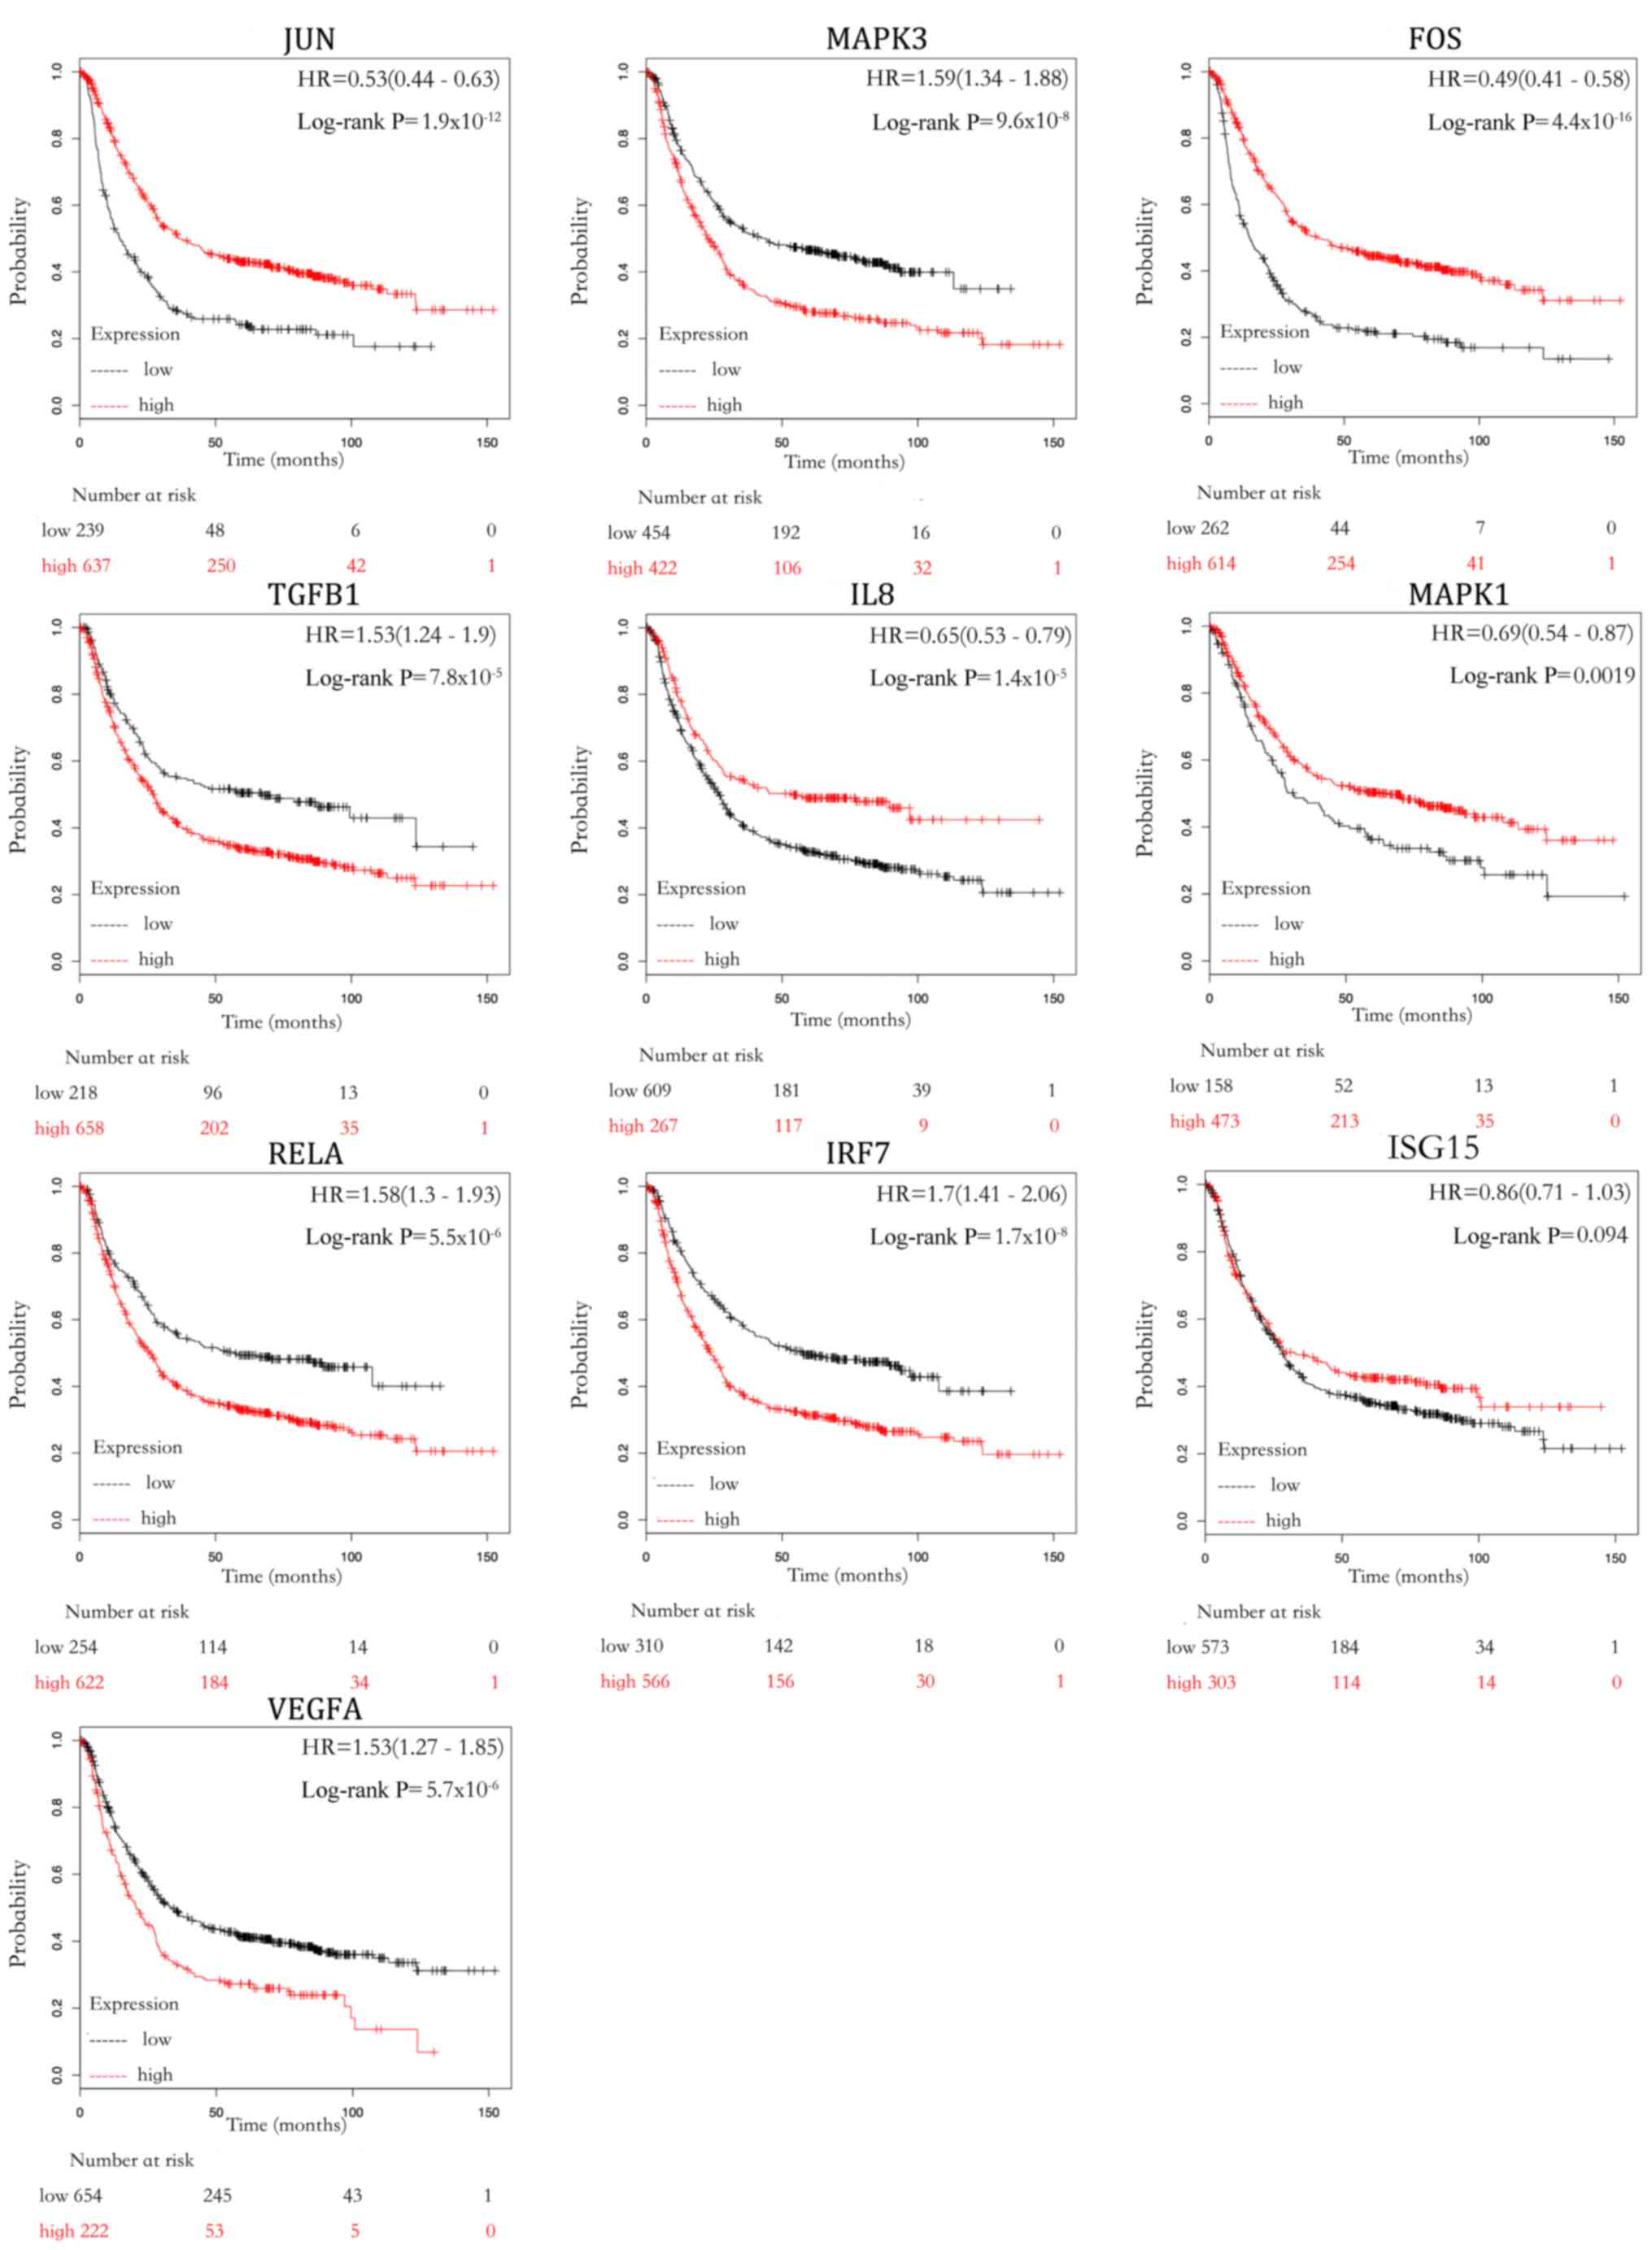 | Figure 6.Survival analysis of 10 top hub
genes. The survival data for patients with gastric cancer were
obtained from Kaplan-Meier Plotter database. P<0.05. HR, hazard
ratio; JUN, Jun proto-oncogene; TGFB1, transforming growth
factor-β1; FOS, Fos proto-oncogene, AP-1 transcription factor
subunit; IL-8, interleukin 8; ubiquitin like modifier (ISG15);
MAPK, mitogen-activated protein kinase; RELA, RELA proto-oncogene
NF-κβ subunit; IRF7, interferon regulatory factor 7; VEGFA,
vascular endothelial growth factor A. |
Functional analysis of 10 top hub
genes and DEMs
In order to elucidate the specific signaling
pathways that the 158 DEMs and 10 top hub genes were involved in,
the DAVID database was used for further research. The results
revealed that the 158 DEMs were involved in 17 KEGG pathways
(Table IV). Among these pathways, 4
KEGG pathways (bta04151: PI3K-Akt signaling pathway, bta04510:
Focal adhesion, bta05146: Amoebiasis and bta05144: Malaria) were
identified to be significantly associated with the 10 top hub genes
(Table V).
| Table IV.Enriched Kyoto Encyclopedia of Genes
and Genomes pathway analysis of 158 differentially expressed
mRNAs. |
Table IV.
Enriched Kyoto Encyclopedia of Genes
and Genomes pathway analysis of 158 differentially expressed
mRNAs.
| Term | Count | P-value | Genes |
|---|
|
bta04151:Phosphoinositide-3-kinase-protein
kinase B signaling pathway | 10 | 6.79
×10−04 | COL4A1, SGK2,
COL6A3, COL1A2, COL1A1, THBS1, COL11A1, THBS2, FN1, SPP1 |
| bta04510:Focal
adhesion | 9 | 9.84
×10−05 | COL4A1, COL6A3,
COL1A2, COL1A1, THBS1, COL11A1, THBS2, FN1, SPP1 |
|
bta05146:Amoebiasis | 6 | 0.001142 | COL4A1, COL1A2,
CXCL8, COL1A1, COL11A1, FN1 |
|
bta05144:Malaria | 3 | 0.054453 | CXCL8, THBS1,
THBS2 |
| bta01100:Metabolic
pathways | 16 | 0.024433 | CYP3A5, PIK3C2G,
CYP2C18, ACER2, ADH1C, ADH7, FBP2, AMPD1, ALDH3A1, RDH12, AKR1B10,
MGAM, TPH1, SMPD3, LIPF |
|
bta04512:Extracellular matrix-receptor
interaction | 9 | 1.47
×10−07 | COL4A1, COL6A3,
COL1A2, COL1A1, THBS1, COL11A1, THBS2, FN1, SPP1 |
| bta04971:Gastric
acid secretion | 7 | 1.07
×10−05 | KCNJ16, KCNJ15,
ATP4A, ATP4B, SLC26A7, KCNE2, CA2 |
| bta04974:Protein
digestion and absorption | 7 | 2.61
×10−05 | COL4A1, COL6A3,
COL1A2, COL12A1, COL1A1, COL11A1, COL10A1 |
| bta00830:Retinol
metabolism | 6 | 4.79
×10−05 | RDH12, CYP3A5,
CYP2C18, ADH1C, ADH7 |
| bta05204:Chemical
carcinogenesis | 6 | 1.29
×10−04 | CYP3A5, CYP2C18,
ADH1C, ADH7, ALDH3A1 |
| bta00140:Steroid
hormone biosynthesis | 4 | 0.007616 | CYP3A5, STS,
CYP2C18 |
|
bta00010:Glycolysis/Gluconeogenesis | 4 | 0.010031 | ADH1C, ADH7, FBP2,
ALDH3A1 |
| bta04966:Collecting
duct acid secretion | 3 | 0.015591 | ATP4A, ATP4B,
CA2 |
| bta00591:Linoleic
acid metabolism | 3 | 0.028276 | CYP3A5,
CYP2C18 |
| bta00350:Tyrosine
metabolism | 3 | 0.032672 | ADH1C, ADH7,
ALDH3A1 |
| bta00982:Drug
metabolism-cytochrome P450 | 3 | 0.063878 | ADH1C, ADH7,
ALDH3A1 |
| bta00980:Metabolism
of xenobiotics by cytochrome P450 | 3 | 0.065826 | ADH1C, ADH7,
ALDH3A1 |
| Table V.Four enriched Kyoto Encyclopedia of
Genes and Genomes pathway analysis of 10 hub genes that are
identical to the results of 158 differentially expressed mRNAs. |
Table V.
Four enriched Kyoto Encyclopedia of
Genes and Genomes pathway analysis of 10 hub genes that are
identical to the results of 158 differentially expressed mRNAs.
| Term | Count | P-value | Genes |
|---|
|
bta04151:Phosphoinositide-3-kinase-protein
kinase B signaling pathway | 6 | 2.16
×10−05 | MAPK1, IL6, RELA,
VEGFA, MAPK3 |
| bta04510:Focal
adhesion | 4 | 0.001531 | MAPK1, JUN, VEGFA,
MAPK3 |
|
bta05146:Amoebiasis | 3 | 0.007335 | IL6, RELA,
TGFB1 |
|
bta05144:Malaria | 2 | 0.061465 | IL6, TGFB1 |
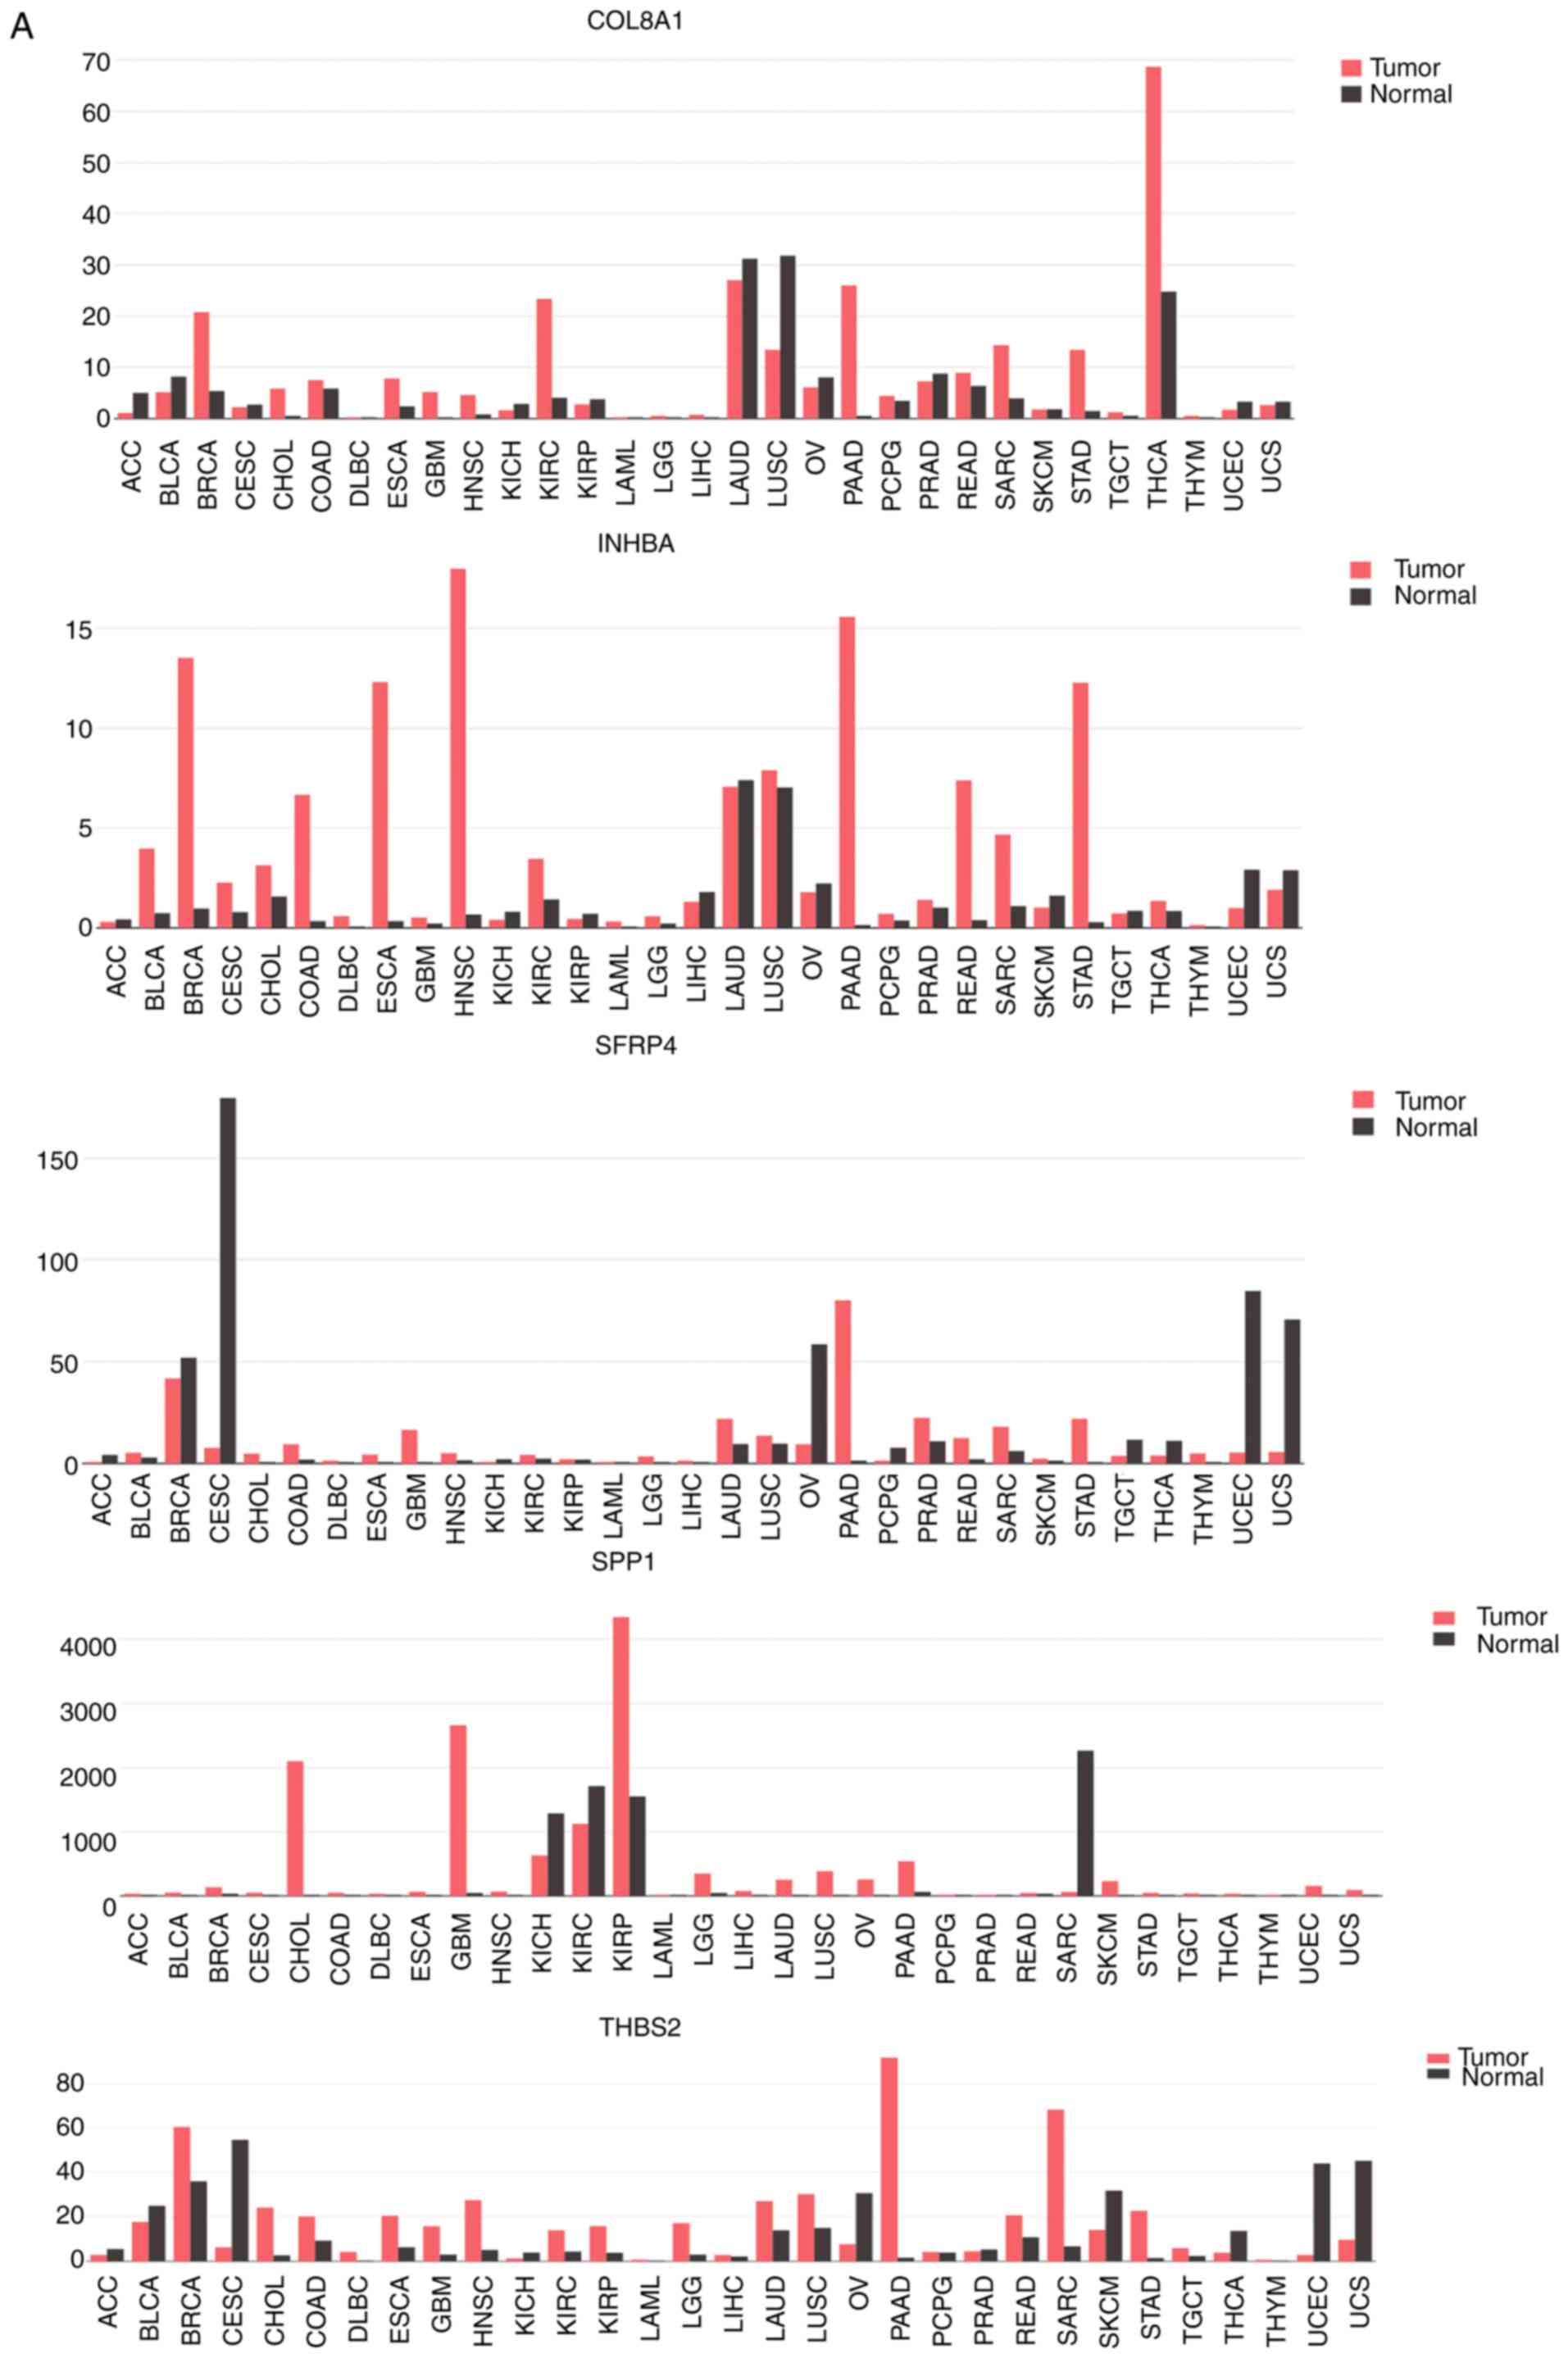
Expression levels of significantly up-
and downregulated DEMs
The GEPIA database was used to reveal the expression
levels of 10 DEMs in GC tissues. The results revealed that 9 DEMs
presented the same trend that was previously noted and only 1 DEM
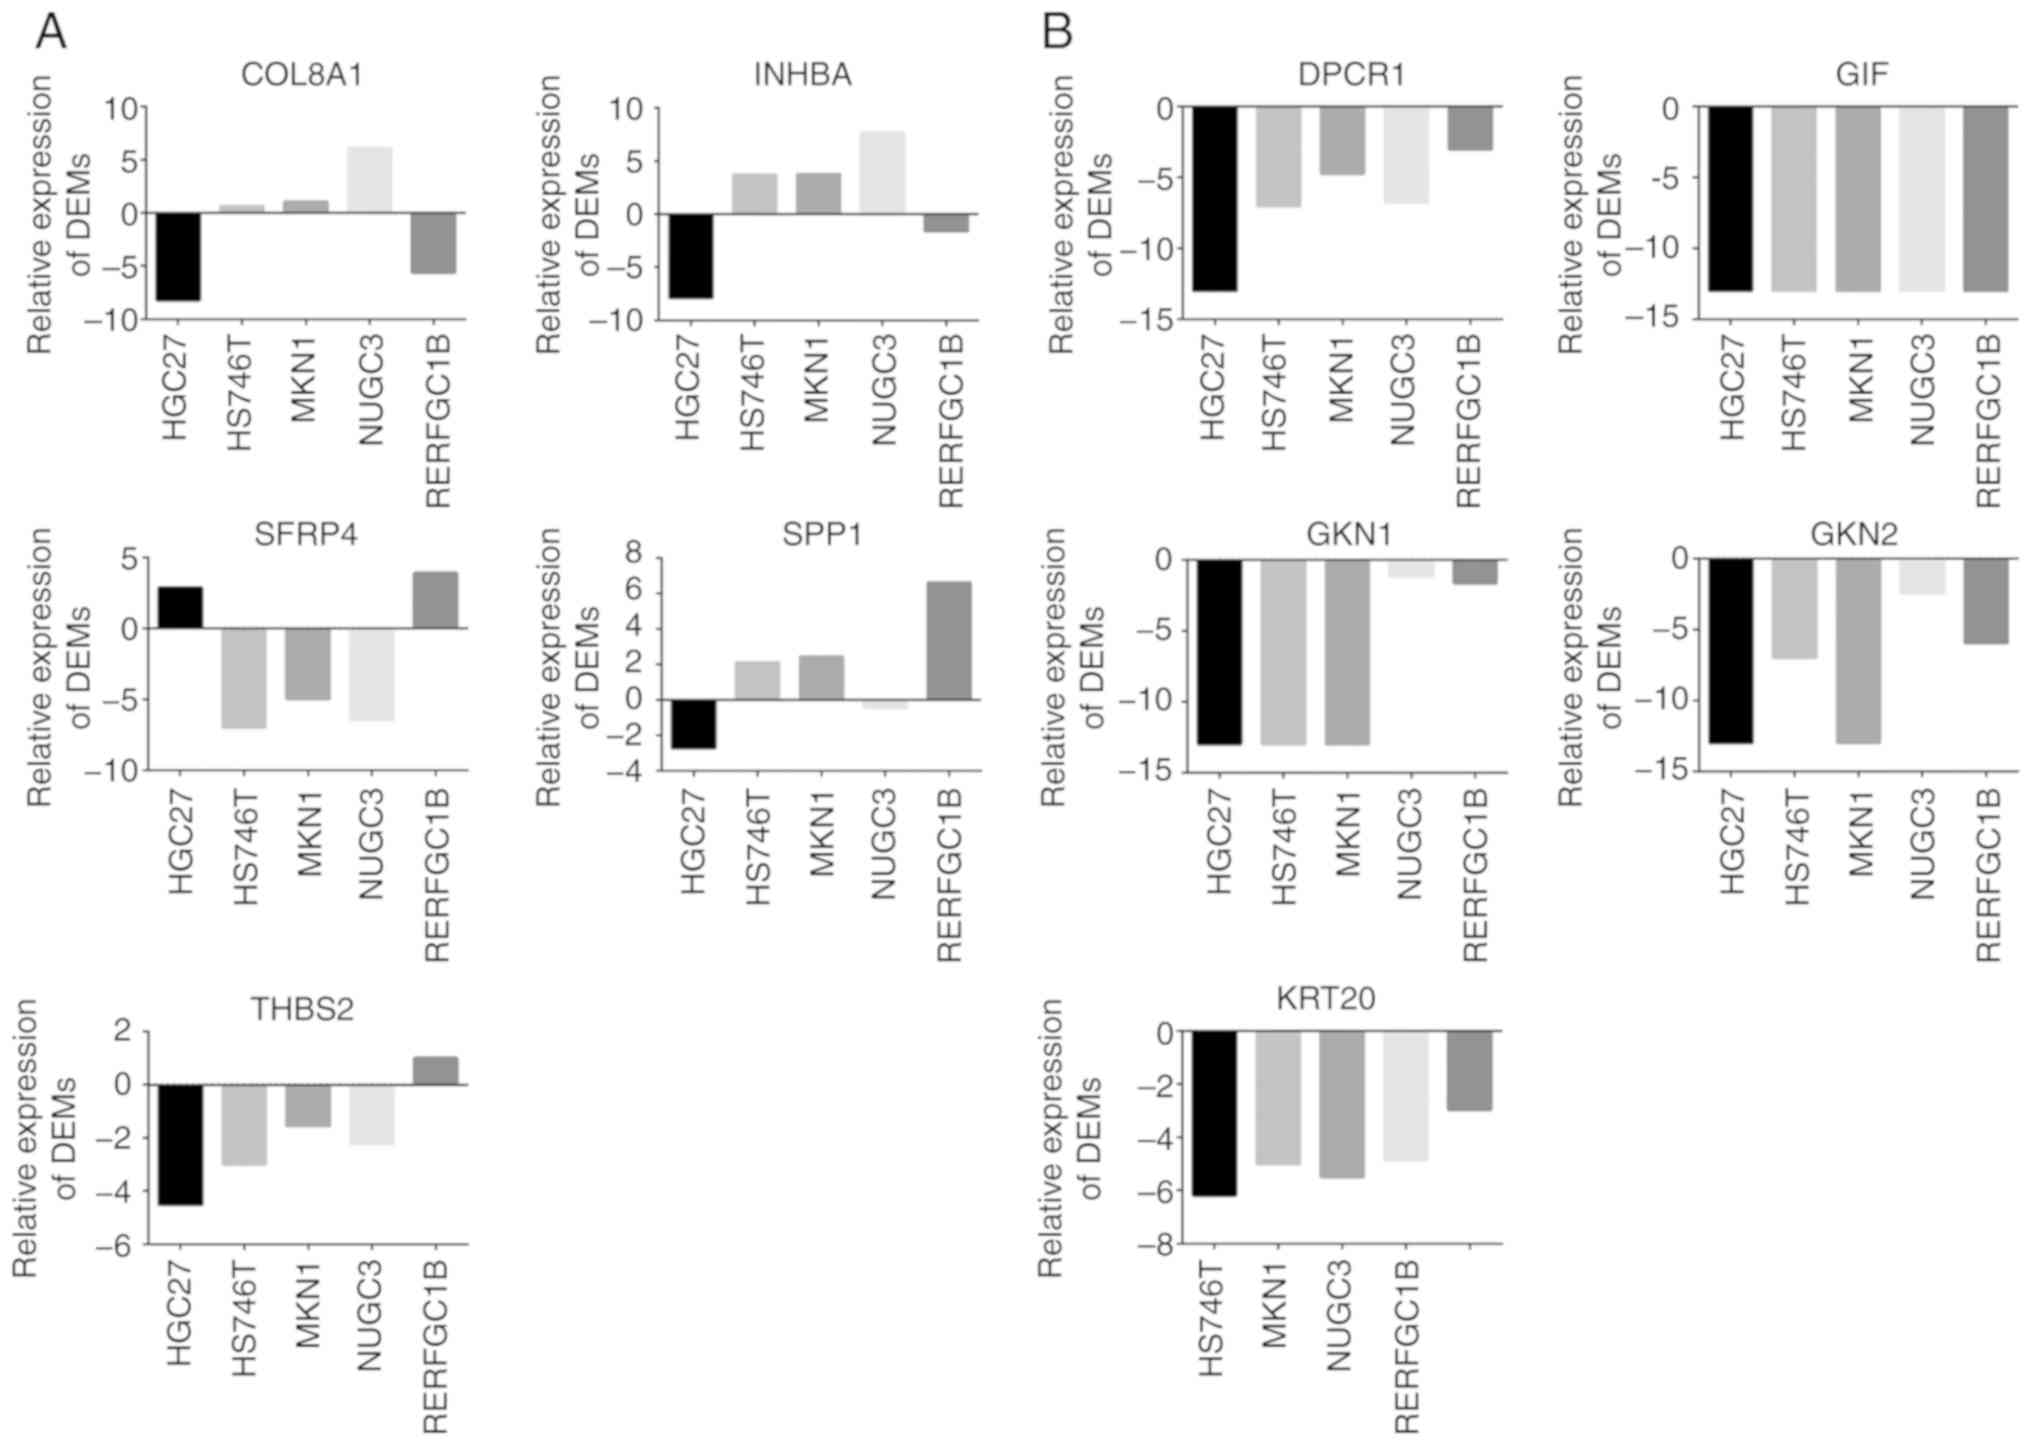
(KRT20) was contrary to the aforementioned trend (Fig. 7). The CCLE database was used to
obtain information on the expression levels of 10 DEMs in GC cell
lines. The present study then selected 5 different GC cell lines
(HGC27, HS746T, MKN1, NUGC3 and RERFGC1B) to analyze the expression
levels of the 10 DEMs (Fig. 8). For
the upregulated DEMs, the expression level was partially different
from the aforementioned results. All downregulated DEMs exhibited
the same trend observed previously in the present study.
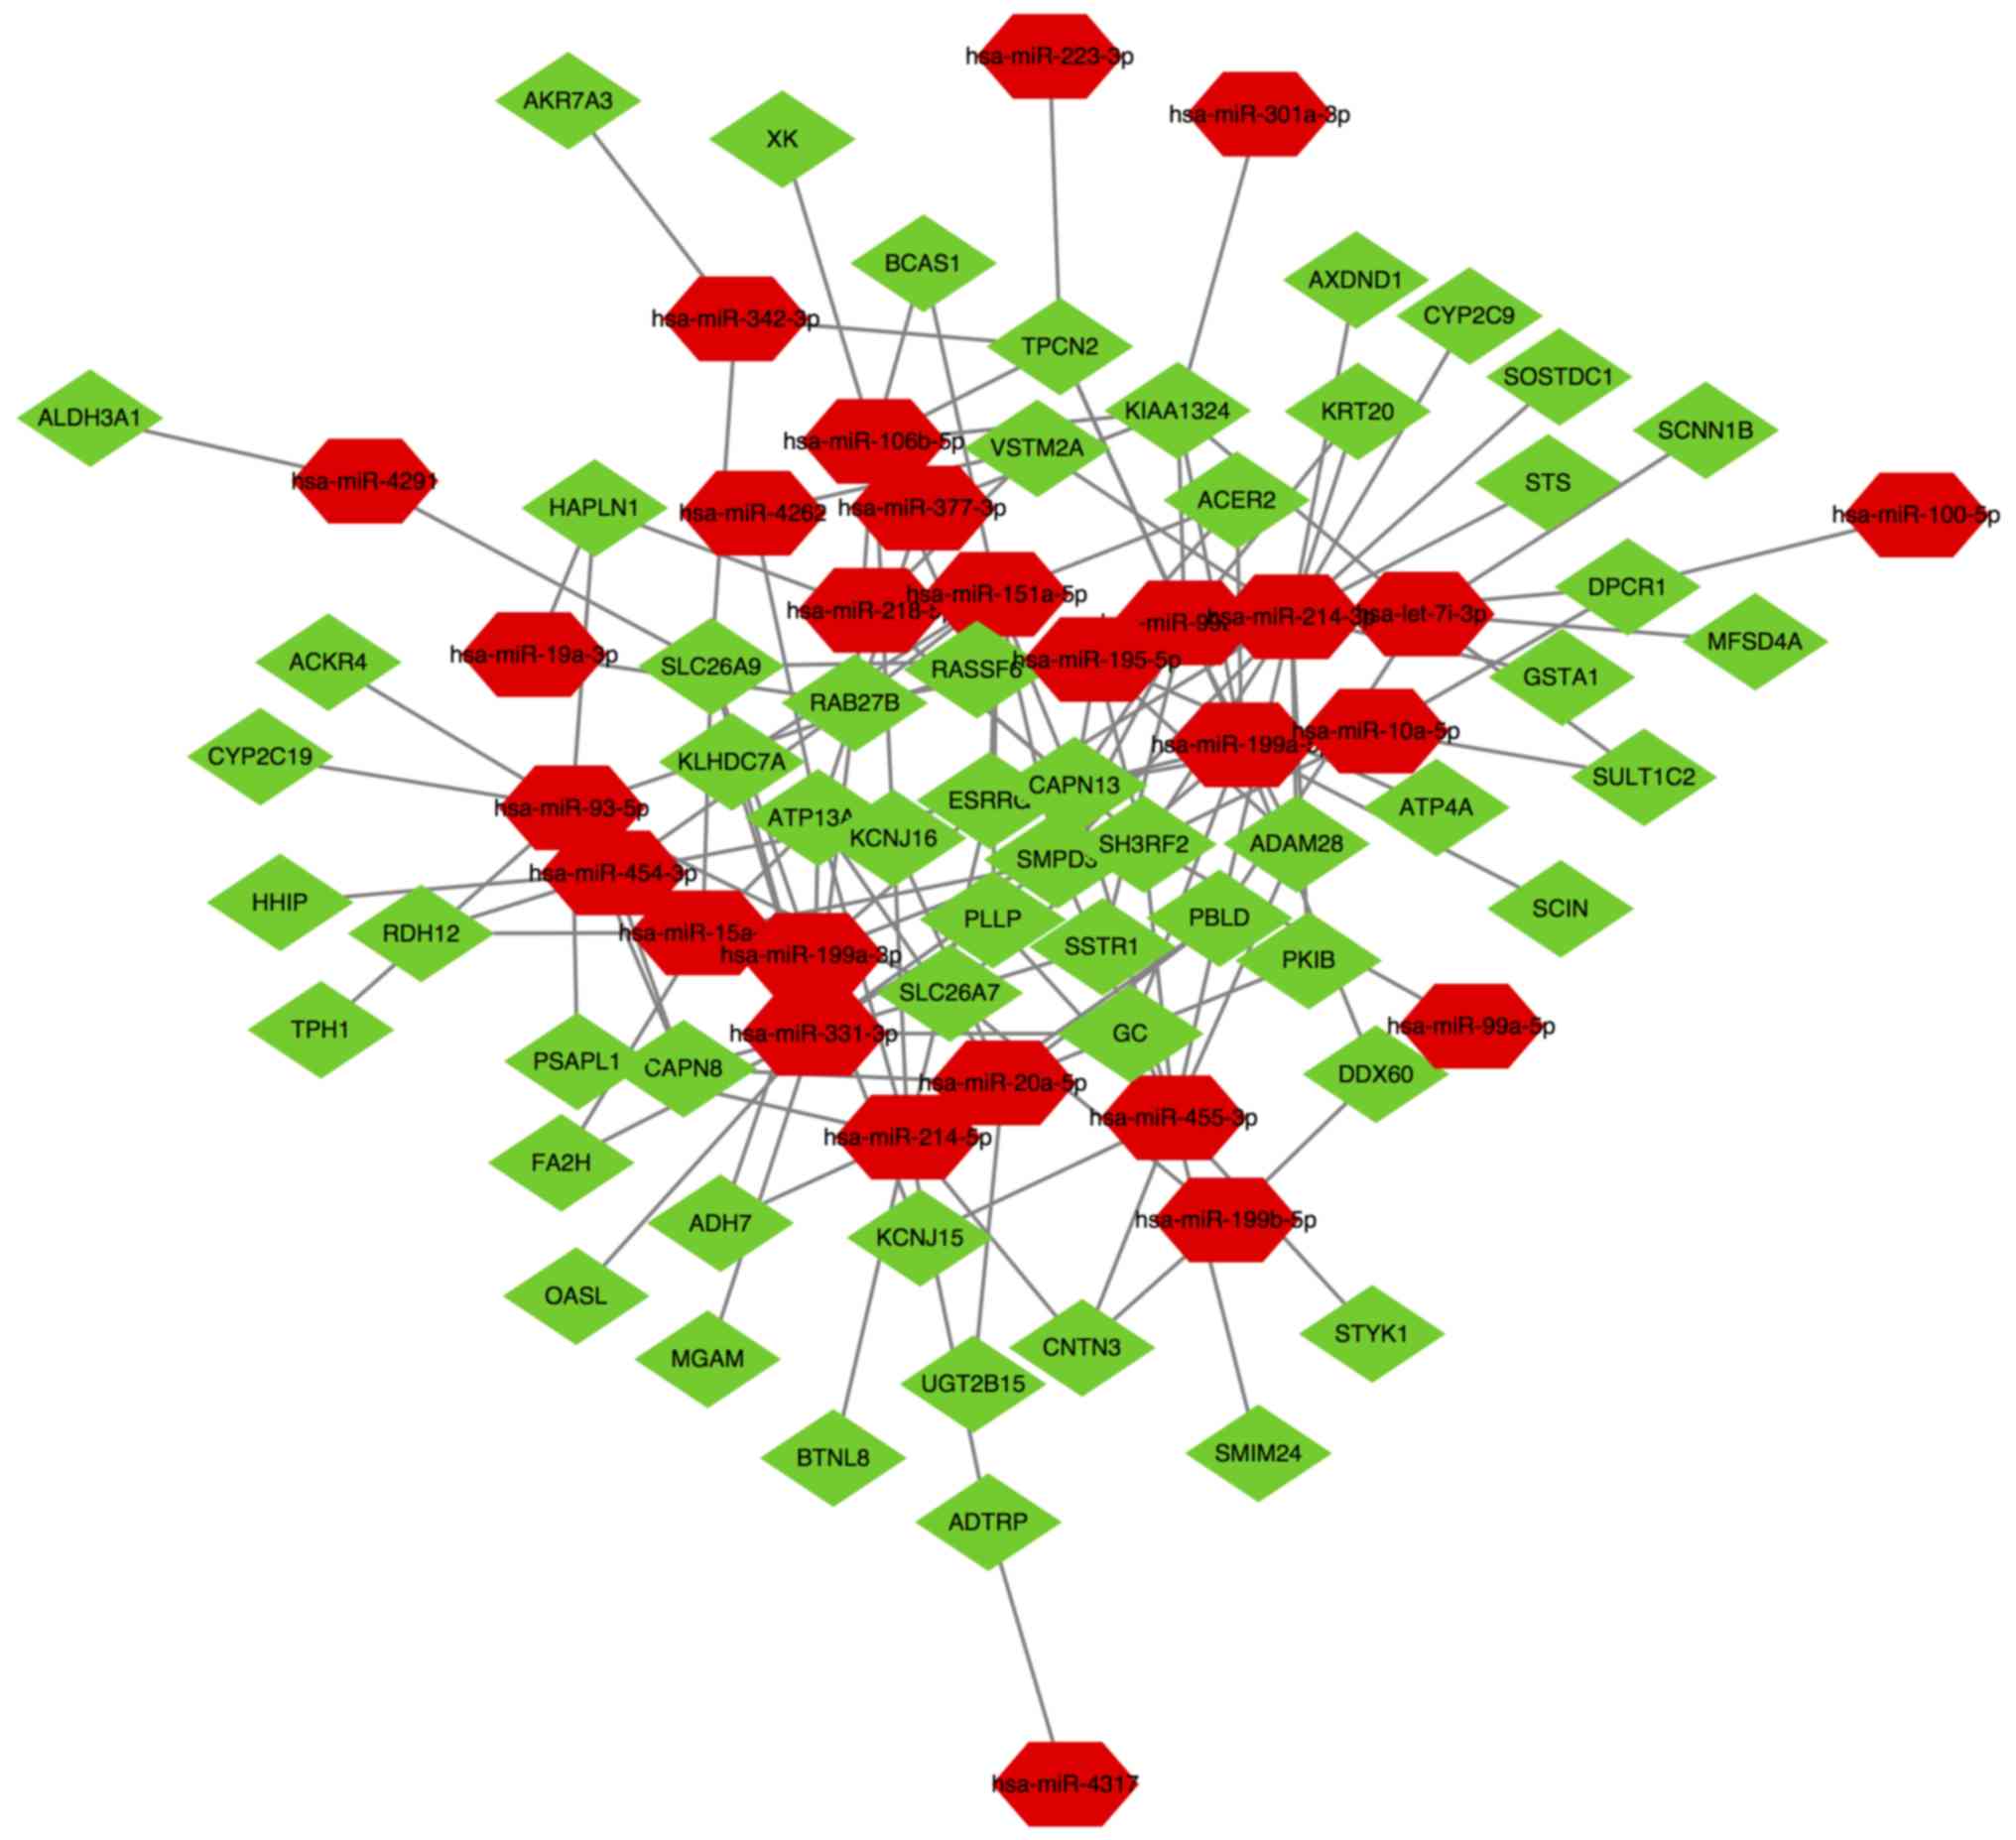
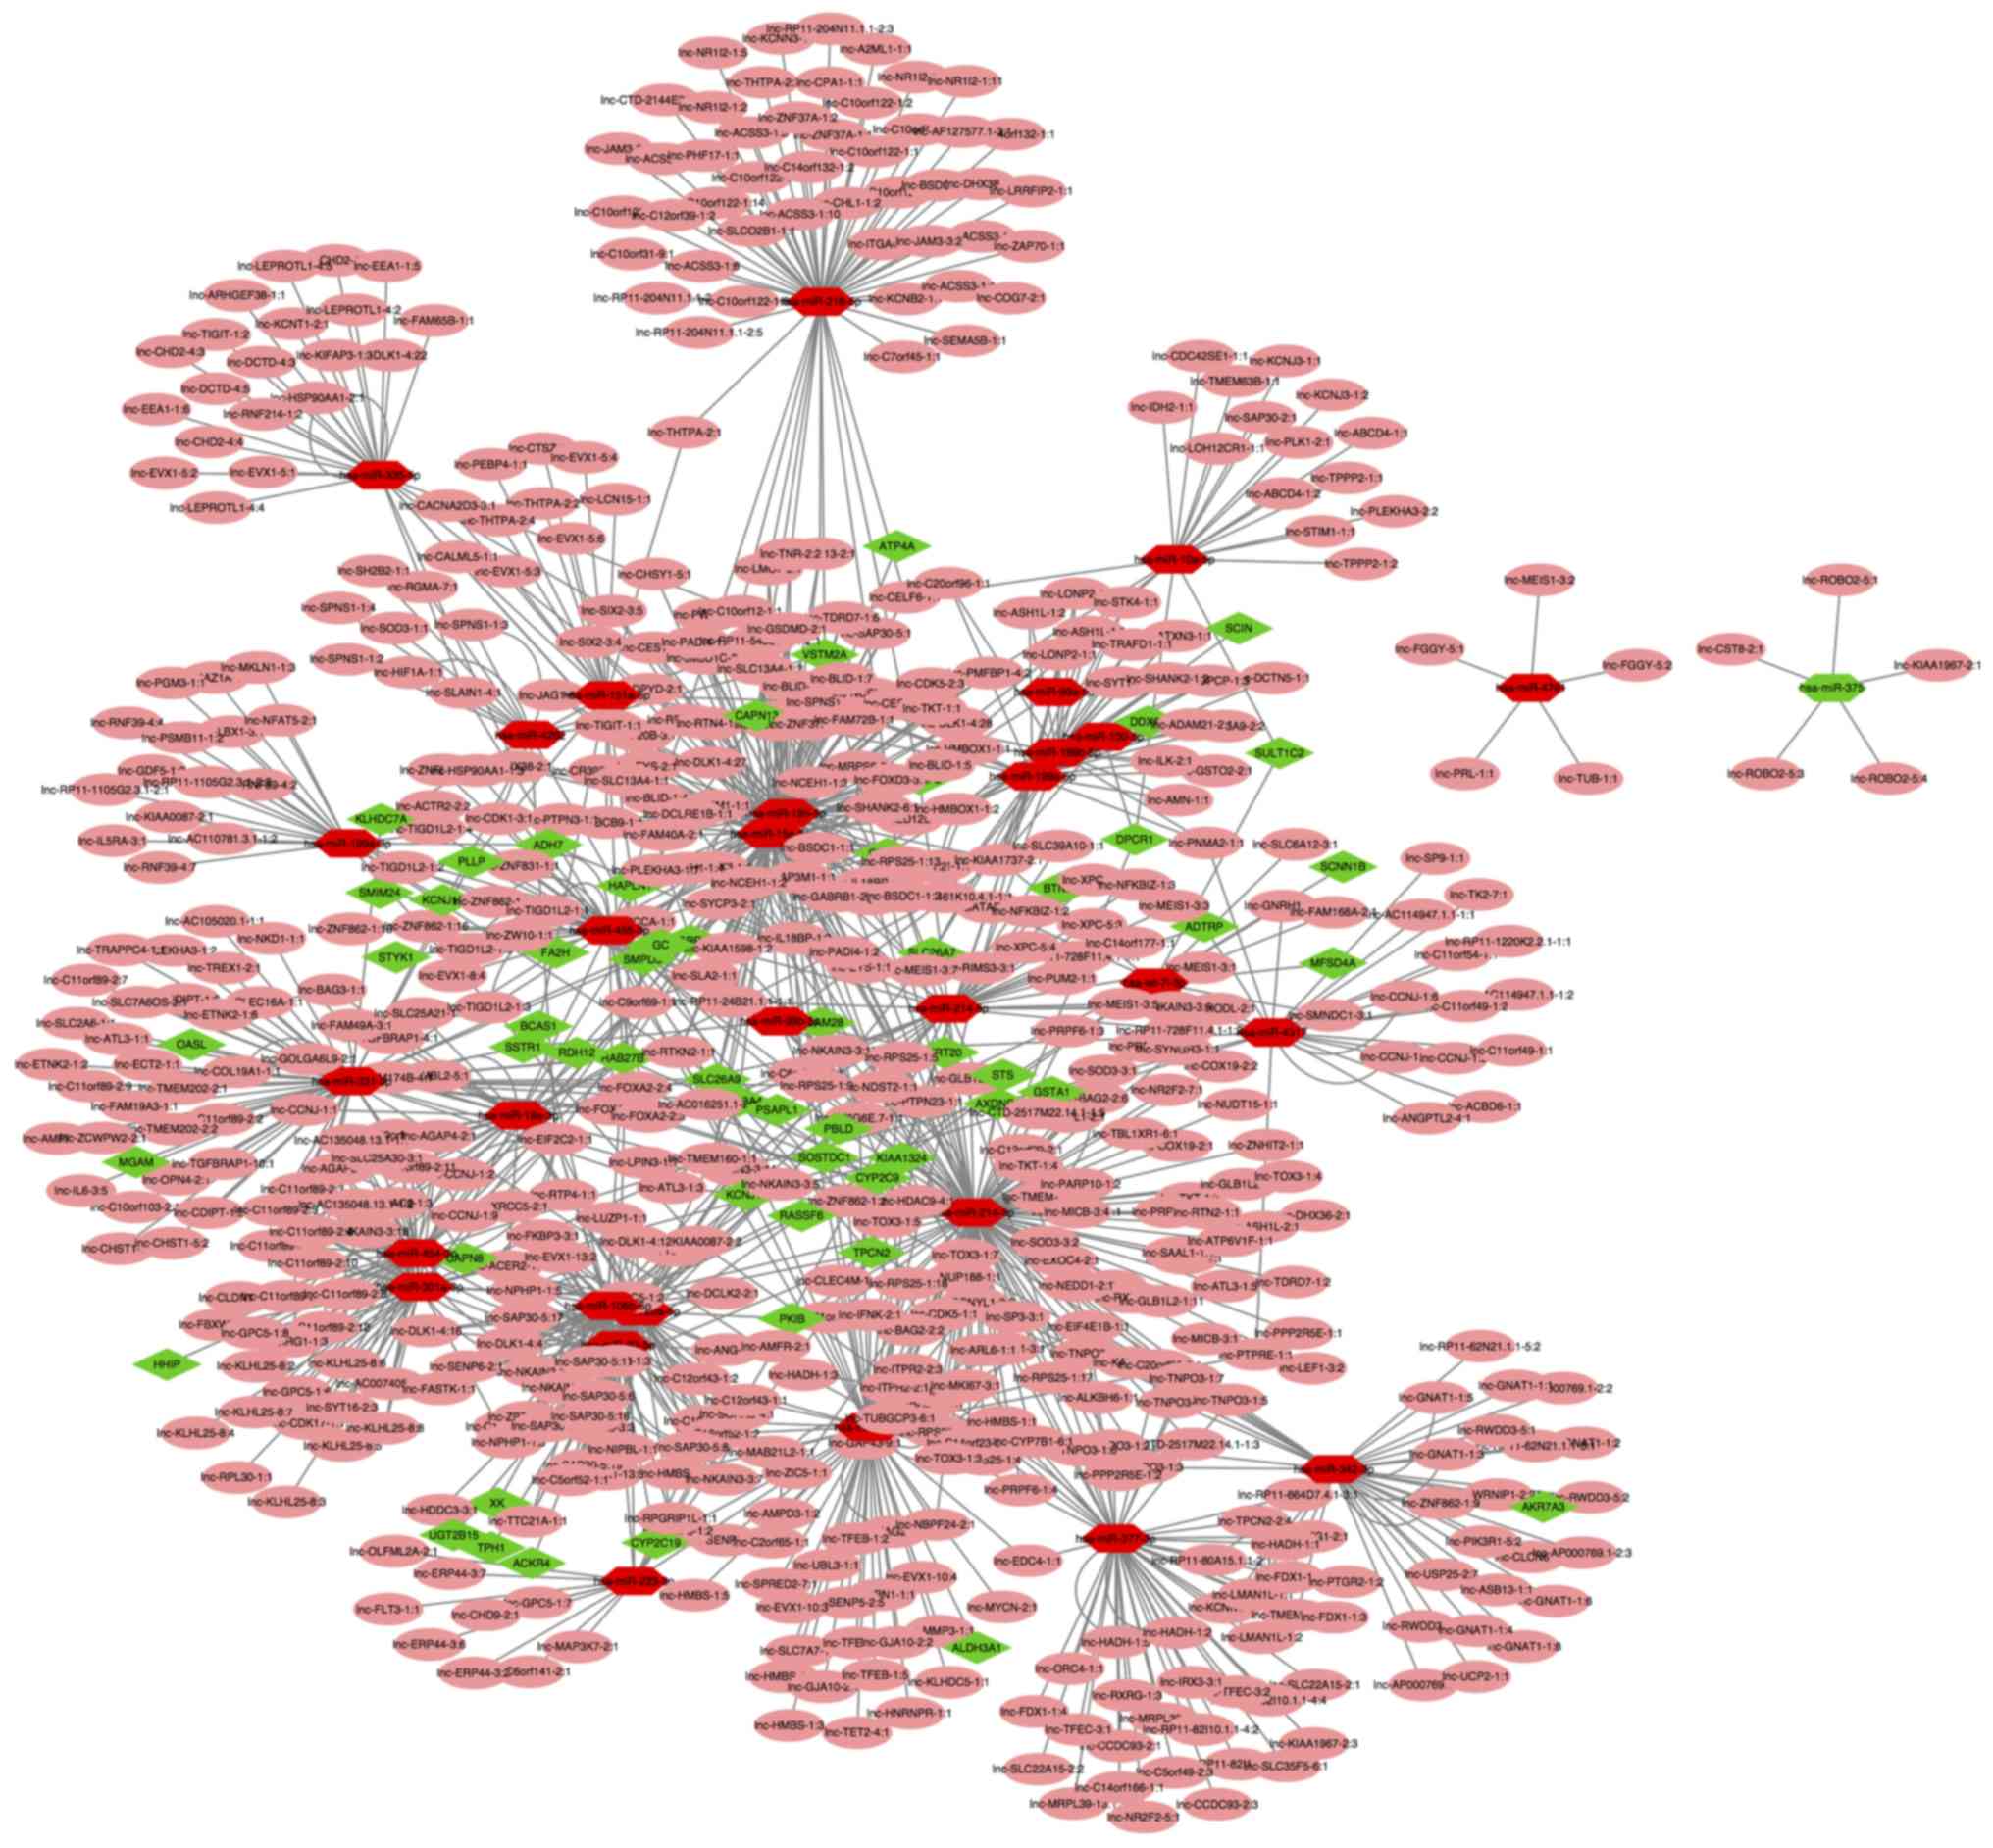
Association analysis of lncRNAs,
miRNAs and mRNAs
The network of miRNAs and their targets was composed
of 85 nodes and 145 interactions, determined using Cytoscape
software (Fig. 9). In the
lncRNA-miRNA-mRNA network, a total of 1,215 regulatory associations
were screened out (Fig. 10). Pink
circles indicated lncRNAs, hexagons indicated miRNAs, and diamonds
represented mRNAs. With regards to the colors, red nodes indicated
upregulated mRNAs and miRNAs, and green nodes represented
downregulated mRNAs and miRNAs.
Discussion
The identification of the underlying molecular
mechanism of GC is necessary to detect therapeutic targets in the
malignant transformation process for management strategies. To
date, microarrays and bioinformatics methods have been used to
analyze the process of carcinogenesis to enhance the universality
and reliability of the results (4–8). In the
present study, 158 shared DEMs (40 upregulated and 118
downregulated) were obtained from the investigation of the GSE79973
and GSE54129 datasets. One previous study used GSE79973 to identify
14 significantly downregulated genes in GC, including KRT20,
cytochrome P450 family 3 subfamily A member 5, RAB27B member RAS
oncogene family and sulfotransferase family 1C member 2 (22). The four genes were additionally
downregulated in the present study. Another previous study using
GSE54129 identified 1829 DEMs including 838 upregulated genes and
991 downregulated genes (23). The
Affy and limma packages in R software were used to select the DEMs
in previous studies. In the present study, 158 shared DEMs (40
upregulated and 118 downregulated) were selected. The GEO2R web
tool was used in the present study to identify DEMs. Although the
data was from the same database, unequal results were obtained due
to the different processing methods and filtering conditions
utilized. For the analysis of 10 hub nodes, the previous study
using the GSE54129 dataset identified 10 top hub nodes [tumor
protein p53, C-X-C motif chemokine ligand (CXCL)8, tetraspanin 4,
lysophospatidic acid receptor 2, adenylate cyclase 3,
phosphoinositide-3-kinase regulatory subunit 1, neuromedin U,
CXCL1, FOS and sphingosine-1-phosphate receptor 1] (23). FOS was also one of 10 hub genes
identified in the present study. Meanwhile, the present study
performed GO function and KEGG pathway enrichment analyses with 158
DEGs. The significant GO terms enriched by upregulated DEMs
included ‘endodermal cell differentiation’, ‘proteinaceous
extracellular’ and ‘extracellular matrix binding’ while the terms
enriched by downregulated DEMs were mainly associated with
‘regulation of cell proliferation’, ‘extracellular exosome’ and
‘iron ion binding’. The results of KEGG pathway enrichment revealed
that upregulated DEGs were mainly involved in ‘ECM-receptor
interaction’, ‘focal adhesion’ and ‘PI3K-Akt signaling pathway’,
and downregulated DEGs were associated with ‘gastric acid
secretion’, ‘retinol metabolism’ and ‘chemical carcinogenesis’.
Among the enriched pathways, the ‘PI3K/Akt signaling pathway’ has
an essential biological function in the development of
proliferation, apoptosis and invasion in various types of human
cancer, including GC (24–26). Furthermore, the PI3K/Akt signaling
pathway is commonly activated in advanced GC and serves an
important function in resistance to chemotherapy in GC (27). LY294002 has been identified as a PI3K
inhibitor and has been confirmed to suppress cell proliferation and
enhance apoptosis by downregulating VEGF, matrix metalloproteinase
(MMP)-2 and MMP-9 in GC (28).
In the constructed PPI network, there were 129 nodes
and 572 interactions. The top 10 hub genes (JUN, MAPK3, TGFB1, FOS,
IL8, MAPK1, RELA, IRF7, ISG15 and VEGFA) were evaluated by degree
following Cytohubba analysis. Then, the DAVID database was used to
elucidate the specific signaling pathways that the 158 DEMs and 10
top hub genes were involved in. The results revealed that 158 DEMs
were involved in 17 KEGG pathways (Table IV). Amongst these pathways, 4 KEGG
pathways (bta04151: PI3K-Akt signaling pathway, bta04510: Focal
adhesion, bta05146: Amoebiasis and bta05144: Malaria) were also
associated with the 10 hub genes (Table
V). Among four common KEGG pathways, PI3K-Akt signaling pathway
is closely associated with the function of miRNAs. miR-15a-5p (an
upregulated DEMi) regulated granulosa cell proliferation by
activating the PI3K-Akt-mechanistic target of rapamycin kinase
(mTOR) signaling pathway (29).
miR-4262 (an upregulated DEMi) regulates chondrocyte viability,
apoptosis, autophagy by targeting sirtuin 1 and activating the
PI3K/Akt/mTOR signaling pathway in rats with osteoarthritis
(30). miR-375 (a downregulated
DEMi) functions as a tumor suppressor in osteosarcoma and
colorectal cancer by targeting
phosphatidylinositol-4,5-bisphosphate 3-kinase catalytic subunit α
(31,32), which indicates that miR-375 may be
associated with the PI3K-Akt signaling pathway. Furthermore,
survival analysis of the top 10 hub genes was performed using the
publicly available database Kaplan-Meier Plotter. The Kaplan-Meier
curves indicated that the higher expression of MAPK3, TGFB1, RELA,
IRF7 and VEGFA were associated with poor survival in GC. By
contrast, a lower expression of JUN, FOS, IL8, ISG15 and MAPK1 were
associated with poor survival in GC. Similar to the present study,
a previous study applied bioinformatics analysis to identify the
key genes in NCI-N87 GC cells exposed to quercetin. A PPI network
was constructed, and hub genes were identified according to degree
level, including FOS (degree=12) and JUN (degree=11) (33). One genome-wide search was performed
to identify the genes epigenetically silenced by CpG methylation in
GC. Three GC cell lines (SNU-1, SNU-601 and SNU-719) treated with
5Aza-Dc were analyzed to identify 143 associated genes by
microarrays. Among the associated genes, IRF7 exhibited promoter
hypermethylation in one or more gastric cancer cell lines (34). As the intracellular signal
transduction pathway, the MAPK cascade serves an important function
in the progression of various tumor types. MAPK1 was upregulated in
GC tissues and participated in the proliferation and cell migration
of GC cells. In addition, miRNAs may regulate the expression of
MAPK1 and were therefore involved in the development and
progression of GC (35,36). In the analysis of patients with
resected GC, the results of patient prognosis analysis indicated
that MAPK3/1 expression was an independent prognostic marker for
patients with resected GC (37). The
NF-κB signaling pathway serves an important function in the
biological process of GC, including cell migration, cell invasion
and cell apoptosis. As a basic component of the NF-κB signaling
pathway, RELA has been reported to be activated in the progression
of GC. The results of a study by Huang et al (38) revealed that RELA was upregulated in
GC tumor tissues and GC cell lines compared with control groups.
Furthermore, the upregulation of RELA was significantly correlated
with poor OS in the prognosis of 876 patients with GC (P<0.001),
which was consistent with the results of the present study. As an
inflammatory factor, IL-6 serves an important function in the
process of various types of cancer. Previous studies have revealed
that IL-6 is involved in the regulation of invasion and prognosis
in GC (39,40). Mechanistically, mesenchymal stem
cells promote the activation of neutrophils through the IL-6-STAT3
axis to mediate GC progression (41). IL8 has been reported to be involved
in the development of GC. A previous study demonstrated that IL-8
was upregulated in GC cells and enhanced cell proliferation,
invasion and migration in GC (42).
In addition, IL8 served as an inflammatory cytokine serving an
important function in the angiogenesis of GC (43). Furthermore, a previous study also
conducted a meta-analysis to investigate the potential functions of
IL-6 and IL-8 polymorphisms in the development of GC. The results
revealed that IL-6 rs1800796 and IL-8 rs4073 polymorphisms may
serve as genetic biomarkers of GC in an Asian population (44). A number of studies have indicated
that VEGFA functions as a direct target of miRNAs to participate in
the tumor progression of GC (45,46).
Furthermore, VEGFA may also be a predictive biomarker for
antiangiogenic therapy in GC, which is consistent with the present
bioinformatics results (47). A
previous study also conducted analysis to reveal the correlation
between polymorphisms of TGFB1 and VEGF genes and the survival of
patients with GC. The results suggested that the TGFB1+915CG/CC and
VEGF-634CG genotypes were associated with short-term survival in
patients with GC (48).
MiRNAs serve an important function in the
downregulation of the transcription of target mRNAs by binding to
complementary 3′-untranslated regions of genes (49). An accumulating body of evidence has
demonstrated the association between miRNAs and targets in tumor
progression in various types of cancer. For example, it has been
confirmed that miR-218 is a tumor suppressor in glioblastoma cells
by directly targeting E2F transcription factor 2 (50). miR-155 has also been demonstrated to
enhance cell growth and invasion by regulating transforming growth
factor-β receptor 2 (51). In the
present study, a total of 30 upregulated miRNAs and 1 downregulated
miRNA were identified between the GC and control samples using
systematic analysis. Then, a network of miRNAs and targets was
constructed using the miRwalk database and Cytoscape software,
which consisted of 124 nodes and 490 interactions. According to the
results of the present analysis, miR-375 was downregulated in GC
tissues when compared with the NC group. Similarly, a number of
studies have confirmed the function of miR-375 as a tumor
suppressor in GC. MiR-375 has been reported to be involved in cell
proliferation, migration and invasion by regulating janus kinase 2
and macrophage stimulating 1 receptor (52,53).
MiR-375 serves as a controller of the Hippo signaling pathway by
targeting the Yes associated protein 1-TEA domain transcription
factor 4-cellular communication network factor 2 axis (54). A previous study indicated that
miR19a3p is upregulated in GC and promotes epithelialmesenchymal
transition via the PI3K/Akt signaling pathway (55). Furthermore, miR-19a-3P has been
confirmed to mediate metastasis by directly targeting MAX
dimerization protein 1 in GC cells (56). Emerging evidence has indicated that
miR-214-3p serves an essential oncogenic function and is correlated
with distant metastasis as a novel biomarker of GC (57). In addition, miR-214-3p negatively
regulates phosphatase and tensin homolog and is involved in GC cell
proliferation, migration and invasion (58,59).
Previous studies have suggested that lncRNAs
participate in the development of cell growth, metastasis and
invasion progression in various types of cancer (60–62).
LncRNAs have also been demonstrated to function as miRNA sponges
that are involved in a variety of cancer types. For example, the
lncRNA XIST has been demonstrated to function as a molecular sponge
of miR-101 to modulate enhancer of zeste 2 polycomb repressive
complex 2 subunit expression in GC (63). LncRNA-regulator of reprogramming
regulates the expression of miR-145 and ADP ribosylation factor 6
by functioning as a sponge in triple-negative breast cancer
(64). Therefore, it is essential to
investigate the regulatory mechanism underlying the action of
lncRNAs, miRNAs and mRNAs. In the present study, the lncRNASNP
database was used to perform prediction analysis of DEMis-lncRNA
pairs. In addition, a lncRNA-miRNA-mRNA network was constructed
using the combination of DEMis-target pairs and DEMis-lncRNA pairs,
which included 1,215 regulatory associations. Altogether, these
results provide a better understanding of the potential functions
of lncRNA, miRNA and mRNA in GC.
However, there were a number of limitations in the
present analysis. Firstly, the present study lacked experimental
evidence on the expression levels and biological functions of
genes. Further detection and experiments on the associated genes in
larger sample sizes should be validated in future studies.
Secondly, lncRNAs were only predicted using the lncRNASNP database
without the investigation of expression profile databases, which
are different from mRNAs and miRNAs. In order to increase the
credibility, GC-associated lncRNAs require further analysis in the
future.
In conclusion, the present study analyzed 158 DEMs,
31 DEMis and the top 10 hub genes in GC from multiple profile
datasets by integrated bioinformatical analysis. In addition,
lncRNA-miRNA-mRNA regulatory networks were established to gain a
better understanding of the underlying molecular mechanism of GC.
These results provide an effective foundation for further research
on potential target therapy strategies in GC.
Acknowledgements
Not applicable.
Funding
The present study was supported in part by the
Department of Gastrointestinal Endoscopy, First Affiliated Hospital
of China Medical University (Shenyang, China).
Availability of data and materials
The datasets used and/or analyzed during the present
study are available from the corresponding author on reasonable
request.
Authors' contributions
MS designed the study. XM, YM, HZ and HJZ performed
the research. XM analyzed the data and wrote the paper.
Ethics approval and consent to
participate
Not applicable
Patient consent for publication
Not applicable
Competing interests
The authors declare that they have no competing
interests.
Glossary
Abbreviations
Abbreviations:
|
BP
|
biological processes
|
|
CC
|
cellular component
|
|
DAVID
|
Database for Annotation, Visualization
and Integrated Discovery
|
|
DEM
|
differentially expressed mRNA
|
|
DEMi
|
differentially expressed miRNA
|
|
GC
|
gastric cancer
|
|
GEO
|
Gene Expression Omnibus
|
|
GO
|
Gene ontology
|
|
KEGG
|
Kyoto Encyclopedia of Genes and
Genomes
|
|
lncRNA
|
long non-coding RNA
|
|
MF
|
molecular function
|
|
miRNA
|
microRNA
|
|
OS
|
overall survival
|
|
PPI
|
protein-protein interaction
network
|
|
STRING
|
Search Tool for the Retrieval of
Interacting Genes
|
References
|
1
|
Siegel RL, Miller KD and Jemal A: Cancer
statistics, 2016. CA Cancer J Clin. 66:7–30. 2016. View Article : Google Scholar : PubMed/NCBI
|
|
2
|
Karimi P, Islami F, Anandasabapathy S,
Freedman ND and Kamangar F: Gastric cancer: Descriptive
epidemiology, risk factors, screening, and prevention. Cancer
Epidemiol Biomarkers Prev. 23:700–713. 2014. View Article : Google Scholar : PubMed/NCBI
|
|
3
|
Wang J, Guo W, Wu Q, Zhang R and Fang J:
Impact of combination epidural and general anesthesia on the
long-term survival of gastric cancer patients: A retrospective
study. Med Sci Monit. 22:2379–2385. 2016. View Article : Google Scholar : PubMed/NCBI
|
|
4
|
Long J, Zhang Z, Liu Z, Xu Y and Ge C:
Identification of genes and pathways associated with pancreatic
ductal adenocarcinoma by bioinformatics analyses. Oncol Lett.
11:1391–1397. 2016. View Article : Google Scholar : PubMed/NCBI
|
|
5
|
He JH, Han ZP, Zou MX, Wang L, Lv YB, Zhou
JB, Cao MR and Li YG: Analyzing the LncRNA, miRNA, and mRNA
regulatory network in prostate cancer with bioinformatics software.
J Comput Biol. 25:146–157. 2018. View Article : Google Scholar : PubMed/NCBI
|
|
6
|
Wang H, Luo J, Liu C, Niu H, Wang J, Liu
Q, Zhao Z, Xu H, Ding Y, Sun J and Zhang Q: Investigating MicroRNA
and transcription factor co-regulatory networks in colorectal
cancer. BMC Bioinformatics. 18:3882017. View Article : Google Scholar : PubMed/NCBI
|
|
7
|
Guo Y, Bao Y, Ma M and Yang W:
Identification of key candidate genes and pathways in colorectal
cancer by integrated bioinformatical analysis. Int J Mol Sci.
18(pii): E7222017. View Article : Google Scholar : PubMed/NCBI
|
|
8
|
Piao J, Sun J, Yang Y, Jin T, Chen L and
Lin Z: Target gene screening and evaluation of prognostic values in
non-small cell lung cancers by bioinformatics analysis. Gene.
647:306–311. 2018. View Article : Google Scholar : PubMed/NCBI
|
|
9
|
Jiang H, Ma R, Zou S, Wang Y, Li Z and Li
W: Reconstruction and analysis of the lncRNA-miRNA-mRNA network
based on competitive endogenous RNA reveal functional lncRNAs in
rheumatoid arthritis. Mol Biosyst. 13:1182–1192. 2017. View Article : Google Scholar : PubMed/NCBI
|
|
10
|
Edgar R, Domrachev M and Lash AE: Gene
expression omnibus: NCBI gene expression and hybridization array
data repository. Nucleic Acids Res. 30:207–210. 2002. View Article : Google Scholar : PubMed/NCBI
|
|
11
|
Pathan M, Keerthikumar S, Ang CS, Gangoda
L, Quek CY, Williamson NA, Mouradov D, Sieber OM, Simpson RJ, Salim
A, et al: FunRich: An open access standalone functional enrichment
and interaction network analysis tool. Proteomics. 15:2597–2601.
2015. View Article : Google Scholar : PubMed/NCBI
|
|
12
|
Davis S and Meltzer PS: GEOquery: A bridge
between the gene expression omnibus (GEO) and BioConductor.
Bioinformatics. 23:1846–1847. 2007. View Article : Google Scholar : PubMed/NCBI
|
|
13
|
Szklarczyk D, Gable AL, Lyon D, Junge A,
Wyder S, Huerta-Cepas J, Simonovic M, Doncheva NT, Morris JH, Bork
P, et al: STRING v11: Protein-protein association networks with
increased coverage, supporting functional discovery in genome-wide
experimental datasets. Nucleic Acids Res. 47(D1): D607–D613. 2019.
View Article : Google Scholar : PubMed/NCBI
|
|
14
|
Shannon P, Markiel A, Ozier O, Baliga NS,
Wang JT, Ramage D, Amin N, Schwikowski B and Ideker T: Cytoscape: A
software environment for integrated models of biomolecular
interaction networks. Genome Res. 13:2498–2504. 2003. View Article : Google Scholar : PubMed/NCBI
|
|
15
|
Bader GD and Hogue CW: An automated method
for finding molecular complexes in large protein interaction
networks. BMC Bioinformatics. 4:22003. View Article : Google Scholar : PubMed/NCBI
|
|
16
|
Nagy Á, Lánczky A, Menyhárt O and Győrffy
B: Validation of miRNA prognostic power in hepatocellular carcinoma
using expression data of independent datasets. Sci Rep. 8:92272018.
View Article : Google Scholar : PubMed/NCBI
|
|
17
|
Tang Z, Li C, Kang B, Gao G, Li C and
Zhang Z: GEPIA: A web server for cancer and normal gene expression
profiling and interactive analyses. Nucleic Acids Res 45 (W1).
W98–W102. 2017. View Article : Google Scholar
|
|
18
|
Ghandi M, Huang FW, Jané-Valbuena J,
Kryukov GV, Lo CC, McDonald ER III, Barretina J, Gelfand ET,
Bielski CM, Li H, et al: Next-generation characterization of the
cancer cell line encyclopedia. Nature. 569:503–508. 2019.
View Article : Google Scholar : PubMed/NCBI
|
|
19
|
Dweep H, Sticht C, Pandey P and Gretz N:
miRWalk-database: Prediction of possible miRNA binding sites by
‘walking’ the genes of three genomes. J Biomed Inform. 44:839–847.
2011. View Article : Google Scholar : PubMed/NCBI
|
|
20
|
Dweep H and Gretz N: miRWalk2.0: A
comprehensive atlas of microRNA-target interactions. Nat methods.
12:6972015. View Article : Google Scholar : PubMed/NCBI
|
|
21
|
Miao YR, Liu W, Zhang Q and Guo AY:
lncRNASNP2: An updated database of functional SNPs and mutations in
human and mouse lncRNAs. Nucleic Acids Res. 46(D1): D276–D280.
2018. View Article : Google Scholar : PubMed/NCBI
|
|
22
|
He J, Jin Y, Chen Y, Yao HB, Xia YJ, Ma
YY, Wang W and Shao QS: Downregulation of ALDOB is associated with
poor prognosis of patients with gastric cancer. Onco Targets Ther.
9:6099–6109. 2016. View Article : Google Scholar : PubMed/NCBI
|
|
23
|
Qi W, Sun L, Liu N, Zhao S, Lv J and Qiu
W: Tetraspanin family identified as the central genes detected in
gastric cancer using bioinformatics analysis. Mol Med Rep.
18:3599–3610. 2018.PubMed/NCBI
|
|
24
|
Liu Q, Dong HW, Sun WG, Liu M, Ibla JC,
Liu LX, Parry JW, Han XH, Li MS and Liu JR: Apoptosis initiation of
β-ionone in SGC-7901 gastric carcinoma cancer cells via a PI3K-AKT
pathway. Arch Toxicol. 87:481–490. 2013. View Article : Google Scholar : PubMed/NCBI
|
|
25
|
Li GQ, Xie J, Lei XY and Zhang L:
Macrophage migration inhibitory factor regulates proliferation of
gastric cancer cells via the PI3K/Akt pathway. World J
Gastroenterol. 15:5541–5548. 2009. View Article : Google Scholar : PubMed/NCBI
|
|
26
|
Ye B, Jiang LL, Xu HT, Zhou DW and Li ZS:
Expression of PI3K/AKT pathway in gastric cancer and its blockade
suppresses tumor growth and metastasis. Int J Immunopathol
Pharmacol. 25:627–636. 2012. View Article : Google Scholar : PubMed/NCBI
|
|
27
|
Ang KL, Shi DL, Keong WW and Epstein RJ:
Upregulated Akt signaling adjacent to gastric cancers: Implications
for screening and chemoprevention. Cancer Lett. 225:53–59. 2005.
View Article : Google Scholar : PubMed/NCBI
|
|
28
|
Xing CG, Zhu BS, Fan XQ, Liu HH, Hou X,
Zhao K and Qin ZH: Effects of LY294002 on the invasiveness of human
gastric cancer in vivo in nude mice. World J Gastroenterol.
15:5044–5052. 2009. View Article : Google Scholar : PubMed/NCBI
|
|
29
|
Zhang K, Zhong W, Li WP, Chen ZJ and Zhang
C: miR-15a-5p levels correlate with poor ovarian response in human
follicular fluid. Reproduction. 154:483–496. 2017. View Article : Google Scholar : PubMed/NCBI
|
|
30
|
Sun W, Li Y and Wei S: miR-4262 regulates
chondrocyte viability, apoptosis, autophagy by targeting SIRT1 and
activating PI3K/AKT/mTOR signaling pathway in rats with
osteoarthritis. Exp Ther Med. 15:1119–1128. 2018.PubMed/NCBI
|
|
31
|
Shi ZC, Chu XR, Wu YG, Wu JH, Lu CW, Lü
RX, Ding MC and Mao NF: MicroRNA-375 functions as a tumor
suppressor in osteosarcoma by targeting PIK3CA. Tumour Biol.
36:8579–8584. 2015. View Article : Google Scholar : PubMed/NCBI
|
|
32
|
Wang Y, Tang Q, Li M, Jiang S and Wang X:
MicroRNA-375 inhibits colorectal cancer growth by targeting PIK3CA.
Biochem Biophys Res Commun. 444:199–204. 2014. View Article : Google Scholar : PubMed/NCBI
|
|
33
|
Zeng Y, Shen Z, Gu W and Wu M:
Bioinformatics analysis to identify action targets in NCI-N87
gastric cancer cells exposed to quercetin. Pharm Biol. 56:393–398.
2018. View Article : Google Scholar : PubMed/NCBI
|
|
34
|
Jee CD, Kim MA, Jung EJ, Kim J and Kim WH:
Identification of genes epigenetically silenced by CpG methylation
in human gastric carcinoma. Eur J Cancer. 45:1282–1293. 2009.
View Article : Google Scholar : PubMed/NCBI
|
|
35
|
Xiong HL, Zhou SW, Sun AH, He Y, Li J and
Yuan X: MicroRNA-197 reverses the drug resistance of
fluorouracil-induced SGC7901 cells by targeting mitogen-activated
protein kinase 1. Mol Med Rep. 12:5019–5025. 2015. View Article : Google Scholar : PubMed/NCBI
|
|
36
|
Hu L, Wu H, Wan X, Liu L, He Y, Zhu L, Liu
S, Yao H3 and Zhu Z: MicroRNA-585 suppresses tumor proliferation
and migration in gastric cancer by directly targeting MAPK1.
Biochem Biophys Res Commun. 499:52–58. 2018. View Article : Google Scholar : PubMed/NCBI
|
|
37
|
Kim JG, Lee SJ, Chae YS, Kang BW, Lee YJ,
Oh SY, Kim MC, Kim KH and Kim SJ: Association between
phosphorylated AMP-activated protein kinase and MAPK3/1 expression
and prognosis for patients with gastric cancer. Oncology. 85:78–85.
2013. View Article : Google Scholar : PubMed/NCBI
|
|
38
|
Huang T, Kang W, Zhang B, Wu F, Dong Y,
Tong JH, Yang W, Zhou Y, Zhang L, Cheng AS, et al: miR-508-3p
concordantly silences NFKB1 and RELA to inactivate canonical NF-κB
signaling in gastric carcinogenesis. Mol Cancer. 15:92016.
View Article : Google Scholar : PubMed/NCBI
|
|
39
|
Xia Y, Khoi PN, Yoon HJ, Lian S, Joo YE,
Chay KO, Kim KK and Jung YD: Piperine inhibits IL-1β-induced IL-6
expression by suppressing p38 MAPK and STAT3 activation in gastric
cancer cells. Mol Cell Biochem. 398:147–156. 2015. View Article : Google Scholar : PubMed/NCBI
|
|
40
|
Yin Y, Si X, Gao Y, Gao L and Wang J: The
nuclear factor-κB correlates with increased expression of
interleukin-6 and promotes progression of gastric carcinoma. Oncol
Rep. 29:34–38. 2013. View Article : Google Scholar : PubMed/NCBI
|
|
41
|
Zhu Q, Zhang X, Zhang L, Li W, Wu H, Yuan
X, Mao F, Wang M, Zhu W, Qian H and Xu W: The IL-6-STAT3 axis
mediates a reciprocal crosstalk between cancer-derived mesenchymal
stem cells and neutrophils to synergistically prompt gastric cancer
progression. Cell Death Dis. 5:e12952014. View Article : Google Scholar : PubMed/NCBI
|
|
42
|
Li W, Lin S, Li W, Wang W, Li X and Xu D:
IL-8 interacts with metadherin promoting proliferation and
migration in gastric cancer. Biochem Biophys Res Commun.
478:1330–1337. 2016. View Article : Google Scholar : PubMed/NCBI
|
|
43
|
Shi J, Li YJ, Yan B and Wei PK:
Interleukin-8: A potent promoter of human lymphatic endothelial
cell growth in gastric cancer. Oncol Rep. 33:2703–2710. 2015.
View Article : Google Scholar : PubMed/NCBI
|
|
44
|
Wang X, Yang F, Xu G and Zhong S: The
roles of IL-6, IL-8 and IL-10 gene polymorphisms in gastric cancer:
A meta-analysis. Cytokine. 111:230–236. 2018. View Article : Google Scholar : PubMed/NCBI
|
|
45
|
Wang CQ, Chen L, Dong CL, Song Y, Shen ZP,
Shen WM and Wu XD: MiR-377 suppresses cell proliferation and
metastasis in gastric cancer via repressing the expression of
VEGFA. Eur Rev Med Pharmacol Sci. 21:5101–5111. 2017.PubMed/NCBI
|
|
46
|
Zhang X, Tang J, Zhi X, Xie K, Wang W, Li
Z, Zhu Y, Yang L, Xu H and Xu Z: Correction: miR-874 functions as a
tumor suppressor by inhibiting angiogenesis through STAT3/VEGF-A
pathway in gastric cancer. Oncotarget. 8:295352017.PubMed/NCBI
|
|
47
|
Caporarello N, Lupo G, Olivieri M,
Cristaldi M, Cambria MT, Salmeri M and Anfuso CD: Classical VEGF,
Notch and Ang signalling in cancer angiogenesis, alternative
approaches and future directions (Review). Mol Med Rep.
16:4393–4402. 2017. View Article : Google Scholar : PubMed/NCBI
|
|
48
|
Guan X, Zhao H, Niu J, Tan D, Ajani JA and
Wei Q: Polymorphisms of TGFB1 and VEGF genes and survival of
patients with gastric cancer. J Exp Clin Cancer Res. 28:942009.
View Article : Google Scholar : PubMed/NCBI
|
|
49
|
Cho WC: OncomiRs: The discovery and
progress of microRNAs in cancers. Mol Cancer. 6:602007. View Article : Google Scholar : PubMed/NCBI
|
|
50
|
Zhang Y, Han D, Wei W, Cao W, Zhang R,
Dong Q, Zhang J, Wang Y and Liu N: MiR-218 inhibited growth and
metabolism of human glioblastoma cells by directly targeting E2F2.
Cell Mol Neurobiol. 35:1165–1173. 2015. View Article : Google Scholar : PubMed/NCBI
|
|
51
|
Qu Y, Zhang H, Sun W, Han Y, Li S, Qu Y,
Ying G and Ba Y: MicroRNA-155 promotes gastric cancer growth and
invasion by negatively regulating transforming growth factor-β
receptor 2. Cancer Sci. 109:618–628. 2018. View Article : Google Scholar : PubMed/NCBI
|
|
52
|
Ding L, Xu Y, Zhang W, Deng Y, Si M, Du Y,
Yao H, Liu X, Ke Y, Si J and Zhou T: MiR-375 frequently
downregulated in gastric cancer inhibits cell proliferation by
targeting JAK2. Cell Res. 20:784–793. 2010. View Article : Google Scholar : PubMed/NCBI
|
|
53
|
Lian S, Park JS, Xia Y, Nguyen TT, Joo YE,
Kim KK, Kim HK and Jung YD: MicroRNA-375 functions as a
tumor-suppressor gene in gastric cancer by targeting recepteur
d'Origine nantais. Int J Mol Sci. 17(pii): E16332016. View Article : Google Scholar : PubMed/NCBI
|
|
54
|
Kang W, Huang T, Zhou Y, Zhang J, Lung
RWM, Tong JHM, Chan AWH, Zhang B, Wong CC, Wu F, et al: miR-375 is
involved in Hippo pathway by targeting YAP1/TEAD4-CTGF axis in
gastric carcinogenesis. Cell Death Dis. 9:922018. View Article : Google Scholar : PubMed/NCBI
|
|
55
|
Lu WD, Zuo Y, Xu Z and Zhang M: MiR-19a
promotes epithelial-mesenchymal transition through PI3K/AKT pathway
in gastric cancer. World J Gastroenterol. 21:4564–4573. 2015.
View Article : Google Scholar : PubMed/NCBI
|
|
56
|
Wu Q, Yang Z, An Y, Hu H, Yin J, Zhang P,
Nie Y, Wu K, Shi Y and Fan D: MiR-19a/b modulate the metastasis of
gastric cancer cells by targeting the tumour suppressor MXD1. Cell
Death Dis. 5:e11442014. View Article : Google Scholar : PubMed/NCBI
|
|
57
|
Zhang KC, Xi HQ, Cui JX, Shen WS, Li JY,
Wei B and Chen L: Hemolysis-free plasma miR-214 as novel biomarker
of gastric cancer and is correlated with distant metastasis. Am J
Cancer Res. 5:821–829. 2015.PubMed/NCBI
|
|
58
|
Xin R, Bai F, Feng Y, Jiu M, Liu X, Bai F,
Nie Y and Fan D: MicroRNA-214 promotes peritoneal metastasis
through regulating PTEN negatively in gastric cancer. Clin Res
Hepatol Gastroenterol. 40:748–754. 2016. View Article : Google Scholar : PubMed/NCBI
|
|
59
|
Yang TS, Yang XH, Wang XD, Wang YL, Zhou B
and Song ZS: MiR-214 regulate gastric cancer cell proliferation,
migration and invasion by targeting PTEN. Cancer Cell Int.
13:682013. View Article : Google Scholar : PubMed/NCBI
|
|
60
|
Prensner JR and Chinnaiyan AM: The
emergence of lncRNAs in cancer biology. Cancer Discov. 1:391–407.
2011. View Article : Google Scholar : PubMed/NCBI
|
|
61
|
Rinn JL and Chang HY: Genome regulation by
long noncoding RNAs. Annu Rev Biochem. 81:145–166. 2012. View Article : Google Scholar : PubMed/NCBI
|
|
62
|
Gutschner T and Diederichs S: The
hallmarks of cancer: A long non-coding RNA point of view. RNA Biol.
9:703–719. 2012. View Article : Google Scholar : PubMed/NCBI
|
|
63
|
Chen DL, Ju HQ, Lu YX, Chen LZ, Zeng ZL,
Zhang DS, Luo HY, Wang F, Qiu MZ, Wang DS, et al: Long non-coding
RNA XIST regulates gastric cancer progression by acting as a
molecular sponge of miR-101 to modulate EZH2 expression. J Exp Clin
Cancer Res. 35:1422016. View Article : Google Scholar : PubMed/NCBI
|
|
64
|
Eades G, Wolfson B, Zhang Y, Li Q, Yao Y
and Zhou Q: lincRNA-RoR and miR-145 regulate invasion in
triple-negative breast cancer via targeting ARF6. Mol Cancer Res.
13:330–338. 2015. View Article : Google Scholar : PubMed/NCBI
|