Previous studies demonstrated that ~38% of patients
with cancer display major emotional distress, including anxiety and
depression (5–7). In patients with OC, the incidence of
depression and anxiety is of 82 and 92%, respectively (8). In addition, the degree of depression or
anxiety is highly variable in patients with OC (9).
At present, the majority of studies have focused on
how depression affects the prognosis of OC (10–12);
however, the pathogenesis of depression in OC remains poorly
investigated, particularly at a molecular level. By using a
miRNA-mRNA regulation network, Wu et al (13) identified 12 miRNA-mRNAs pairs
(miR-629-5p-FGF1, miR-629-5p-AKT3, miR-629-5p-MAGI2, miR-933-BDNF,
miR-933-MEF2A, miR-23b-3p-TJP1, miR-23b-3p-JMJD1, miR-23b-3p-APAF1,
miR-23b-3p-CAB39, miR-1265-CDKN1B, miR-33b-3p-CDKN1B and
miR-33b-3p-F2R) that could be associated with the development of
major depressive disorder (MDD) in patients with OC. Furthermore,
Rahman et al (14) identified
34 differentially expressed genes (DEGs) associated with depression
in patients with OC and demonstrated that CXCL12, ARL4C, NQO2 were
associated with worse survival in patients with OC. As depressed
patients display higher mortality rates (15) and since a different mental status can
lead to different clinical outcomes (16) and prognosis (17), it is crucial to further understand
the molecular mechanisms underpinning the onset of depression in
patients with OC.
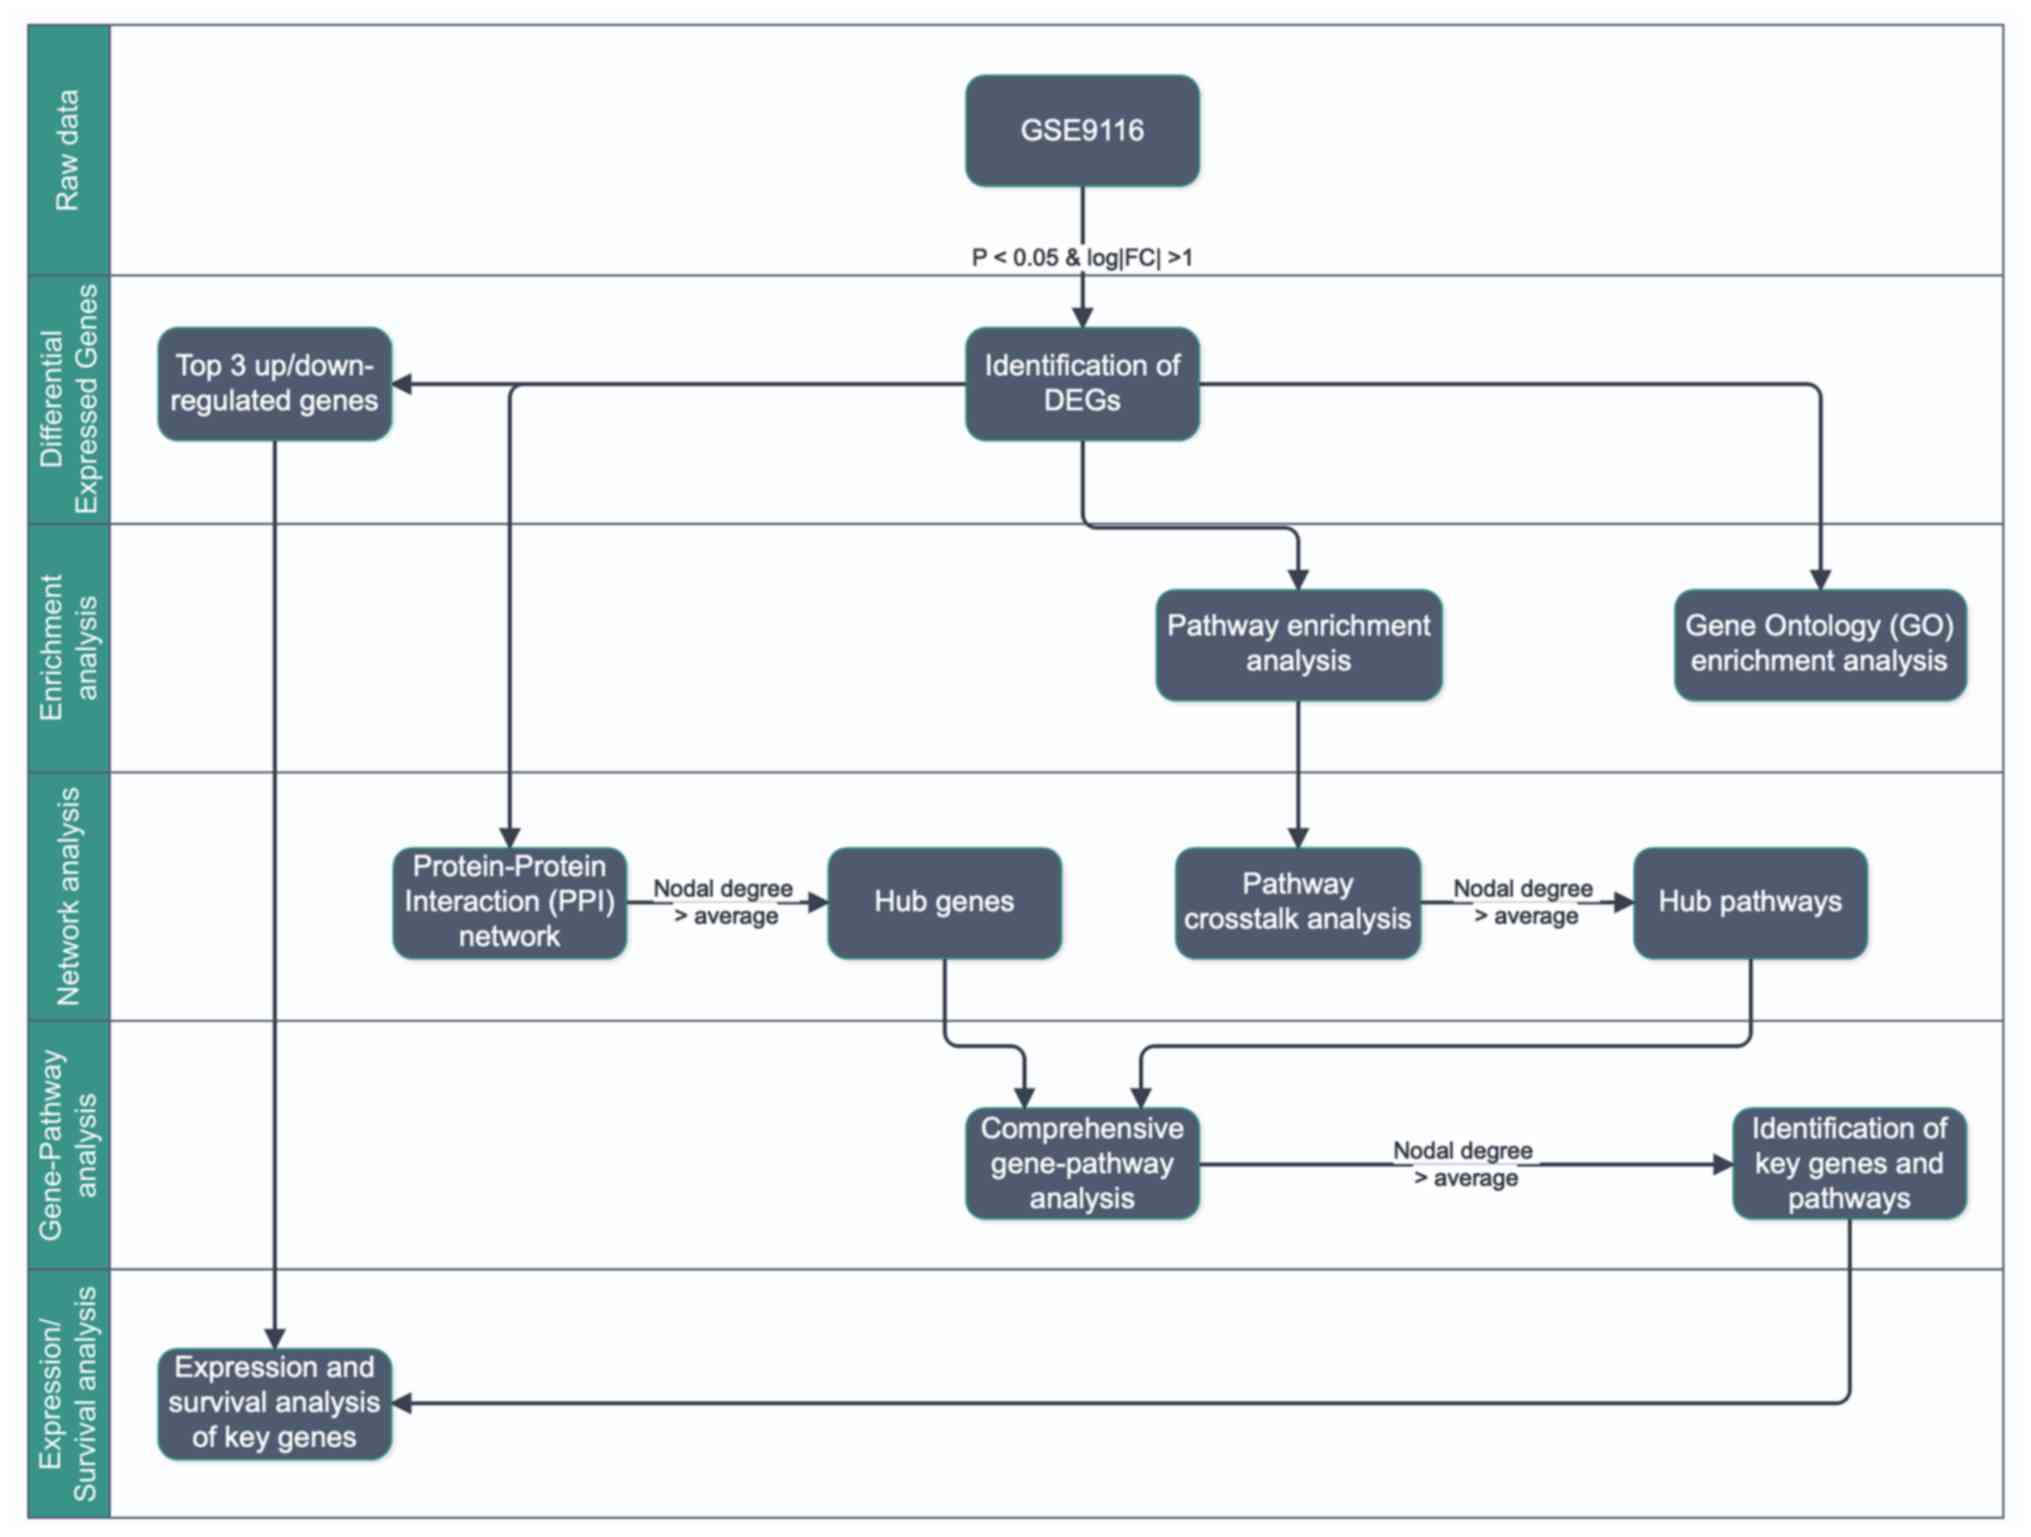
The present study aimed to identify DEGs in patients
with OC and high or low-grade depression using bioinformatics
analyses, and to determine the potential hub genes and pathways
that may serve critical roles in the onset of depression in
patients with OC.
The GSE9116 dataset was divided into two groups: HD
and LD groups. Genes were considered differentially expressed
between HD and LD groups if they exhibited a
|log2(FC)|>1 and P<0.05 calculated using GEO2R
(16) with the limma package
(25). The top three up- and
downregulated DEGs were considered as potential key genes for
further analysis.
For pathway enrichment, DEGs were mapped using the
Kyoto Gene and Genome Encyclopedia (KEGG) database (29) and BioCarta (30) using the online analysis tool
(21). Pathways with a P<0.05
were considered significant.
Pathway crosstalk analysis was conducted on the
pathways defined above based on the assumption that two pathways
are considered crosstalking if they share a proportion of genes
(31,32). Briefly, pathways containing <3
genes were excluded as pathways with too few genes may contain
insufficient biological information. Two indicators named Jaccard
Coefficient (33) and Overlapping
Coefficient (34), were used to
measure the overlap between two pathways and were calculated as
follows: Jaccard Coefficient = |(A∩B)/(A∪B) and Overlapping
Coefficient = [(|A∩B|)/(min(|A|,|B|)], where A and B represent the
list of genes in the two pathways, and min indicated the minimum
number of genes between |A| and |B|. Subsequently, pairs of
pathways with more than one overlapping gene were retained. Once
the pathway crosstalking network was obtained, a subnetwork
representing the hub pathways was identified according to the
criterion nodal degree > average.
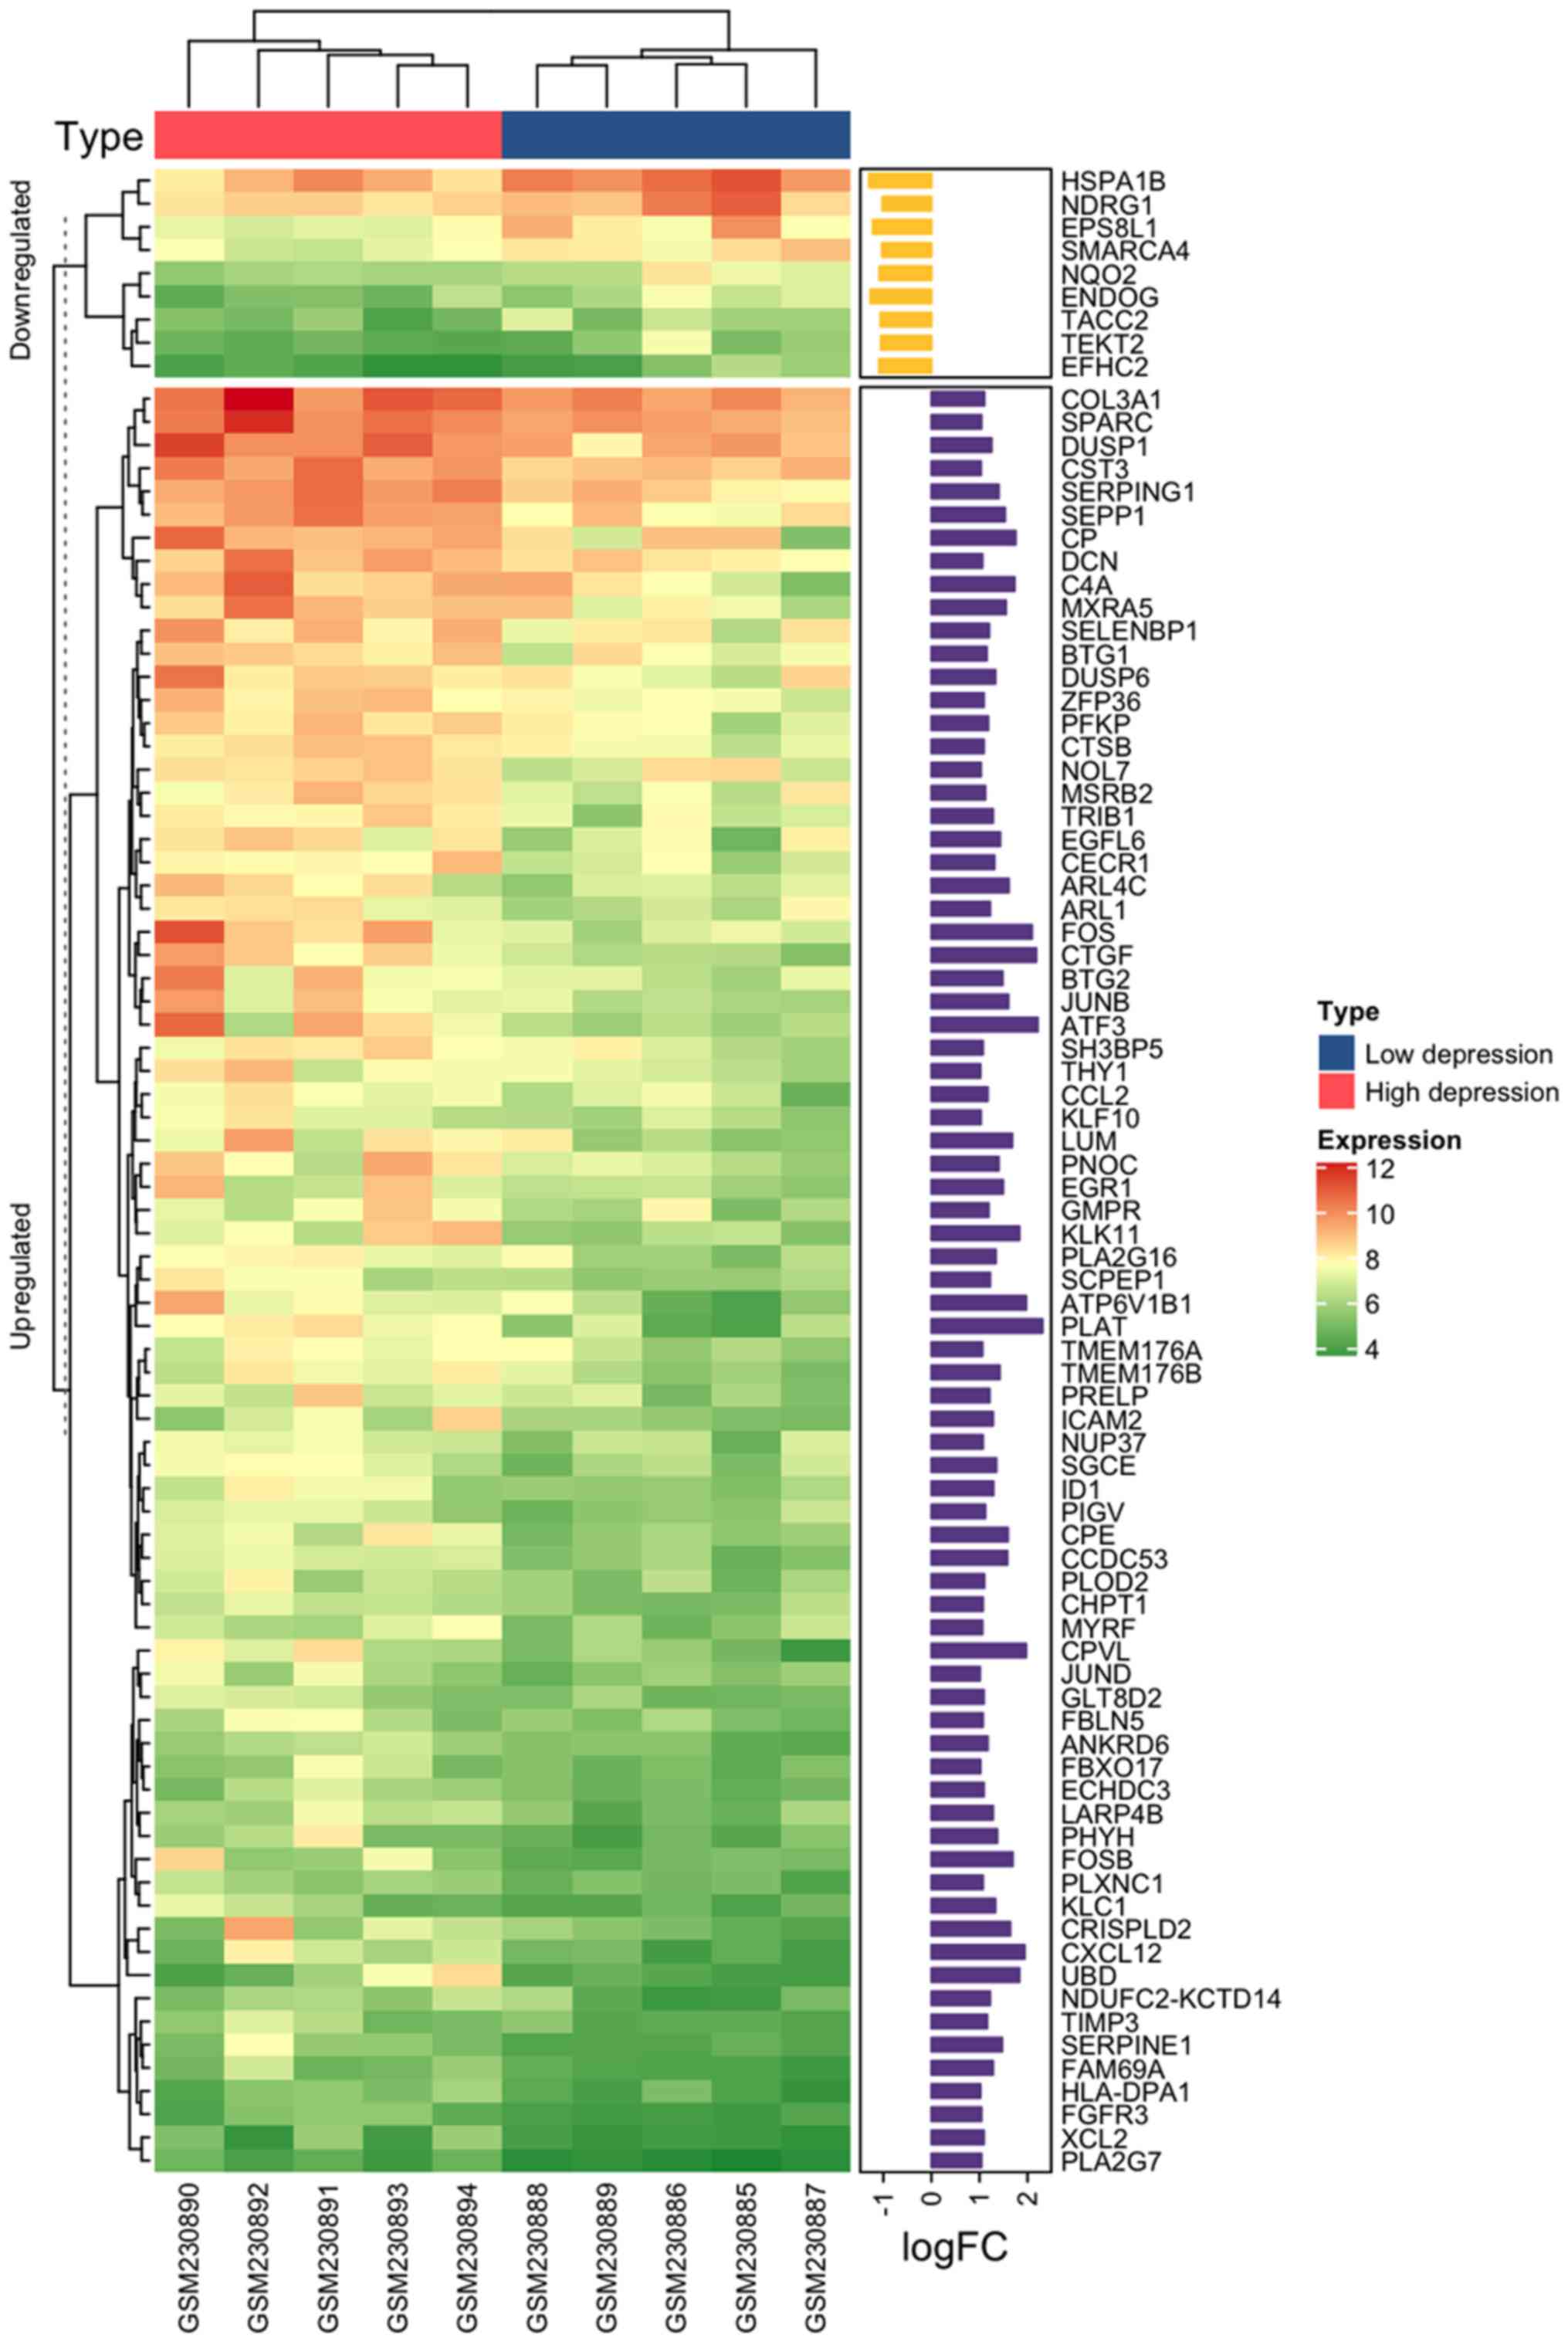
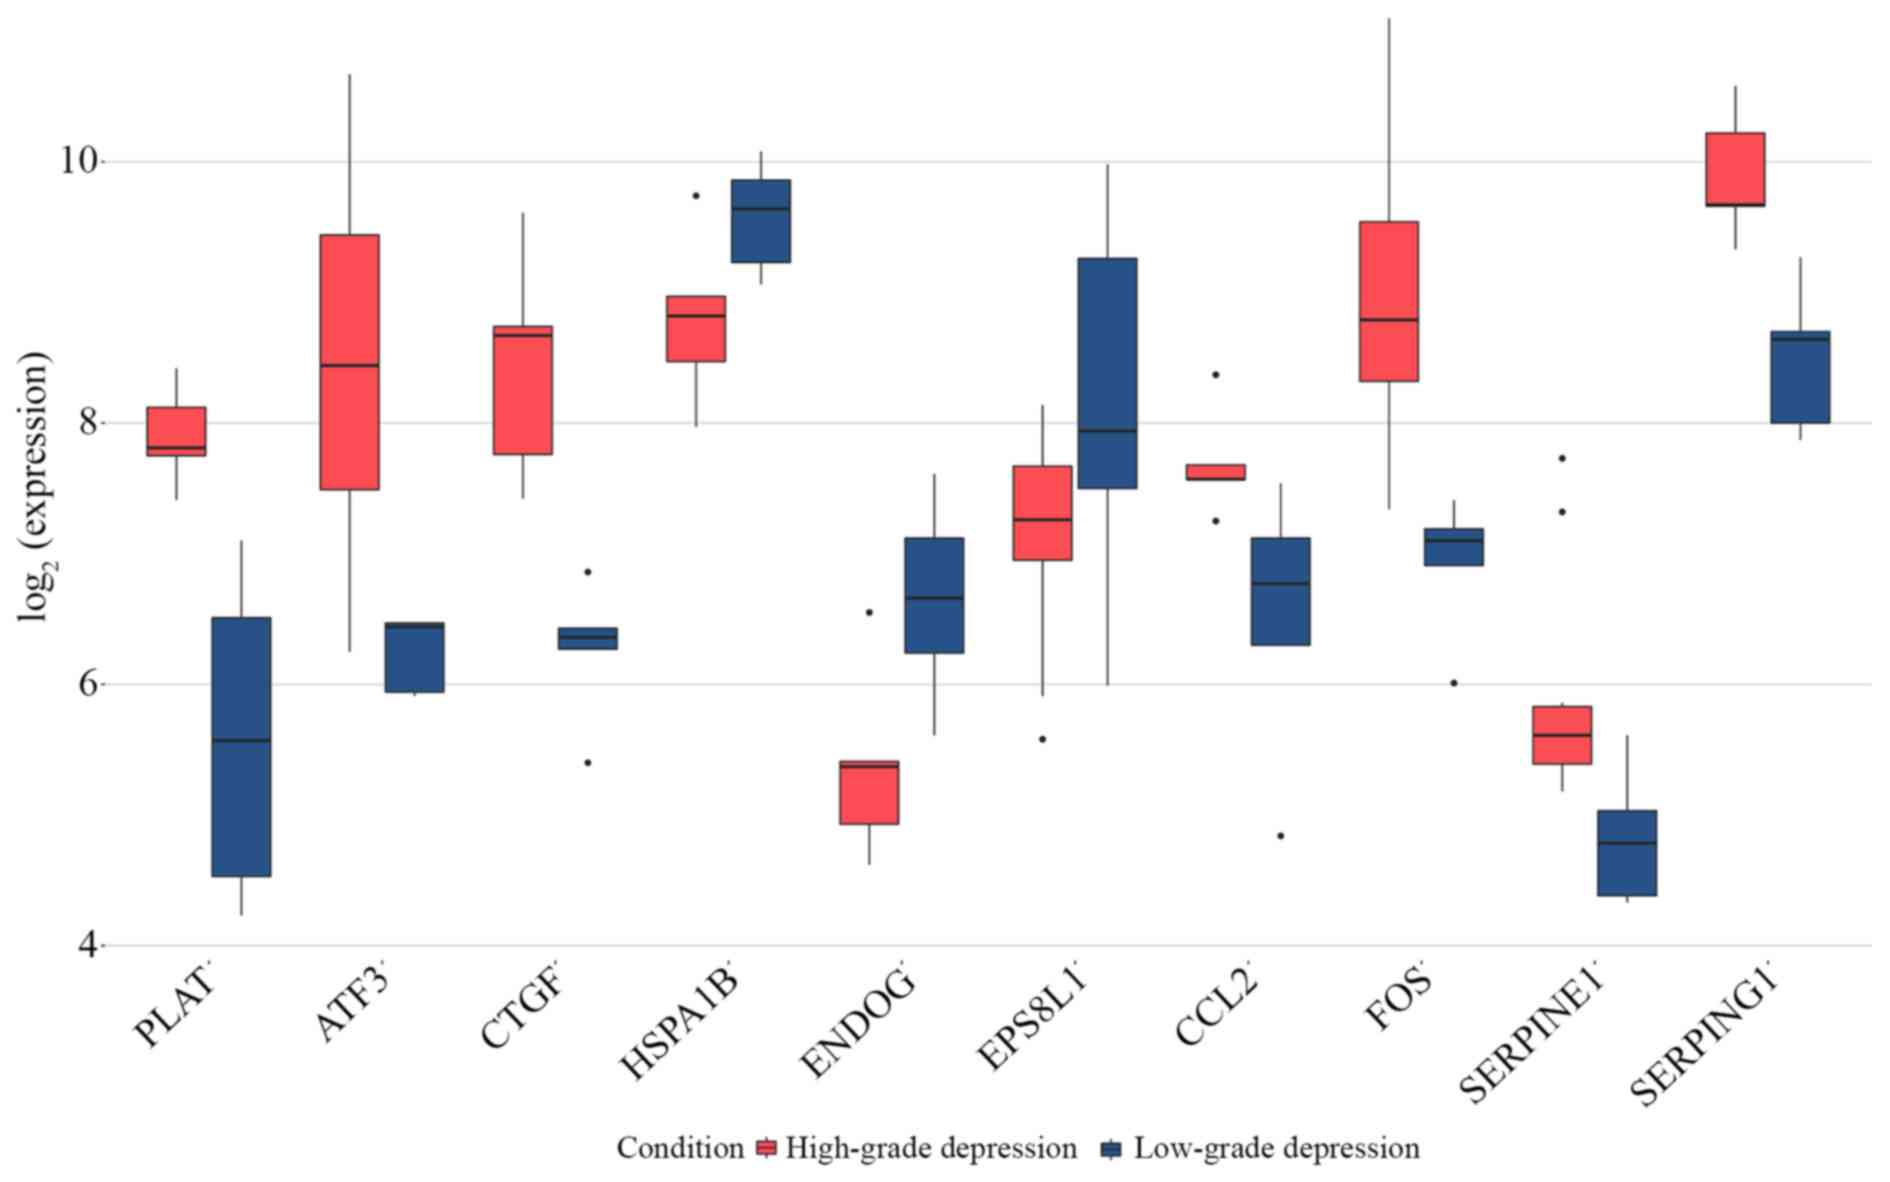
The expression of core genes in the sub gene-pathway
network and of the top three up and downregulated DEGs were
extracted from the GSE9116 dataset and evaluated for regulations.
Furthermore, to analyze the effect of the key genes on patients'
overall survival (OS), progression-free survival (PFS) and
post-progression survival (PPS), patients were stratified according
to the expression of the key genes and evaluated using Kaplan-Meier
analysis (35). Kaplan-Meier
analysis provides a survival assessment of prognosis-related genes
in OC patients whose data obtained from The Cancer Genome Atlas
(36) and 14 GSE profiles [GSE14764
(37), GSE15622 (38), GSE18520 (39), GSE19829 (40), GSE23554 (41), GSE26193 (42,43),
GSE26712 (44,45), GSE27651 (46), GSE30161 (47), GSE3149 (48), GSE51373 (49), GSE63885 (50), GSE65986 (51) and GSE9891 (52)]. Patients were grouped by median gene
expression and hazard ratio (HR) with 95% confidence intervals (CI)
and log-rank P-values were calculated. P<0.05 was considered to
indicate a significant difference.
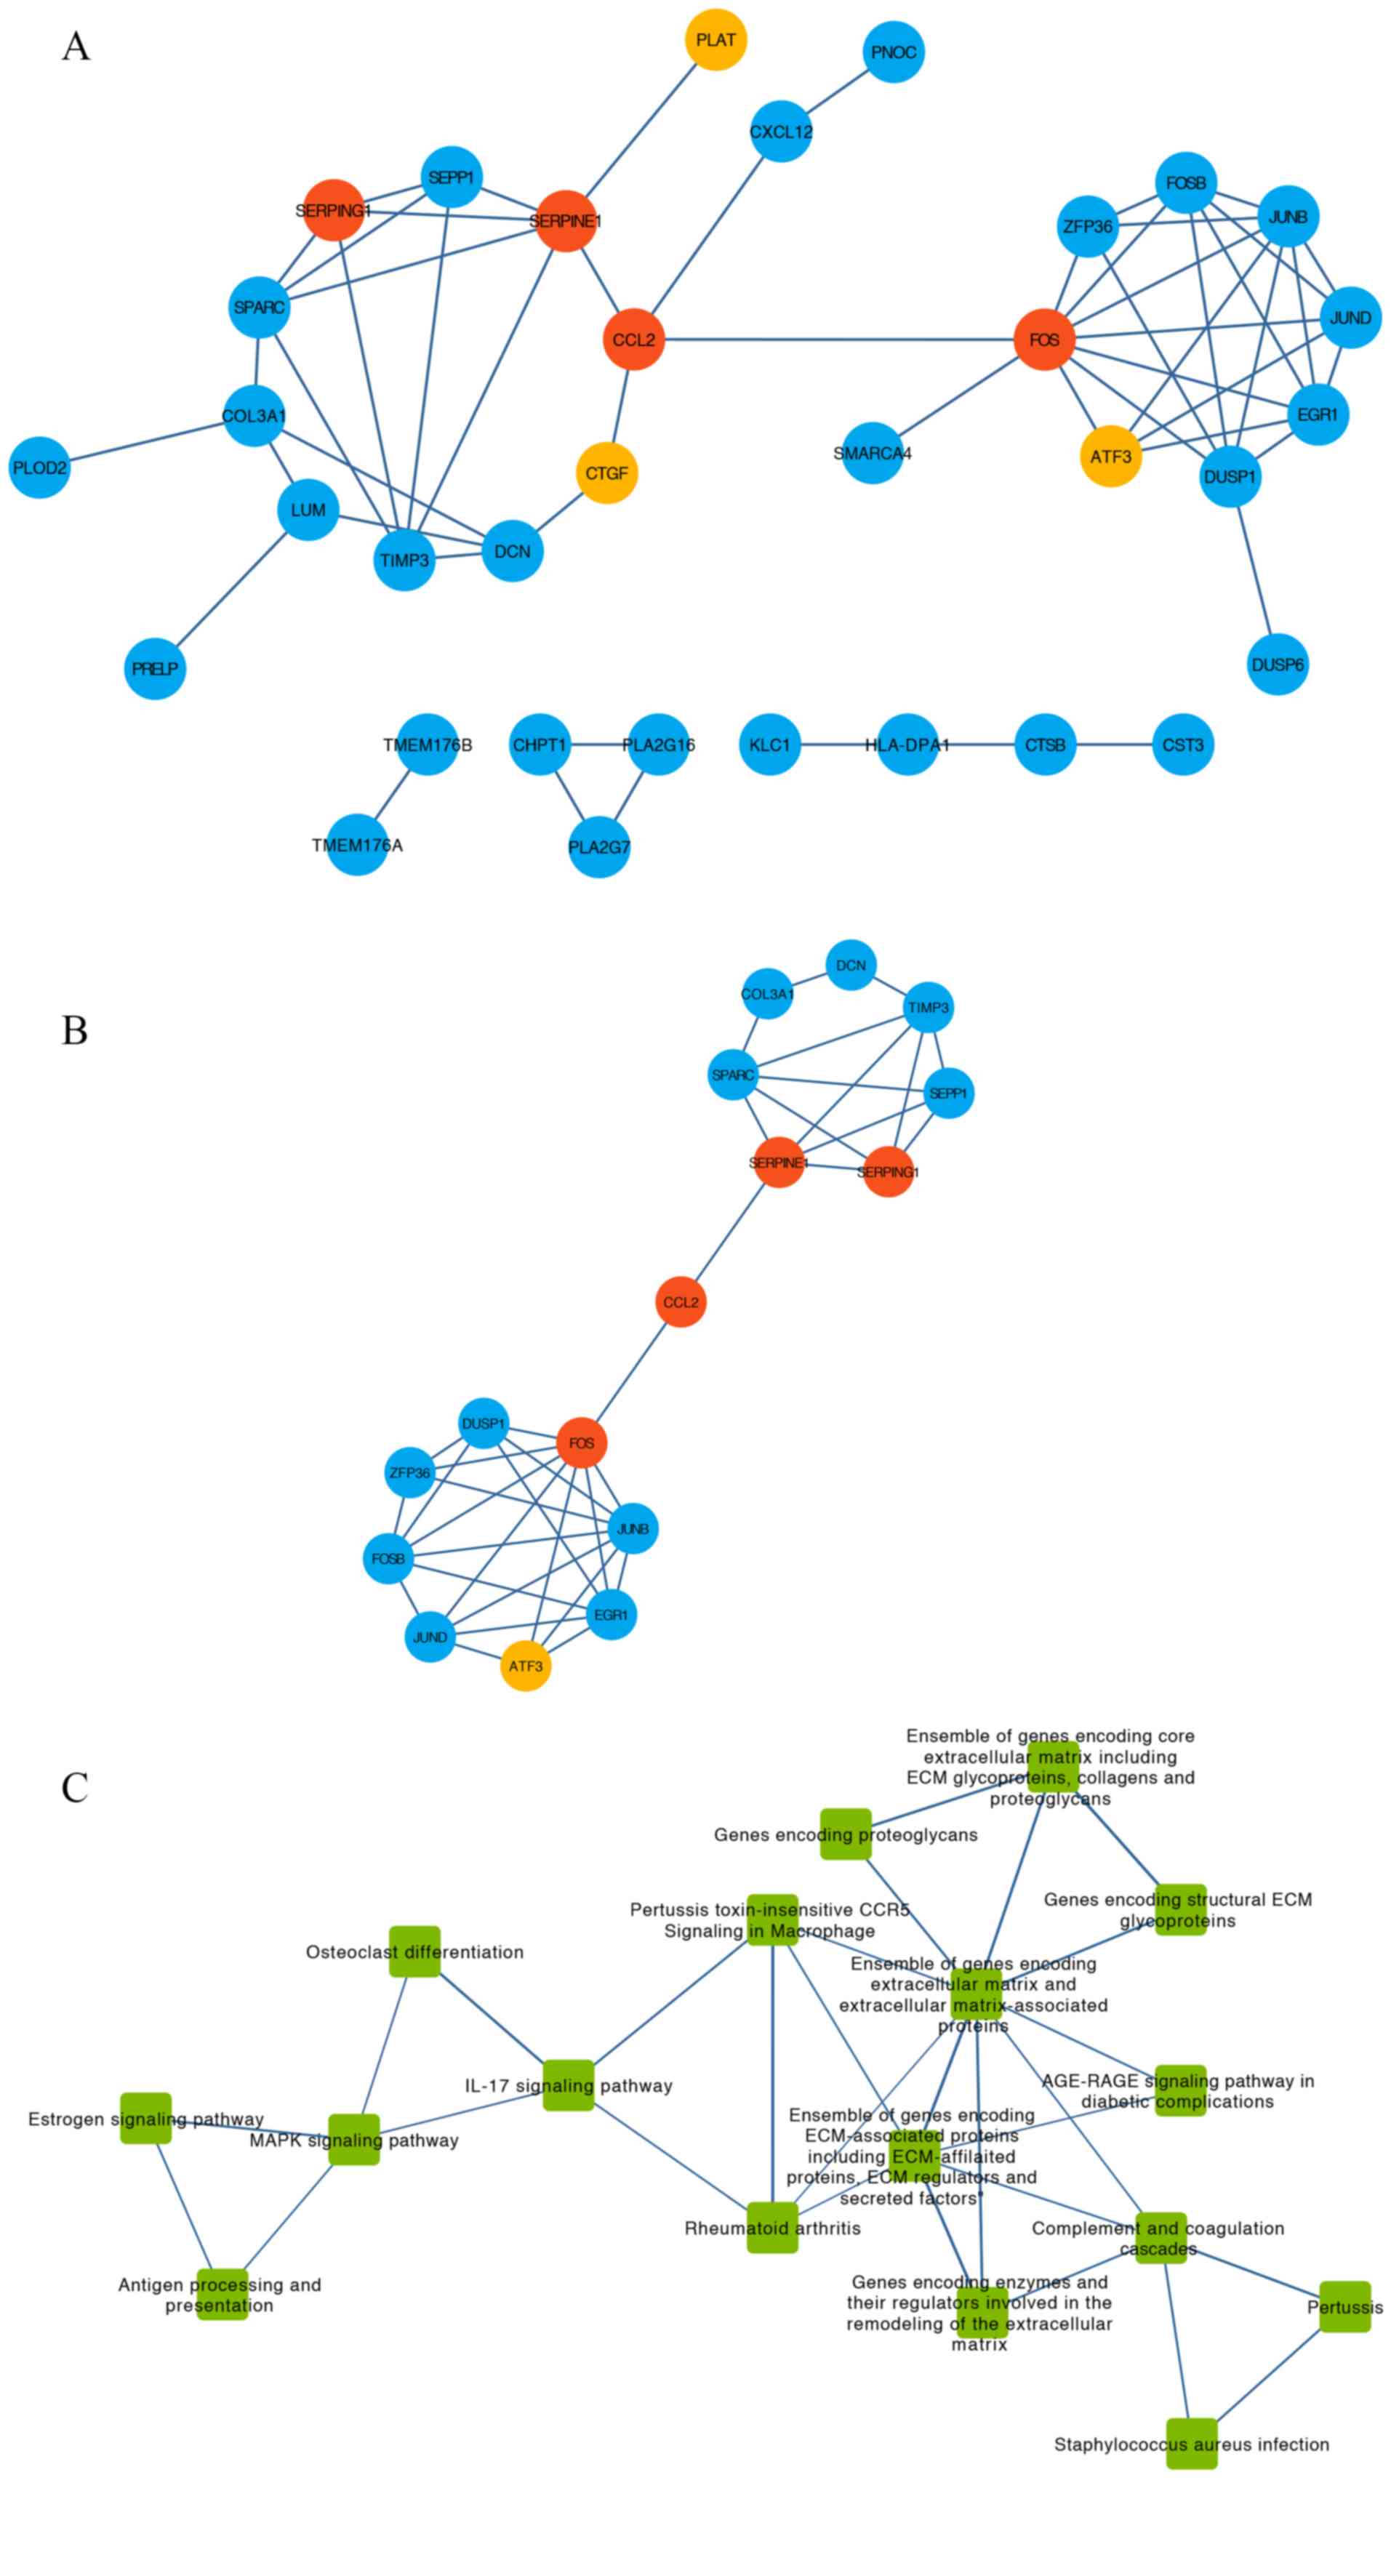
Using DEGs and the STRING database, a PPI network
containing 34 nodes and 55 edges was obtained (Fig. 4A). The degree of each node was
calculated using CentiScaPe (Table
I). A total of 16 hub genes of which degree > average were
extracted from the PPI network (Fig.
4B). This subnetwork was divided into two clusters that
contained eight and seven genes, respectively. These two clusters
were connected by C-C motif chemokine ligand 2 (CCL2) (Fig 4B).
Pathway enrichment analysis was performed using
ToppGene database. The results indicated that the top five
significantly enriched pathways were ‘Ensemble of genes encoding
extracellular matrix and extracellular matrix-associated proteins’,
‘Ensemble of genes encoding core extracellular matrix including ECM
glycoproteins, collagens and proteoglycans’, ‘Complement and
coagulation cascades’, ‘Pertussis toxin-insensitive CCR5 Signaling
in Macrophage’ and ‘Rheumatoid arthritis’ (Table II).
For the pathway crosstalk analysis, 17 out of 24
pathways that contained ≥2 genes met the crosstalk analysis
criteria and were selected to construct the network (Fig. 4C). The thickness of the edges
indicated the average values of Jaccard and the Overlapping
Coefficient that represented the overlapping level of genes between
two pathways. By selecting the nodes with degree > average, a
subnetwork of pathway crosstalk with 7 nodes and 11 edges was
constructed (Fig. 4D).
After mapping the hub genes onto the subnetwork of
pathways provided by KEGG and BioCarta, a potential gene-pathway
network including 7 essential pathways and 11 hub genes was
constructed (Fig. 4E). The results
from this network demonstrated that CCL2 and Fos proto-oncogene,
AP-1 transcription factor subunit (FOS) participated in most of the
pathways. Based on the number of genes involved, the top three
pathways were ‘Ensemble of genes encoding extracellular matrix and
extracellular matrix-associated proteins’, ‘Ensemble of genes
encoding ECM-associated proteins including ECM-affiliated proteins,
ECM regulators and secreted factors’ and ‘IL-17 signaling pathway’
(Fig. 4E).
To identify the main nodes (including genes and
pathways) in the gene-pathway network, nodes with degree >
average were selected (Fig. 4F). The
results demonstrated that CCL2, FOS, serpin family G member 1
(SERPING1) and serpin family E member 1 (SERPINE1) and the four
pathways ‘Ensemble of genes encoding ECM-associated proteins
including ECM-affiliated proteins, ECM regulators and secreted
factors’, ‘Ensemble of genes encoding extracellular matrix and
extracellular matrix-associated proteins’, ‘MAPK signaling pathway’
and ‘IL-17 signaling pathway’ were identified and may serve a
crucial role in the development of depression in patients with
OC.
The evaluation of the interaction between the four
key genes (CCL2, FOS, SERPING1 and SERPINE1) and the six top DEGs
(upregulated; PLAT, ATF3 and CTGF and downregulated; HSPA1B, ENDOG
and EPS8L1) in the PPI (Fig 4A)
demonstrated that HSPA1B, ENDOG, EPS8L1 were not found since they
were not connected to the major network. Furthermore, PLAT was
interplayed with SERPINE1, CTGF interacted with CCL2 and ATF3 was
connected to FOS.
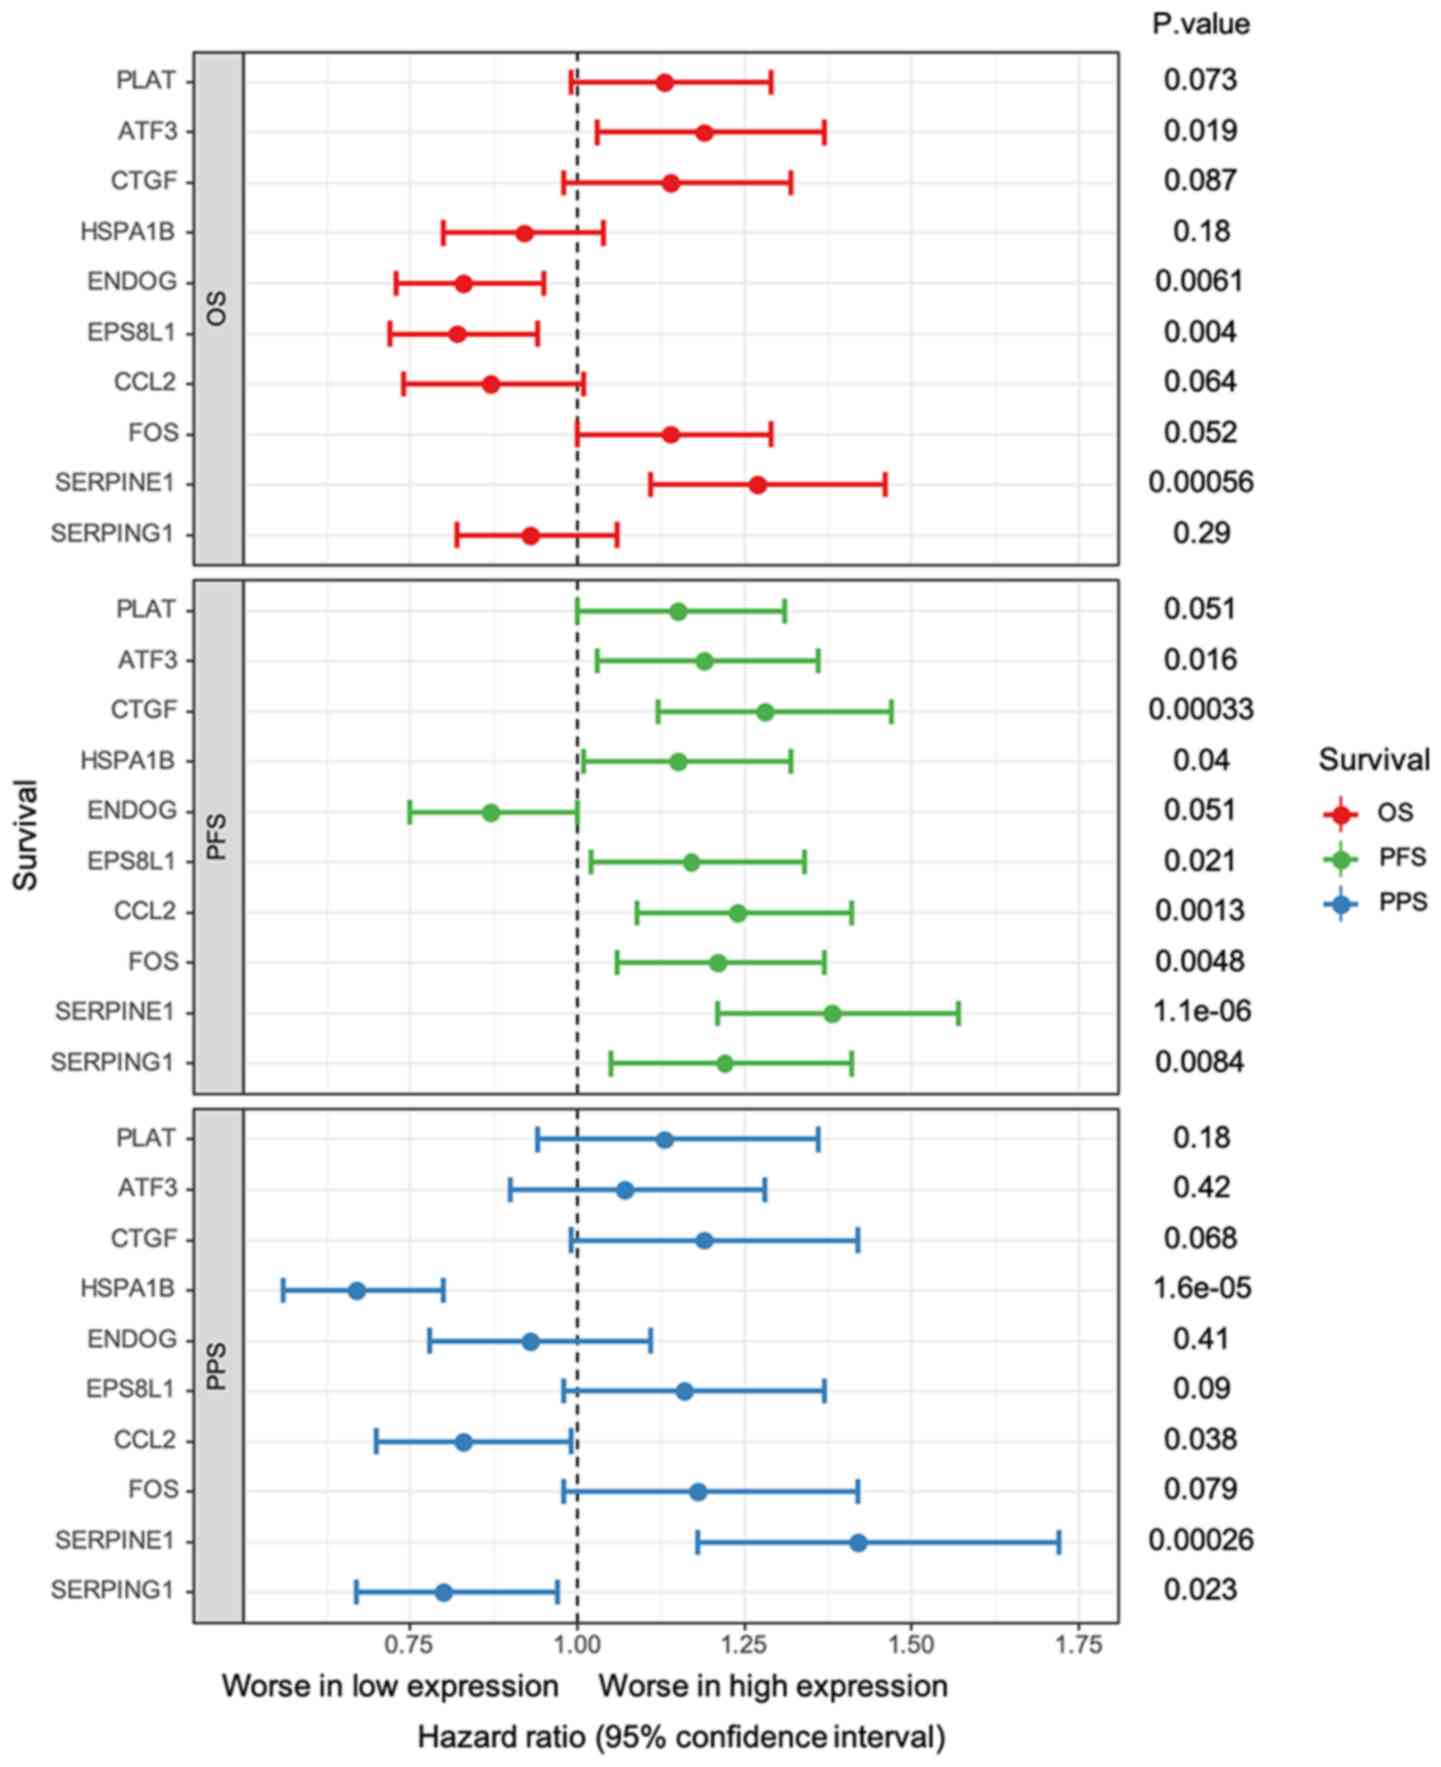
The results from survival analysis indicated that
the top 3 upregulated DEGs had similar effects as the core genes,
which was not the case for the top 3 downregulated DEGs (Fig. 6). In particular, higher expression of
ATF3 (HR, 1.19; 95% CI, 1.03–1.37; P=0.019) and SERPINE1 (HR, 1.27;
95% CI, 1.11–1.46; P=0.00056) and lower expression of ENDOG (HR,
0.83; 95% CI, 0.73–0.95; P=0.0061) and EPS8L1 (HR, 0.82; 95% CI,
0.72–0.94; P=0.004) were significantly associated with worse OS.
Furthermore, ATF3 (HR, 1.19; 95% CI, 1.03–1.36; P=0.016), CTGF (HR,
1.28; 95% CI, 1.12–1.47; P=0.00033), HSPA1B (HR, 1.15; 95% CI,
1.01–1.52; P=0.04), EPS8L1 (HR, 1.17; 95% CI, 1.12–1.34; P=0.0021)
and all core genes, including CCL2 (HR, 1.24; 95% CI, 1.09–1.41;
P=0.0013), FOS (HR: 1.21, 95%CI: 1.06–1.37; P=0.0048), SERPINE1
(HR, 1.38, 95% CI, 1.21–1.57; P=1.1e-06) and SERPING1 (HR, 1.22;
95% CI, 1.05–1.41; P=0.0084), were significantly associated with a
lower PFS. However, lower expression of HSPA1B (HR, 0.67; 95% CI,
0.56–0.8; P=0.000016), CCL2 (HR, 0.83; 95% CI, 0.7–0.99; P=0.038)
and SERPING1 (HR, 0.8; 95% CI, 0.67–0.97; P=0.023) and high
expression of SERPINE1 (HR, 1.42; 95% CI, 1.18–1.72; P=0.00026)
were significantly associated with worse PPS. The other genes had
no significant effect on OS, PFS or PPS.
Whereas the original study of GSE9116 used a
promoter-based bioinformatics strategy to investigate the effect of
β-adrenergic signaling (18) and
focused on the genetic interaction locus in the human interleukin
(IL)-6 promoter (single nucleotide polymorphisms rs1800795)
(19), the present study aimed to
identify key genes and pathways associated with depression in
patients with OC using PPI networks, pathway crosstalk and
gene-pathway analyses. The results from this study may provide an
improved understanding underlying the link between depression in
and a poorer prognosis in patients with OC.
The results from the present study demonstrated that
CCL2 may induce depression in patients with OC through ECM-related
and IL-17 signaling pathways. Previous studies indicated that high
expression of CCL2 is associated with depression. Leighton et
al (58) performed a
meta-analysis, which included 4688 subjects (765 depressed healthy
patients vs. 1528 not depressed healthy patients, and 742 depressed
patients with inflammatory illness vs. 1653 not depressed patients
with inflammatory illness) and reported that CCL2 blood levels were
significantly higher in depressed patients with or without
inflammatory illness compared with the control. Another
meta-analysis reported similar results for CCL2 (59). In addition, CCL2 was upregulated in
cancerous cells, and this required the participation of IL-17
(60), and CCL2 induced tumor cell
proliferation and stimulated tumor cell migration and invasion into
the surrounding extracellular matrix in order to promote tumor cell
intravasation into the circulation (61).
The present study demonstrated an association
between FOS expression and depression via MAPK and IL-17 signaling
pathways in patients with OC. Yu et al (62) reported that human depression is
associated with cognitive deficits, and that FOS is upregulated in
cognitively impaired mice. Kung et al (63) demonstrated that FOS expression is
higher in preproenkephalin-knockout mice, and induced anxiety and
depression-like symptoms of post-traumatic stress disorder compared
with wild-type mice. In addition, it was reported that FOS
expression is regulated by the MAPK pathway (64,65).
Furthermore, IL-17 can mediate inflammatory responses via FOS
activation (66) and enhance the
recruitment of activated FOS in synergy with IL-6 (67).
The results from the present study indicated that
SERPINE1 and SERPING1 could induce depression in patients with OC
through ECM-related pathways. Both SERPINE1 and SERPING1 belong to
the SERPINs family of serine protease inhibitors that regulate
proteases involved in fibrinolysis, coagulation, inflammation, cell
mobility, cellular differentiation and apoptosis (68). SERPINE1, which is known as
plasminogen activator inhibitor-1 (PAI-1), is described as a major
physiological inhibitor of endogenous plasminogen activator which
inhibits fibrin degradation, promotes fibrin deposition on blood
vessel walls and stimulates smooth muscle cell proliferation
(69). Furthermore, SERPINE1 may be
involved in the pathogenic and therapeutic mechanisms of MDD.
Yamamoto et al (70) reported
that stress induced SERPINE1 upregulation in a tissue- and cell
type-specific manner. In addition, previous studies demonstrated
that both women (71) and men
(72) with MDD present higher blood
PAI-1 levels compared with healthy subjects. Although these
findings were not described in patients with OC, they are similar
to the results from the present study. Previous studies indicated
that SERPINE1 is a stress-associated gene and that its genetic
variants may contribute to the causes of depression and the acute
therapeutic response to selective serotonin reuptake inhibitors in
MDD (73). However, the promoter
polymorphisms of SERPINE1 gene were not associated with Alzheimer's
disease-related depression, but they may be associated with the
response to antidepressant treatments (74). Therefore, the mechanism by which
SERPINE1 induces depression in patients with OC requires further
investigation. SERPING1 is also referred to as a complement system
C1 inhibitory gene [complement component 1 inhibitor (C1INH)],
which is located on chromosome 11q.11-q13.1 on GeneMap (75). SERPING1 has been reported to be
associated with plasma protein supplementation and to be a member
of the serine protease inhibitor gene family (76). Numerous studies have reported that
SERPING1 is downregulated in patients with hereditary angioedema
and depression (77–79). Furthermore, Ditzen et al
(80) demonstrated that SERPING1
expression levels were decreased in the cerebrospinal fluid of
depressed patients compared with healthy controls. Since the
results from the present study demonstrated that patients with OC
and depression exhibited higher SERPING1 expression, SERPING1 may
cause depression through other pathways in cancer microenvironment.
In addition, SERPINE1 and SERPING1 are associated with
extracellular matrix regulation (68). The plasminogen activator/plasmin
system serves a crucial role in ECM degradation, and SERPINE1 is a
physiological inhibitor of plasminogen activators (81). Furthermore, SERPINE1 upregulation
promotes the deposition of ECM components (82), and SERPING1 interacts with
extracellular matrix components to inhibit protease activity
(83). In addition, interactions
between SERPING1 and extracellular matrix components may result in
an increase in C1INH concentration at inflammation sites (84). However, as SERPINE1/SERPING1
interaction with ECM remains unclear, further investigation is
required.
ATF3 and CTGF upregulation have been demonstrated to
be associated with depression. Green et al (85) reported that ATF3 upregulation in
nucleus accumbens decreases emotional reactivity and increases
depression-like behavior. Similarly, Turner et al (86) demonstrated that CTGF expression in
human amygdala is significantly increased in patients with major
depressive disorder compared with healthy subjects. In addition,
CTGF administration increases depression-like behavior in outbred
rats (86). Only few studies have
focused on PLAT association with depression. The results from the
present study demonstrated that PLAT, ATF3 and CTGF were
co-expressed with SERPINE1, FOS and CCL2. PLAT, ATF3 and CTGF may
therefore induce depression through SERPINE1, FOS and CCL2 in
patients with OC. However, the underlying mechanisms remain unknown
and require further investigation.
Previous studies reported that depression is
detrimental to cancer patients' survival (87,88). The
results from the present study revealed that upregulation of CCL2,
FOS, SERPINE1 and SERPING1 was associated with worse survival.
However, Wojnarowicz et al (89) demonstrated that CCL2 protein
expression is not correlated with overall or disease-free survival.
Conversely, Mahner et al (90) reported that reduced FOS expression is
associated with unfavorable PFS and OS in patients with epithelial
ovarian carcinoma. However, it has been found that elevated tumor
SERPINE1 levels are associated with a poor prognosis and reduced
disease-free survival in patients with ovarian carcinoma (91,92). To
the best of our knowledge, no study has investigated the
association between SERPING1 and survival in patients with OC.
However, Peng et al (93)
demonstrated that lower SERPING1 mRNA levels predicted worse OS and
disease-free survival in patients with prostate cancer compared
with healthy controls; however, Mejia et al (94) reported that OS is significantly
improved in a mice model of malaria treated with SERPING1 compared
with controls. Since it is not clear whether these studies included
patients with depression or whether the core genes serve similar
functions in different types of cancer, determining how CCL2, FOS,
SERPINE1 and SERPING1 could influence patients' survival requires
further investigation.
In conclusion, the present study demonstrated that
the four core genes CCL2, FOS, SERPINE1 and SERPING1 were
upregulated in the HD group, which suggested that they may promote
depression and worsen survival in patients with OC through four
pathways (‘Ensemble of genes encoding ECM-associated proteins
including ECM-affiliated proteins’, ‘ECM regulators and secreted
factors’, ‘Ensemble of genes encoding extracellular matrix and
extracellular matrix-associated proteins’ and ‘MAPK signaling
pathway and IL-17 signaling pathway’). These findings may provide
novel markers and methods for predicting and treating depression in
patients with OC; however, the determination of specific mechanisms
requires further investigated.
Not applicable.
No funding was received.
All data generated or analyzed during this study are
included in the published article.
YY, YL and WZ designed the study and drafted the
manuscript. WW and KW performed the literature search, data
extraction and statistical analysis. All authors contributed to the
interpretation of the data and the redaction of the manuscript. The
final version of the manuscript was reviewed and approved by all
authors.
Not applicable.
Not applicable.
The authors declare that they have no competing
interests.
|
1
|
Reid BM, Permuth JB and Sellers TA:
Epidemiology of ovarian cancer: A review. Cancer Biol Med. 14:9–32.
2017. View Article : Google Scholar : PubMed/NCBI
|
|
2
|
Siegel RL, Miller KD and Jemal A: Cancer
statistics, 2018. CA Cancer J Clin. 68:7–30. 2018. View Article : Google Scholar : PubMed/NCBI
|
|
3
|
Chen W, Zheng R, Baade PD, Zhang S, Zeng
H, Bray F, Jemal A, Yu XQ and He J: Cancer statistics in china. CA
Cancer J Clin. 66:115–132. 2016. View Article : Google Scholar : PubMed/NCBI
|
|
4
|
Zhang L, Luo M, Yang H, Zhu S, Cheng X and
Qing C: Next-generation sequencing-based genomic profiling analysis
reveals novel mutations for clinical diagnosis in chinese primary
epithelial ovarian cancer patients. J Ovarian Res. 12:192019.
View Article : Google Scholar : PubMed/NCBI
|
|
5
|
Carlson LE, Angen M, Cullum J, Goodey E,
Koopmans J, Lamont L, MacRae JH, Martin M, Pelletier G and Robinson
J: High levels of untreated distress and fatigue in cancer
patients. Br J Cancer. 90:2297–2304. 2004. View Article : Google Scholar : PubMed/NCBI
|
|
6
|
Sellick SM and Crooks DL: Depression and
cancer: An appraisal of the literature for prevalence, detection,
and practice guideline development for psychological interventions.
Psychooncology. 8:315–333. 1999. View Article : Google Scholar : PubMed/NCBI
|
|
7
|
Zabora J, BrintzenhofeSzoc K, Curbow B,
Hooker C and Piantadosi S: The prevalence of psychological distress
by cancer site. Psychooncology. 10:19–28. 2001. View Article : Google Scholar : PubMed/NCBI
|
|
8
|
Greimel E, Thiel I, Peintinger F, Cegnar I
and Pongratz E: Prospective assessment of quality of life of female
cancer patients. Gynecol Oncol. 85:140–147. 2002. View Article : Google Scholar : PubMed/NCBI
|
|
9
|
Lutgendorf SK, Slavich GM, Degeest K,
Goodheart M, Bender D, Thaker PH, Penedo F, Zimmerman B, Lucci J
III, Mendez L, et al: Non-cancer life stressors contribute to
impaired quality of life in ovarian cancer patients. Gynecol Oncol.
131:667–673. 2013. View Article : Google Scholar : PubMed/NCBI
|
|
10
|
Watts S, Prescott P, Mason J, McLeod N and
Lewith G: Depression and anxiety in ovarian cancer: A systematic
review and meta-analysis of prevalence rates. BMJ Open.
5:e0076182015. View Article : Google Scholar : PubMed/NCBI
|
|
11
|
Huang T, Poole EM, Okereke OI, Kubzansky
LD, Eliassen AH, Sood AK, Wang M and Tworoger SS: Depression and
risk of epithelial ovarian cancer: Results from two large
prospective cohort studies. Gynecol Oncol. 139:481–486. 2015.
View Article : Google Scholar : PubMed/NCBI
|
|
12
|
Mielcarek P, Nowicka-Sauer K and Kozaka J:
Anxiety and depression in patients with advanced ovarian cancer: A
prospective study. J Psychosom Obstet Gynaecol. 37:57–67. 2016.
View Article : Google Scholar : PubMed/NCBI
|
|
13
|
Wu C, Zhao Y, Liu Y, Yang X, Yan M, Min Y,
Pan Z, Qiu S, Xia S, Yu J, et al: Identifying miRNA-mRNA regulation
network of major depressive disorder in ovarian cancer patients.
Oncol Lett. 16:5375–5382. 2018.PubMed/NCBI
|
|
14
|
Rahman MR, Islam T, Al-Mamun MA, Zaman T,
Karim MR and Moni MA: The influence of depression on ovarian
cancer: Discovering molecular pathways that identify novel
biomarkers and therapeutic targets. Informatics Med Unlocked.
16:1002072019. View Article : Google Scholar
|
|
15
|
Watson M, Haviland JS, Greer S, Davidson J
and Bliss JM: Influence of psychological response on survival in
breast cancer: A population-based cohort study. Lancet.
354:1331–1336. 1999. View Article : Google Scholar : PubMed/NCBI
|
|
16
|
DiMatteo MR, Lepper HS and Croghan TW:
Depression is a risk factor for noncompliance with medical
treatment: Meta-analysis of the effects of anxiety and depression
on patient adherence. Arch Intern Med. 160:2101–2107. 2000.
View Article : Google Scholar : PubMed/NCBI
|
|
17
|
Yamamoto T, Yanagimoto H, Satoi S,
Toyokawa H, Hirooka S, Yamaki S, Yui R, Yamao J, Kim S and Kwon AH:
Circulating CD4+CD25+ regulatory T cells in patients with
pancreatic cancer. Pancreas. 41:409–415. 2012. View Article : Google Scholar : PubMed/NCBI
|
|
18
|
Lutgendorf SK, DeGeest K, Sung CY, Arevalo
JM, Penedo F, Lucci J III, Goodheart M, Lubaroff D, Farley DM, Sood
AK and Cole SW: Depression, social support, and beta-adrenergic
transcription control in human ovarian cancer. Brain Behav Immun.
23:176–183. 2009. View Article : Google Scholar : PubMed/NCBI
|
|
19
|
Cole SW, Arevalo JMG, Takahashi R, Sloan
EK, Lutgendorf SK, Sood AK, Sheridan JF and Seeman TE:
Computational identification of gene-social environment interaction
at the human IL6 locus. Proc Natl Acad Sci. 107:5681–5686. 2010.
View Article : Google Scholar : PubMed/NCBI
|
|
20
|
Wang J, Vasaikar S, Shi Z, Greer M and
Zhang B: WebGestalt 2017: A more comprehensive, powerful, flexible
and interactive gene set enrichment analysis toolkit. Nucleic Acids
Res. 45:W130–W137. 2017. View Article : Google Scholar : PubMed/NCBI
|
|
21
|
Chen J, Bardes EE, Aronow BJ and Jegga AG:
ToppGene Suite for gene list enrichment analysis and candidate gene
prioritization. Nucleic Acids Res. 37:W305–W311. 2009. View Article : Google Scholar : PubMed/NCBI
|
|
22
|
Barrett T, Wilhite SE, Ledoux P,
Evangelista C, Kim IF, Tomashevsky M, Marshall KA, Phillippy KH,
Sherman PM, Holko M, et al: NCBI GEO: Archive for functional
genomics data sets-update. Nucleic Acids Res. 41:D991–D995. 2013.
View Article : Google Scholar : PubMed/NCBI
|
|
23
|
Radloff LS: The CES-D scale: A self-report
depression scale for research in the general population. Appl
Psychol Meas. 1:385–401. 1977. View Article : Google Scholar
|
|
24
|
Cutroa CE and Rusell DW: The provisions of
social relationships and adaptation to stress. Adv Pers
Relationships. 1:37–67. 1987.
|
|
25
|
Ritchie ME, Phipson B, Wu D, Hu Y, Law CW,
Shi W and Smyth GK: Limma powers differential expression analyses
for RNA-sequencing and microarray studies. Nucleic Acids Res.
43:e472015. View Article : Google Scholar : PubMed/NCBI
|
|
26
|
Szklarczyk D, Franceschini A, Wyder S,
Forslund K, Heller D, Huerta-Cepas J, Simonovic M, Roth A, Santos
A, Tsafou KP, et al: STRING v10: Protein-protein interaction
networks, integrated over the tree of life. Nucleic Acids Res.
43:D447–D452. 2015. View Article : Google Scholar : PubMed/NCBI
|
|
27
|
Shannon P, Markiel A, Owen O, Baliga NS,
Wang JT, Ramage D, Amin N, Schwikowski B and Ideker T: Cytoscape: A
software environment for integrated models of biomolecular
interaction networks. Genome Res. 2498–2504. 2003. View Article : Google Scholar : PubMed/NCBI
|
|
28
|
Scardoni G, Petterlini M and Laudanna C:
Analyzing biological network parameters with centiScaPe.
Bioinformatics. 25:2857–2859. 2009. View Article : Google Scholar : PubMed/NCBI
|
|
29
|
Ogata H, Goto S, Sato K, Fujibuchi W, Bono
H and Kanehisa M: KEGG: Kyoto encyclopedia of genes and genomes.
Nucleic Acids Res. 27:29–34. 1999. View Article : Google Scholar : PubMed/NCBI
|
|
30
|
Fox R: A view from the web. J R Soc Med.
90:4731997. View Article : Google Scholar
|
|
31
|
Jia P, Kao CF, Kuo PH and Zhao Z: A
comprehensive network and pathway analysis of candidate genes in
major depressive disorder. BMC Syst Biol. 5 (Suppl 3):S122011.
View Article : Google Scholar : PubMed/NCBI
|
|
32
|
Hu Y, Pan Z, Hu Y, Zhang L and Wang J:
Network and pathway-based analyses of genes associated with
parkinson's disease. Mol Neurobiol. 54:4452–4465. 2017. View Article : Google Scholar : PubMed/NCBI
|
|
33
|
Niwattanakul S, Singthongchai J, Naenudorn
E and Wanapu S: Using of jaccard coefficient for keywords
similarity. Proc Int Multiconference Eng Comput Sci. 1:13–15.
2013.
|
|
34
|
Mizuno S, Yamaguchi T, Fukushima A,
Matsuyama Y and Ohashi Y: Overlap coefficient for assessing the
similarity of pharmacokinetic data between ethnically different
populations. Clin Trials. 2:174–181. 2005. View Article : Google Scholar : PubMed/NCBI
|
|
35
|
Gyorffy B, Lánczky A and Szállási Z:
Implementing an online tool for genome-wide validation of
survival-associated biomarkers in ovarian-cancer using microarray
data from 1287 patients. Endocr Relat Cancer. 19:197–208. 2012.
View Article : Google Scholar : PubMed/NCBI
|
|
36
|
Cancer Genome Atlas Research Network, ;
Weinstein JN, Collisson EA, Mills GB, Shaw KR, Ozenberger BA,
Ellrott K, Shmulevich I, Sander C and Stuart JM: The cancer genome
atlas pan-cancer analysis project. Nat Genet. 45:1113–1120. 2013.
View Article : Google Scholar : PubMed/NCBI
|
|
37
|
Denkert C, Budczies J, Darb-Esfahani S,
Györffy B, Sehouli J, Könsgen D, Zeillinger R, Weichert W, Noske A,
Buckendahl AC, et al: A prognostic gene expression index in ovarian
cancer-validation across different independent data sets. J Pathol.
218:273–280. 2009. View Article : Google Scholar : PubMed/NCBI
|
|
38
|
Ahmed AA, Mills AD, Ibrahim AE, Temple J,
Blenkiron C, Vias M, Massie CE, Iyer NG, McGeoch A, Crawford R, et
al: The extracellular matrix protein TGFBI induces microtubule
stabilization and sensitizes ovarian cancers to paclitaxel. Cancer
Cell. 12:514–527. 2007. View Article : Google Scholar : PubMed/NCBI
|
|
39
|
Mok SC, Bonome T, Vathipadiekal V, Bell A,
Johnson ME, Wong KK, Park DC, Hao K, Yip DK, Donninger H, et al: A
gene signature predictive for outcome in advanced ovarian cancer
identifies a survival factor: Microfibril-associated glycoprotein
2. Cancer Cell. 16:521–532. 2009. View Article : Google Scholar : PubMed/NCBI
|
|
40
|
Konstantinopoulos PA, Spentzos D, Karlan
BY, Taniguchi T, Fountzilas E, Francoeur N, Levine DA and Cannistra
SA: Gene expression profile of BRCAness that correlates with
responsiveness to chemotherapy and with outcome in patients with
epithelial ovarian cancer. J Clin Oncol. 28:3555–3561. 2010.
View Article : Google Scholar : PubMed/NCBI
|
|
41
|
Marchion DC, Cottrill HM, Xiong Y, Chen N,
Bicaku E, Fulp WJ, Bansal N, Chon HS, Stickles XB, Kamath SG, et
al: BAD phosphorylation determines ovarian cancer chemosensitivity
and patient survival. Clin Cancer Res. 17:6356–6366. 2011.
View Article : Google Scholar : PubMed/NCBI
|
|
42
|
Gentric G, Kieffer Y, Mieulet V, Goundiam
O, Bonneau C, Nemati F, Hurbain I, Raposo G, Popova T, Stern MH, et
al: PML-regulated mitochondrial metabolism enhances
chemosensitivity in human ovarian cancers. Cell Metab. 29:156–173.
2019. View Article : Google Scholar : PubMed/NCBI
|
|
43
|
Mateescu B, Batista L, Cardon M, Gruosso
T, de Feraudy Y, Mariani O, Nicolas A, Meyniel JP, Cottu P,
Sastre-Garau X and Mechta-Grigoriou F: MiR-141 and miR-200a act on
ovarian tumorigenesis by controlling oxidative stress response. Nat
Med. 17:1627–1635. 2011. View Article : Google Scholar : PubMed/NCBI
|
|
44
|
Bonome T, Levine DA, Shih J, Randonovich
M, Pise-Masison CA, Bogomolniy F, Ozbun L, Brady J, Barrett JC,
Boyd J and Birrer MJ: A gene signature predicting for survival in
suboptimally debulked patients with ovarian cancer. Cancer Res.
68:5478–5486. 2008. View Article : Google Scholar : PubMed/NCBI
|
|
45
|
Vathipadiekal V, Wang V, Wei W, Waldron L,
Drapkin R, Gillette M, Skates S and Birrer M: Creation of a human
secretome: A novel composite library of human secreted proteins:
Validation using ovarian cancer gene expression data and a virtual
secretome array. Clin Cancer Res. 21:4960–4969. 2015. View Article : Google Scholar : PubMed/NCBI
|
|
46
|
King ER, Tung CS, Tsang YT, Zu Z, Lok GT,
Deavers MT, Malpica A, Wolf JK, Lu KH, Birrer MJ, et al: The
anterior gradient homolog 3 (AGR3) gene is associated with
differentiation and survival in ovarian cancer. Am J Surg Pathol.
35:904–912. 2011. View Article : Google Scholar : PubMed/NCBI
|
|
47
|
Ferriss JS, Kim Y, Duska L, Birrer M,
Levine DA, Moskaluk C, Theodorescu D and Lee JK: Multi-gene
expression predictors of single drug responses to adjuvant
chemotherapy in ovarian carcinoma: Predicting platinum resistance.
PLoS One. 7:e305502012. View Article : Google Scholar : PubMed/NCBI
|
|
48
|
Bild AH, Yao G, Chang JT, Wang Q, Potti A,
Chasse D, Joshi MB, Harpole D, Lancaster JM, Berchuck A, et al:
Oncogenic pathway signatures in human cancers as a guide to
targeted therapies. Nature. 439:353–357. 2006. View Article : Google Scholar : PubMed/NCBI
|
|
49
|
Koti M, Gooding RJ, Nuin P, Haslehurst A,
Crane C, Weberpals J, Childs T, Bryson P, Dharsee M and Evans K:
Identification of the IGF1/PI3K/NF κB/ERK gene signalling networks
associated with chemotherapy resistance and treatment response in
high-grade serous epithelial ovarian cancer. BMC Cancer.
13:5492013. View Article : Google Scholar : PubMed/NCBI
|
|
50
|
Lisowska KM, Olbryt M, Dudaladava V,
Pamuła-Piłat J, Kujawa K, Grzybowska E, Jarząb M, Student S,
Rzepecka IK, Jarząb B and Kupryjańczyk J: Gene expression analysis
in ovarian cancer-faults and hints from DNA microarray study. Front
Oncol. 4:62014. View Article : Google Scholar : PubMed/NCBI
|
|
51
|
Uehara Y, Oda K, Ikeda Y, Koso T, Tsuji S,
Yamamoto S, Asada K, Sone K, Kurikawa R, Makii C, et al: Integrated
copy number and expression analysis identifies profiles of
whole-arm chromosomal alterations and subgroups with favorable
outcome in ovarian clear cell carcinomas. PLoS One.
10:e01280662015. View Article : Google Scholar : PubMed/NCBI
|
|
52
|
Tothill RW, Tinker AV, George J, Brown R,
Fox SB, Lade S, Johnson DS, Trivett MK, Etemadmoghadam D, Locandro
B, et al: Novel molecular subtypes of serous and endometrioid
ovarian cancer linked to clinical outcome. Clin Cancer Res.
14:5198–5208. 2008. View Article : Google Scholar : PubMed/NCBI
|
|
53
|
Bray F, Ferlay J, Soerjomataram I, Siegel
RL, Torre LA and Jemal A: Global cancer statistics 2018: GLOBOCAN
estimates of incidence and mortality worldwide for 36 cancers in
185 countries. 394–424. 2018.PubMed/NCBI
|
|
54
|
Chaturvedi SK: Psychiatric oncology:
Cancer in mind. Indian J Psychiatry. 54:111–118. 2012. View Article : Google Scholar : PubMed/NCBI
|
|
55
|
Pasquini M and Biondi M: Depression in
cancer patients: A critical review. Clin Pract Epidemiol Ment
Health. 3:22007. View Article : Google Scholar : PubMed/NCBI
|
|
56
|
Prasad SM, Eggener SE, Lipsitz SR, Irwin
MR, Ganz PA and Hu JC: Effect of depression on diagnosis,
treatment, and mortality of men with clinically localized prostate
cancer. J Clin Oncol. 32:2471–2478. 2014. View Article : Google Scholar : PubMed/NCBI
|
|
57
|
Colombo N, Lorusso D and Scollo P: Impact
of recurrence of ovarian cancer on quality of life and outlook for
the future. Int J Gynecol Cancer. 27:1134–1140. 2017. View Article : Google Scholar
|
|
58
|
Leighton SP, Nerurkar L, Krishnadas R,
Johnman C, Graham GJ and Cavanagh J: Chemokines in depression in
health and in inflammatory illness: A systematic review and
meta-analysis. Mol Psychiatry. 23:48–58. 2018. View Article : Google Scholar : PubMed/NCBI
|
|
59
|
Eyre HA, Air T, Pradhan A, Johnston J,
Lavretsky H, Stuart MJ and Baune BT: A meta-analysis of chemokines
in major depression. Prog Neuropsychopharmacol Biol Psychiatry.
68:1–8. 2016. View Article : Google Scholar : PubMed/NCBI
|
|
60
|
Chen K, Pociask DA, McAleer JP, Chan YR,
Alcorn JF, Kreindler JL, Keyser MR, Shapiro SD, Houghton AM, Kolls
JK and Zheng M: IL-17RA is required for CCL2 expression, macrophage
recruitment, and emphysema in response to cigarette smoke. PLoS
One. 6:e203332011. View Article : Google Scholar : PubMed/NCBI
|
|
61
|
Lim SY, Yuzhalin AE, Gordon-Weeks AN and
Muschel RJ: Targeting the CCL2-CCR2 signaling axis in cancer
metastasis. Oncotarget. 7:28697–28710. 2016. View Article : Google Scholar : PubMed/NCBI
|
|
62
|
Yu T, Guo M, Garza J, Rendon S, Sun X,
Zhang W and Lu XY: Cognitive and neural correlates of
depression-like behaviour in socially defeated mice: An animal
model of depression with cognitive dysfunction. Int J
Neuropsychopharmacol. 14:303–317. 2011. View Article : Google Scholar : PubMed/NCBI
|
|
63
|
Kung JC, Chen TC, Shyu BC, Hsiao S and
Huang AC: Anxiety- and depressive-like responses and c-fos activity
in preproenkephalin knockout mice: Oversensitivity hypothesis of
enkephalin deficit-induced posttraumatic stress disorder. J Biomed
Sci. 17:292010. View Article : Google Scholar : PubMed/NCBI
|
|
64
|
Yokoyama K, Hiyama A, Arai F, Nukaga T,
Sakai D and Mochida J: C-Fos regulation by the MAPK and PKC
pathways in intervertebral disc cells. PLoS One. 8:1–14. 2013.
View Article : Google Scholar
|
|
65
|
Whitmarsh AJ: Regulation of gene
transcription by mitogen-activated protein kinase signaling
pathways. Biochim Biophys Acta. 1773:1285–1298. 2007. View Article : Google Scholar : PubMed/NCBI
|
|
66
|
Li JK, Nie L, Zhao YP, Zhang YQ, Wang X,
Wang SS, Liu Y, Zhao H and Cheng L: IL-17 mediates inflammatory
reactions via p38/c-Fos and JNK/c-Jun activation in an
AP-1-dependent manner in human nucleus pulposus cells. J Transl
Med. 14:772016. View Article : Google Scholar : PubMed/NCBI
|
|
67
|
Ma X, Reynolds SL, Baker BJ, Li X,
Benveniste EN and Qin H: IL-17 enhancement of the IL-6 signaling
cascade in astrocytes. J Immunol. 184:4898–4906. 2010. View Article : Google Scholar : PubMed/NCBI
|
|
68
|
Hayashi KG, Ushizawa K, Hosoe M and
Takahashi T: Differential gene expression of serine protease
inhibitors in bovine ovarian follicle: Possible involvement in
follicular growth and atresia. Reprod Biol Endocrinol. 9:722011.
View Article : Google Scholar : PubMed/NCBI
|
|
69
|
Lassila M, Fukami K, Jandeleit-Dahm K,
Semple T, Carmeliet P, Cooper ME and Kitching AR: Plasminogen
activator inhibitor-1 production is pathogenetic in experimental
murine diabetic renal disease. Diabetologia. 50:1315–1326. 2007.
View Article : Google Scholar : PubMed/NCBI
|
|
70
|
Yamamoto K, Takeshita K, Shimokawa T, Yi
H, Isobe K, Loskutoff DJ and Saito H: Plasminogen activator
inhibitor-1 is a major stress-regulated gene: Implications for
stress-induced thrombosis in aged individuals. Proc Natl Acad Sci.
99:890–895. 2002. View Article : Google Scholar : PubMed/NCBI
|
|
71
|
Eskandari F, Mistry S, Martinez PE, Torvik
S, Kotila C, Sebring N, Drinkard BE, Levy C, Reynolds JC, Csako G,
et al: Younger, premenopausal women with major depressive disorder
have more abdominal fat and increased serum levels of prothrombotic
factors: Implications for greater cardiovascular risk. Metabolism.
54:918–924. 2005. View Article : Google Scholar : PubMed/NCBI
|
|
72
|
Lahlou-Laforet K, Alhenc-Gelas M, Pornin
M, Bydlowski S, Seigneur E, Benetos A, Kierzin JM, Scarabin PY,
Ducimetiere P, Aiach M, et al: Relation of depressive mood to
plasminogen activator inhibitor, tissue plasminogen activator, and
fibrinogen levels in patients with versus without coronary heart
disease. Am J Cardiol. 97:1287–1291. 2006. View Article : Google Scholar : PubMed/NCBI
|
|
73
|
Tsai SJ, Hong CJ, Liou YJ, Yu YW and Chen
TJ: Plasminogen activator inhibitor-1 gene is associated with major
depression and antidepressant treatment response. Pharmacogenet
Genomics. 18:869–875. 2008. View Article : Google Scholar : PubMed/NCBI
|
|
74
|
Fang Y, Zhang L, Zeng Z, Lian Y, Jia Y,
Zhu H and Xu Y: Promoter polymorphisms of SERPINE1 are associated
with the antidepressant response to depression in alzheimer's
disease. Neurosci Lett. 516:217–220. 2012. View Article : Google Scholar : PubMed/NCBI
|
|
75
|
Haslund D, Ryø LB, Seidelin Majidi S, Rose
I, Skipper KA, Fryland T, Bohn AB, Koch C, Thomsen MK, Palarasah Y,
et al: Dominant-negative SERPING1 variants cause intracellular
retention of C1 inhibitor in hereditary angioedema. J Clin Invest.
129:388–405. 2019. View Article : Google Scholar : PubMed/NCBI
|
|
76
|
Madsen DE, Hansen S, Gram J, Bygum A,
Drouet C and Sidelmann JJ: Presence of C1-inhibitor polymers in a
subset of patients suffering from hereditary angioedema. PLoS One.
9:e1120512014. View Article : Google Scholar : PubMed/NCBI
|
|
77
|
Lumry WR, Craig T, Zuraw B, Longhurs H,
Baker J, Li HH, Bernstein JA, Anderson J, Riedl MA, Manning ME, et
al: Health-related quality of life with subcutaneous C1-inhibitor
for prevention of attacks of hereditary angioedema. J Allergy Clin
Immunol Pract. 112:1733–1741. 2018. View Article : Google Scholar
|
|
78
|
Fouche AS, Saunders EF and Craig T:
Depression and anxiety in patients with hereditary angioedema. Ann
Allergy Asthma Immunol. 112:371–375. 2014. View Article : Google Scholar : PubMed/NCBI
|
|
79
|
Varga L, Széplaki G, Laki J, Kocsis A,
Kristóf K, Gál P, Bajtay Z, Wieslander J, Daha MR, Garred P, et al:
Depressed activation of the lectin pathway of complement in
hereditary angioedema. Clin Exp Immunol. 153:68–74. 2008.
View Article : Google Scholar : PubMed/NCBI
|
|
80
|
Ditzen C, Tang N, Jastorff AM, Teplytska
L, Yassouridis A, Maccarrone G, Uhr M, Bronisch T, Miller CA,
Holsboer F and Turck CW: Cerebrospinal fluid biomarkers for major
depression confirm relevance of associated pathophysiology.
Neuropsychopharmacology. 37:1013–1025. 2012. View Article : Google Scholar : PubMed/NCBI
|
|
81
|
Liu RM: Oxidative stress, plasminogen
activator inhibitor 1, and lung fibrosis. Antioxid Redox Signal.
10:303–319. 2008. View Article : Google Scholar : PubMed/NCBI
|
|
82
|
Oh CK, Ariue B, Alban RF, Shaw B and Cho
SH: PAI-1 promotes extracellular matrix deposition in the airways
of a murine Asthma model. Biochem Biophys Res Commun.
294:1155–1160. 2002. View Article : Google Scholar : PubMed/NCBI
|
|
83
|
Singer M and Jones AM: Bench-to-bedside
review: The role of C1-esterase inhibitor in sepsis and other
critical illnesses. Crit Care. 15:2032011. View Article : Google Scholar : PubMed/NCBI
|
|
84
|
Davis AE III, Lu F and Mejia P: C1
inhibitor, a multi-functional serine protease inhibitor. Thromb
Haemost. 104:886–893. 2010. View Article : Google Scholar : PubMed/NCBI
|
|
85
|
Green TA, Alibhai IN, Unterberg S, Neve
RL, Ghose S, Tamminga CA and Nestler EJ: Induction of activating
transcription factors (ATFs) ATF2, ATF3, and ATF4 in the nucleus
accumbens and their regulation of emotional behavior. J Neurosci.
28:2025–2032. 2008. View Article : Google Scholar : PubMed/NCBI
|
|
86
|
Turner CA, Sharma V, Hagenauer MH,
Chaudhury S, O'Connor AM, Hebda-Bauer EK, Thompson RC, Myers RM,
Bunney WE and Barchas JD: Connective tissue growth factor is a
novel prodepressant. Biol Psychiatry. 84:555–562. 2018. View Article : Google Scholar : PubMed/NCBI
|
|
87
|
Giese-Davis J, Collie K, Rancourt KM, Neri
E, Kraemer HC and Spiegel D: Decrease in depression symptoms is
associated with longer survival in patients with metastatic breast
cancer: A secondary analysis. J Clin Oncol. 29:413–420. 2011.
View Article : Google Scholar : PubMed/NCBI
|
|
88
|
Raison CL and Miller AH: The evolutionary
significance of depression in pathogen host defense (PATHOS-D). Mol
Psychiatry. 18:15–37. 2013. View Article : Google Scholar : PubMed/NCBI
|
|
89
|
Wojnarowicz P, Gambaro K, de Ladurantaye
M, Quinn MC, Provencher D, Mes-Masson AM and Tonin PN:
Overexpressing the CCL2 chemokine in an epithelial ovarian cancer
cell line results in latency of in vivo tumourigenicity.
Oncogenesis. 1:e272012. View Article : Google Scholar : PubMed/NCBI
|
|
90
|
Mahner S, Baasch C, Schwarz J, Hein S,
Wölber L, Jänicke F and Milde-Langosch K: C-Fos expression is a
molecular predictor of progression and survival in epithelial
ovarian carcinoma. Br J Cancer. 99:1269–1275. 2008. View Article : Google Scholar : PubMed/NCBI
|
|
91
|
Andreasen PA, Kjøller L, Christensen L and
Duffy MJ: The urokinase-type plasminogen activator system in cancer
metastasis: A review. Int J cancer. 72:1–22. 1997. View Article : Google Scholar : PubMed/NCBI
|
|
92
|
Klein RM, Bernstein D, Higgins SP, Higgins
CE and Higgins PJ: SERPINE1 expression discriminates site-specific
metastasis in human melanoma. Exp Dermatol. 21:551–554. 2012.
View Article : Google Scholar : PubMed/NCBI
|
|
93
|
Peng S, Du T, Wu W, Chen X, Lai Y, Zhu D,
Wang Q, Ma X, Lin C, Li Z, et al: Decreased expression of serine
protease inhibitor family G1 (SERPING1) in prostate cancer can help
distinguish high-risk prostate cancer and predicts malignant
progression. Urol Oncol. 36:366.e1–366.e9. 2018. View Article : Google Scholar
|
|
94
|
Mejia P, Diez-Silva M, Kamena F, Lu F,
Fernandes SM, Seeberger PH, Davis AE III and Mitchell JR: Human
C1-inhibitor suppresses malaria parasite invasion and cytoadhesion
via binding to parasite glycosylphosphatidylinositol and host cell
receptors. J Infect Dis. 213:80–89. 2016. View Article : Google Scholar : PubMed/NCBI
|