Open Access

Bioinformatics analysis of Ewing's sarcoma: Seeking key candidate genes and pathways

  • Authors:
    • Jinming Zhang
    • Yao Zhang
    • Ze Li
    • Hongzeng Wu
    • Jianjun Xun
    • Helin Feng
  • View Affiliations

  • Published online on: September 30, 2019     https://doi.org/10.3892/ol.2019.10936
  • Pages: 6008-6016
  • Copyright: © Zhang et al. This is an open access article distributed under the terms of Creative Commons Attribution License.

Metrics: Total Views: 0 (Spandidos Publications: | PMC Statistics: )
Total PDF Downloads: 0 (Spandidos Publications: | PMC Statistics: )


Abstract

Ewing's sarcoma (ES) is the second most common bone tumor among children and adolescents worldwide. However, the genes and signaling pathways involved in ES tumorigenesis and progression remain unclear. The present study used two gene‑expression profile datasets (GSE17674 and GSE31215) to elucidate key potential candidate genes and pathways in ES. Differentially expressed genes (DEGs) were identified and a functional enrichment analysis was performed. A protein‑protein interaction (PPI) network was constructed, and the most significant module in the PPI network was selected from the Search Tool for the Retrieval of Interacting Genes/Proteins database. A total of 278 genes were identified by comparing the tumor samples with non‑cancerous samples; these included 272 upregulated and 6 downregulated genes. The pathway analysis demonstrated significant enrichment in the positive regulation of transcription in the DEGs coding for RNA polymerase II promoter, plasma membrane and chromatin binding pathways in cancer in general. There were 269 nodes and 292 edges in the PPI network. Finally, MYC, IGF1, OAS1, EZH2 and ISG15 were identified as the hub genes according to the degree levels. The survival analysis revealed that EZH2 is associated with a poor prognosis in patients with ES. In conclusion, the DEGs, associated pathways and hub genes identified in the present study help elucidate the underlying molecular mechanisms of ES carcinogenesis and progression, and provide potential molecular targets and biomarkers for ES.

Introduction

Ewing's sarcoma (ES) is the second most common primary bone tumor among children and adolescents worldwide (1). In recent years, with the increase in ES research, significant progress has been made towards the diagnosis, treatment, as well as prognosis of this disease. The current standard treatment for ES involves a five-drug chemotherapy regimen (vincristine, doxorubicin, cyclophosphamide, ifosfamide and etoposide), and local resection or radiation therapy, or both (2). Although these treatments improve the survival rate of patients, the high rates of recurrence and metastasis in patients with ES necessitate the urgent development of new diagnostic strategies and therapeutic agents to improve patient prognosis. As the molecular mechanisms of ES tumorigenesis and progression are not yet entirely understood, there remains to be a number of unresolved issues in the diagnosis and treatment of ES. New ES-associated technologies, as well as drugs, have emerged, but they did not meet the clinical standards. Therefore, it is essential to identify new genes and pathways associated with ES tumorigenesis and patient prognosis, in order to help unravel the relevant underlying molecular mechanisms, and to help discover novel diagnostic markers and therapeutic targets.

Bioinformatics is a relatively new interdisciplinary subject that emerged in the late 1980s alongside the launch of the Human Genome Project. It reflects the permeation and integration of biology, computer science, mathematics, physics (3) Through the acquisition, processing, storage, retrieval and analysis of experimental biological data, one achieves the purpose of interpreting the biological meaning and mechanisms underlying the activities in question from within the data. With the rapid development of microarray technology and bioinformatic analyses, microarrays are being used extensively for detecting gene expression levels, particularly in seeking differentially expressed genes (DEGs) (4). The application of microarrays has produced a large amount of data, which have been uploaded and stored in public databases. The use of microarray databases allows the identification of thousands of genes in ES, which can be utilized to screen for more molecular biomarkers. In the present study, two microarray datasets from the Gene Expression Omnibus (GEO) database (5) were downloaded and analyzed in order to investigate the characteristics of the ES genomic expression profiles, as well as to screen for DEGs. DEGs were identified by comparing tumor samples with non-cancerous samples. The potential functions of these DEGs were investigated via Gene Ontology (GO) terms (6) and Kyoto Encyclopedia of Genes and Genomes (KEGG) (7) pathway enrichment analyses. In addition, the present study also constructed a protein-protein interaction (PPI) network to identify the hub genes in ES. A total of 278 genes were identified in the present study, and these findings may contribute to the diagnosis and therapy of ES in the future.

Materials and methods

Microarray data

The present study downloaded two gene expression datasets (GSE17674 (8) and GSE31215 (9) from the GEO database based on Affymetrix GPL570 platform data (Affymetrix Human Genome U133 Plus 2.0 Array). The GSE17674 dataset contained 62 tissue samples, including 44 ES samples and 18 normal skeletal muscle samples; the GSE31215 dataset contained 4 ES samples and 4 non-cancerous human pediatric mesenchymal stem cell samples.

Expression analysis of DEGs

The bioinformatics analysis involved downloading the original Celestia files and the platform-probe annotation information file. The raw data were first processed using the robust multi-array average (RMA) function (10) and later transformed into expression values utilizing the affy package (11) (version 3.5.0) in R language (12). The probe IDs were changed to the corresponding gene symbol according to the annotation information in the platform. The missing parts of the data were filled with the algorithm K-nearest neighbors (KNNimpute) (13). The limma package (14) of R was used for detecting the DEGs between the tumor samples and non-cancerous samples. A logFC (|log2-fold change|) value >1 and P<0.05 were considered to indicate a statistically significant difference.

GO and KEGG enrichment analysis

The Database for Annotation, Visualization and Integrated Discovery (DAVID; version 6.8) (15) is an online biological information database that provides a series of functional annotation tools to investigate the biological function of genes. In order to analyze the function of DEGs, the present study inputted the DEGs into the DAVID for the GO (6) and KEGG (16) enrichment analyses. GO annotates and classifies genes via biological pathways, molecular functions and cellular location, whereas KEGG identifies the relevant pathways in which these differential genes may be involved. Gene counts >5 and P<0.05 were selected as the cut-off criteria for the enrichment analysis.

PPI network and hub genes

The online Search Tool for the Retrieval of Interacting Genes (STRING) (17) is an online database that provides critical assessment and integration of PPIs. Interactions with a combined score >0.9 was considered statistically significant in the present study. The PPI network was visualized using Cytoscape (version 3.6.1) (18), and the Cytoscape plugin Molecular Complex Detection (MCODE) (19) was used for identifying the most significant module in the PPI network. Subsequently, MCODE scores >5, degree cutoff=2, node score cutoff=0.2, Max depth=100 and k-core=2 were used as filtering criteria. KEGG and GO analyses were performed for genes in this module. The top 5 genes sorted by the degree levels in the Cytoscape plugin, cytoHubba (20) were defined as hub genes, and these 5 genes were utilized in the co-expression gene network and mutation survival analysis, using Kaplan-Meier curves generated with the cBioPortal (http://www.cbioportal.org) online platform (21).

Results

Identification of DEGs

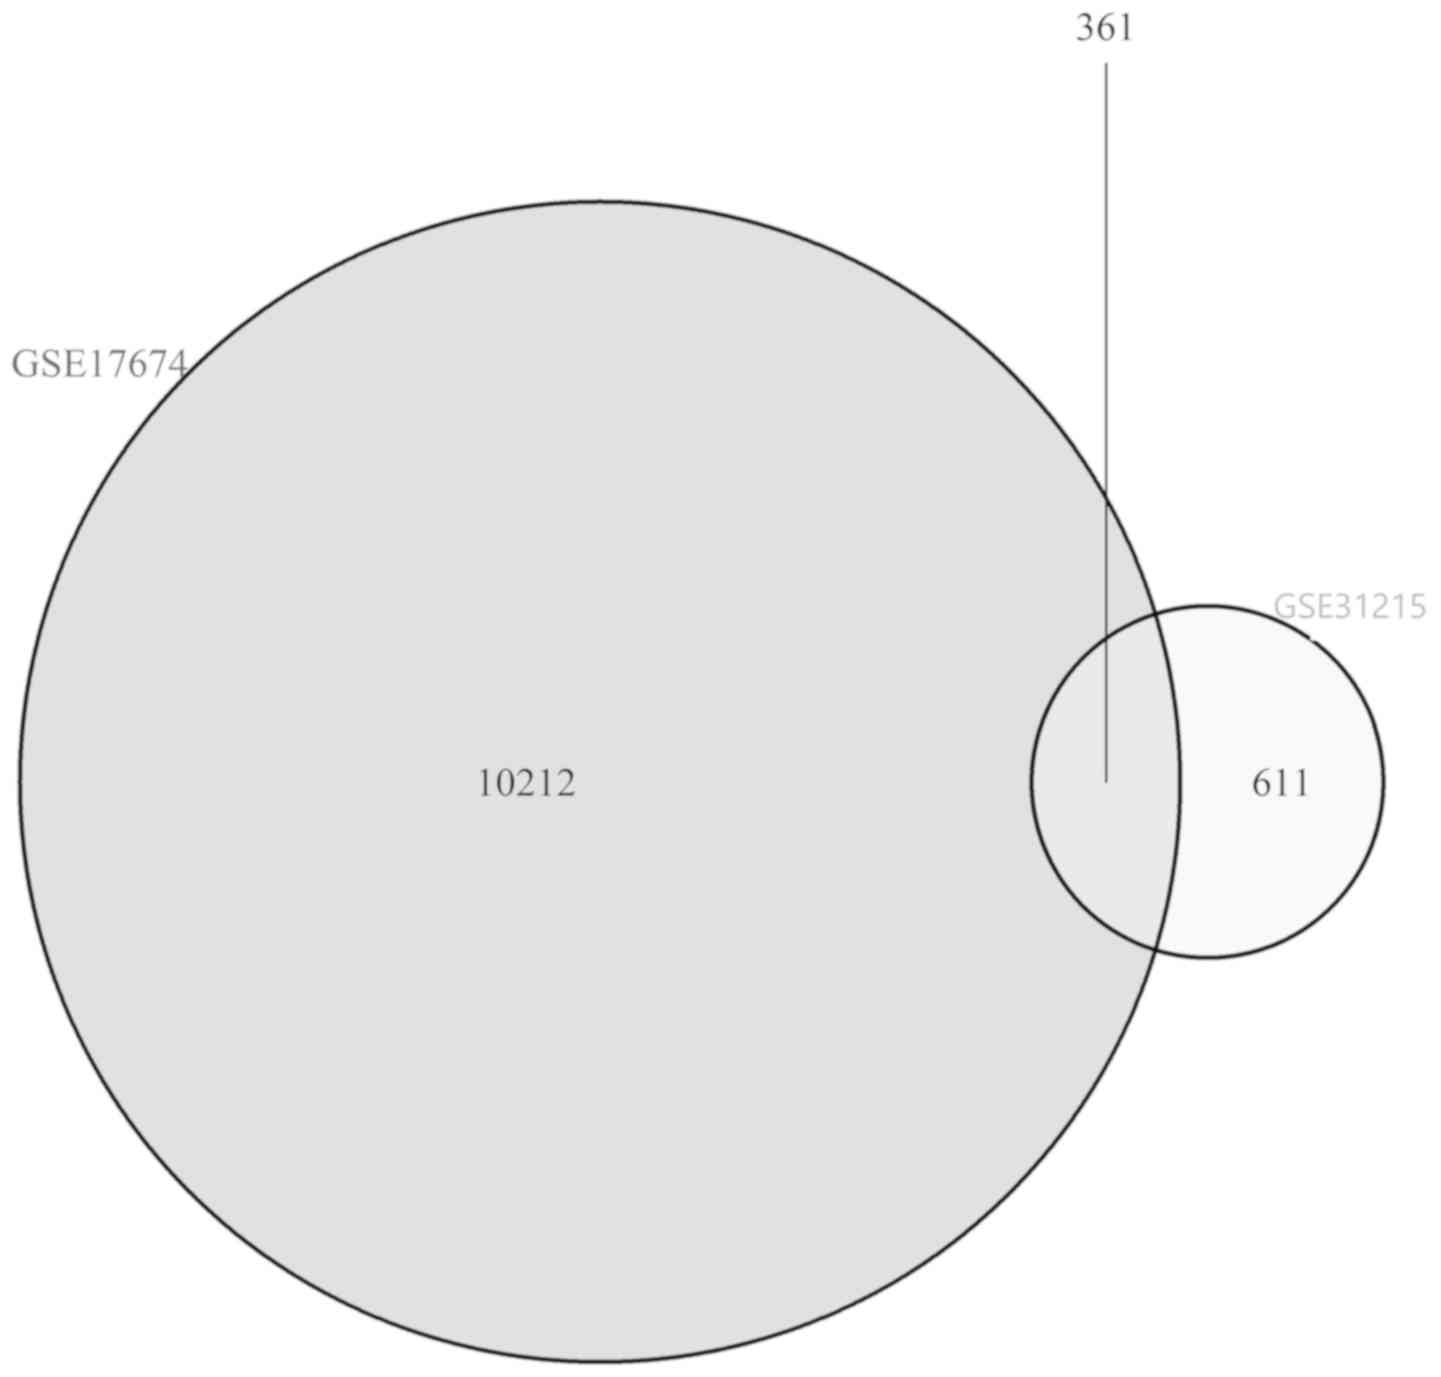
The overlap among the two datasets contained 361 genes (10,212 in the GSE17674 dataset, and 611 in the GSE31215 dataset), as presented in the Venn diagram (Fig. 1). The results demonstrated the upregulation of 272 genes in the two datasets, and the downregulation of 6 genes. Genes that were not simultaneously up- or downregulated in the two datasets were excluded, and a total of 278 genes were identified as DEGs (Table I).

Table I.

Compared with non-cancerous samples, 278 DEGs were identified from the datasets analyzed, 272 of which were upregulated and 6 of which were downregulated in tumor samples.

Table I.

Compared with non-cancerous samples, 278 DEGs were identified from the datasets analyzed, 272 of which were upregulated and 6 of which were downregulated in tumor samples.

StatusDEGs
DownregulatedSYNM, GPAT3, LINC01119, PPL, LOC101929897, HAS3
UpregulatedRIDA, EWSAT1, KHDRBS3, CDH8, SAMD9L, HOXD9, LPAR4, OGDHL, SV2B, SLC5A6, WBSCR17, MYO10, CAPN15, GFRA2, GADD45B, NR2F1, CCDC155, LRRC4C, COL21A1, ZNF57, CA11, DLX3, CD99P1, CDS1, HSD17B2, PARM1, RASSF2, TMEM176A, SOX8, RPP25, POLA1, CHGBPIP5K1C, PCDHB5, ZNF711, CHST1, PDGFD, TGIF2, HERC5, TMEM91, ADGRL1, PLSCR1, CLCA1, LINC01503, C5, ALDH16A1, ATP6V0B, ITGB2-AS1, CYTL1, TBCCD1, CLSTN2, PALM2, COL9A3, ASAP1, PRKAR2B, SULT1A1, DDIT4, PNP, FGFR3, IFITM3, ISL1, HLA-E, LAPTM5, ARTN, ADARB1, MYL9, TRIM69, MAPT, ADRA1D, SPATA13, MND1, TLE2, GMFG, FBXO15, C1orf226, TDRD3, FAM213A, LAMB3, FMOD, ZNF195, INTS6L, HIST1, H2BD, KCNE4, IFIT5, SP110, ASGR1, SLCO5A1, STK32B, GALNT14, IFITM1, IGSF21, ZNF703, ITGB2, OAS3, ST6GAL1, NYNRIN, ERFE, CLDN1, YPEL5, SYT4, OAS1, FREM1, CITED2, IL1RAP, MBD4, STMN4, NR0B1, LMO2, ERF, PTPN22, NCKAP1L, CSRNP2, BHLHE22, LINS1, PEG3-AS1, CAV2, RAP1GAP, ALG6, ADGRE5, INTU, L3MBTL3, HIST1H2BE, TOX3, EFNA1, EPHA3, SORD, TRIM35, MEIS1, NME7, ODF2L, KIAA1462, IGF1, ZNF468, ZNF432, TRHDE, NCKAP5, UNC5A, PROS1, TMEM71, PLXDC2, EMILIN1, LBH, HIST1H2BH, CADPS2, ZNF426 TCF4, LOC102724275, SSBP4, FAM107B, TEAD2, MAFB, SMARCC1, SH2B3, CPNE4, LINGO1, GOT1L1, CRIP1, RGS2, POU3F1, NPY, CRIP2, APELA, CARD16, ENPEP, ISG15, LECT1, GDF10, ADRB3, FAT3, MSX1, HIST1H2AC, TRIB2, SYT1, OLFML3, AKAP7, CD14, HS3ST4, PLSCR4, CLIP2, SEC11C, RAB11FIP1, S1PR3, LOXHD1, OLFM3, HOXD13, RUNX3, PGLYRP2, UTS2, KIT, DNAJC12, LGALS8, H2BFS, CPVL, CALCB, OLFM1, RCOR1, MFAP4, CSRP1, ZDHHC21, BGN, STEAP2, DLG2, IRS2, DUSP6, TFAP2B, TRPM4, GPR137B, IVNS1ABP, GIMAP2, AMER2, MXRA5, PCDH17, RARRES2, HOOK1, JAK1, TPBG, ITM2A, MYC, SMA4, APOE, SLAIN1, CCK, ABHD6, JAKMIP2, MMP9, GRP, RGL1, SCG2, EGR2, GALNT7, NPTXR, FCGRT, CDH11, NUDT11, NELL2, NAIP, MARCKSL1, ALDH7A1, LIPI, TOX2, TNC, SLC26A2, GLCE, APCDD1, FAT4, EDNRA, KMO, TMEFF2, TSPAN13, CCDC171, LY96, CYP26B1, ID4, DAPK1, PAX7, ATP1A1, RBM11, DKK2, EZH2, KDSR, CKS2, PRSS35, ADGRG2, PCDH8, ID2, PTPN13, STEAP1, HMCN1, FAM84B, BCL11B, PRKCB, NKX2-2
GO enrichment and KEGG pathway analysis

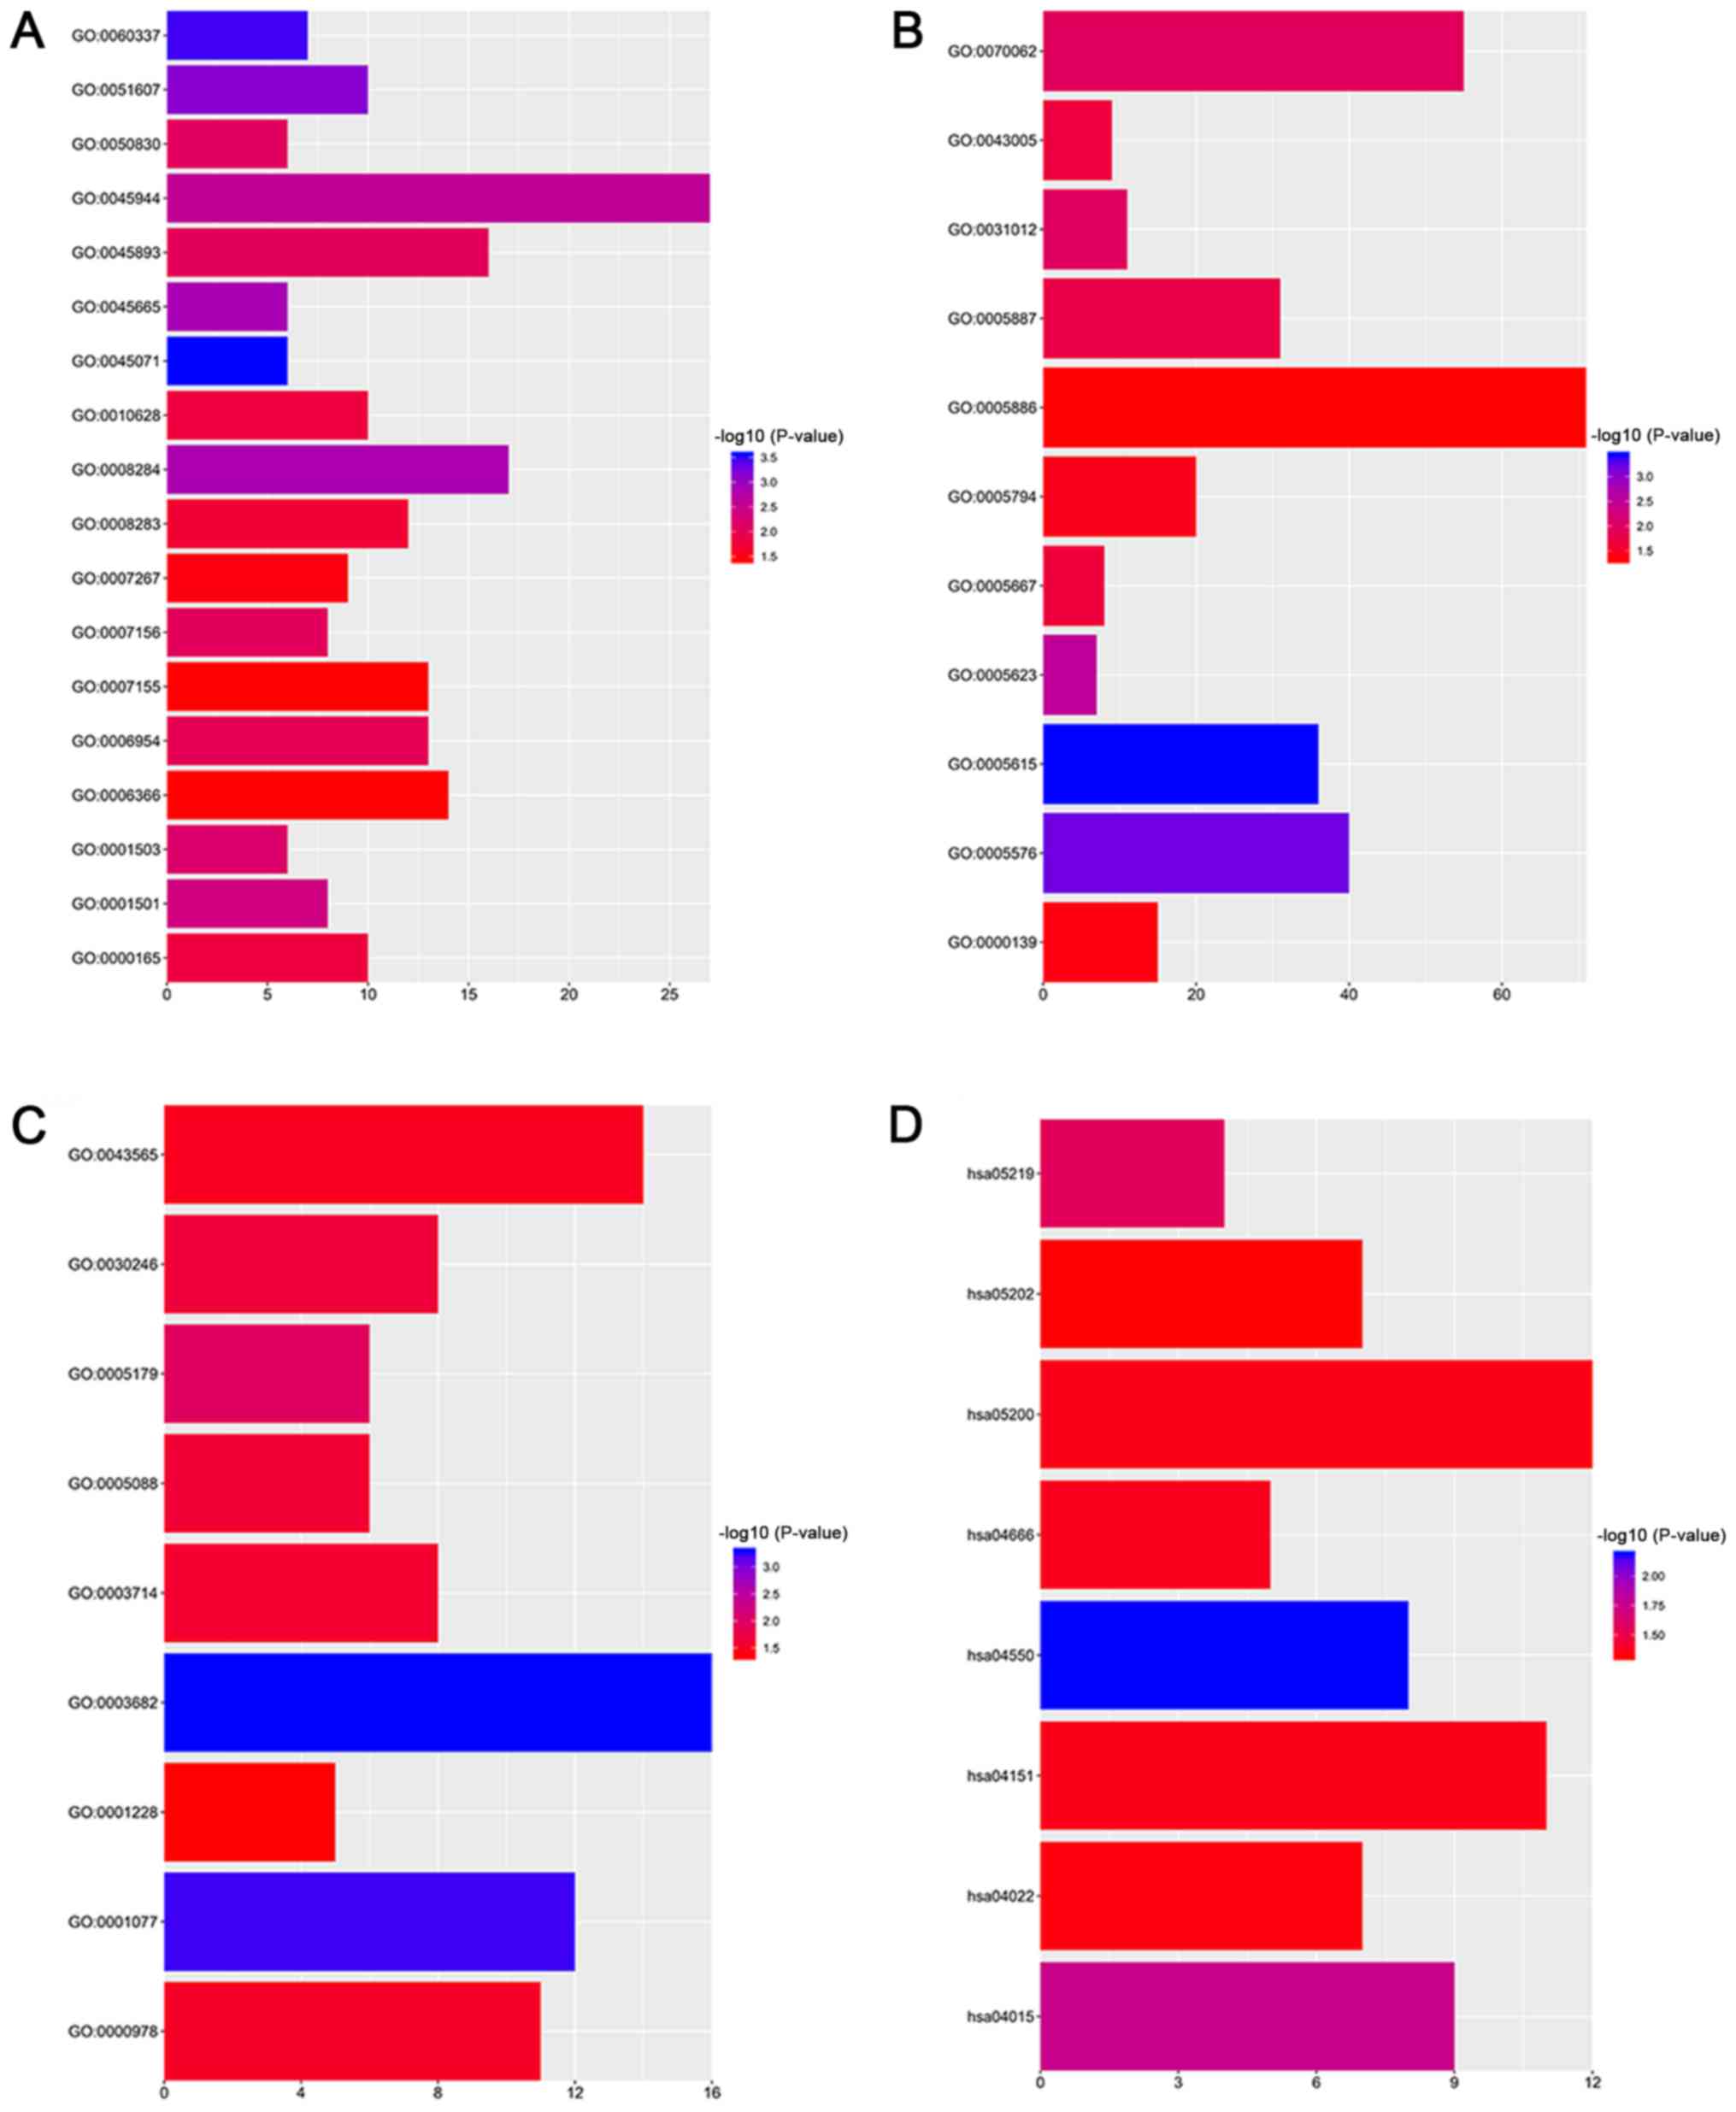
The present study imported the DEGs into DAVID in order to classify the functions with the GO and KEGG pathway analyses. The GO analysis revealed an enrichment of DEGs in 37 functional clusters (Table II). With respect to the biological process terms, the DEGs were primarily enriched in the positive regulation of, ‘positive regulation of transcription from RNA polymerase II promoter’, ‘positive regulation of cell proliferation’, ‘transcription from RNA polymerase II promoter’, ‘positive regulation of transcription, DNA-template’, ‘inflammatory response’, ‘cell adhesion’ and ‘cell proliferation’ (Fig. 2A). As for the cell component terms, the DEGs were primarily enriched in, ‘plasma membrane’, ‘extracellular exosome’, ‘integral component of plasma membrane’, ‘extracellular region’ and ‘extracellular space’ (Fig. 2B). In regard to the molecular function terms, the DEGs were primarily enriched in ‘chromatin binding’, ‘sequence-specific DNA binding’, ‘transcriptional activator activity, RNA polymerase II core promoter proximal region sequence-specific binding’ and ‘RNA polymerase II core promoter proximal region sequence-specific DNA binding’ (Fig. 2C). The KEGG pathway analysis demonstrated significantly enriched DEGs in certain cancer-associated pathways, including ‘phosphoinositide 3-kinase-protein kinase B (PI3K-Akt) signaling pathway’, ‘Rap1 signaling pathway’, ‘signaling pathways regulating the pluripotency of stem cells’, ‘cyclic guanosine monophosphate-protein kinase G signaling pathway’ and ‘transcriptional misregulation in cancer’ (Fig. 2D).

Table II.

GO and KEGG pathway enrichment analysis of DEGs in Ewing sarcoma samples.

Table II.

GO and KEGG pathway enrichment analysis of DEGs in Ewing sarcoma samples.

CategoryIDTermCount
BPGO:0045071Negative regulation of viral genome replication6
BPGO:0060337Type I interferon signaling pathway7
BPGO:0051607Defense response to virus10
BPGO:0045665Negative regulation of neuron differentiation6
BPGO:0008284Positive regulation of cell proliferation17
BPGO:0045944Positive regulation of transcription from RNA polymerase II promoter27
BPGO:0001501Skeletal system development8
BPGO:0001503Ossification6
BPGO:0050830Defense response to Gram-positive bacterium6
BPGO:0007156Homophilic cell adhesion via plasma membrane adhesion molecules8
BPGO:0045893Positive regulation of transcription, DNA-templated16
BPGO:0006954Inflammatory response13
BPGO:0010628Positive regulation of gene expression10
BPGO:0000165MAPK cascade10
BPGO:0008283Cell proliferation12
BPGO:0007267Cell-cell signaling9
BPGO:0007155Cell adhesion13
BPGO:0006366Transcription from RNA polymerase II promoter14
CCGO:0005615Extracellular space36
CCGO:0005576Extracellular region40
CCGO:0005623Cell7
CCGO:0031012Extracellular matrix11
CCGO:0070062Extracellular exosome55
CCGO:0005887Integral component of plasma membrane31
CCGO:0043005Neuron projection9
CCGO:0005667Transcription factor complex8
CCGO:0005794Golgi apparatus20
CCGO:0000139Golgi membrane15
CCGO:0005886Plasma membrane71
MFGO:0003682Chromatin binding16
MFGO:0001077Transcriptional activator activity, RNA polymerase II core promoter proximal region sequence-specific binding12
MFGO:0005179Hormone activity6
MFGO:0030246Carbohydrate binding8
MFGO:0005088Ras guanyl-nucleotide exchange factor activity6
MFGO:0003714Transcription co-repressor activity8
MFGO:0000978RNA polymerase II core promoter proximal region sequence-specific DNA binding11
MFGO:0043565Sequence-specific DNA binding14
KEGGhsa04550Signaling pathways regulating pluripotency of stem cells8
KEGGhsa04015Rap1 signaling pathway9
KEGGhsa05219Bladder cancer4
KEGGhsa04666Fc gamma R-mediated phagocytosis5
KEGGhsa05200Pathways in cancer12
KEGGhsa04151PI3K-Akt signaling pathway11
KEGGhsa04022Cgmp-PKG signaling pathway7
KEGGhsa05202Transcriptional misregulation in cancer7

[i] GO, Gene Ontology; KEGG, Kyoto Encyclopedia of Genes and Genomes; BP, biological process; CC, cellular component; MF, molecular function.

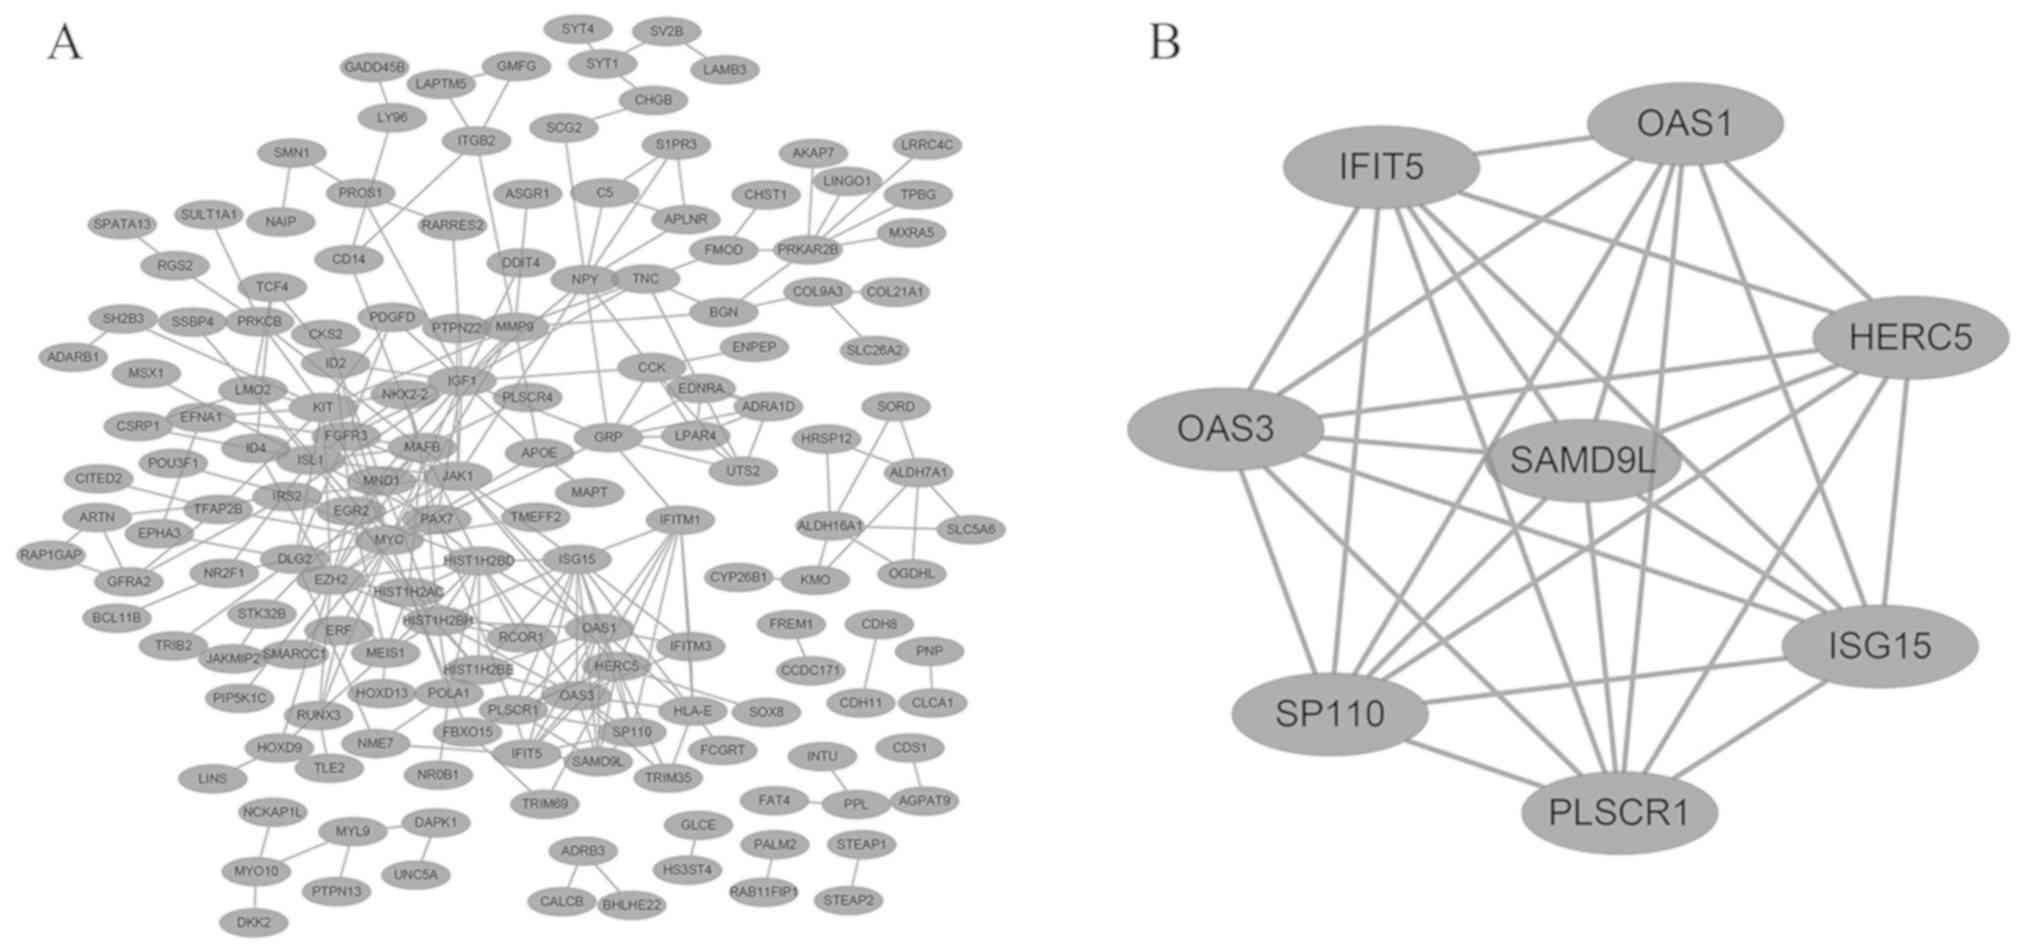
The present study subsequently constructed a PPI network utilizing STRING and Cytoscape in order to depict the interactions between the identified DEGs (Fig. 3A). There were 269 nodes and 292 edges in the network. A significant module was built with 8 nodes and 28 edges, which had the highest MCODE score (Fig. 3B). The functional analysis of genes involved in this module revealed that the genes were enriched primarily in multi-organism processes, immune system processes and 2′-5′-oligoadenylate synthetase activity.

Hub gene analysis

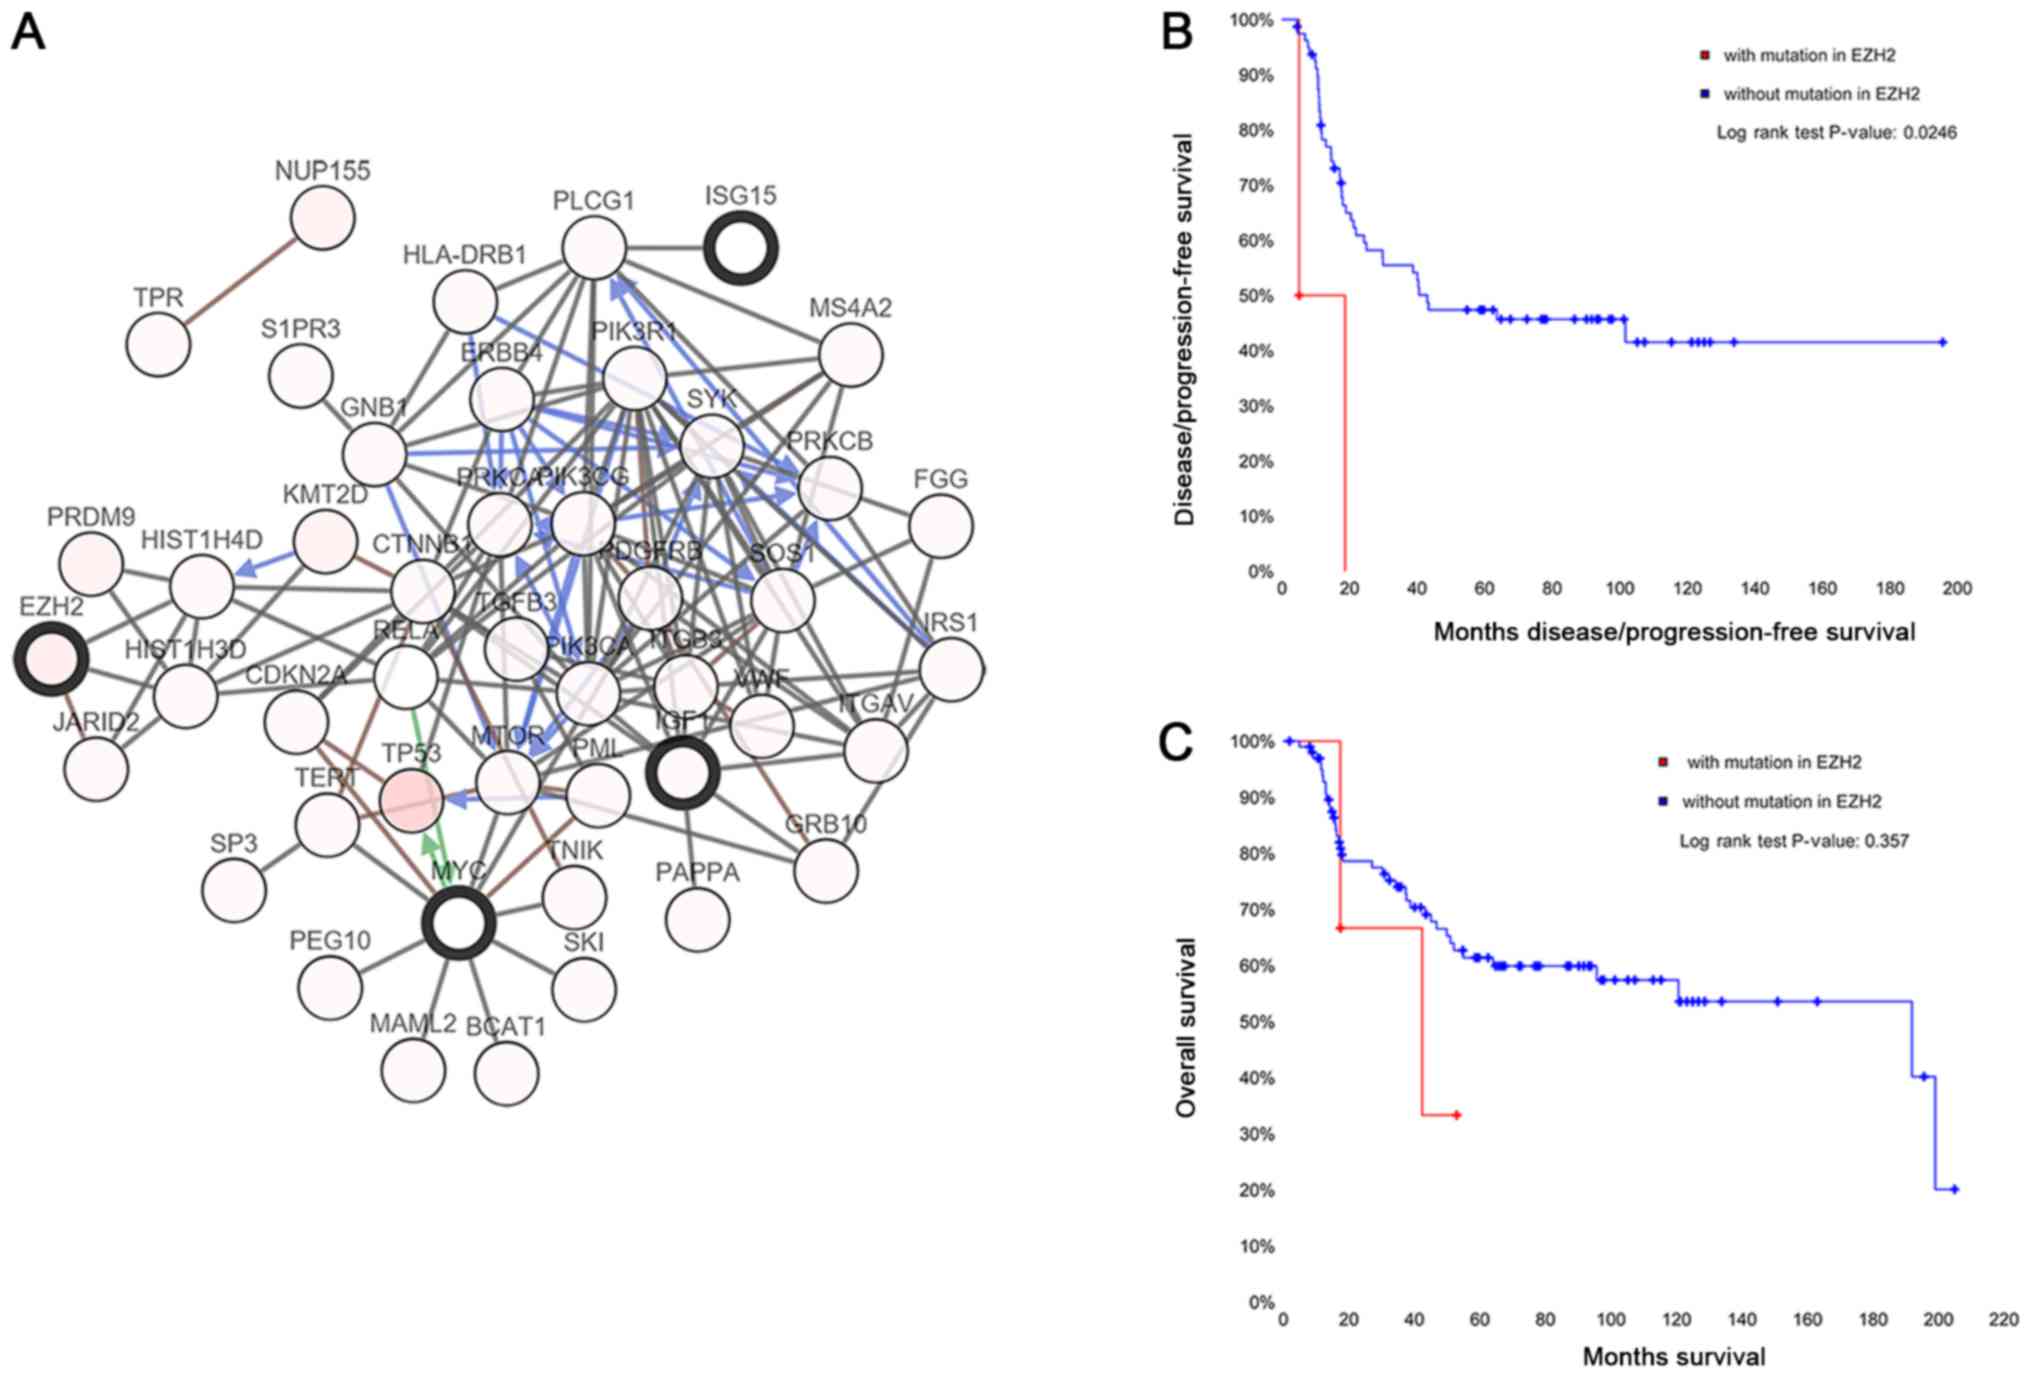
The top 5 genes identified as hub genes were MYC, IGF1, OAS1, EZH2 and ISG15. The network of the hub genes and their co-expression genes was analyzed using the cBioPortal online platform (Fig. 4A). The mutation survival analysis was only available for EZH2 from the database, and the results revealed that the EZH2 mutation was significantly associated with worse disease-free survival time (Fig. 4B and C).

Discussion

ES is primarily observed in bones and muscles, as well as in soft tissues. It is the second most common primary malignant bone tumor in children and adolescents, second only to osteosarcoma (1). The ES family of tumors is an aggressive childhood cancer that includes classic ES, Askin's tumor and peripheral primitive neuroectodermal tumor (1). Previous studies on ES have reported the characteristic t(11;22) chromosomal translocation, and the resulting EWS-FLI1 gene fusion was revealed to have an impact on diagnosis (22); despite this, the specific pathogenesis of ES is not yet understood. Microarray technology enables the investigation of genetic alterations in cancer and is a useful approach for identifying new biomarkers in a number of different diseases (23). Advances in microarray technology enabled the elucidation of the molecular mechanism underlying ES development, and also in the identification of novel diagnostic biomarkers.

In the present study, two gene profile datasets were selected from the GEO for the bioinformatics analysis. A total of 278 genes were identified through comparing tumor samples with non-cancerous samples. The KEGG enrichment analysis in the present study revealed that the identified DEGs were enriched primarily in cancer-associated pathways and the PI3K-Akt signaling pathway. Earlier studies have reported that the PI3K-Akt signaling pathway participates in the proliferation, invasion and migration of tumor cells, and these results support those of the present study (24,25). A PPI network was constructed for the identified DEGs, and the most significant module was subsequently extracted from the PPI network. A total of five key genes were defined based on the degree rank, and included two of the genes in this module.

As a proto-oncogene and a nuclear phosphoprotein coding gene, MYC plays a role in cell cycle progression, apoptosis and cellular transformation (26). Previous studies have reported the involvement of MYC amplification in a multitude of different types of human cancer (27,28). Diseases associated with MYC include Burkitt's lymphoma and multiple myeloma (29). MYC participation is evident in multiple pathways from the KEGG pathway analysis of DEGs. In an earlier report, Kawano et al (25) reported increased MYC expression by microRNA-20b, which promotes cell proliferation in ES cells. A previous study has demonstrated that MYC-driven cancer cells promote tumorigenesis through immune escape, suggesting that MYC-induced tumors may be particularly sensitive to immuno-oncological interventions (30).

Insulin growth factor 1 (IGF1) encodes a protein involved in mediating growth and development. As a ligand for the IGF1-receptor (IGF1R), IGF1 binds to the α subunit of IGF1R, resulting in the activation of intrinsic tyrosine kinase activity, thereby activating the PI3K/AKT and the RAS/mitogen-activated protein kinase pathways (31). Earlier evidence suggested that IGF1 pathway plays a significant role in the pathogenesis of ES, and that IGF1R serves as a potential therapeutic target both in vitro and in vivo (32). The IGF1 pathway [IGF1R, 2 ligands (IGF1 and IGF2), and 6 IGF-binding proteins (IGF-BP1-6)] serves as a biomarker for disease progression in patients with ES; in these patients, high circulating levels of IGF-1 and IGF-BP3 at baseline are associated with a favorable outcome following treatment with chemotherapy (33). In addition, the differential expression of IGF-I transcripts has been demonstrated in bladder cancer and colorectal carcinoma (34).

The 2′-5′-oligoadenylate synthetase 1 (OAS1) belongs to the OAS family, which inhibits cellular protein synthesis and resistance to viral infection (35). Lee et al (36) demonstrated that OAS1 negatively regulates the expression of chemokines and interferon-responsive genes in human macrophages. Literature search results did not reveal any association between OAS and the carcinogenesis or progression of tumors; thus suggesting that ES occurrence may be associated with OAS1, but further investigations are required.

EZH2 is a protein-coding gene that encodes a histone methyltransferase that serves as the catalytic subunit of PRC2. It has been reported that mutations in EZH2 are associated with a number of different types of cancer, such as gastric cancer and hematological malignancies, and high EZH2 expression is associated with metastatic disease in pediatric soft tissue sarcomas (37). Richter et al (38) demonstrated that EZH2 promotes tumorigenesis by shaping the oncogenicity and stem cell phenotype in ES pathology (38). Furthermore, EZH2 inhibitors have been used as targeted therapies in the treatment of a variety of malignancies (39). EZH2 is expressed in numerous types of immune cell and has distinct functions. In recent years, significant advances have been made by using EZH2 as a target of immunotherapy in various different types of cancer (39). An increasing number of EZH2-targeted drugs, such as tazemetostat, CPI-1205, GSK2816126 and SHR2554, are being tested using in vitro biochemical and cell analyses, in vivo preclinical models and patient clinical trials, and have demonstrated antitumor effects in various types of malignant tumor. Reports have demonstrated that treatment with EZH2 inhibitor sensitizes ES cells to effective cytolysis by G-specific chimeric antigen receptor gene-modified T cells (40).

Interferon-stimulated gene 15 (ISG15) encodes an ubiquitin-like protein that is conjugated to intracellular target proteins upon activation by IFN-α and IFN-β (41). Previous studies have reported that ISG15 plays a vital role in antiviral and antitumor mechanisms (4244). The expression of ISG15 has implications in a wide range of human tumors, such as digestive system tumor, breast cancer and lung cancer (4547). Upregulation of ISG15 has been reported in breast carcinoma cells and was proposed as a novel breast cancer marker with prognostic significance. Reports have demonstrated that strategies for manipulating ISG15 levels through the IFN-α/ISG15/p53 axis may prove to be effective in the treatment of cervical cancer (40). Hence, further investigation of the role of ISG15 would help in not only the identification of novel drug targets, but would also provide new opportunities for intervention in cancer progression.

In conclusion, the present study analyzed two ES-associated cohort profile datasets and identified candidate genes and pathways that may participate in ES tumorigenesis and progression. These results may not only contribute to an improved understanding of the underlying molecular mechanisms, but also provide a series of potential biomarkers and therapeutic targets. However, further experiments are required to verify the findings of the present study.

Acknowledgements

Not applicable.

Funding

No funding was received.

Availability of data and materials

The datasets generated and/or analyzed during the current study are available in the (GEO database) repository, (https://www.ncbi.nlm.nih.gov/gds/).

Authors' contributions

HLF and JMZ conceived and designed the study. YZ and JMZ wrote the paper and analyzed the data. ZL, HZW and JJX acquired, interpreted the data and consulted the literature. JMZ, HLF, YZ and ZL reviewed and edited the manuscript. All authors read and approved the manuscript for publication.

Ethics approval and consent to participate

Not applicable.

Patient consent for publication

Not applicable.

Competing interests

The authors declare that they have no competing interests.

References

1 

Balamuth NJ and Womer RB: Ewing's sarcoma. Lancet Oncol. 11:184–192. 2010. View Article : Google Scholar : PubMed/NCBI

2 

Womer RB, West DC, Krailo MD, Dickman PS, Pawel BR, Grier HE, Marcus K, Sailer S, Healey JH, Dormans JP and Weiss AR: Randomized controlled trial of interval-compressed chemotherapy for the treatment of localized Ewing sarcoma: A report from the Children's Oncology Group. J Clin Oncol. 30:4148–4154. 2012. View Article : Google Scholar : PubMed/NCBI

3 

Shachak A, Ophir R and Rubin E: Applying instructional design theories to bioinformatics education in microarray analysis and primer design workshops. Cell Biol Educ. 4:199–206. 2005. View Article : Google Scholar : PubMed/NCBI

4 

Vogelstein B, Papadopoulos N, Velculescu VE, Zhou S, Diaz LA Jr and Kinzler KW: Cancer genome landscapes. Science. 339:1546–1558. 2013. View Article : Google Scholar : PubMed/NCBI

5 

Edgar R, Domrachev M and Lash AE: Gene Expression Omnibus: NCBI gene expression and hybridization array data repository. Nucleic Acids Res. 30:207–210. 2002. View Article : Google Scholar : PubMed/NCBI

6 

Ashburner M, Ball CA, Blake JA, Botstein D, Butler H, Cherry JM, Davis AP, Dolinski K, Dwight SS, Eppig JT, et al: Gene ontology: Tool for the unification of biology. The Gene Ontology Consortium. Nat Genet. 25:25–29. 2000. View Article : Google Scholar : PubMed/NCBI

7 

Kanehisa M and Goto S: KEGG: Kyoto encyclopedia of genes and genomes. Nucleic Acids Res. 28:27–30. 2000. View Article : Google Scholar : PubMed/NCBI

8 

Savola S, Klami A, Myllykangas S, Manara C, Scotlandi K, Picci P, Knuutila S and Vakkila J: High expression of complement component 5 (C5) at tumor site associates with superior survival in Ewing's sarcoma family of tumour patients. ISRN Oncol. 2011:1687122015.

9 

Riggi N, Suvà M, De Vito C, Provero P, Stehle J, Baumer K, Cironi L, Janiszewska M, Petricevic T, Suvà D, et al: EWS-FLI-1 modulates miRNA145 and SOX2 expression to initiate mesenchymal stem cell reprogramming toward Ewing sarcoma cancer stem cells. Genes Dev. 24:916–932. 2010. View Article : Google Scholar : PubMed/NCBI

10 

Irizarry RA, Hobbs B, Collin F, Beazer-Barclay YD, Antonellis KJ, Scherf U and Speed TP: Exploration, normalization, and summaries of high density oligonucleotide array probe level data. Biostatistics. 4:249–264. 2003. View Article : Google Scholar : PubMed/NCBI

11 

Gautier L, Cope L, Bolstad BM and Irizarry RA: Affy-analysis of Affymetrix GeneChip data at the probe level. Bioinformatics. 20:307–315. 2004. View Article : Google Scholar : PubMed/NCBI

12 

Ihaka R and Gentleman R: R: A language for data analysis and graphics. J Comput Graph Stat. 5:299–314. 1996. View Article : Google Scholar

13 

Troyanskaya O, Cantor M, Sherlock G, Brown P, Hastie T, Tibshirani R, Botstein D and Altman RB: Missing value estimation methods for DNA microarrays. Bioinformatics. 17:520–525. 2001. View Article : Google Scholar : PubMed/NCBI

14 

Smyth GK: Limma: Linear models for microarray dataBioinformatics Comput Biol Sol Using R Bioconductor. Gentleman R, Carey V, Dudoit S, Irizarry R and Huber W: Springer; NY: pp. 397–420. 2005

15 

Huang DW, Sherman BT, Tan Q, Collins JR, Alvord WG, Roayaei J, Stephens R, Baseler MW, Lane HC and Lempicki RA: The DAVID Gene Functional Classification Tool: A novel biological module-centric algorithm to functionally analyze large gene lists. Genome Biol. 8:R1832007. View Article : Google Scholar : PubMed/NCBI

16 

Kanehisa M: The KEGG database. Novartis Found Symp. 247:91–101. 2002. View Article : Google Scholar : PubMed/NCBI

17 

Szklarczyk D, Franceschini A, Wyder S, Forslund K, Heller D, Huerta-Cepas J, Simonovic M, Roth A, Santos A, Tsafou KP, et al: STRING v10: Protein-protein interaction networks, integrated over the tree of life. Nucleic Acids Res. 43:D447–D452. 2015. View Article : Google Scholar : PubMed/NCBI

18 

Smoot ME, Ono K, Ruscheinski J, Wang PL and Ideker T: Cytoscape 2.8: New features for data integration and network visualization. Bioinformatics. 27:431–432. 2011. View Article : Google Scholar : PubMed/NCBI

19 

Bader GD and Hogue CW: An automated method for finding molecular complexes in large protein interaction networks. BMC Bioinformatics. 4:22003. View Article : Google Scholar : PubMed/NCBI

20 

Chin CH, Chen SH, Wu HH, Ho CW, Ko MT and Lin CY: cytoHubba: Identifying hub objects and sub-networks from complex interactome. BMC Syst Biol. 8 (Suppl 4):S112014. View Article : Google Scholar : PubMed/NCBI

21 

Gao J, Aksoy BA, Dogrusoz U, Dresdner G, Gross B, Sumer SO, Sun Y, Jacobsen A, Sinha R, Larsson E, et al: Integrative analysis of complex cancer genomics and clinical profiles using the cBioPortal. Sci Signal. 6:pl12013. View Article : Google Scholar : PubMed/NCBI

22 

Nakamura F, Nakamura Y, Maki K, Sato Y and Mitani K: Cloning and characterization of the novel chimeric gene TEL/PTPRR in acute myelogenous leukemia with inv(12)(p13q13). Cancer Res. 65:6612–6621. 2005. View Article : Google Scholar : PubMed/NCBI

23 

Zheng T, Wang A, Hu D and Wang Y: Molecular mechanisms of breast cancer metastasis by gene expression profile analysis. Mol Med Rep. 16:4671–4677. 2017. View Article : Google Scholar : PubMed/NCBI

24 

He R, Wu JX, Zhang Y, Che H and Yang L: LncRNA LINC00628 overexpression inhibits the growth and invasion through regulating PI3K/Akt signaling pathway in osteosarcoma. Eur Rev Med Pharmacol Sci. 22:5857–5866. 2018.PubMed/NCBI

25 

Kawano M, Tanaka K, Itonaga I, Iwasaki T and Tsumura H: MicroRNA-20b promotes cell proliferation via targeting of TGF-β receptor II and upregulates MYC expression in Ewing's sarcoma cells. Int J Oncol. 51:1842–1850. 2017. View Article : Google Scholar : PubMed/NCBI

26 

Poli V, Fagnocchi L, Fasciani A, Cherubini A, Mazzoleni S, Ferrillo S, Miluzio A, Gaudioso G, Vaira V, Turdo A, et al: MYC-driven epigenetic reprogramming favors the onset of tumorigenesis by inducing a stem cell-like state. Nat Commun. 9:10242018. View Article : Google Scholar : PubMed/NCBI

27 

Naab TJ, Gautam A, Ricks-Santi L, Esnakula AK, Kanaan YM, DeWitty RL, Asgedom G, Makambi KH, Abawi M and Blancato JK: MYC amplification in subtypes of breast cancers in African American women. BMC Cancer. 18:2742018. View Article : Google Scholar : PubMed/NCBI

28 

Little CD, Nau MM, Carney DN, Gazdar AF and Minna JD: Amplification and expression of the c-myc oncogene in human lung cancer cell lines. Nature. 306:194–196. 1983. View Article : Google Scholar : PubMed/NCBI

29 

Yang X, Ye H, He M, Zhou X, Sun N, Guo W, Lin X, Huang H, Lin Y, Yao R and Wang H: LncRNA PDIA3P interacts with c-Myc to regulate cell proliferation via induction of pentose phosphate pathway in multiple myeloma. Biochem Biophys Res Commun. 498:207–213. 2018. View Article : Google Scholar : PubMed/NCBI

30 

Soucek L, Lawlor ER, Soto D, Shchors K, Swigart LB and Evan GI: Mast cells are required for angiogenesis and macroscopic expansion of Myc-induced pancreatic islet tumors. Nat Med. 13:1211–1218. 2007. View Article : Google Scholar : PubMed/NCBI

31 

Jones JI and Clemmons DR: Insulin-like growth factors and their binding proteins: Biological actions. Endocr Rev. 16:3–34. 1995. View Article : Google Scholar : PubMed/NCBI

32 

Olmos D, Martins AS, Jones RL, Alam S, Scurr M and Judson IR: Targeting the insulin-like growth factor 1 receptor in Ewing's sarcoma: Reality and expectations. Sarcoma. 2011:4025082011. View Article : Google Scholar : PubMed/NCBI

33 

de Groot S, Gelderblom H, Fiocco M, Bovée JV, van der Hoeven JJ, Pijl H and Kroep JR: Serum levels of IGF-1 and IGF-BP3 are associated with event-free survival in adult Ewing sarcoma patients treated with chemotherapy. Onco Targets Ther. 10:2963–2970. 2017. View Article : Google Scholar : PubMed/NCBI

34 

Kasprzak A, Szaflarski W, Szmeja J, Andrzejewska M, Przybyszewska W, Kaczmarek E, Koczorowska M, Kościński T, Zabel M and Drews M: Differential expression of IGF-1 mRNA isoforms in colorectal carcinoma and normal colon tissue. Int J Oncol. 42:305–316. 2013.PubMed/NCBI

35 

Kakuta S, Shibata S and Iwakura Y: Genomic structure of the mouse 2′,5′-oligoadenylate synthetase gene family. J Interferon Cytokine Res. 22:981–993. 2002. View Article : Google Scholar : PubMed/NCBI

36 

Lee WB, Choi WY, Lee DH, Shim H, Kim-Ha J and Kim YJ: OAS1 and OAS3 negatively regulate the expression of chemokines and interferon-responsive genes in human macrophages. BMB Rep. 52:133–138. 2019. View Article : Google Scholar : PubMed/NCBI

37 

Herviou L, Cavalli G and Moreaux J: EZH2 is therapeutic target for personalized treatment in multiple myeloma. Bull Cancer. 105:804–819. 2018.(In French). View Article : Google Scholar : PubMed/NCBI

38 

Richter GH, Plehm S, Fasan A, Rössler S, Unland R, Bennani-Baiti IM, Hotfilder M, Löwel D, von Luettichau I, Mossbrugger I, et al: EZH2 is a mediator of EWS/FLI1 driven tumor growth and metastasis blocking endothelial and neuro-ectodermal differentiation. Proc Natl Acad Sci USA. 106:5324–5329. 2009. View Article : Google Scholar : PubMed/NCBI

39 

Gulati N, Béguelin W and Giulino-Roth L: Enhancer of zeste homolog 2 (EZH2) inhibitors. Leuk Lymphoma. 59:1574–1585. 2018. View Article : Google Scholar : PubMed/NCBI

40 

Wang D, Quiros J, Mahuron K, Pai CC, Ranzani V, Young A, Silveria S, Harwin T, Abnousian A, Pagani M, et al: Targeting EZH2 reprograms intratumoral regulatory T cells to enhance cancer immunity. Cell Rep. 23:3262–3274. 2018. View Article : Google Scholar : PubMed/NCBI

41 

Osiak A, Utermöhlen O, Niendorf S, Horak I and Knobeloch KP: ISG15, an interferon-stimulated ubiquitin-like protein, is not essential for STAT1 signaling and responses against vesicular stomatitis and lymphocytic choriomeningitis virus. Mol Cell Biol. 25:6338–6345. 2005. View Article : Google Scholar : PubMed/NCBI

42 

Burks J, Reed RE and Desai SD: Free ISG15 triggers an antitumor immune response against breast cancer: A new perspective. Oncotarget. 6:7221–7231. 2015. View Article : Google Scholar : PubMed/NCBI

43 

Zhao C, Hsiang TY, Kuo RL and Krug RM: ISG15 conjugation system targets the viral NS1 protein in influenza A virus-infected cells. Proc Natl Acad Sci USA. 107:2253–2258. 2010. View Article : Google Scholar : PubMed/NCBI

44 

Jeon YJ, Jo MG, Yoo HM, Hong SH, Park JM, Ka SH, Oh KH, Seol JH, Jung YK and Chung CH: Chemosensitivity is controlled by p63 modification with ubiquitin-like protein ISG15. J Clin Invest. 122:2622–2636. 2012. View Article : Google Scholar : PubMed/NCBI

45 

Zuo C, Sheng X, Ma M, Xia M and Ouyang L: ISG15 in the tumorigenesis and treatment of cancer: An emerging role in malignancies of the digestive system. Oncotarget. 7:74393–74409. 2016. View Article : Google Scholar : PubMed/NCBI

46 

Tecalco-Cruz AC and Cruz-Ramos E: Protein ISGylation and free ISG15 levels are increased by interferon gamma in breast cancer cells. Biochem Biophys Res Commun. 499:973–978. 2018. View Article : Google Scholar : PubMed/NCBI

47 

Yoo L, Yoon AR, Yun CO and Chung KC: Covalent ISG15 conjugation to CHIP promotes its ubiquitin E3 ligase activity and inhibits lung cancer cell growth in response to type I interferon. Cell Death Dis. 9:972018. View Article : Google Scholar : PubMed/NCBI

Related Articles

Journal Cover

December-2019
Volume 18 Issue 6

Print ISSN: 1792-1074
Online ISSN:1792-1082

Sign up for eToc alerts

Recommend to Library

Copy and paste a formatted citation
x
Spandidos Publications style
Zhang J, Zhang Y, Li Z, Wu H, Xun J and Feng H: Bioinformatics analysis of Ewing's sarcoma: Seeking key candidate genes and pathways. Oncol Lett 18: 6008-6016, 2019
APA
Zhang, J., Zhang, Y., Li, Z., Wu, H., Xun, J., & Feng, H. (2019). Bioinformatics analysis of Ewing's sarcoma: Seeking key candidate genes and pathways. Oncology Letters, 18, 6008-6016. https://doi.org/10.3892/ol.2019.10936
MLA
Zhang, J., Zhang, Y., Li, Z., Wu, H., Xun, J., Feng, H."Bioinformatics analysis of Ewing's sarcoma: Seeking key candidate genes and pathways". Oncology Letters 18.6 (2019): 6008-6016.
Chicago
Zhang, J., Zhang, Y., Li, Z., Wu, H., Xun, J., Feng, H."Bioinformatics analysis of Ewing's sarcoma: Seeking key candidate genes and pathways". Oncology Letters 18, no. 6 (2019): 6008-6016. https://doi.org/10.3892/ol.2019.10936