Introduction
Ependymomas (EPNs) are one of the most commonly
diagnosed malignant neuroepithelial tumors in children and adults,
accounting for ~1.8% of all primary central nervous system (CNS)
tumors (1). It has been demonstrated
that ependymomas in children <5 years of age account for >50%
of all cases (2). Following
comprehensive treatment with gross total resection and adjuvant
radiotherapy, only 70% of patients with intracranial ependymoma
<5 years of age were cured (3).
In 2016, the latest World Health Organization classification for
ependymoma was published as follows: Subependymoma; myxopapillary
ependymoma; ependymoma; anaplastic ependymoma; and ependymoma, RELA
proto-oncogene, NF-κB subunit fusion-positive (4). However, the pathological criterion is
limited for clinical application; it was demonstrated that 7% of
cases were misdiagnosed and were subsequently reclassified as
ependymoma, which is indicative of the requirement for a more
precise molecular classification system (5). Therefore, an increased number of
studies are required to improve our understanding of the molecular
mechanisms involved in EPN.
microRNAs (miRNAs/miR) are a class of
non-protein-coding small single-stranded RNAs, which bind to the
3′-untranslated region (UTR) of target mRNAs, inhibiting gene
expression at the post-transcriptional level (6,7). It was
suggested that high expression levels of miR-124-3p
significantly decreased the progression-free survival time of
patients with EPN by negatively regulating tumor protein p53
nuclear protein 1 (TP53INP1), thereby indicating a potential
role of miR-124-3p as a therapeutic biomarker (8). Other studies involving microarray
analyses revealed that the expression level of cyclin D1, which is
involved in DNA repair, was increased in recurrent EPNs compared
with the primary EPNs (9). With
considerable advances in high-throughput technologies, increasing
numbers of miRNAs and genes have been confirmed to serve important
roles in the diagnosis, treatment and prognosis of EPNs, which may
lead to further investigations into the molecular mechanisms of its
pathogenesis.
In the present study, five gene expression profiles
datasets (GSE25604, GSE50161, GSE66354, GSE74195 and GSE86574) and
one miRNA expression profile dataset (GSE42657) were downloaded
from the Gene Expression Omnibus (GEO) to identify differentially
expressed genes (DEGs) and differentially expressed miRNAs (DEMs)
between EPN samples and normal brain tissue samples. Then, Gene
Ontology (GO) and Kyoto Encyclopedia of Genes and Genomes (KEGG)
enrichment analyses, in addition to protein-protein interaction
(PPI) network analyses of these DEGs, were performed to identify
associated hub genes and modules. Furthermore, an miRNA-mRNA
network analysis was conducted to identify the key miRNAs (and
their targeted genes) that may be utilized as biomarkers of EPN.
Taken together, the present study may provide an improved
understanding of the genetic mechanisms of EPN.
Materials and methods
Microarray data
mRNA (GSE25604, GSE50161, GSE66354, GSE74195 and
GSE86574) and miRNA (GSE42657) expression profiles were downloaded
from the GEO database (http://www.ncbi.nlm.nih.gov/geo/); data from the
GSE25604 dataset, including 15 EPN and 7 normal samples, generated
from GPL571 platform (Affymetrix Human Genome U133A 2.0 Array) were
submitted on Nov 24, 2010 and updated on April 05, 2017. The
GSE50161 (including 46 EPN and 13 normal samples), GSE66354
(including 64 EPN and 13 normal samples), GSE74195 (including 13
EPN and 5 normal samples) and GSE86574 (including 29 EPN and 10
normal samples) datasets were generated using the same microarray
platform. miRNA expression data from the GSE42657 dataset were
submitted on November 30, 2012 and updated on February 12, 2016.
GSE42657, from the GPL8179 platform (illumina Human v2 MicroRNA
expression beadchip) contained 14 EPN and 7 normal samples.
Survival data of EPN from GEO and The Cancer Genome Atlas databases
were not available.
Furthermore, 10 EPN and 10 normal brain tissue
samples were obtained from the Department of Neurosurgery, Shanghai
Ninth People's Hospital Affiliated to Shanghai Jiao Tong University
School of Medicine (Shanghai, China). The present study was
approved by the Ethics Committees of the Shanghai Ninth People's
Hospital Affiliated to Shanghai Jiao Tong University School of
Medicine, and informed patient consent was obtained prior to
clinical research. All tissue samples were immediately frozen in
liquid nitrogen and subsequently stored at −80°C.
Identification of DEGs and DEMs
Following transformation into gene symbols according
to probe annotation files of each platform, the original expression
data were preprocessed using Linear models for microarray data
using Limma package in R (v.3.4.1; http://www.r-project.org/). This included background
correction, quantile normalization, summarization and probe
ID-to-gene symbol transformation.
GEO2R (http://www.ncbi.nlm.nih.gov/geo/geo2r/) is an online
tool used to identify differentially expressed molecules among ≥
two sample groups in a GEO dataset. In the present study, GEO2R was
used to identify DEGs and DEMs between EPN and normal samples, and
a threshold of adjusted P<0.05 and |log2 fold-change (FC)|>1
was applied. To control for Type I errors and false discovery rate,
P-values were adjusted using the Benjamini & Hochberg false
discovery rate method provided by Limma package (10).
Functional and pathway enrichment
analysis
Following data preprocessing and DEG acquisition,
aberrantly expressed DEGs were uploaded to the Database for
Annotation, Visualization and Integrated Discovery (DAVID; v.6.8;
http://david.ncifcrf.gov/) for
functional and pathway enrichment analysis (11). KEGG pathway database records networks
of cellular molecular interactions, and variants of these
interactions specific to particular organisms (12). GO enrichment analysis includes
‘Biological process’ (BP), ‘Molecular function’ (MF) and ‘Cellular
component’ (CC). In addition, the criterion P<0.05 was
considered to indicate statistically significance. Reactome pathway
analysis was also conducted (https://www.reactome.org/) (13), the results of which were visualized
using Cytoscape 3.5.1 (14).
PPI network construction and module
selection
Following uploading of the DEGs to the Search Tool
for Retrieval of Interacting Genes (STRING) database (version 10.5;
http://www.string-db.org/), a PPI network was
constructed and visualized in Cytoscape (v.3.5.1) (14,15). Hub
genes were identified using cytoHubba plug-in and DEG modules were
distinguished using Molecular Complex Detection (MCODE) plug-in
(16,17). The criteria were set as scores >3
and nodes >4. Furthermore, in order to conduct GO Biological
process (BP) and KEGG pathway enrichment analysis, DEGs in the
selected modules were further analyzed using DAVID. Terms with
P<0.05 were considered to be significant. The transcription
factor (TF)-gene regulatory network was performed using the
iRegulion plug-in (18).
Identification of potential miRNA
target genes
miRWalk2.0 (http://zmf.umm.uni-heidelberg.de/mirwalk2) comprises a
collection of predicted and validated miRNA-target interactions.
The predicted interactions were assessed using the following 12
miRNA target prediction programs: DIANA-microT v4.0 (19), DIANA-microT-CDS (20), miRanda-rel2010 (21), mirBridge (22), miRDB 4.0 (23), miRmap (24), miRNAMap (25), PicTar 2 (26), PITA (27), RNA22 v2 (28), RNAhybrid 2.1 (29) and Targetscan 6.2 (30). In order to improve prediction
reliability, the genes predicted by ≥8 of the databases among 12
databases were selected as the DEM targets. Validated databases
were then used to search for verified targeted genes. Finally, the
sums of predicted and validated genes, which were repeated with the
obtained DEGs, were recognized as the eventual target genes of the
identified DEMs.
Construction of a negative miRNA-mRNA
regulatory network
miRNAs promote mRNA degradation or inhibit the
translation of negatively regulated targeted genes (7). Therefore, a negative miRNA-mRNA
regulatory network was selected and visualized in Cytoscape. The
top 3 significant DEMs and their target hub genes were also
identified.
Association analyses and efficacy
evaluation
To verify the clinical value of the hub genes,
association analyses and efficacy evaluation were conducting using
mRNA (GSE25604, GSE50161, GSE66354, GSE74195 and GSE86574) and
miRNA (GSE42657) expression profiles, respectively. The
associations between hub genes and the corresponding clinical
features were illustrated using by boxplots, and statistical
significance was determined using an independent sample t-test.
Efficacy evaluation was conducted by receiver operating
characteristic (ROC) curve analysis with the ‘pROC’ package in R
language. Genes with an area under the curve (AUC) value >0.7
were considered to distinguish tumor tissues from normal
tissues.
Reverse transcription-quantitative
(RT-q) PCR
Total RNA was extracted from tissues using
TRIzol® reagent (Takara Biotechnology Co., Ltd.,)
according to the manufacturer's protocol. RT-qPCR was performed
using the FastStart essential DNA Green Master mix (Roche
Diagnostics) and a miRNA qPCR Assay kit (CWBio Technology Co.,
Ltd.), and performed using the iCycler iQ Real-Time Detection
System (Bio-Rad Laboratories, Inc.). snRNA U6 and GAPDH were used
as internal controls for miR and mRNA, respectively. The expression
levels were quantified using the 2−ΔΔCq method (31) and the fold change for target genes
was normalized to the appropriate internal control. The primer
sequences are listed in Table
SI.
Statistical analysis
SPSS software (v.22.0; IBM Corp.), GraphPad Prism
(v.7.0; GraphPad Software, Inc.) and R software (v.3.4.1) were used
for statistical analysis. The statistical significance between EPN
and normal brain tissues was determined using an independent sample
t-test. P<0.05 was considered to indicate a statistically
significant difference. The bar plots were generated by GraphPad
Prism or R software.
Results
Identification of DEGs
Following preprocessing, boxplots of the samples
from five selected datasets are demonstrated in Fig. S1. Based on the cut-off criteria of
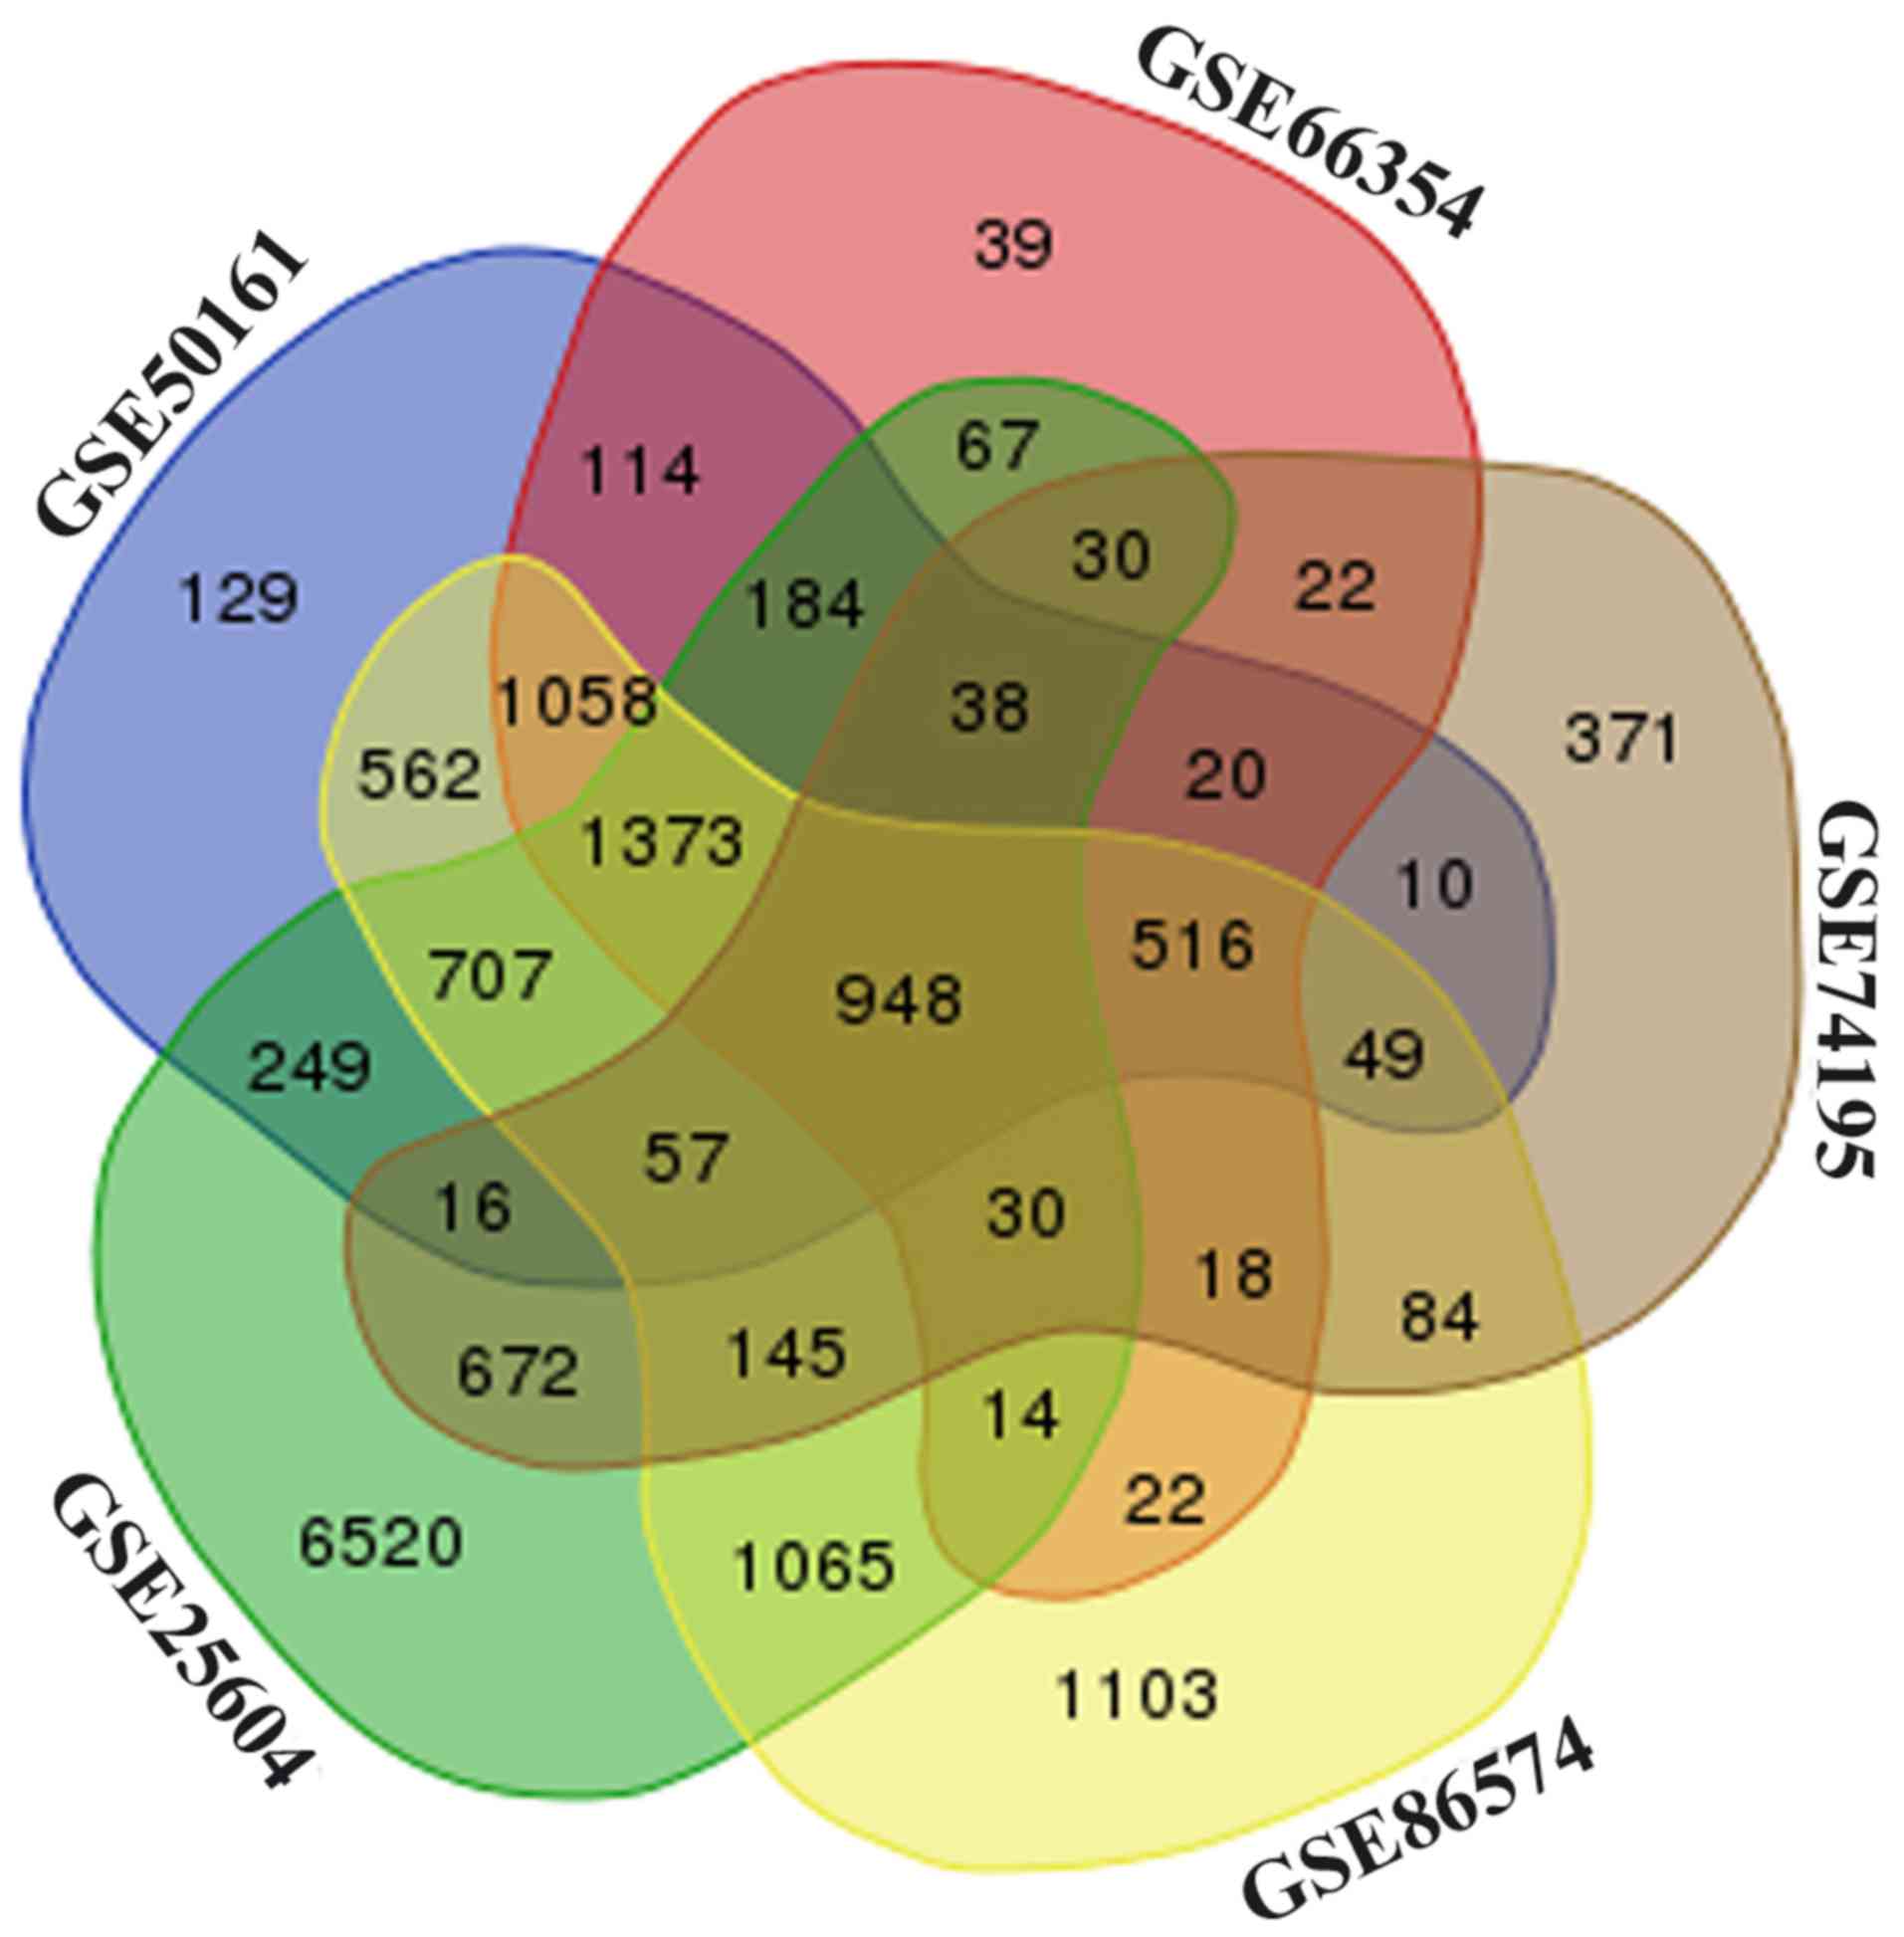
P<0.05 and |log2 FC|>1, a total of 12,115, 6,030, 4,493,
3,026 and 7,751 DEGs between EPN and normal brain samples were
identified from the GSE25604, GSE50161, GSE66354, GSE74195 and
GSE86574 datasets, respectively (Fig.
S2). Among these datasets, a total of 948 overlapping DEGs were
identified (Fig. 1), including 609
upregulated and 339 downregulated genes, were screened out among
the five datasets. In addition, the expression levels of 129 DEMs
were identified as being significantly different between EPN and
normal brain tissues, of which 39 were upregulated and 80 were
downregulated miRNAs in EPN tissues (Table SII).
Functional and pathway enrichment
analysis
Following uploading of the 609 upregulated and 339
downregulated DEGs to DAVID, GO categories and KEGG pathways with
P<0.05 were identified, and the top 5 significant terms were
selected from corresponding GO categories on up- and downregulated
DEGs (Table SIII). GO analysis
results revealed that upregulated DEGs were significantly
associated with ‘extracellular exosome’ and ‘extracellular matrix’
in CC, ‘extracellular matrix organization’ and ‘cell adhesion’ in
BP, and ‘extracellular matrix structural constituent’ and ‘protein
binding’ in MF. The downregulated DEGs were significantly enriched
in ‘cell junction’ and ‘plasma membrane’ in CC, ‘chemical synaptic
transmission’ and ‘neurotransmitter secretion’ in BP, and ‘calcium
ion binding’ and ‘GABA-A receptor activity’ in MF.
In addition, the top 10 significantly enriched
pathways of the up- and downregulated DEGs were selected from
significant KEGG pathways (Table
SIV). The upregulated DEGs were significantly enriched in
‘ECM-receptor interaction’, ‘focal adhesion’ and ‘graft-versus-host
disease’, while downregulated DEGs were associated with ‘GABAergic
synapse’, ‘retrograde endocannabinoid signaling’ and ‘morphine
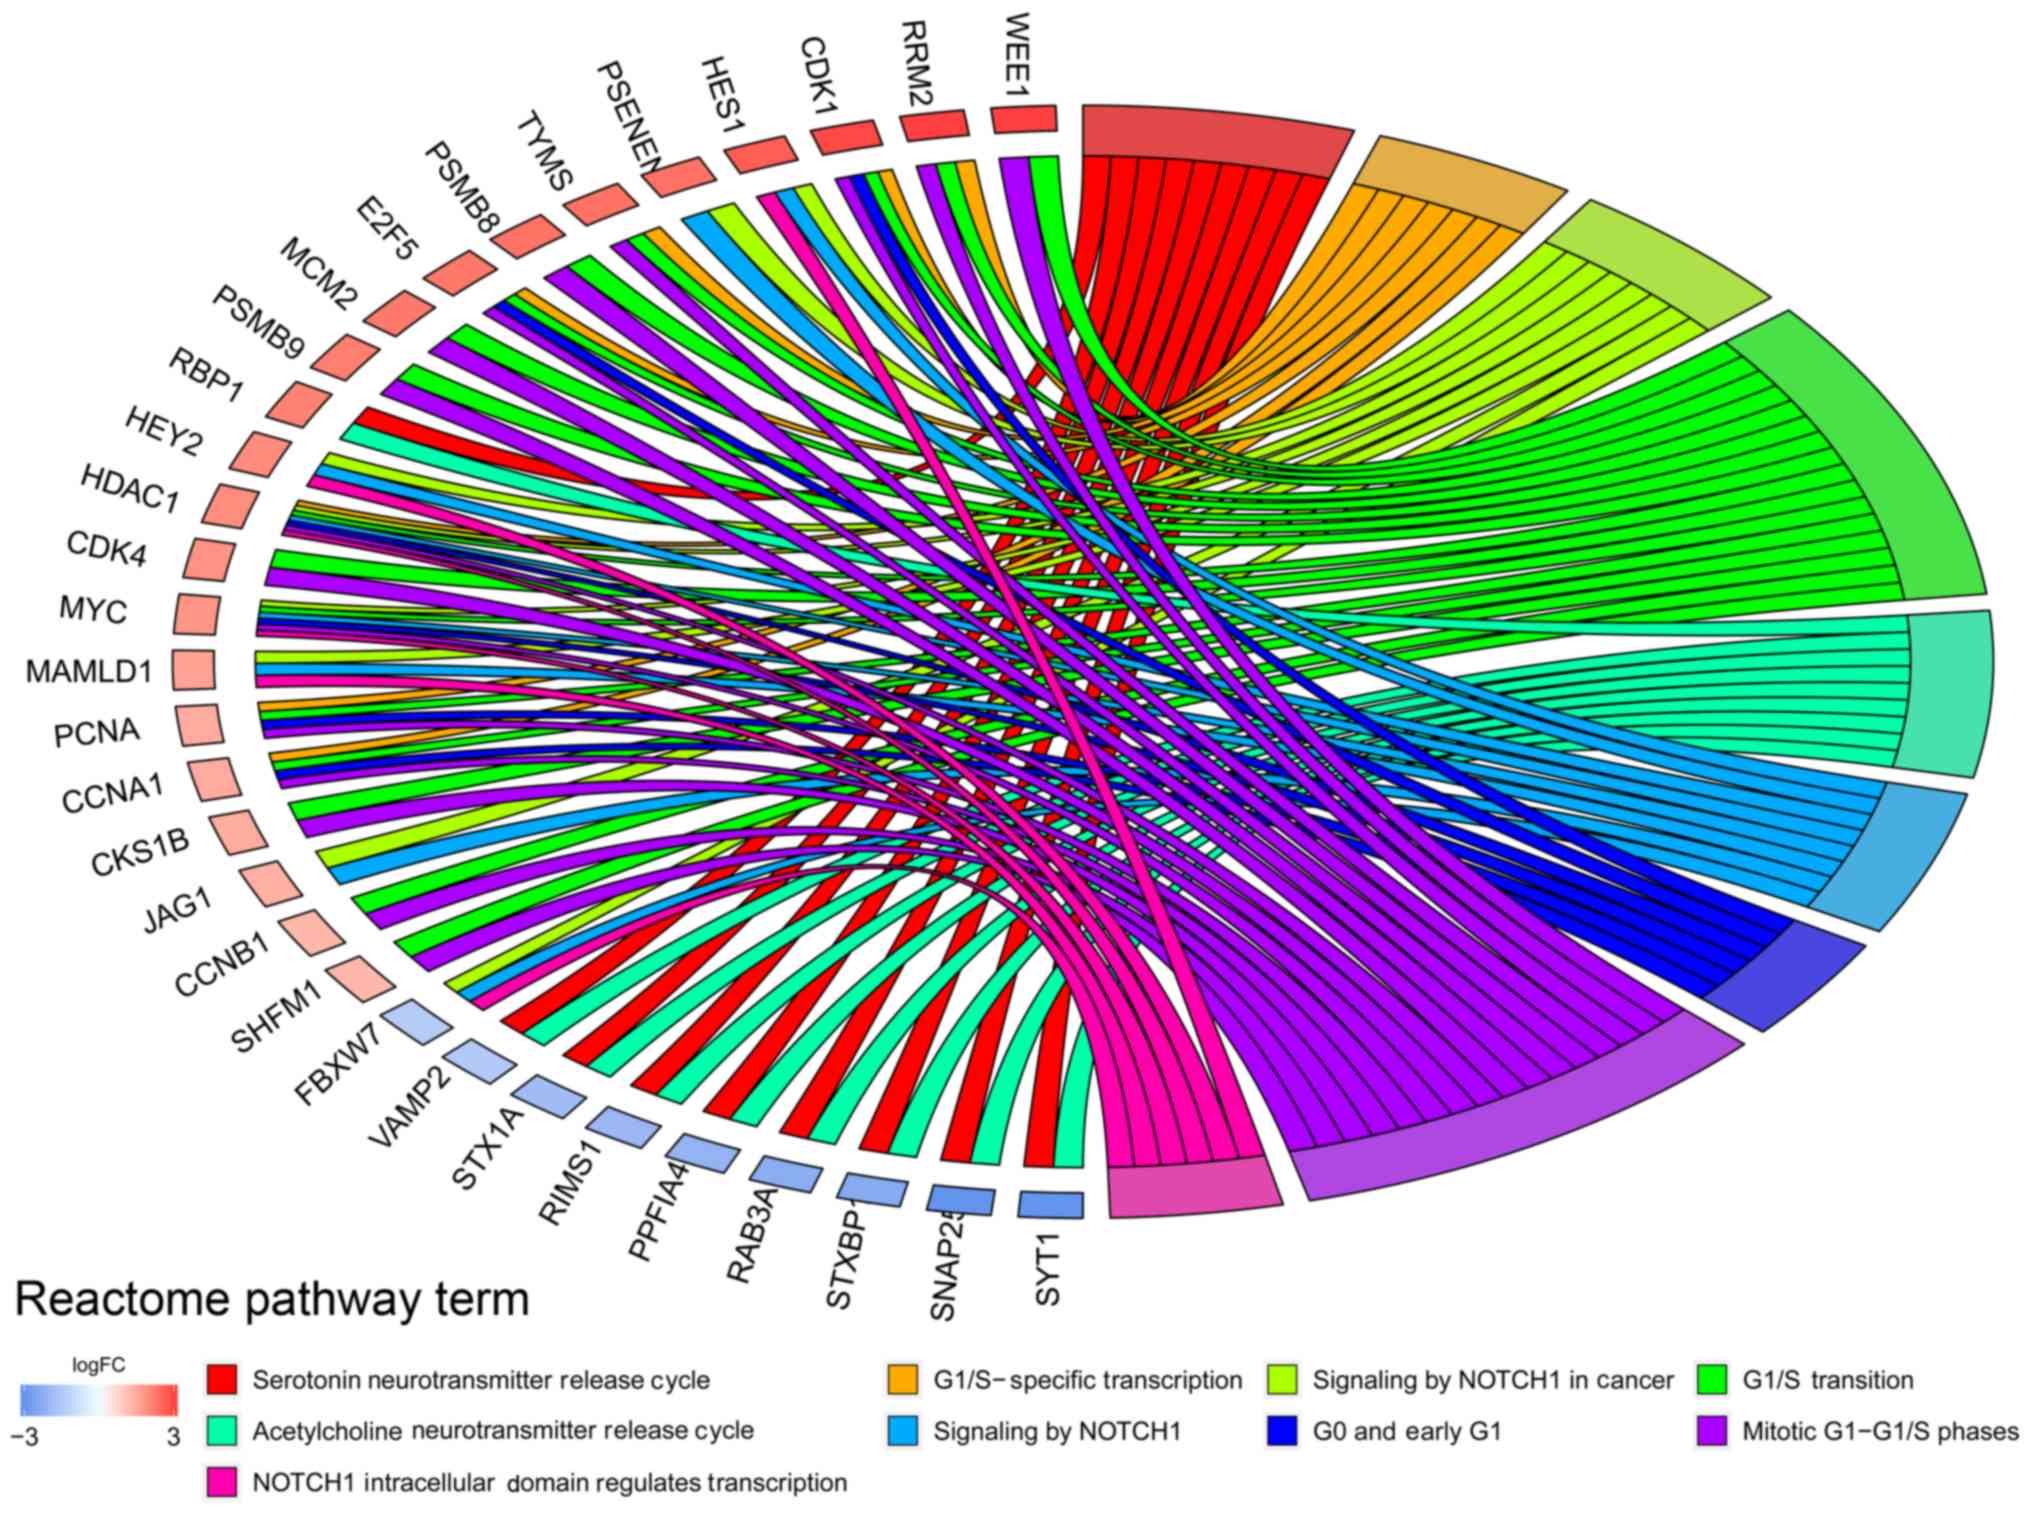
addiction’. Reactome pathway analysis results indicated that DEGs
were associated with ‘G1/S-specific transcription’ and ‘NOTCH1
intracellular domain regulates transcription’ (Fig. 2).
PPI network construction and module
selection
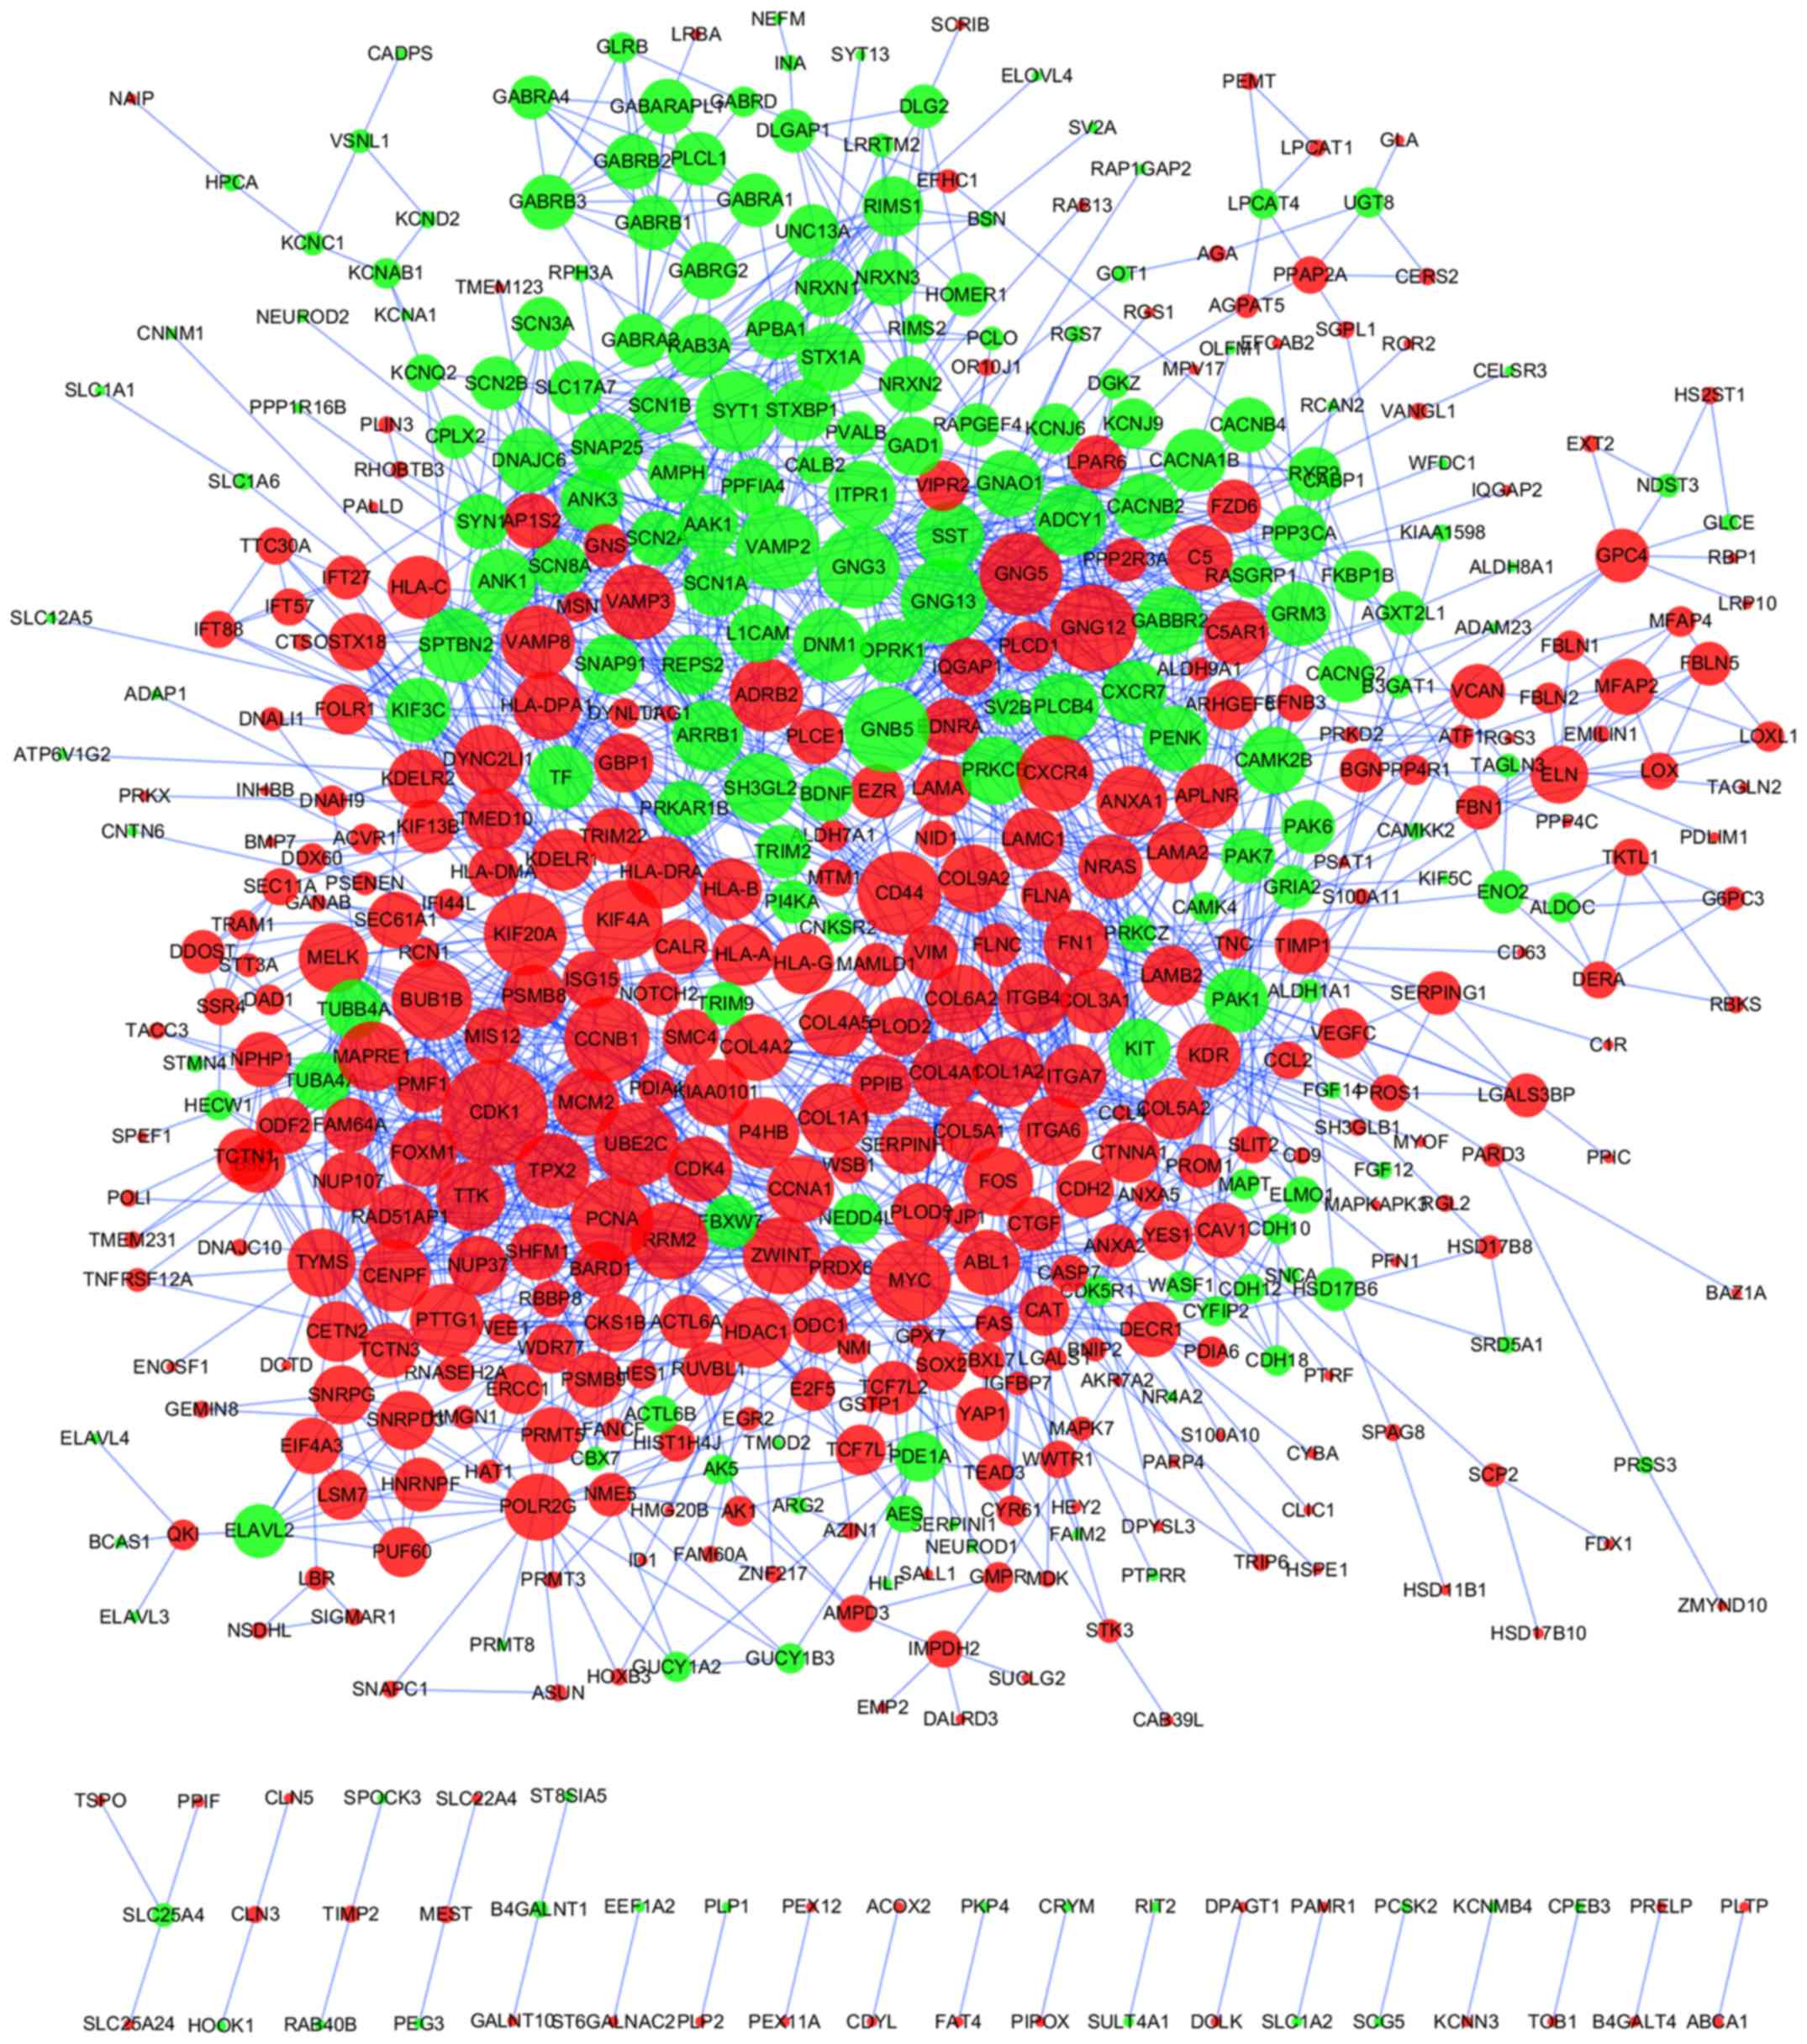
A PPI network of 948 DEGs was produced using the
STRING online tool, with a cutoff of score >0.7 (Fig. 3; Table
SV). Using the cytoHubba plug-in, DEGs with the top 20
betweenness scores and with degrees ≥24 (top 21) were identified as
hub genes. A total of 6 nodes were selected as hub genes, including
cyclin dependent kinase 1 (CDK1), CD44 molecule (Indian
blood group) (CD44), proliferating cell nuclear antigen
(PCNA), MYC, synaptotagmin 1 (SYT1) and
kinesin family member 4A (KIF4A) (Table SVI). Among these 6 genes,
betweenness of MYC was the greatest, and at 48, CDK1
had the highest number of node degrees. The TF-gene regulatory
network is demonstrated in Fig.
S3.
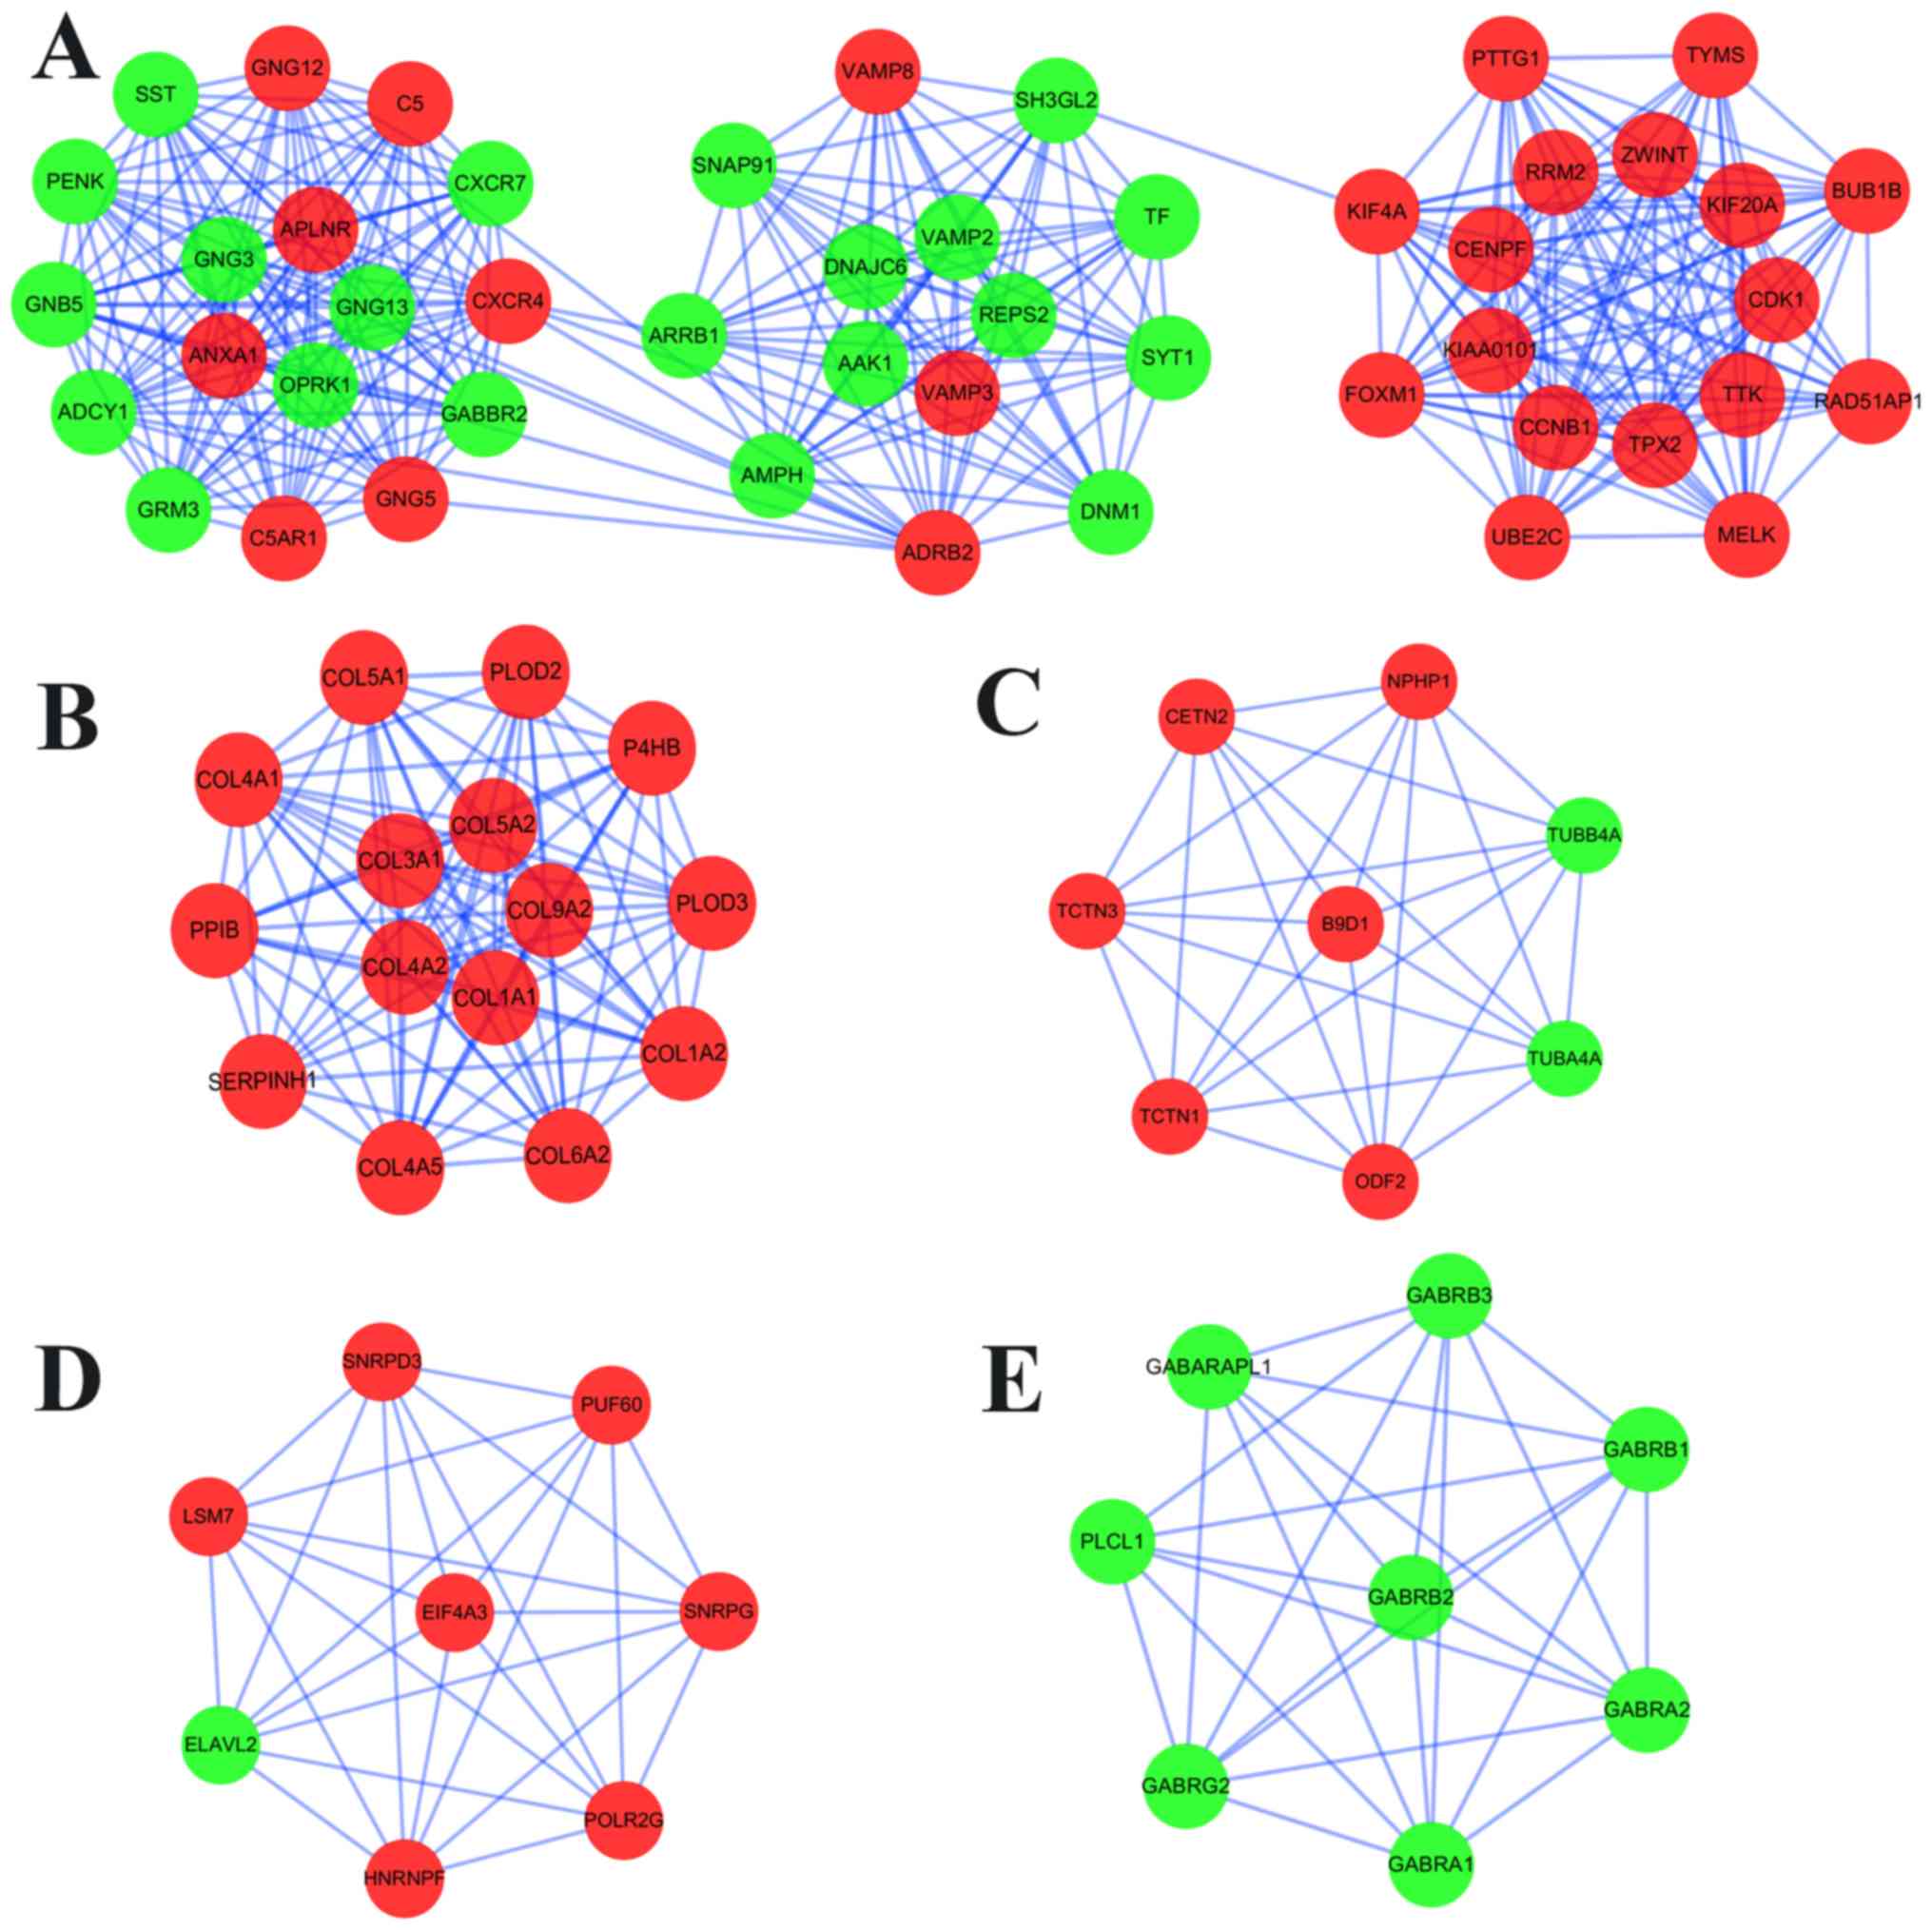
Furthermore, MCODE analysis revealed a total of 19
available modules, from which the top 5 significant modules were
selected (Fig. 4); BP and KEGG
enrichment analysis of DEGs between these modules were subsequently
performed (Table SVII). Enrichment
analysis demonstrated that the DEGs in module 1 were primarily
enriched in ‘morphine addiction’ and ‘GABAergic synapse’ (KEGG
analysis), and ‘chemical synaptic transmission’ in the BP category
of the GO analysis. In the KEGG pathway analysis, the DEGs in
modules 2–5 were mostly associated with ‘protein digestion and
absorption’, ‘pathogenic Escherichia coli infection’,
‘spliceosome’ and ‘GABAergic synapse’, respectively.
Construction of a negative miRNA-gene
regulatory network
Among the 39 upregulated DEMs and 339 downregulated
DEGs, 19,319 predicted and 16,116 validated miRNA-target pairs were
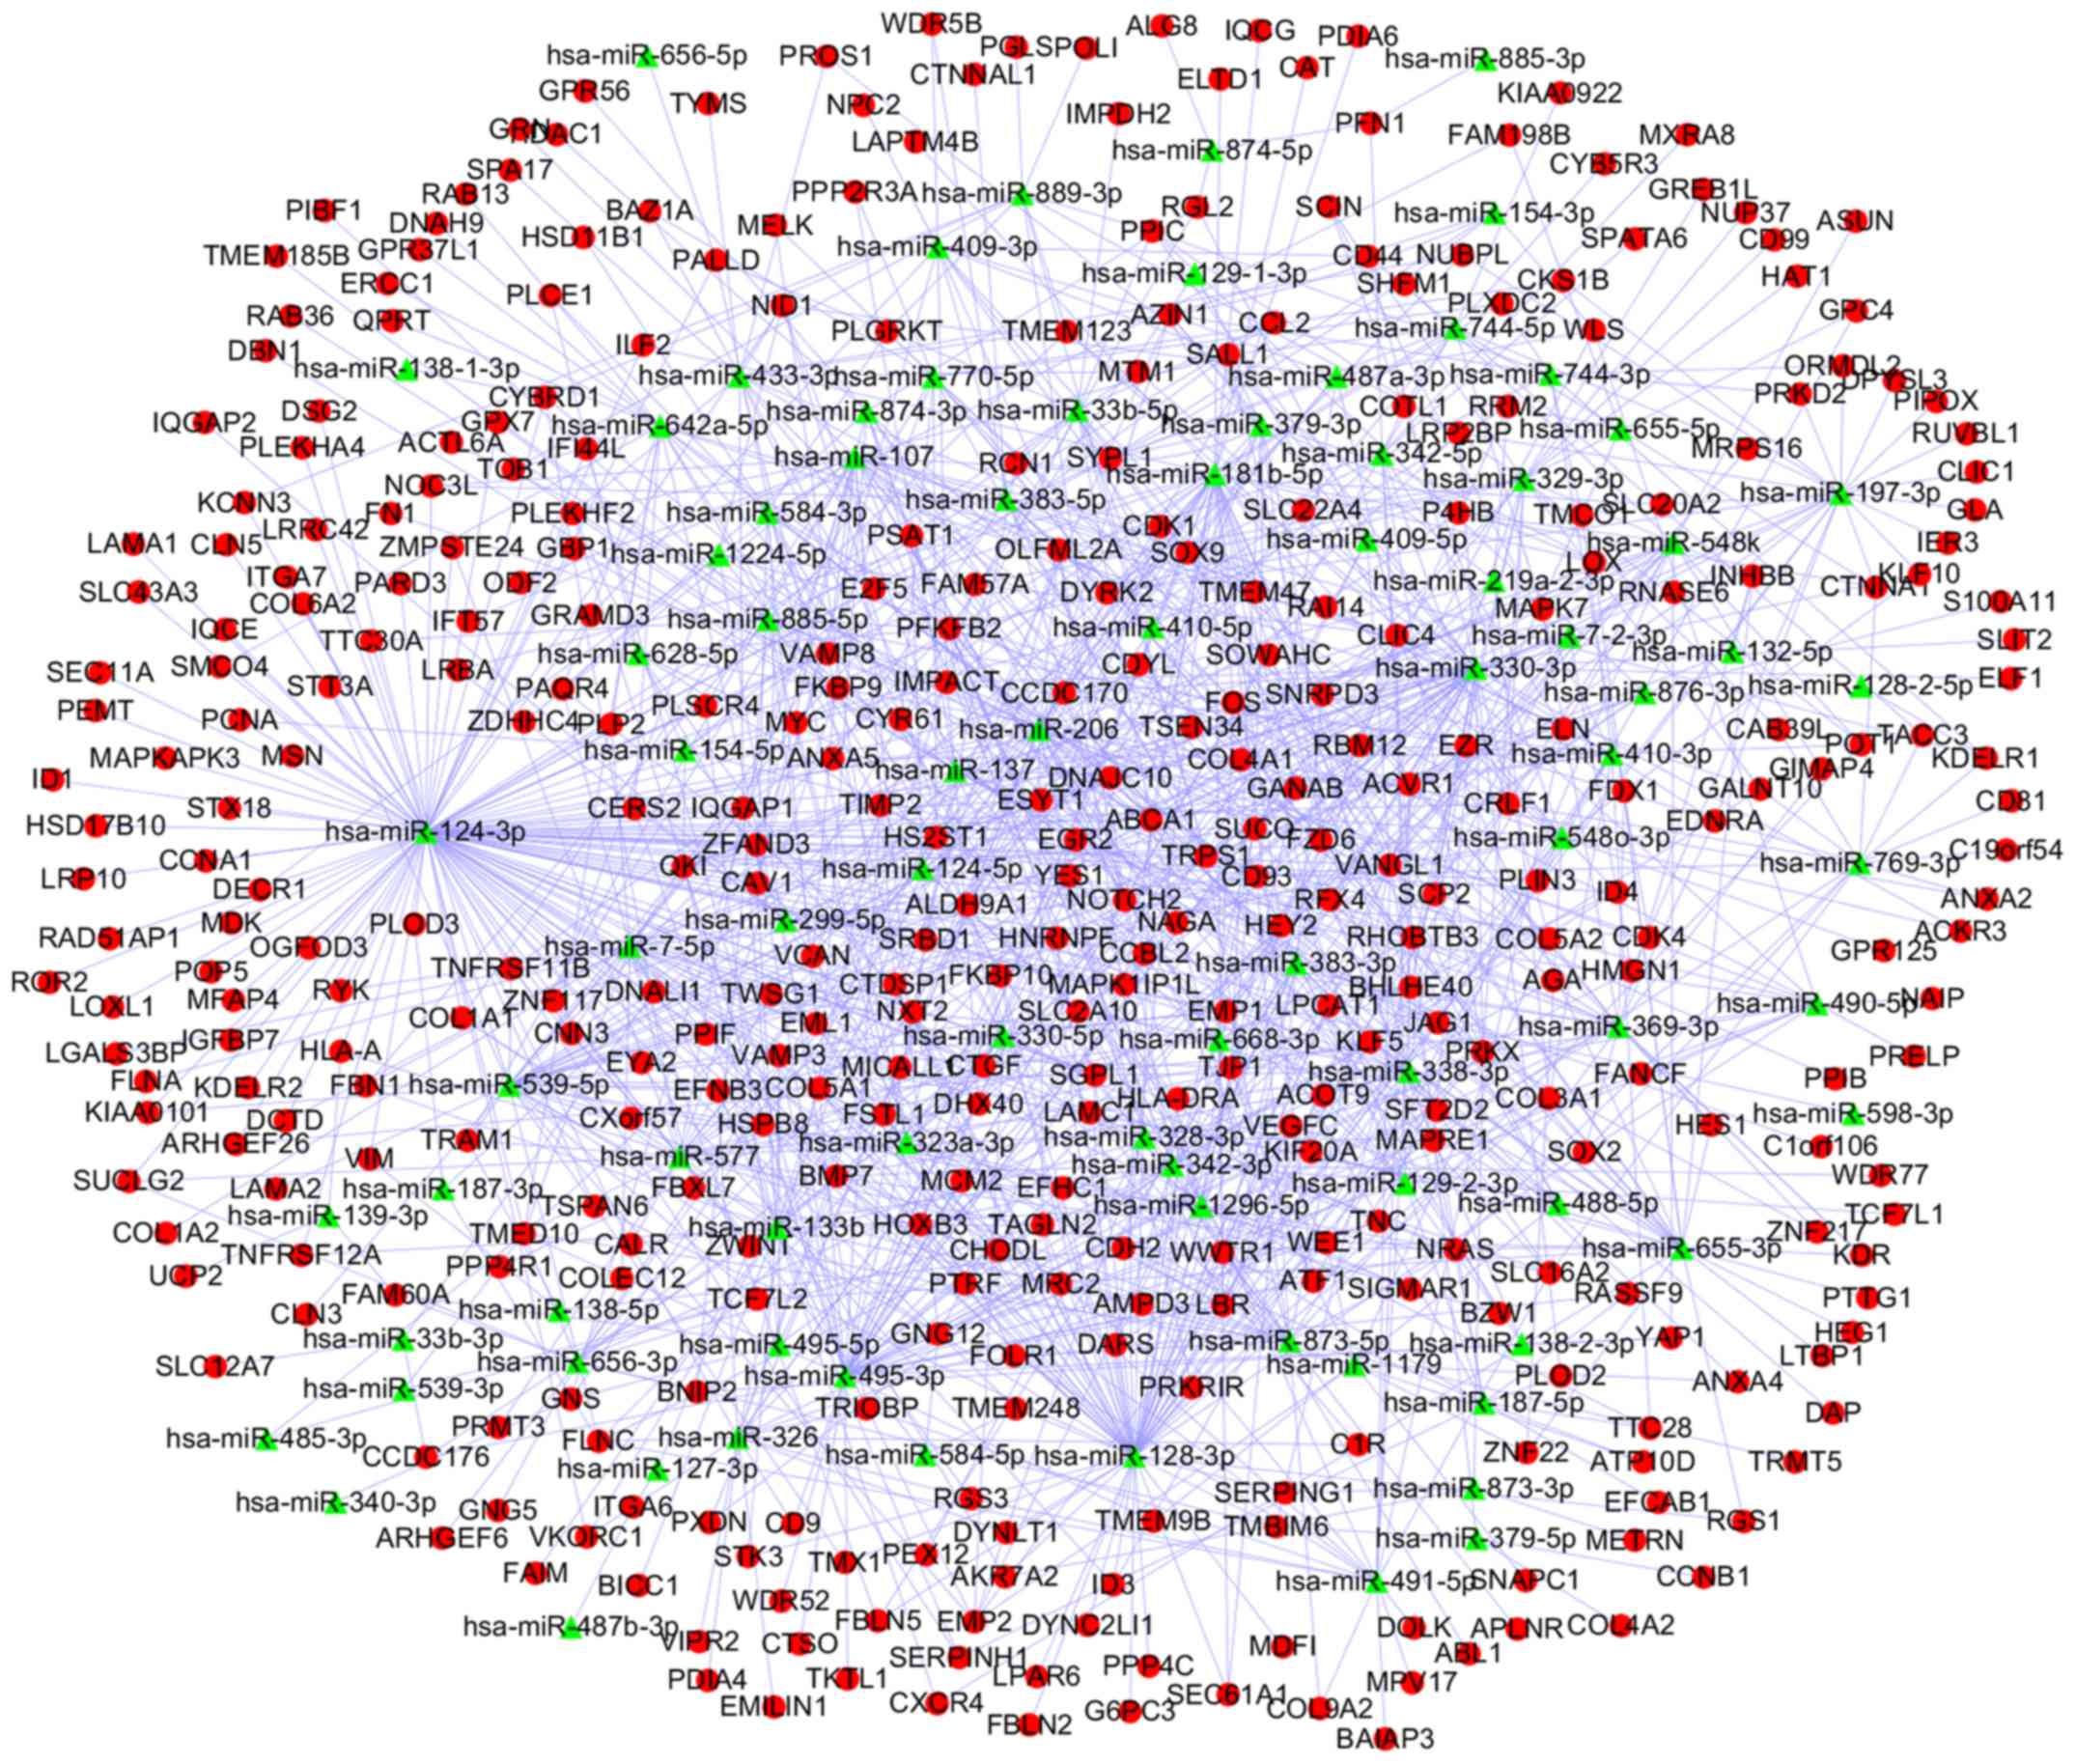
identified. A total of 26,033 predicted and 15,986 validated
miRNA-target pairs were also identified from 80 downregulated DEMs
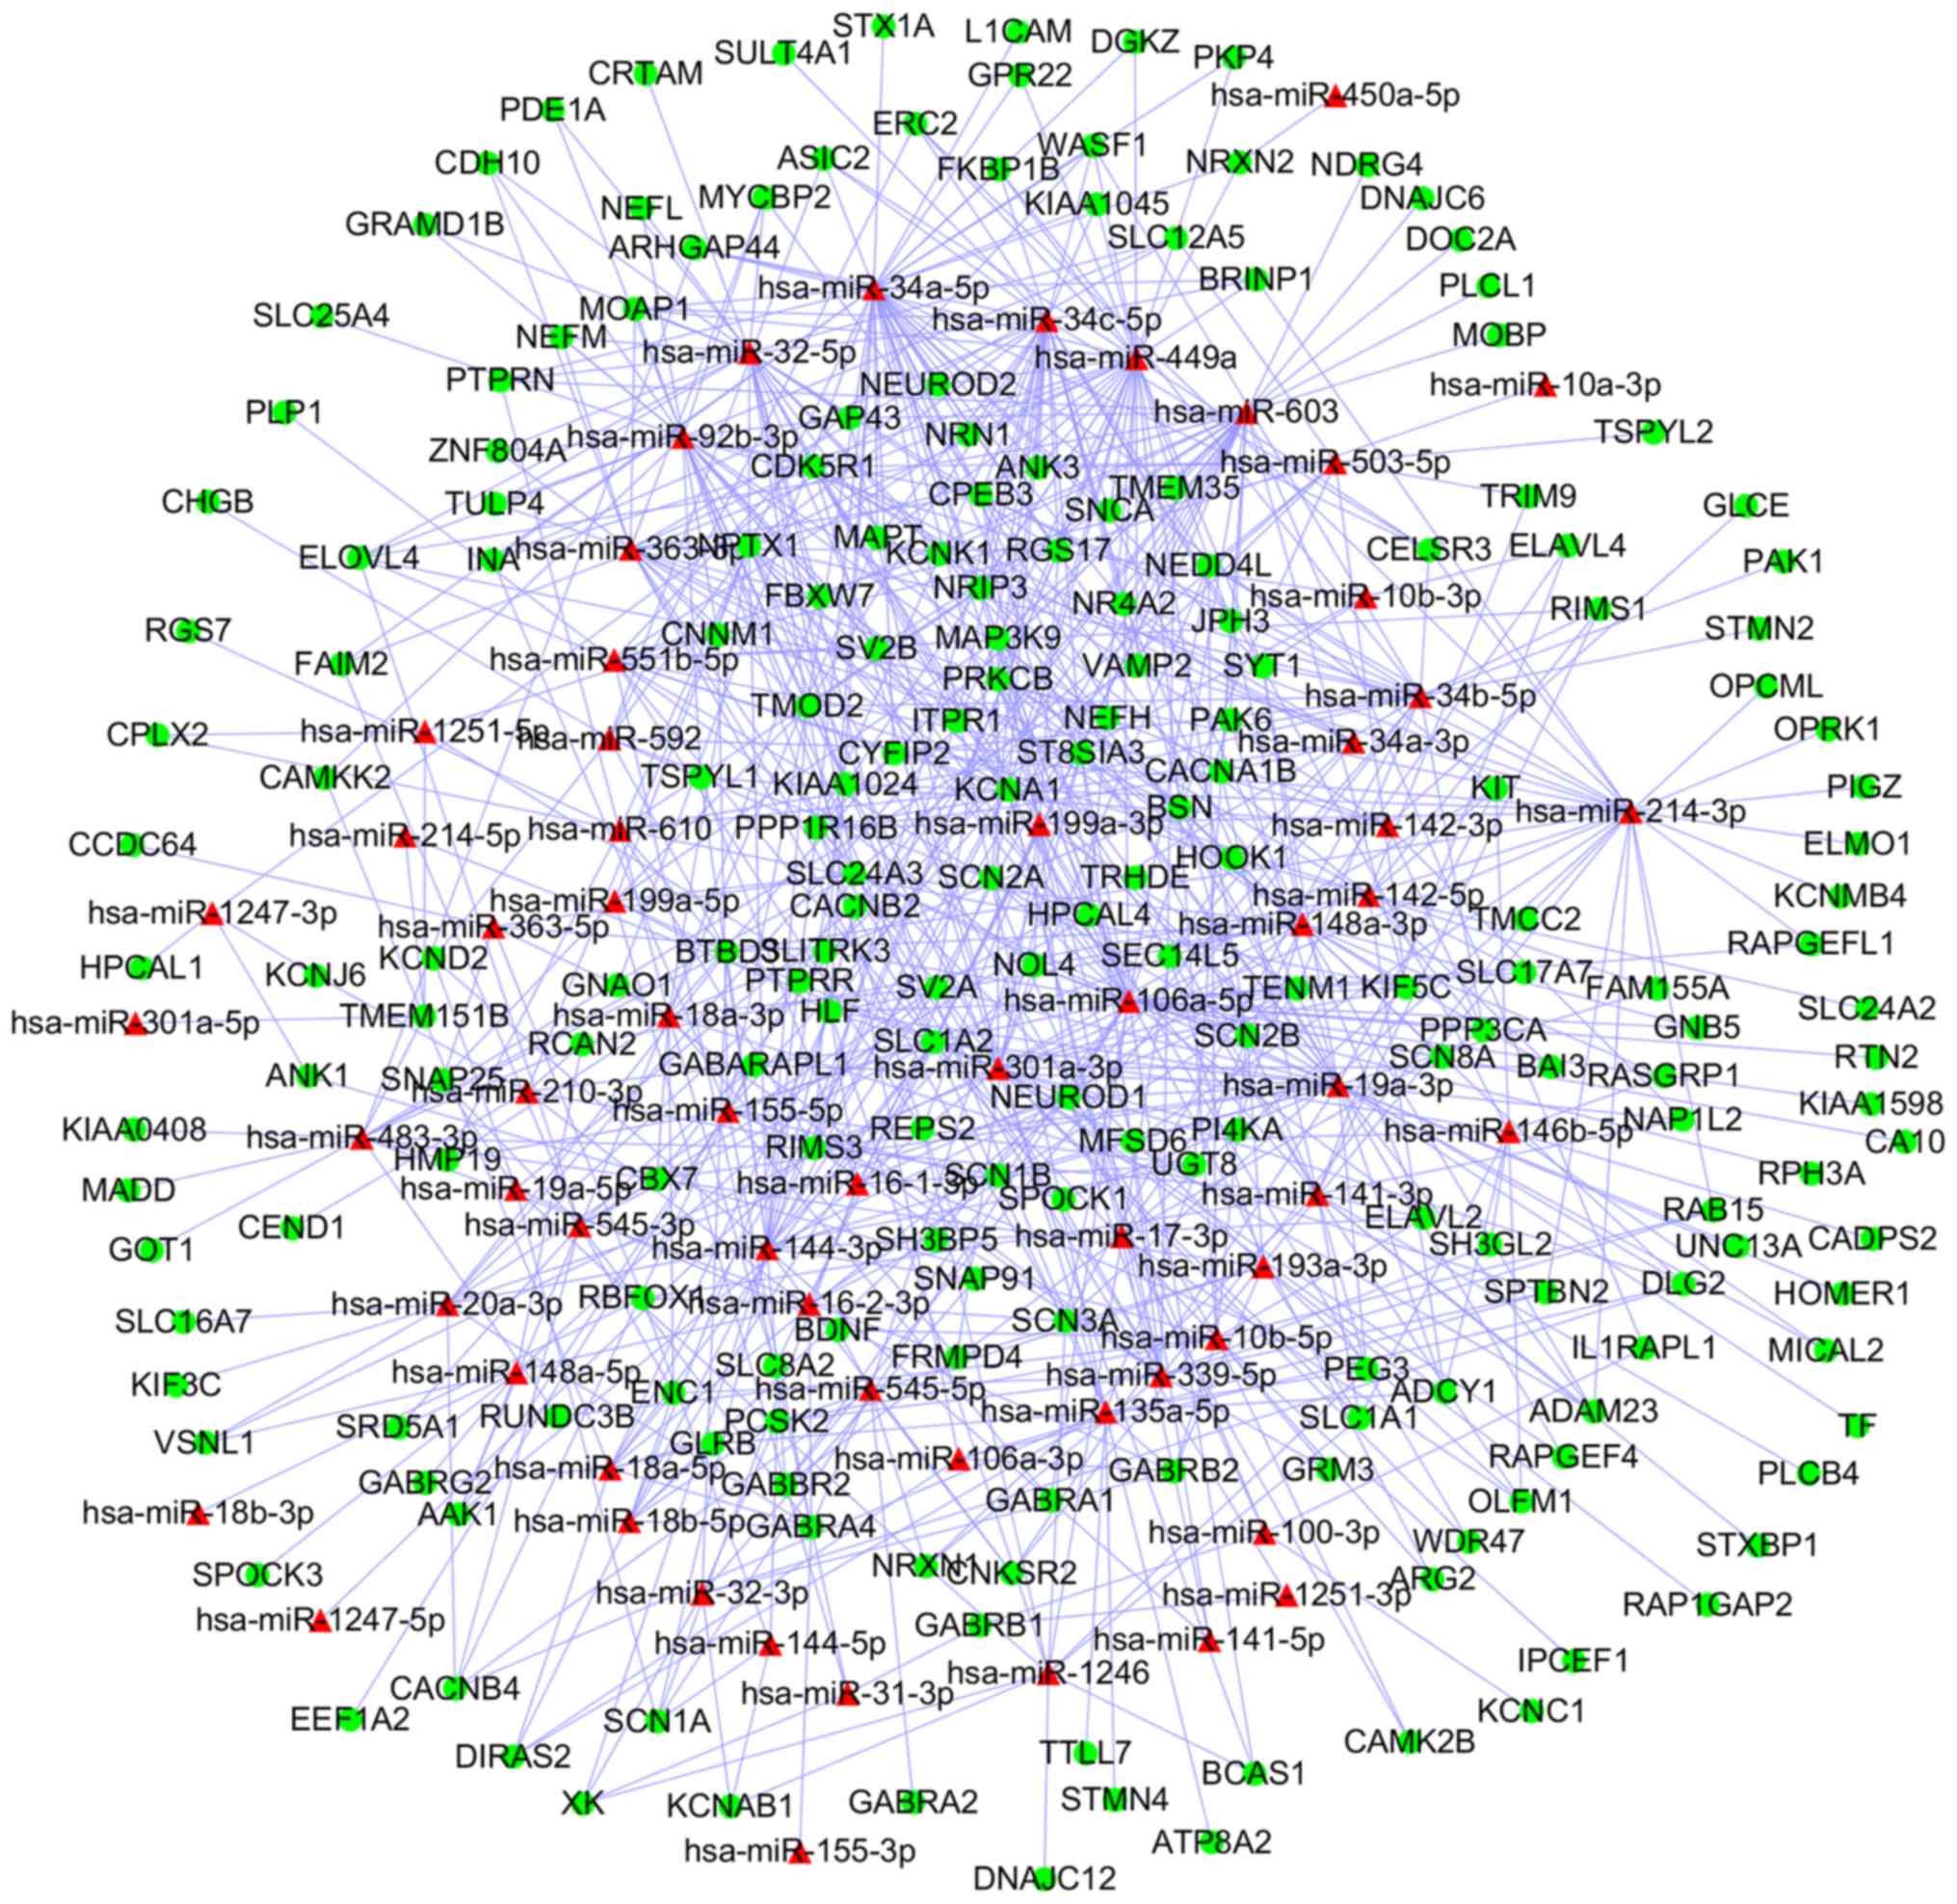
and 609 upregulated DEGs, respectively. Subsequently, 812 miRNA-DEG
pairs from upregulated DEMs and downregulated DEGs were selected
for the construction of a miRNA-DEG network, which was visualized
using Cytoscape (Fig. 5). Similarly,
a network including 1,232 miRNA-DEG pairs from downregulated DEMs
and upregulated DEGs was also generated (Fig. 6).
Following analysis, upregulated homo sapiens
(hsa)-miR-34a-5p, hsa-miR-449a and hsa-miR-106a-5p, were
revealed to be the 3 most significantly upregulated miRs, whilst
hsa-miR-124-3p, hsa-miR-128-3p and hsa-miR-330-3p were
identified as the top 3 downregulated miR. Finally, 4 miRNA-DEG
pairs (hsa-miR-449a-SYT1, hsa-miR-34a-5p-SYT1,
hsa-miR-330-3p-CD44 and hsa-miR-124-3p-PCNA) were identified
(Table I).
 | Table I.miRNA-target pairs of top 3 miRNAs
and hub genes from the miRNA-mRNA regulatory network. |
Table I.
miRNA-target pairs of top 3 miRNAs
and hub genes from the miRNA-mRNA regulatory network.
| Mature miRNA | Precursor
miRNA | Expression | Hub gene | Expression |
|---|
|
hsa-miR-449a |
hsa-miR-449a | Up | SYT1 | Down |
|
hsa-miR-34a-5p | hsa-miR-34a*;
hsa-miR-34a | Up | SYT1 | Down |
|
hsa-miR-330-3p |
hsa-miR-330 | Down | CD44 | Up |
|
hsa-miR-124-3p | hsa-miR-124*,
hsa-miR-124 | Down | PCNA | Up |
Association analysis and evaluation of
efficacy
Significant differences were observed in the
expression levels of 3 mRNAs (SYT1, CD44 and PCNA) and 4 miRNAs
(hsa-miR-449a, hsa-miR-34a-5p, hsa-miR-330-3p and hsa-miR-124-3p)
between EPN and normal tissues (P<0.05; (Fig. 7). The independent sample t-test and
AUC analyses confirmed that each of mRNA and miRNA (including
hsa-miR-449a, hsa-miR-34a-5p, hsa-miR-330-3p and hsa-miR-124-3p)
possessed high specificity and sensitivity values, indicating their
potentials as prognostic biomarkers (Fig. 8).
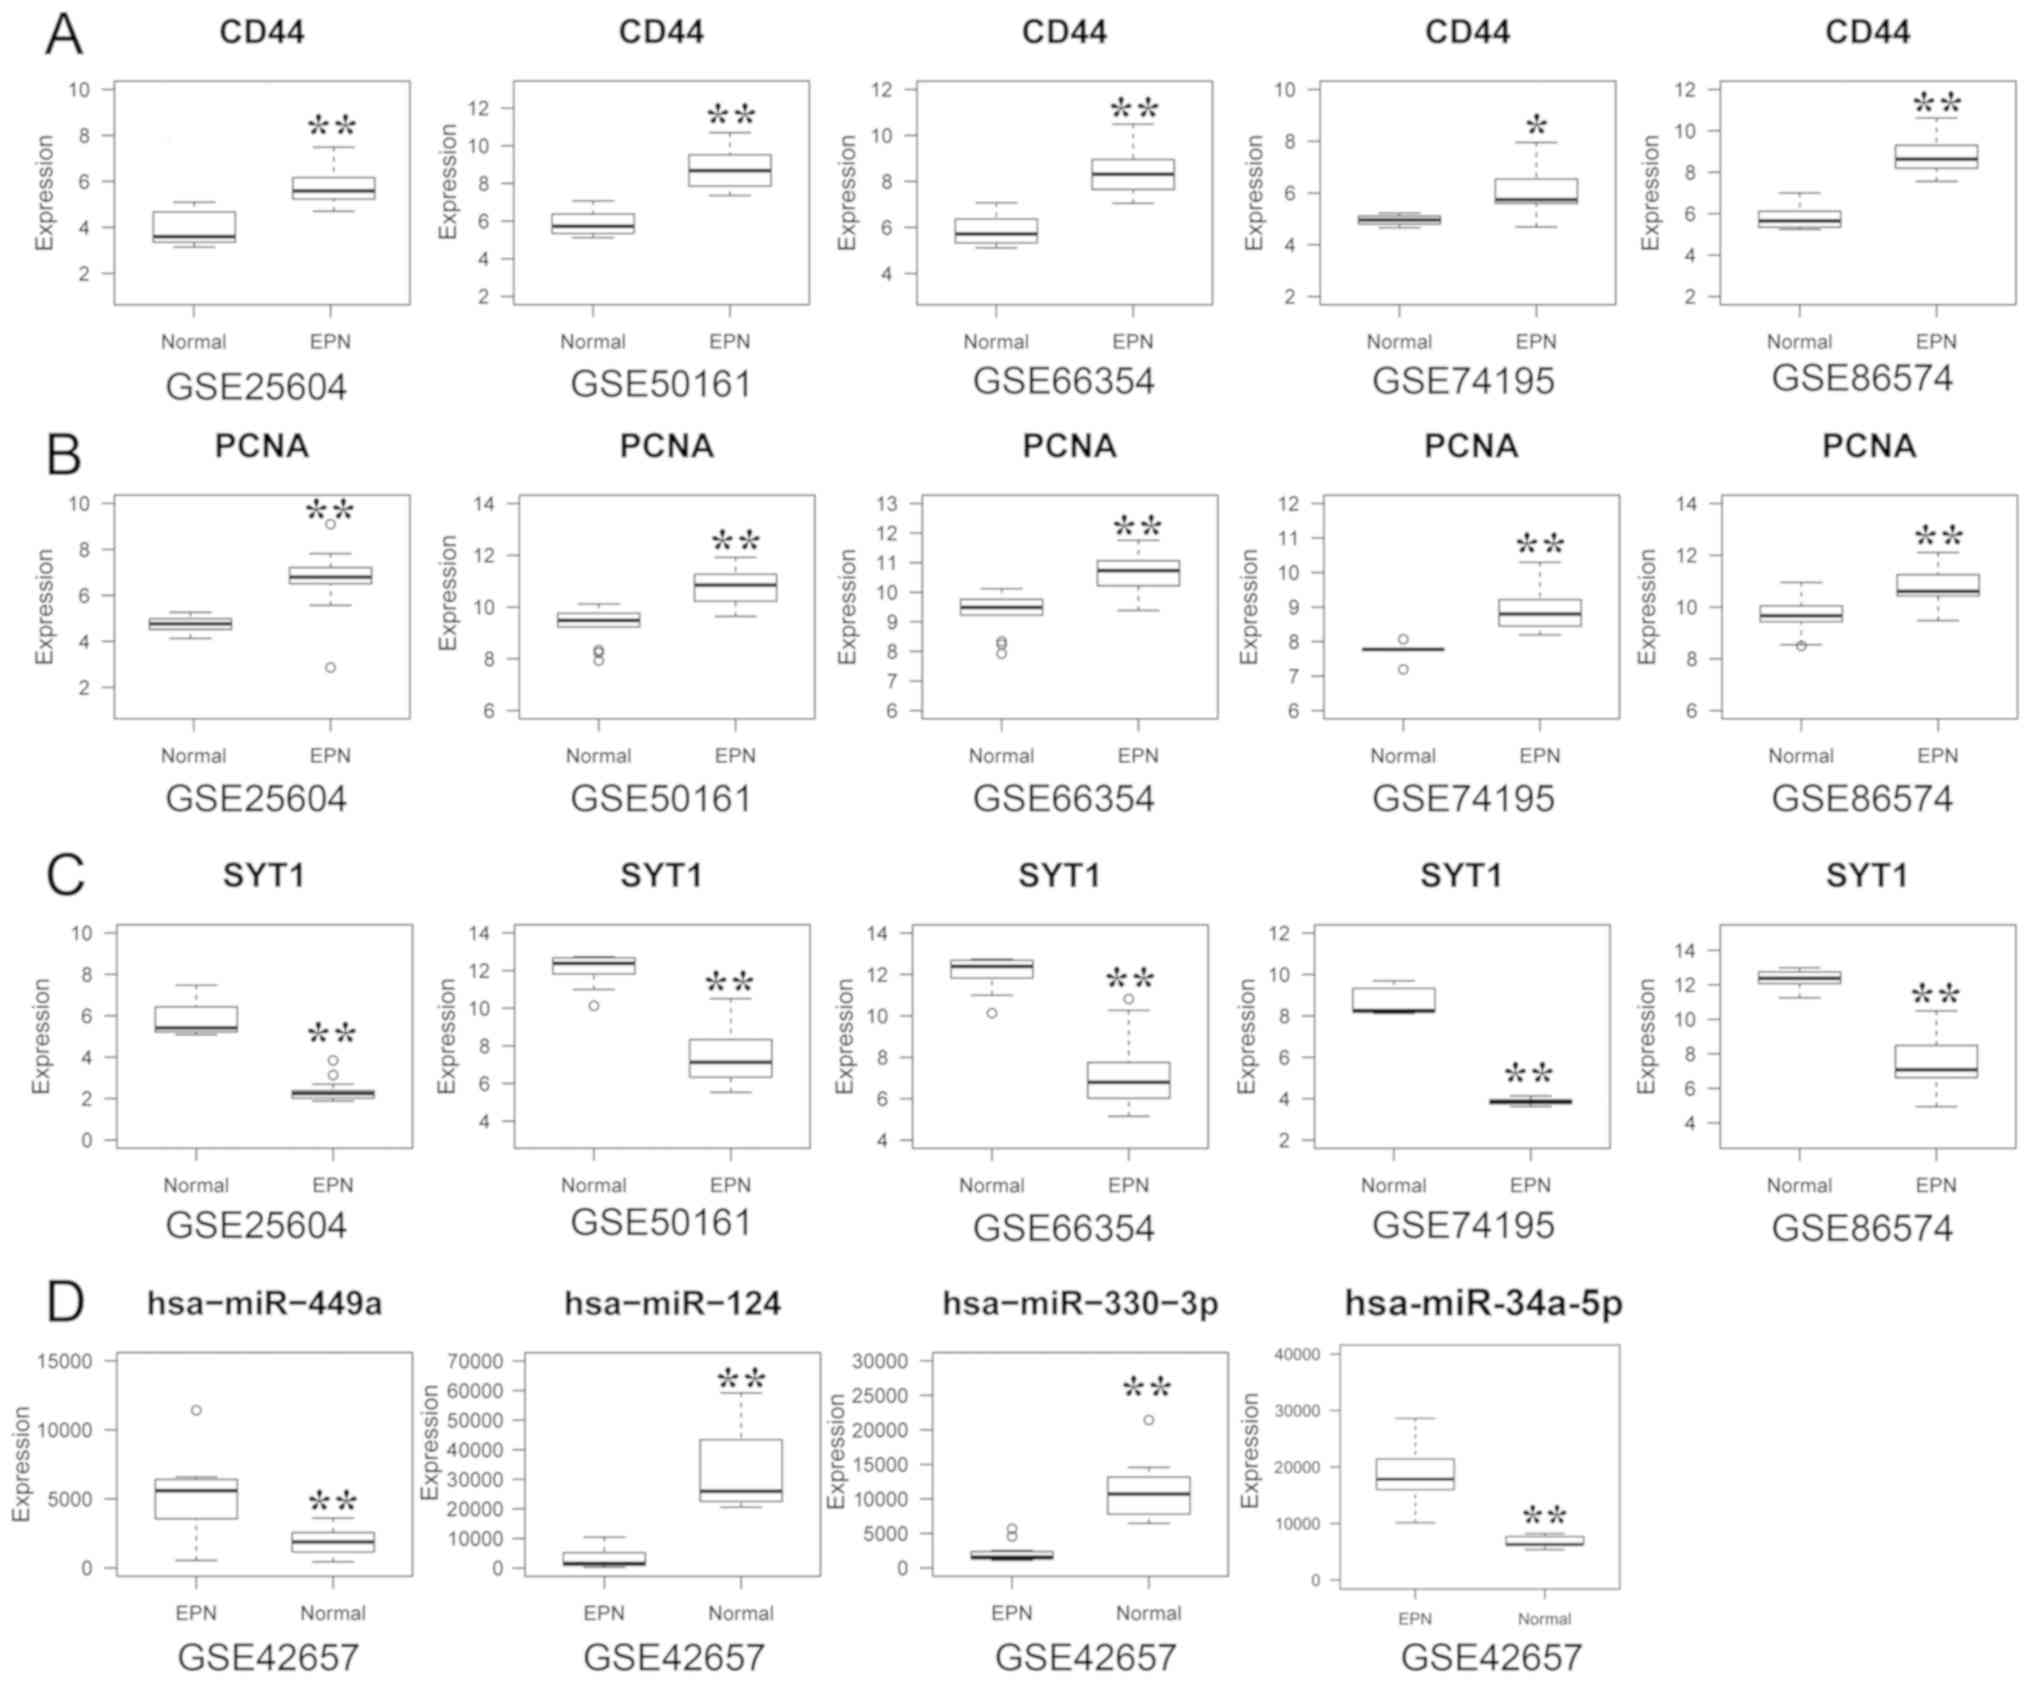 | Figure 7.Boxplots of association analyses.
Boxplots of (A) SYT1, (B) CD44 and (C) PCNA in the GSE25604,
GSE50161, GSE66354, GSE74195 and GSE86574 datasets. (D) Boxplots of
hsa-miR-449a, hsa-miR-34a-5p, hsa-miR-330-3p and hsa-miR-124-3p
from the GSE42657. *P<0.05 and **P<0.01. SYT1, synaptotagmin
1; CD44, CD44 molecule (Indian blood group); PCNA, proliferating
cell nuclear antigen; hsa, homo sapiens; miR, microRNA. |
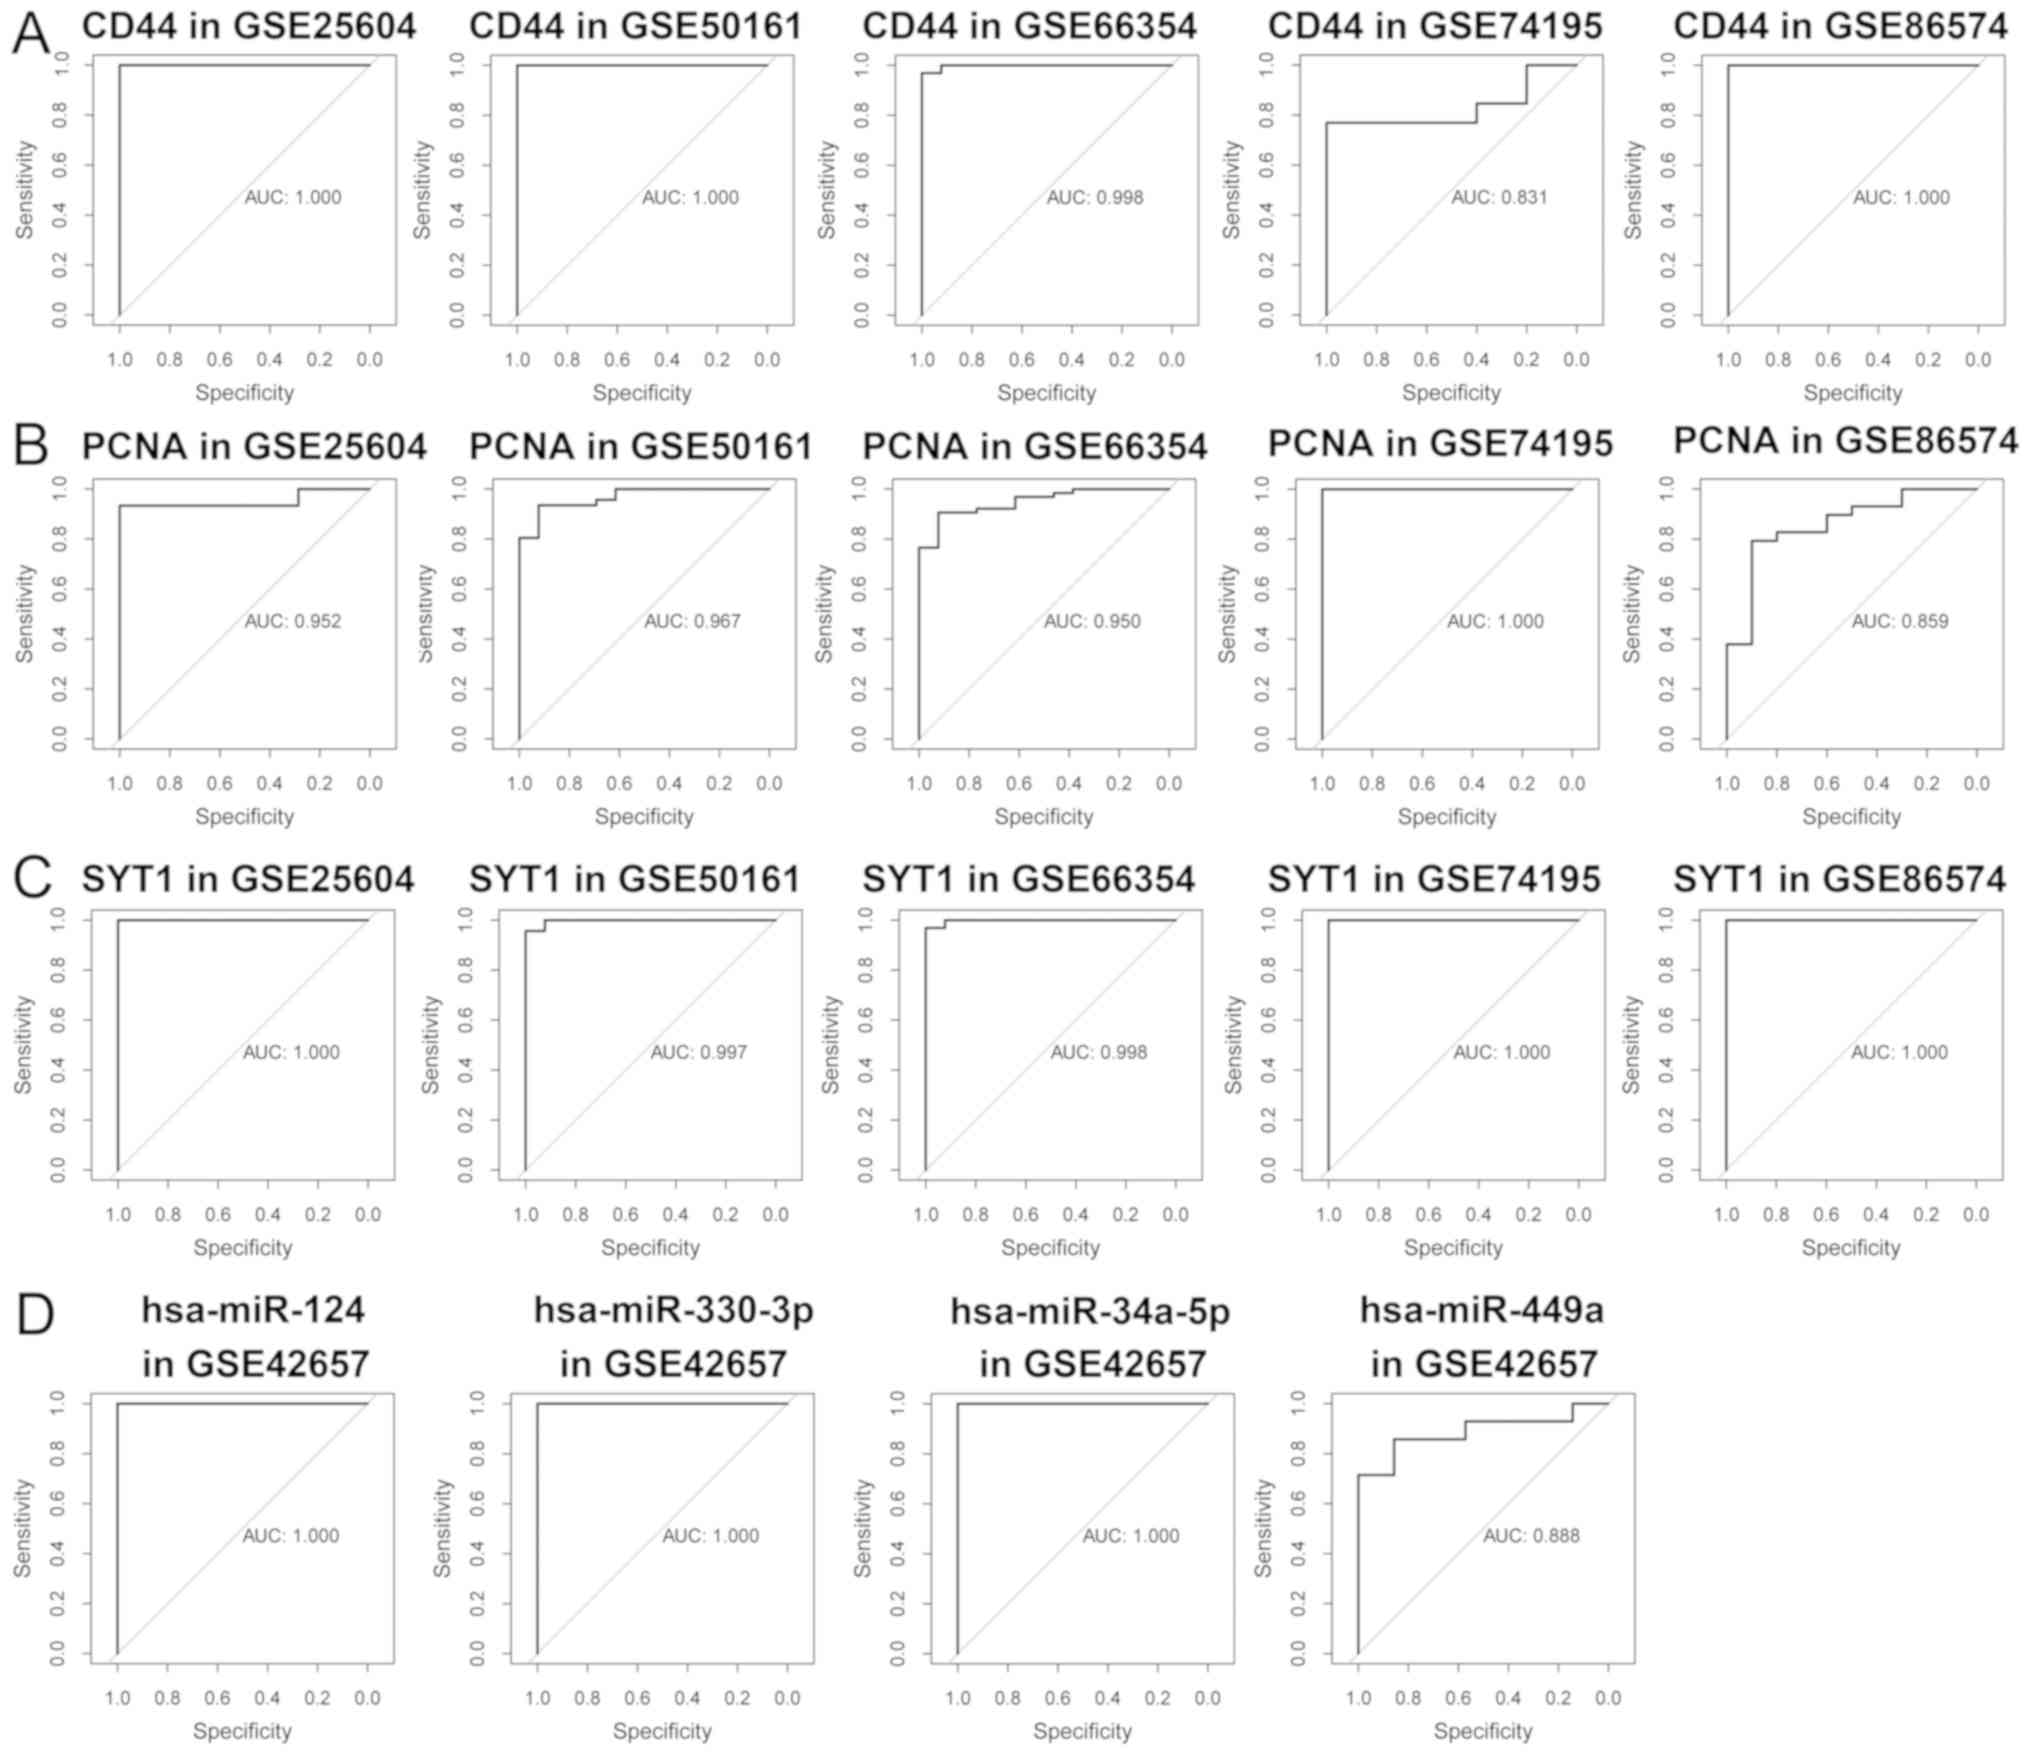 | Figure 8.ROC analyses for efficacy evaluation.
ROC analyses of (A) SYT1, (B) CD44 and (C) PCNA in the GSE25604,
GSE50161, GSE66354, GSE74195 and GSE86574 datasets. (D) ROC
analyses of hsa-miR-449a, hsa-miR-34a-5p, hsa-miR-330-3p and
hsa-miR-124-3p from the GSE42657. AUC, area under the curve;
hsa-miR, homo sapiens microRNA; ROC, receiver operating
characteristic; SYT1, synaptotagmin 1; CD44, CD44 molecule (Indian
blood group); PCNA, proliferating cell nuclear antigen; hsa,
homo sapiens; miR, microRNA. |
RT-qPCR analysis
Compared with the normal tissue samples, the
expression levels of CD44, PCNA, hsa-miR-124-3p and hsa-miR-330-3p
were significantly upregulated (P<0.01), and those of SYT1,
hsa-miR-34a-5p and hsa-miR-449a were significantly downregulated
(P<0.01) in EPN tissues. This was consistent with the results of
the integrated bioinformatics analyses (Fig. 9).
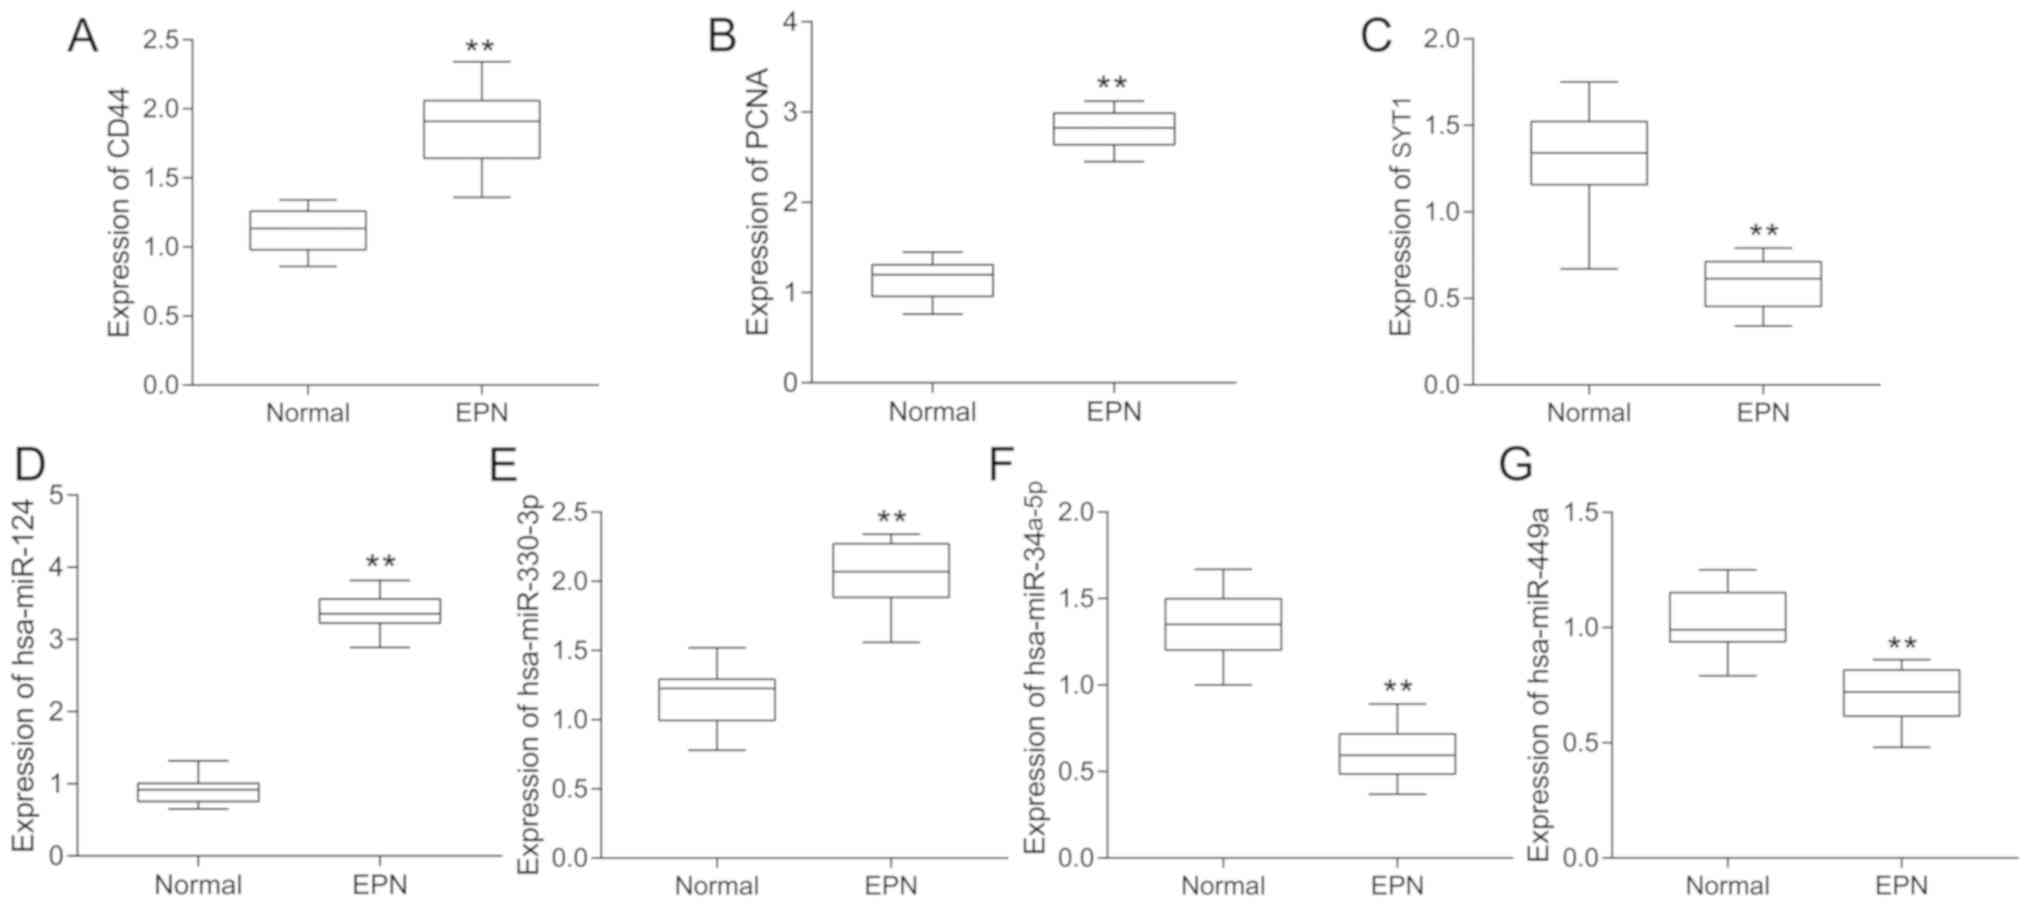 | Figure 9.Boxplots of hub genes and miRs
analyzed using reverse transcription-quantitative polymerase chain
reaction. Significance between normal (n=10) and EPN tissues (n=10)
for genes and miRs, including (A) CD44, (B) PCNA, (C) SYT1, (D)
hsa-miR-124-3p, (E) hsa-miR-330-3p, (F) hsa-miR-34a-5p and (G)
hsa-miR-449a, was determined using an independent sample t-test.
**P<0.01. miRs, microRNAs; hsa, homo sapiens; EPN,
ependymoma; CD44, CD44 molecule (Indian blood group); PCNA,
proliferating cell nuclear antigen; SYT1, synaptotagmin 1. |
Discussion
In previous years, microarray and next-generation
sequencing technologies have developed rapidly, promoting more
in-depth investigation into the molecular mechanisms of EPN.
Evidence to indicate that miRNAs negatively regulate mRNA
expression, and subsequently affect the development and progression
of tumors, has been described (6,7). In the
present study, 948 DEGs and 129 DEMs were selected from the GEO in
an attempt to identify the molecular mechanisms and potential
biomarkers of EPN.
GO and KEGG analysis results provided the functional
and pathway information for 948 DEGs and the top 5 modules
identified. These genes were primarily associated with ‘cell
division’, ‘mitotic nuclear division’ and ‘G2/M transition of
mitotic cell cycle’, which implied a regulatory function in
mitosis. Additionally, ‘retrograde endocannabinoid signaling’,
‘morphine addiction’ and ‘nicotine addiction’, identified using
KEGG pathway analysis, indicated that EPN may be significantly
associated with cannabinoids, morphine and nicotine. The ‘response
to drug’ term, obtained from the GO analysis, was associated with
28 upregulated DEGs, which indicated a potential drug resistance
mechanism and provided potential targets for patients with EPN
exhibiting chemotherapeutic tolerance. The PI3K-Akt signaling
pathway was has been suggested to be important in glioblastoma and
medulloblastoma, which supports the results of the present study
(32,33).
Furthermore, following the integrated analysis, 6
hub genes (including CDK1, CD44, PCNA, MYC, SYT1 and
KIF4A) were identified from the PPI network of DEGs.
PCNA is an immunohistochemical marker of cellular
proliferation in tumors, and is therefore able to predict the
survival outcome of patients with EPN (34). The myc oncogenes comprise 3
principal genes: C-myc, N-myc and L-myc.
Fluorescence in situ hybridization and immunohistochemistry
data have indicated that C-myc, a targeted gene of the Notch
pathway, was significantly correlated with the development of adult
onset EPNs (35). Also, increased
C-myc expression has been associated with poor prognosis in
patients with low-grade tumors (36). Although not previously confirmed, an
increasing number of studies have demonstrated the importance of
the 4 hub genes (CDK1, CD44, SYT1 and KIF4A) in
diseases, particularly CNS tumors (37–41).
CDK1, a member of the cyclin-dependent kinase (CDK)
family, serves an important role in G2-M phase transition, which is
consistent with the GO analysis results of the present study
(37). Following cDNA array and
immunohistochemical analyses, a significant positive correlation
was revealed between the expression level of CDK1 and glioma
oncogenesis (38). CD44 was
also suggested to be a confirmed biomarker for distinguishing the
molecular subtype of glioblastoma multiforme (39). In conclusion, the present study
identified 6 hub genes that serve essential roles in EPN, and which
may function as notable diagnostic and therapeutic biomarkers.
miRNAs are able to bind to the 3′-UTRs of specific
genes to inhibit translation or promote the degradation of the
corresponding mRNAs (7). Increasing
evidence has indicated that miRNA dysregulation is responsible for
the pathogenesis of EPN. In the present study, 6 miRNAs and 4
miRNA-DEG pairs were identified. Previous data has demonstrated
that the expression level of miR-34a-5p was downregulated in
colorectal cancer, which repressed apoptosis and cell cycle arrest
at the G1 phase, and promoted p53 transcription to suppress tumor
recurrence (42). CD117 was
also identified as a direct target of miR-34-5p in the
progression of osteosarcoma (43).
Additionally, the overexpression of miR-449a in glioblastoma
inhibited myc-associated zinc-finger protein activity through the
PI3K/AKT pathway, which highlighted a novel miRNA biomarker
(44). Zhi et al (45,46)
revealed that miR-106a-5p served as a tumor suppressor in
astrocytoma by inhibiting Fas-activated serine/threonine kinase,
and that its expression was negatively correlated with clinical
outcome. miR-124-3p was identified as a potential
therapeutic and prognostic biomarker of EPN, which is consistent
with the results of the present study, and further inhibited its
target, TP53INP1, affecting clinical outcome (8). A study has indicated that
miR-128-3p overexpression promoted neuronal survival in
ischemia-induced brain injury (47).
Additionally, miR-128-3p was demonstrated to be a
suppressive biomarker in various malignancies, including lung
cancer, acute lymphoblastic leukemia and hepatocellular carcinoma
(48–50). miR-330-3p knockdown was also
discovered to inhibit tumor growth, in contrast to the effect
produced by its overexpression (51). Notably, Pantaleo et al
(52) identified 3 miRNA-mRNA
regulatory networks, including the miR-330-3p-CD44 pair, as
biomarkers for the treatment of tyrosine protein kinase
KIT/platelet derived growth factor receptor α wild type succinate
dehydrogenase-deficient gastrointestinal stromal tumors (GISTs),
which supported the results of the present study. However, the
complex regulatory mechanisms of miRNAs in EPN remains to be fully
elucidated.
In conclusion, using integrated bioinformatics
analysis, the present study revealed 948 DEGs and 129 DEMs
associated with EPN. The results indicated 6 hub genes, 5 main
modules, 6 crucial miRNAs and 4 miRNA-DEG pairs as novel potential
biomarkers, which may facilitate further understanding of the
molecular mechanisms of EPN. However, the functional value of these
conclusions in EPN requires additional study.
Supplementary Material
Supporting Data
Acknowledgements
Not applicable.
Funding
The present study was supported by the Natural
Science Foundation of Shanghai (grant no. 19ZR1429800), Shanghai
Jiao Tong University Medicine-Engineering Cross Research Foundation
(grant no. YG2015MS25) and the Research Foundation of Shanghai No.
3 People's Hospital Affiliated to Shanghai Jiao Tong University
School of Medicine (grant no. syz2015-015).
Availability of data and materials
The datasets generated and/or analyzed during the
current study are available the GEO database repository (http://www.ncbi.nlm.nih.gov/geo/).
Authors' contributions
SHC and BY designed the study. JXD, YBP and YBM
performed the statistical analyses and interpreted the data. BY and
YBM wrote the manuscript. All authors read and approved the final
manuscript.
Ethics approval and consent to
participate
The present study was approved by the ethics
committee of the Shanghai Ninth People's Hospital Affiliated to
Shanghai Jiao Tong University School of Medicine (Shanghai,
China).
Patient consent for publication
Informed patient consent was obtained prior to the
commencement of clinical research.
Competing interests
The authors declare that they have no competing
interests.
Glossary
Abbreviations
Abbreviations:
|
EPN
|
ependymoma
|
|
miRNA
|
microRNA
|
|
DEG
|
differentially expressed gene
|
|
GEO
|
Gene Expression Omnibus
|
|
DEM
|
differentially expressed miRNA
|
|
DAVID
|
Database for Annotation, Visualization
and Integrated Discovery
|
|
PPI
|
protein-protein interaction
|
|
STRING
|
Search Tool for Retrieval of
Interacting Genes
|
|
GO
|
Gene Ontology
|
|
KEGG
|
Kyoto Encyclopedia of Genes and
Genomes
|
|
CC
|
cellular component
|
|
BP
|
biological process
|
|
MF
|
molecular function
|
|
CNS
|
central nervous system
|
References
|
1
|
Ostrom QT, Gittleman H, de Blank PM,
Finlay JL, Gurney JG, McKean-Cowdin R, Stearns DS, Wolff JE, Liu M,
Wolinsky Y, et al: American brain tumor association adolescent and
young adult primary brain and central nervous system tumors
diagnosed in the united states in 2008–2012. Neuro Oncol. 18 (Suppl
1):i1–i50. 2016. View Article : Google Scholar : PubMed/NCBI
|
|
2
|
Kilday JP, Rahman R, Dyer S, Ridley L,
Lowe J, Coyle B and Grundy R: Pediatric ependymoma: Biological
perspectives. Mol Cancer Res. 7:765–786. 2009. View Article : Google Scholar : PubMed/NCBI
|
|
3
|
Li AM, Dunham C, Tabori U, Carret AS,
McNeely PD, Johnston D, Lafay-Cousin L, Wilson B, Eisenstat DD,
Jabado N, et al: EZH2 expression is a prognostic factor in
childhood intracranial ependymoma: A Canadian Pediatric Brain Tumor
Consortium study. Cancer. 121:1499–1507. 2015. View Article : Google Scholar : PubMed/NCBI
|
|
4
|
Louis DN, Perry A, Reifenberger G, von
Deimling A, Figarella-Branger D, Cavenee WK, Ohgaki H, Wiestler OD,
Kleihues P and Ellison DW: The 2016 world health organization
classification of tumors of the central nervous system: A summary.
Acta neuropathol. 131:803–820. 2016. View Article : Google Scholar : PubMed/NCBI
|
|
5
|
Vera-Bolanos E, Aldape K, Yuan Y, Wu J,
Wani K, Necesito-Reyes MJ, Colman H, Dhall G, Lieberman FS,
Metellus P, et al: Clinical course and progression-free survival of
adult intracranial and spinal ependymoma patients. Neuro Oncol.
17:440–447. 2015. View Article : Google Scholar : PubMed/NCBI
|
|
6
|
Zhang B, Pan X and Anderson TA: MicroRNA:
A new player in stem cells. J Cell Physiol. 209:266–269. 2006.
View Article : Google Scholar : PubMed/NCBI
|
|
7
|
Fabian MR, Sonenberg N and Filipowicz W:
Regulation of mRNA translation and stability by microRNAs. Annu Rev
Biochem. 79:351–379. 2010. View Article : Google Scholar : PubMed/NCBI
|
|
8
|
Margolin-Miller Y, Yanichkin N, Shichrur
K, Toledano H, Ohali A, Tzaridis T, Michowitz S, Fichman-Horn S,
Feinmesser M, Pfister SM, et al: Prognostic relevance of miR-124-3p
and its target TP53INP1 in pediatric ependymoma. Genes Chromosomes
Cancer. 56:639–650. 2017. View Article : Google Scholar : PubMed/NCBI
|
|
9
|
Liang ML, Hsieh TH, Liu YR, Chen YW, Lee
YY, Chang FC, Lin SC, Huang MC, Donald Ming-Tak H, Wong TT, et al:
Significance of cyclin D1 overexpression in progression and
radio-resistance of pediatric ependymomas. Oncotarget. 9:2527–2542.
2018. View Article : Google Scholar : PubMed/NCBI
|
|
10
|
Benjamini Y and Hochberg Y: Controlling
the false discovery rate: A practical and powerful approach to
multiple testing. J Royal Statistical Soc. 57:289–300. 1995.
|
|
11
|
Huang da W, Sherman BT and Lempicki RA:
Bioinformatics enrichment tools: Paths toward the comprehensive
functional analysis of large gene lists. Nucleic Acids Res.
37:1–13. 2009. View Article : Google Scholar : PubMed/NCBI
|
|
12
|
Kanehisa M: The KEGG database. Novartis
Found Symp. 247:91–103, 119-128, 244–152. 2002. View Article : Google Scholar : PubMed/NCBI
|
|
13
|
Fabregat A, Sidiropoulos K, Garapati P,
Gillespie M, Hausmann K, Haw R, Jassal B, Jupe S, Korninger F,
McKay S, et al: The Reactome pathway Knowledgebase. Nucleic Acids
Res. 44:D481–487. 2016. View Article : Google Scholar : PubMed/NCBI
|
|
14
|
Shannon P, Markiel A, Ozier O, Baliga NS,
Wang JT, Ramage D, Amin N, Schwikowski B and Ideker T: Cytoscape: A
software environment for integrated models of biomolecular
interaction networks. Genome Res. 13:2498–2504. 2003. View Article : Google Scholar : PubMed/NCBI
|
|
15
|
Szklarczyk D, Franceschini A, Kuhn M,
Simonovic M, Roth A, Minguez P, Doerks T, Stark M, Muller J, Bork
P, et al: The STRING database in 2011: Functional interaction
networks of proteins, globally integrated and scored. Nucleic Acids
Res. 39:D561–D568. 2011. View Article : Google Scholar : PubMed/NCBI
|
|
16
|
Bader GD and Hogue CW: An automated method
for finding molecular complexes in large protein interaction
networks. BMC Bioinformatics. 4:22003. View Article : Google Scholar : PubMed/NCBI
|
|
17
|
Chin CH, Chen SH, Wu HH, Ho CW, Ko MT and
Lin CY: cytoHubba: Identifying hub objects and sub-networks from
complex interactome. BMC Syst Biol. 8 (Suppl 4):S112014. View Article : Google Scholar : PubMed/NCBI
|
|
18
|
Janky R, Verfaillie A, Imrichova H, Van de
Sande B, Standaert L, Christiaens V, Hulselmans G, Herten K, Naval
Sanchez M, Potier D, et al: iRegulon: From a gene list to a gene
regulatory network using large motif and track collections. PLoS
Comput Biol. 10:e10037312014. View Article : Google Scholar : PubMed/NCBI
|
|
19
|
Maragkakis M, Vergoulis T, Alexiou P,
Reczko M, Plomaritou K, Gousis M, Kourtis K, Koziris N, Dalamagas T
and Hatzigeorgiou AG: Hatzigeorgiou DIANA-microT Web server upgrade
supports Fly and Worm miRNA target prediction and bibliographic
miRNA to disease association. Nucleic Acids Res. 39:W145–W158.
2011. View Article : Google Scholar : PubMed/NCBI
|
|
20
|
Paraskevopoulou MD, Georgakilas G,
Kostoulas N, Vlachos IS, Vergoulis T, Reczko M, Filippidis C,
Dalamagas T and Hatzigeorgiou AG: DIANA-microT web server v5.0:
Service integration into miRNA functional analysis workflows.
Nucleic Acids Res. 41:W169–W173. 2013. View Article : Google Scholar : PubMed/NCBI
|
|
21
|
Betel D, Wilson M, Gabow A, Marks DS and
Sander C: The microRNA.org resource: Targets and expression.
Nucleic Acids Res. 36:D149–D53. 2008. View Article : Google Scholar : PubMed/NCBI
|
|
22
|
Tsang JS, Ebert MS and van Oudenaarden A:
Genome-wide dissection of microRNA functions and cotargeting
networks using gene set signatures. Mol Cell. 38:140–153. 2010.
View Article : Google Scholar : PubMed/NCBI
|
|
23
|
Wong N and Wang X: miRDB: An online
resource for microRNA target prediction and functional annotations.
Nucleic Acids Res. 43:D146–D152. 2015. View Article : Google Scholar : PubMed/NCBI
|
|
24
|
Vejnar CE, Blum M and Zdobnov EM: miRmap
web: Comprehensive microRNA target prediction online. Nucleic Acids
Res. 41:W165–W168. 2013. View Article : Google Scholar : PubMed/NCBI
|
|
25
|
Hsu PW, Huang HD, Hsu SD, Lin LZ, Tsou AP,
Tseng CP, Stadler PF, Washietl S and Hofacker IL: miRNAMap: Genomic
maps of microRNA genes and their target genes in mammalian genomes.
Nucleic Acids Res. 34:D135–D139. 2006. View Article : Google Scholar : PubMed/NCBI
|
|
26
|
Krek A, Grün D, Poy MN, Wolf R, Rosenberg
L, Epstein EJ, MacMenamin P, da Piedade I, Gunsalus KC, Stoffel M
and Rajewsky N: Combinatorial microRNA target predictions. Nat
Genet. 37:495–500. 2005. View
Article : Google Scholar : PubMed/NCBI
|
|
27
|
Kertesz M, Iovino N, Unnerstall U, Gaul U
and Segal E: The role of site accessibility in microRNA target
recognition. Nat Genet. 39:1278–1284. 2007. View Article : Google Scholar : PubMed/NCBI
|
|
28
|
Miranda KC, Huynh T, Tay Y, Ang YS, Tam
WL, Thomson AM, Lim B and Rigoutsos I: A pattern-based method for
the identification of MicroRNA binding sites and their
corresponding heteroduplexes. Cell. 126:1203–1217. 2006. View Article : Google Scholar : PubMed/NCBI
|
|
29
|
Krüger J and Rehmsmeier M: RNAhybrid:
microRNA target prediction easy, fast and flexible. Nucleic Acids
Res. 34:W451–W454. 2006. View Article : Google Scholar : PubMed/NCBI
|
|
30
|
Garcia DM, Baek D, Shin C, Bell GW,
Grimson A and Bartel DP: Weak seed-pairing stability and high
target-site abundance decrease the proficiency of lsy-6 and other
microRNAs. Nat Struct Mol Biol. 18:1139–1146. 2011. View Article : Google Scholar : PubMed/NCBI
|
|
31
|
Livak KJ and Schmittgen TD: Analysis of
relative gene expression data using real-time quantitative PCR and
the 2(-Delta Delta C(T)) method. Methods. 25:402–408. 2001.
View Article : Google Scholar : PubMed/NCBI
|
|
32
|
Li X, Wu C, Chen N, Gu H, Yen A, Cao L,
Wang E and Wang L: PI3K/Akt/mTOR signaling pathway and targeted
therapy for glioblastoma. Oncotarget. 7:33440–33450.
2016.PubMed/NCBI
|
|
33
|
Dimitrova V and Arcaro A: Targeting the
PI3K/AKT/mTOR signaling pathway in medulloblastoma. Curr Mol Med.
15:82–93. 2015. View Article : Google Scholar : PubMed/NCBI
|
|
34
|
Verstegen MJ, Leenstra DT, Ijlst-Keizers H
and Bosch DA: Proliferation- and apoptosis-related proteins in
intracranial ependymomas: An immunohistochemical analysis. J
Neurooncol. 56:21–28. 2002. View Article : Google Scholar : PubMed/NCBI
|
|
35
|
Gupta RK, Sharma MC, Suri V, Kakkar A,
Singh M and Sarkar C: Study of chromosome 9q gain, Notch pathway
regulators and Tenascin-C in ependymomas. J Neurooncol.
116:267–274. 2014. View Article : Google Scholar : PubMed/NCBI
|
|
36
|
Faria C, Miguens J, Antunes JL, Salgado D,
Nunes S, Barroso C, Martins Mdo C, Nunes VM and Roque L: Pediatric
brain tumors: Genetics and clinical outcome. J Neurosurg Pediatr.
5:263–270. 2010. View Article : Google Scholar : PubMed/NCBI
|
|
37
|
Chen X, Zhang FH, Chen QE, Wang YY, Wang
YL, He JC and Zhou J: The clinical significance of CDK1 expression
in oral squamous cell carcinoma. Med Oral Patol Oral Cir Bucal.
20:e7–12. 2015. View Article : Google Scholar : PubMed/NCBI
|
|
38
|
Chen H, Huang Q, Zhai DZ, Dong J, Wang AD
and Lan Q: CDK1 expression and effects of CDK1 silencing on the
malignant phenotype of glioma cells. Zhonghua Zhong Liu Za Zhi.
29:484–488. 2007.(In Chinese). PubMed/NCBI
|
|
39
|
Brown DV, Daniel PM, D'Abaco GM, Gogos A,
Ng W, Morokoff AP and Mantamadiotis T: Coexpression analysis of
CD133 and CD44 identifies proneural and mesenchymal subtypes of
glioblastoma multiforme. Oncotarget. 6:6267–6280. 2015. View Article : Google Scholar : PubMed/NCBI
|
|
40
|
Yang J, Hou Z, Wang C, Wang H and Zhang H:
Gene expression profiles reveal key genes for early diagnosis and
treatment of adamantinomatous craniopharyngioma. Cancer Gene Ther.
25:227–239. 2018. View Article : Google Scholar : PubMed/NCBI
|
|
41
|
Zhong S, Wu B, Dong X, Han Y, Jiang S,
Zhang Y, Bai Y, Luo SX, Chen Y, Zhang H and Zhao G: Identification
of driver genes and key pathways of glioblastoma shows JNJ-7706621
as a novel antiglioblastoma drug. World Neurosurg. 109:e329–e342.
2018. View Article : Google Scholar : PubMed/NCBI
|
|
42
|
Gao J, Li N, Dong Y, Li S, Xu L, Li X, Li
Y, Li Z, Ng SS, Sung JJ, et al: miR-34a-5p suppresses colorectal
cancer metastasis and predicts recurrence in patients with stage
II/III colorectal cancer. Oncogene. 34:4142–4152. 2015. View Article : Google Scholar : PubMed/NCBI
|
|
43
|
Pu Y, Zhao F, Wang H, Cai W, Gao J, Li Y
and Cai S: MiR-34a-5p promotes the multi-drug resistance of
osteosarcoma by targeting the CD117 gene. Oncotarget.
7:28420–28434. 2016. View Article : Google Scholar : PubMed/NCBI
|
|
44
|
Yao Y, Ma J, Xue Y, Wang P, Li Z, Li Z, Hu
Y, Shang X and Liu Y: MiR-449a exerts tumor-suppressive functions
in human glioblastoma by targeting Myc-associated zinc-finger
protein. Mol Oncol. 9:640–656. 2015. View Article : Google Scholar : PubMed/NCBI
|
|
45
|
Zhi F, Zhou G, Shao N, Xia X, Shi Y, Wang
Q, Zhang Y, Wang R, Xue L, Wang S, et al: miR-106a-5p inhibits the
proliferation and migration of astrocytoma cells and promotes
apoptosis by targeting FASTK. PLoS One. 8:e723902013. View Article : Google Scholar : PubMed/NCBI
|
|
46
|
Zhi F, Chen X, Wang S, Xia X, Shi Y, Guan
W, Shao N, Qu H, Yang C, Zhang Y, et al: The use of hsa-miR-21,
hsa-miR-181b and hsa-miR-106a as prognostic indicators of
astrocytoma. Eur J Cancer. 46:1640–1649. 2010. View Article : Google Scholar : PubMed/NCBI
|
|
47
|
Mao G, Ren P, Wang G, Yan F and Zhang Y:
MicroRNA-128-3p protects mouse against cerebral ischemia through
reducing p38α mitogen-activated protein kinase activity. J Mol
Neurosci. 61:152–158. 2017. View Article : Google Scholar : PubMed/NCBI
|
|
48
|
Zhang R, Liu C, Niu Y, Jing Y, Zhang H,
Wang J, Yang J, Zen K, Zhang J, Zhang CY and Li D: MicroRNA-128-3p
regulates mitomycin C-induced DNA damage response in lung cancer
cells through repressing SPTAN1. Oncotarget. 8:58098–58107.
2017.PubMed/NCBI
|
|
49
|
Mets E, Van Peer G, Van der Meulen J,
Boice M, Taghon T, Goossens S, Mestdagh P, Benoit Y, De Moerloose
B, Van Roy N, et al: MicroRNA-128-3p is a novel oncomiR targeting
PHF6 in T-cell acute lymphoblastic leukemia. Haematologica.
99:1326–1333. 2014. View Article : Google Scholar : PubMed/NCBI
|
|
50
|
Huang CY, Huang XP, Zhu JY, Chen ZG, Li
XJ, Zhang XH, Huang S, He JB, Lian F, Zhao YN, et al: miR-128-3p
suppresses hepatocellular carcinoma proliferation by regulating
PIK3R1 and is correlated with the prognosis of HCC patients. Oncol
Rep. 33:2889–2898. 2015. View Article : Google Scholar : PubMed/NCBI
|
|
51
|
Meng H, Wang K, Chen X, Guan X, Hu L,
Xiong G, Li J and Bai Y: MicroRNA-330-3p functions as an oncogene
in human esophageal cancer by targeting programmed cell death 4. Am
J Cancer Res. 5:1062–1075. 2015.PubMed/NCBI
|
|
52
|
Pantaleo MA, Ravegnini G, Astolfi A,
Simeon V, Nannini M, Saponara M, Urbini M, Gatto L, Indio V,
Sammarini G, et al: Integrating miRNA and gene expression profiling
analysis revealed regulatory networks in gastrointestinal stromal
tumors. Epigenomics. 8:1347–1366. 2016. View Article : Google Scholar : PubMed/NCBI
|