Introduction
Glioma is the most common type of malignant brain
tumor in adults worldwide (1,2). The
principal diagnosis methods for patients with glioma include
disease history questionnaires, nervous system physical examination
and imaging examination with different modalities (3). Since early glioma prediction and
diagnosis is difficult, the majority of patients are diagnosed at a
late stage. Typically, treatment for patients with glioma involves
maximal safe surgical resection, followed by chemotherapy and
radiotherapy. The prognosis of patients with glioma is frequently
poor due to its aggressive properties (4,5). Hence,
there is an urgent need to identify novel biomarkers for glioma
diagnosis and novel therapeutic targets to improve patient
survival.
Protein and lipid are two types of diagnostic
biomarkers for glioma (6–8). Biomarkers may be identified from
patient samples, including serum, cerebrospinal fluid (CSF) and
glioma cells (9). Capillary
morphogenesis protein 2 (CMG2) has been identified as a prognostic
biomarker for glioma, and CMG2 increased expression is associated
with increased tumor grade and poor patient survival (10). The effect of protein biomarker T-LAK
cell-originating protein kinase (TOPK) expression on the outcome in
malignant glioma has been previously reported, revealing that low
TOPK expression is an independent predictor of longer overall
survival (11). Ribom et al
(12) performed a comparative
proteomics analysis with CSF samples from glioma cases and revealed
that α-2-Heremans-Schmid glycoprotein was highly expressed in the
CSF of patients with low-grade disease. Iwadate et al
(13) conducted survival prediction
research in glioma based on proteomic analysis and identified 37
protein biomarkers.
In addition to protein biomarkers, lipid biomarkers
are also required for the diagnosis and treatment of glioma. The
matrix assisted laser desorption/ionization (MALDI)-imaging
technique has been widely used in lipid biomarker research
(14–16). Wildburger et al (15) identified lipids directly from
glioblastoma tissues by MALDI-imaging mass spectrometry (MS), and a
number of species of signaling lipids were observed. Shrivas et
al (17) identified
phospholipids in mouse liver and cerebellum tissue sections using
an ionic matrix for enhanced MALDI-imaging MS.
In the present study, three glioma brain tissue
(GBT) samples and three trauma brain tissue (TBT) samples were
collected to identify lipid biomarkers using MALDI-time of flight
(TOF)-tandem mass spectrometry (MS/MS). The lipid biomarkers with
differential expression were selected and identified. The
expression of a number of lipid biomarkers with potential clinical
significance was verified using the MALDI-imaging technique. In
order to reveal the regulatory mechanisms of lipid biomarkers in
glioma signaling pathways, the glioma cell line U373-MG was
cultured, and additional research was performed regarding the
PI3K/AKT signaling pathway.
Materials and methods
Brain tissue samples
In the present study, three GBT samples from
patients with glioma (two women aged 46 and 55 years and one man
aged 60 years) and three TBT samples from patients with traumatic
brain injury (two men aged 48 and 50 years and one woman aged 56
years) were collected following neurosurgery at The First
Affiliated Hospital of Zhejiang University School of Medicine
(Hangzhou, China) in December 2013. Informed consent was obtained
from participants for the use of their tissues in the present
study. All diagnoses of glioma were histopathologically
confirmed.
Glioma cell culture
The human glioma cell line U373-MG was purchased
from American Type Culture Collection (ATCC). The U373-MG ATCC cell
line is a U-251 derivative according to Cellosaurus (https://web.expasy.org/cellosaurus/CVCL_2219). It was
directly used in the present study without additional
authentication. The cell line was cultured in DMEM (Thermo Fisher
Scientific, Inc.), supplemented with 1% penicillin/streptomycin and
10% FBS (Thermo Fisher Scientific, Inc.). The cells were grown at
37°C with 5% CO2 in a humidified incubator.
Biomarker identification with
MALDI-TOF-MS/MS
GBTs and TBTs were removed from the −80°C freezer
and cut into 10-µm-thick sections with a Leica CM950 freezing
microtome (Leica Microsystems GmbH) at −20°C. Each tissue section
was pasted on the imaging slide and dried in a vacuum dryer for 45
min at room temperature. The imaging slide was placed into the
ImagePrep machine and flushed uniformly with matrix. The imaging
slide was placed on the MTP Slide Adapter II and analyzed with
MALDI-TOF-MS/MS. The mass scan range was set at m/z: 0–3,000. The
mass spectrum data were analyzed using FlexImaging software version
3.0 (Bruker Daltonics). The lipid peaks were identified using MS/MS
and results were searched in the Human Metabolome Database
(18).
Live staining
U373-MG cells were cultured as aforementioned in
small glass dishes overnight so that they reach 60–75% confluence.
Subsequent to removal of the medium, the cells were washed once
with 500 µl DMEM containing 2% FBS. The fluorescent antibody
anti-human insulin-like growth factor-1 receptor (IGF-1R;
eBioscience; cat. no. 16-8849; 1:20) was added to the DMEM
containing 2% FBS. The cells were cultured in the new medium with
antibody at 37°C with 5% CO2 in a humidified incubator
for 10 min. The medium was discarded and the cells were washed once
with DMEM containing 2% FBS without antibody. Subsequently, DMEM
with 2% FBS was added into the dishes. The prepared dishes were
placed into the CO2 incubator of a laser scanning
confocal fluorescence microscope. IGF-1R signal was recorded using
laser scanning confocal microscopy.
Cell immunostaining
U373-MG cells were cultured in small glass dishes as
aforementioned. When cells reached 60–75% of the dishes, the medium
was discarded and the cells were washed once with 1 ml PBS. A
volume of 1 ml fixation and permeabilization solution (BD
Biosciences) was added into the dish, which was kept in the dark
for 1 h at 4°C. The fixing reagent was discarded and the dish was
washed once with 1 ml PBS. Goat serum (5%; Jackson Immuno Research)
in PBS was used for blocking at room temperature for 1 h. The cells
were incubated with mouse monoclonal primary antibody against
ceramide (Enzo Life Sciences; cat. no. ALX-804-196; 1:10) at 4°C
overnight. Following three washes with PBS, the cells were
incubated with goat anti-mouse IgG secondary antibody
(AF647-conjugated; Jackson Immunologicals; cat. no. 115-606-146;
1:300) for 1 h in the dark at room temperature. The dish was washed
three times with PBS and visualized using laser scanning confocal
microscopy.
For the regulation of IGF-1R expression, U373-MG
cells were divided into the DMSO and Desi groups. Cells from the
DMSO group represented the control group and were treated with DMSO
only and stimulated with insulin for 30 min. Cells from the Desi
group were treated with the drug Desi and stimulated with insulin
for 30 min.
Western blotting
The glioma cell line U373-MG was lysed with NP40
lysis buffer (Thermo Fisher Scientific, Inc.). The protein density
in each sample was determined by ultraviolet spectrometry and
adjusted to the same density using loading buffer. Total protein (5
µg) was separated by SDS-PAGE (10% gel) and transferred onto PVDF
membranes (EMD Millipore). The membranes were blocked at 4°C
overnight with blocking buffer (pH 7.6) containing 5% nonfat dried
milk and incubated with rabbit anti-human monoclonal antibody,
which was purchased from Cell Signaling Technology, Inc.
Immunoreactive proteins were stained using a chemiluminescent
detection system. Membranes were subsequently washed with stripping
solution for 1 h and treated as aforementioned, with mouse β-actin
antibody (ProteinTech Group, Inc.) as an internal control. The
relative target protein expression levels were normalized to those
of β-actin.
For the regulation of PI3K/Akt pathway, U373-MG
cells were divided into the DMSO and Desi groups. Cells from the
DMSO group represented the control group and were treated with DMSO
only. Cells from the Desi group were treated with the drug Desi.
Both groups were then stimulated with insulin for 15, 30 and 60
min. Western blot analysis of these samples was performed to
observe the PI3K/Akt pathway.
Statistical analysis
ClinProTools™ software (version 2.2; Bruker
Corporation) was used to perform the statistical analysis of the
peaks. Wilcoxon rank-sum test was used to compare data from TBT and
GBT groups. Data are presented as the means ± standard deviation.
Each experiment was repeated three times. P<0.01 was considered
to indicate a statistically significant difference.
Results
Screening of lipid biomarkers between
GBT and TBT samples
In the present study, three GBT samples and three
TBT samples were collected, sliced and analyzed by MALDI-TOF-MS.
The mass spectrum peaks were analyzed using FlexImaging software
Ver3.0. Increased attention was paid to the differential expression
peaks of lipid biomarkers in GBT and TBT samples. A total of 15
lipid peaks exhibited a higher expression intensity in normal
control TBT samples compared with GBT samples (Table I). Another 16 lipid peaks exhibited a
higher expression intensity in GBT samples compared with normal
control TBT samples (Table II).
 | Table I.Lipid peaks with higher expression in
TBT samples compared with GBT samples. |
Table I.
Lipid peaks with higher expression in
TBT samples compared with GBT samples.
| Bio-marker (m/z) | P-value | Expression in TBT
(mean ± SD) | Expression in GBT
(mean ± SD) |
|---|
| 798.57 |
<1×10⁻⁶ | 198.68±67.29 | 14.34±11.75 |
| 722.55 |
<1×10⁻⁶ | 122.60±42.17 | 9.37±5.57 |
| 848.64 |
<1×10⁻⁶ | 26.64±9.18 | 3.44±2 |
| 799.56 |
<1×10⁻⁶ | 90.11±32.72 | 7.11±5.92 |
| 800.56 |
<1×10⁻⁶ | 64.7±23.62 | 5.92±4.26 |
| 769.58 (SM) |
<1×10⁻⁶ | 94.32±34.4 | 9.06±5.37 |
| 828.57 |
<1×10⁻⁶ | 14.17±4.68 | 3.32±2.06 |
| 849.65 |
<1×10⁻⁶ | 13.13±4.42 | 2.93±2.09 |
| 770.56 |
<1×10⁻⁶ | 56.06±20.65 | 7.46±4.99 |
| 773.54 |
<1×10⁻⁶ | 50.43±18.96 | 5.18±3.47 |
| 755.58 (SM) |
<1×10⁻⁶ | 14.11±5.83 | 6.11±3.92 |
| 753.60 (SM) |
<1×10⁻⁶ | 70.94±31.10 | 10.69±7.62 |
| 771.57 (SM) |
<1×10⁻⁶ | 27.07±10.97 | 6.23±2.62 |
| 783.79 (SM) |
<1×10⁻⁶ | 99.88±38.85 | 42.26±21.45 |
| 797.60 (SM) |
<1×10⁻⁶ | 17.00±6.60 | 10.27±3.59 |
| Table II.Lipid peaks with higher expression in
GBT samples compared TBT samples. |
Table II.
Lipid peaks with higher expression in
GBT samples compared TBT samples.
| Bio-marker
(m/z) | P-value | Expression in TBT
(mean ± SD) | Expression in GBT
(mean ± SD) |
|---|
| 758.60 |
<1×10⁻⁶ | 11.31±4.45 | 142.89±64.64 |
| 759.60 (SM) |
<1×10⁻⁶ | 6.84±5.15 | 62.44±30.06 |
| 786.64 |
<1×10⁻⁶ | 11.49±5 | 88.97±43.94 |
| 808.60 |
<1×10⁻⁶ | 11.79±4.41 | 26.3±13.68 |
| 616.17 |
<1×10⁻⁶ | 23.52±26.34 | 264.5±274.96 |
| 617.07 |
<1×10⁻⁶ | 15.61±17.58 | 189.39±211.06 |
| 618.17 |
<1×10⁻⁶ | 6.52±5.76 | 70.8±82.58 |
| 614.16 |
<1×10⁻⁶ | 3.6±2.9 | 23.38±25.52 |
| 678.47 |
<1×10⁻⁶ | 2.91±1.34 | 22.32±13.36 |
| 703.43 (SM) |
<1×10⁻⁶ | 2.50±1.00 | 40.01±28.42 |
| 729.45 (SM) |
<1×10⁻⁶ | 3.28±1.60 | 16.56±8.60 |
| 731.48 (SM) |
<1×10⁻⁶ | 18.51±15.14 | 85.24±45.36 |
| 741.54 (SM) |
<1×10⁻⁶ | 7.82±4.55 | 10.49±5.70 |
| 757.57 (SM) |
<1×10⁻⁶ | 12.39±4.88 | 19.34±7.93 |
| 781.59 (SM) |
<1×10⁻⁶ | 10.40±4.58 | 20.64±8.47 |
| 811.62 (SM) |
<1×10⁻⁶ | 13.46±6.05 | 21.62±11.03 |
The expression intensity of the lipid peaks of
798.57, 722.55, 799.56, 769.58 and 783.79 m/z was markedly
increased in the TBT samples compared with the GBT samples
(Table I). Taking the peak of 798.57
m/z as an example, its expression intensity in normal control TBT
samples was as high as 198.68, while its expression in GBT was
decreased to 14.34.
Among these lipid peaks, the 758.60, 786.64, 617.07,
703.43 and 731.48 m/z peaks exhibited markedly higher expression
intensity in GBT samples compared with TBT samples. Taking the peak
of 758.60 m/z as an example, its expression value in GBT was as
high as 142.89, while its expression in normal control TBT was
decreased to 11.31. Some of the differentially expressed lipid
peaks in Tables I and II have the potential to serve as clinical
diagnosis biomarkers for the detection and treatment of glioma.
Identification of lipid peaks
A total of 31 lipid peaks were detected using
MALDI-TOF-MS, and 14 of these lipid peaks were identified as
sphingomyelin (SM) using the second mass spectrum. These 14 peaks
are listed and marked in Tables I
and II with the label ‘SM’. The SM
peak with the m/z value of 769.58 had an intensity of 94.32 in TBT
and the SM peak with the m/z value of 753.60 had an intensity of
70.94 in TBT (Table I). Table III shows the structural data for
nine SM peaks.
| Table III.Structural data of various
sphingomyelin peaks. |
Table III.
Structural data of various
sphingomyelin peaks.
| Biomarker
(m/z) | Common name | Chemical
composition |
|---|
| 741.54 | SM(d18:1/16:0) | [C39H79N2O6P+K]
1+ |
| 755.58 | SM(d18:1/17:0) | [C40H81N2O6P+K]
1+ |
| 757.57 | SM(d18:0/17:0) | [C40H83N2O6P+K]
1+ |
| 769.58 | SM(d18:1/18:0) | [C41H83N2O6P+K]
1+ |
| 771.57 | SM(d18:0/18:0) | [C41H85N2O6P+K]
1+ |
| 797.60 | SM(d18:1/20:0) | [C43H87N2O6P+K]
1+ |
| 811.62 | SM(d16:1/23:0) | [C44H89N2O6P+K]
1+ |
| 783.79 | SM(d18:1/19:0) | [C42H85N2O6P+K]
1+ |
| 729.45 | SM(d18:0/15:0) | [C38H79N2O6P+K]
1+ |
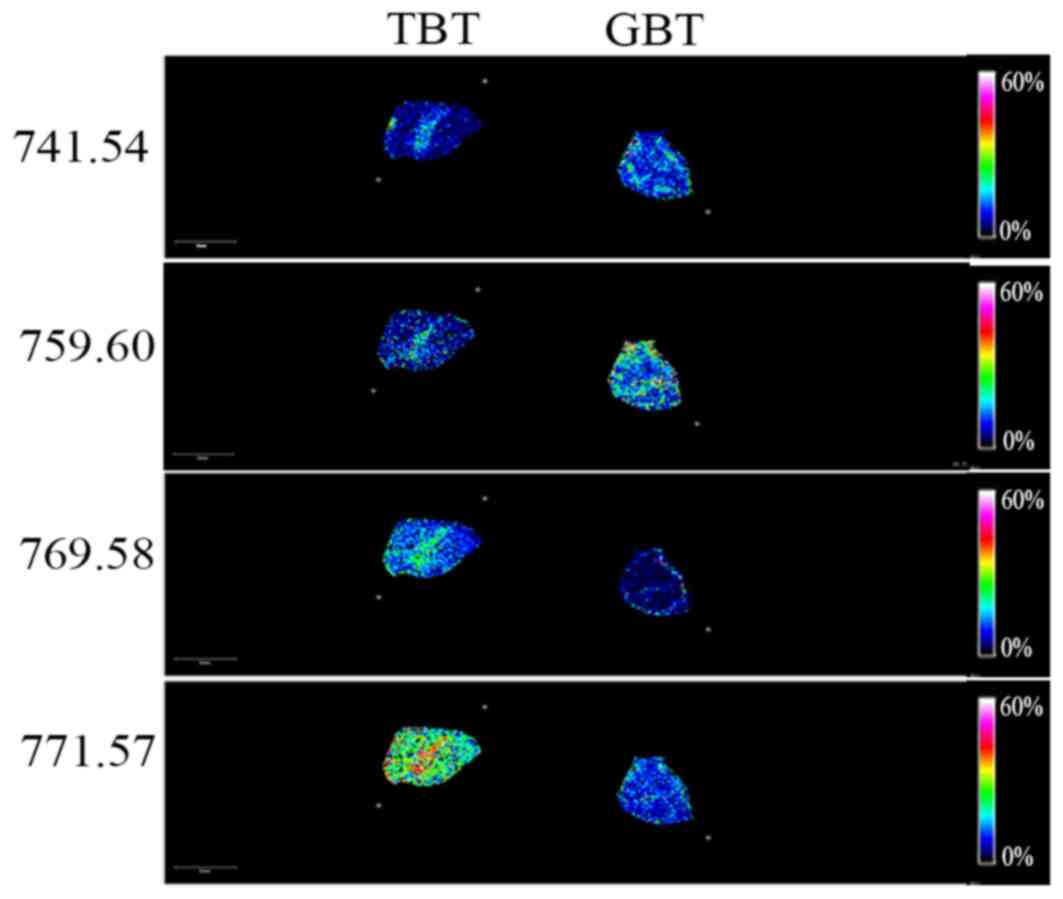
Verification of the expression of
lipid peaks with MALDI-imaging
A total of 14 peaks were identified as SM. Due to
the important role of SM in cell signal transduction, verification
of the expression of SM peaks with MALDI-imaging was performed.
Fig. 1 shows the MALDI-imaging
results of four SM peaks. The sample patterns on the left are the
MALDI-imaging results from TBT samples and the sample patterns on
the right are the MALDI-imaging results from GBT samples. The
expression intensities of the SM peaks with m/z values of 769.58,
771.57, 797.60, 783.79 and 753.60 were higher in the normal control
TBT samples compared with in the GBT samples. The expression
intensities of the SM peaks with m/z values of 741.54, 781.59,
759.60, 757.57, 731.48 and 703.43 were higher in GBT samples
compared with in normal control TBT samples. The results of the
MALDI-imaging experiments were consistent with the expression
intensity results from the MALDI-TOF-MS experiments.
Regulation and control of the
expression properties of insulin-like growth factor-1 receptor
(IGF-1R) and the PI3K/AKT pathway
Firstly, SM biomarkers, which were differentially
expressed between GBT and TBT samples, were identified.
Subsequently, the regulation of IGF-1R and the PI3K/AKT pathway by
ceramide were investigated. The regulatory effect of ceramide on
IGF-1R and the PI3K/Akt pathway was investigated using the glioma
cell line U373-MG.
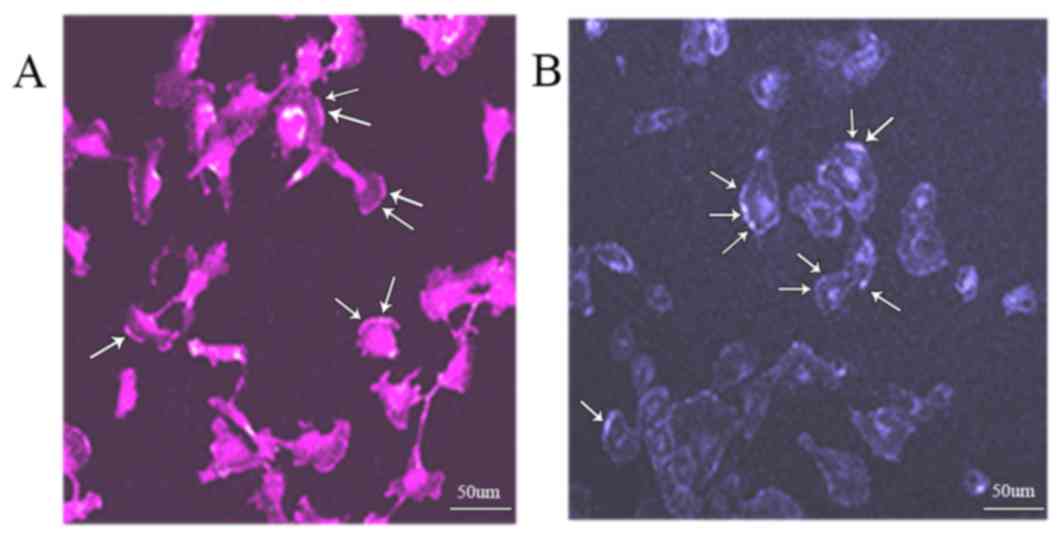
Distribution of ceramide and IGF-1R on
the cell membrane
The distribution characteristics of ceramide and
IGF-1R on the cell membrane were observed by immunostaining.
Fig. 2A shows the distribution of
ceramide, as revealed by immunostaining. It was identified that
ceramide was made up of lipid rafts, and large quantities of
ceramide aggregated to form an areatus-like distribution. Fig. 2B shows the live staining pattern of
IGF-1R relative to ceramide. It was revealed that IGF-1R formed an
areatus-like distribution that was similar to the distribution of
ceramide.
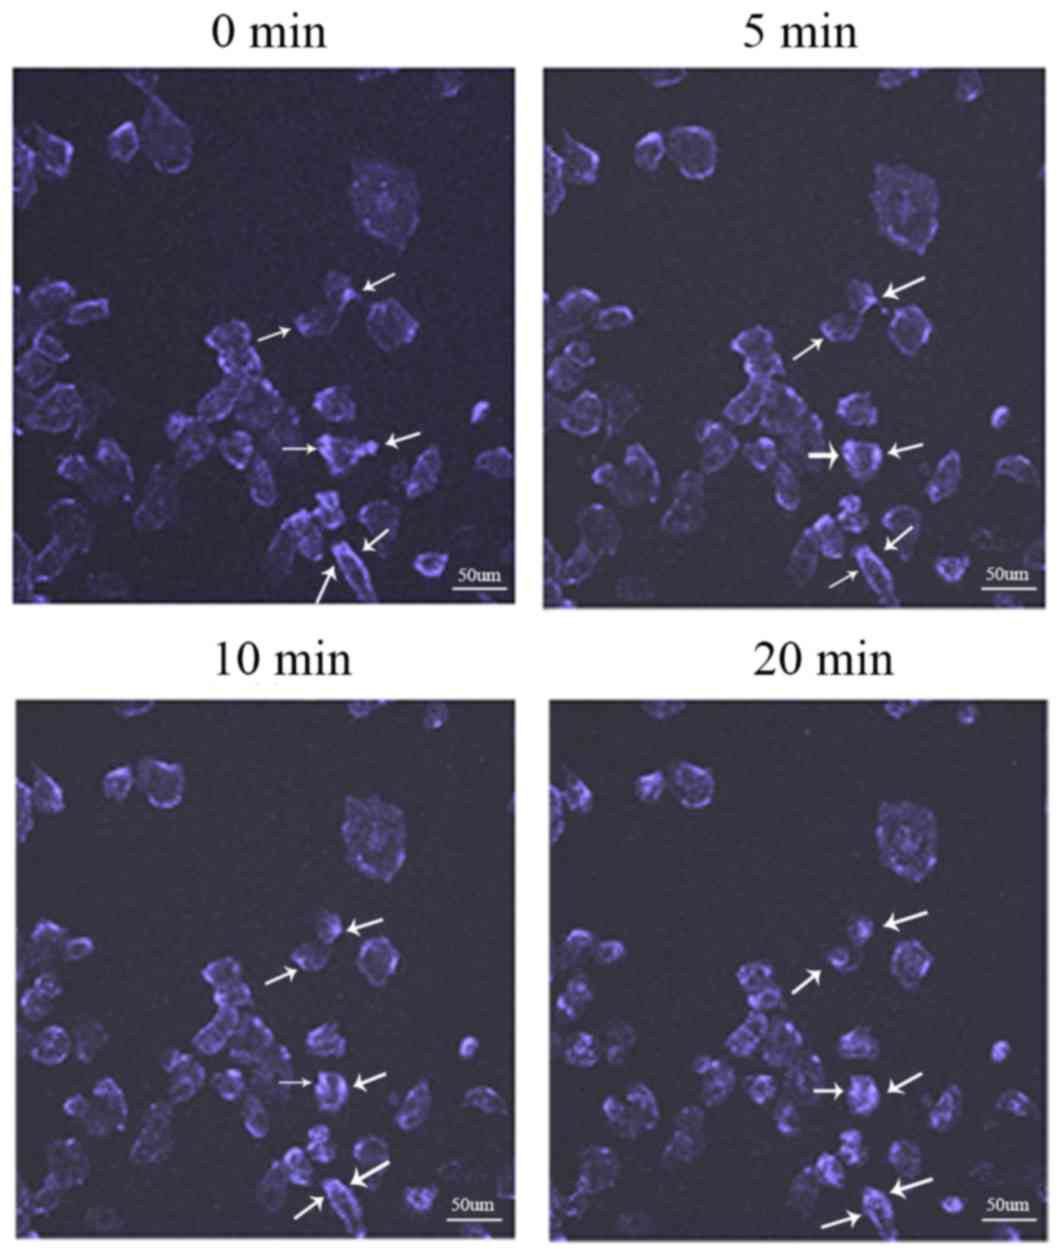
Observation of the movement of IGF-1R
with live staining technology
The movement of IGF-1R, a ceramide receptor
(19), on the cell membrane was
recorded with live staining technology. Fig. 3 illustrates the movement of IGF-1R,
as visualized with live cell staining technology. The cell dish was
placed into a CO2 incubator and observed via confocal
microscopy at 37°C with 5% CO2. The recording times were
0, 5, 10 and 20 min. At 0 min, IGF-1R fluorescence was observed on
the cell membrane, whereas IGF-1R fluorescence in the inner area of
some cells was not clear. As the recording time increased, the
IGF-1R fluorescence in the inner area of cells increased. When the
recording time reached 20 min, the inner area of numerous cells
presented high fluorescence intensity. IGF-1R fluorescence was
indicated with arrows in Fig. 3.
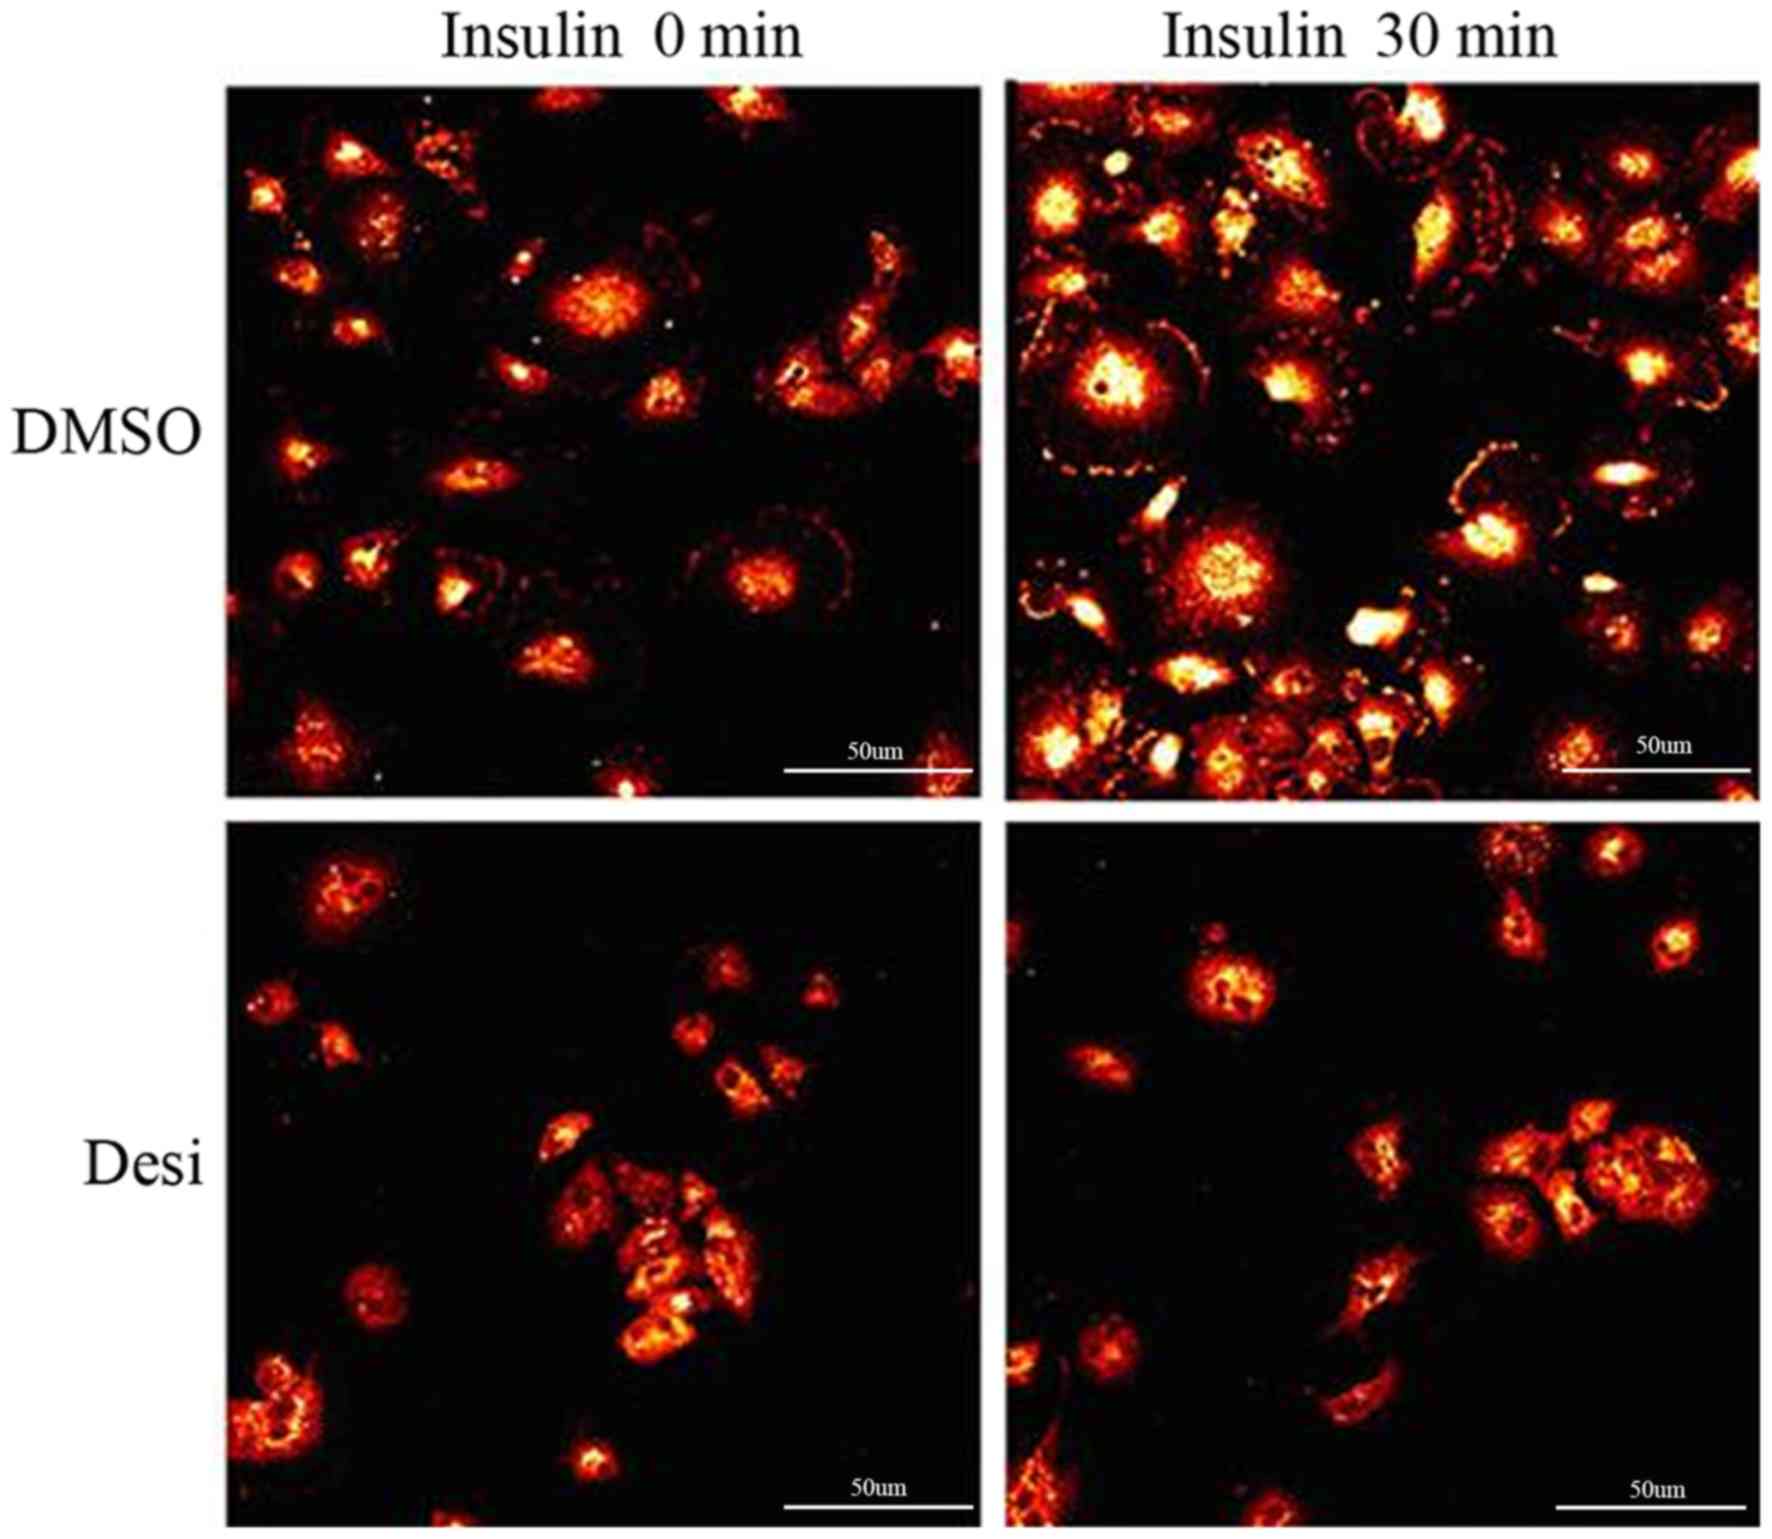
Regulation of the expression of
IGF-1R
Data from Fig. 4
indicated that the expression level of phosphorylated IGF-1R was
markedly stimulated by insulin when the glioma cell line U373-MG
was treated with DMSO as a control. Compared with the fluorescence
intensity at 0 min in the DMSO group and the fluorescence intensity
at 0 min in the Desi group, the expression level of phosphorylated
IGF-1R was significantly decreased when U373-MG cells were treated
with Desi. In the DMSO group, the fluorescence intensity of
phosphorylated IGF-1R was higher when the cells were stimulated
with insulin for 30 min. In the Desi group, the fluorescence
intensity of phosphorylated IGF-1R was not markedly increased when
cells were further stimulated with insulin for 30 min.
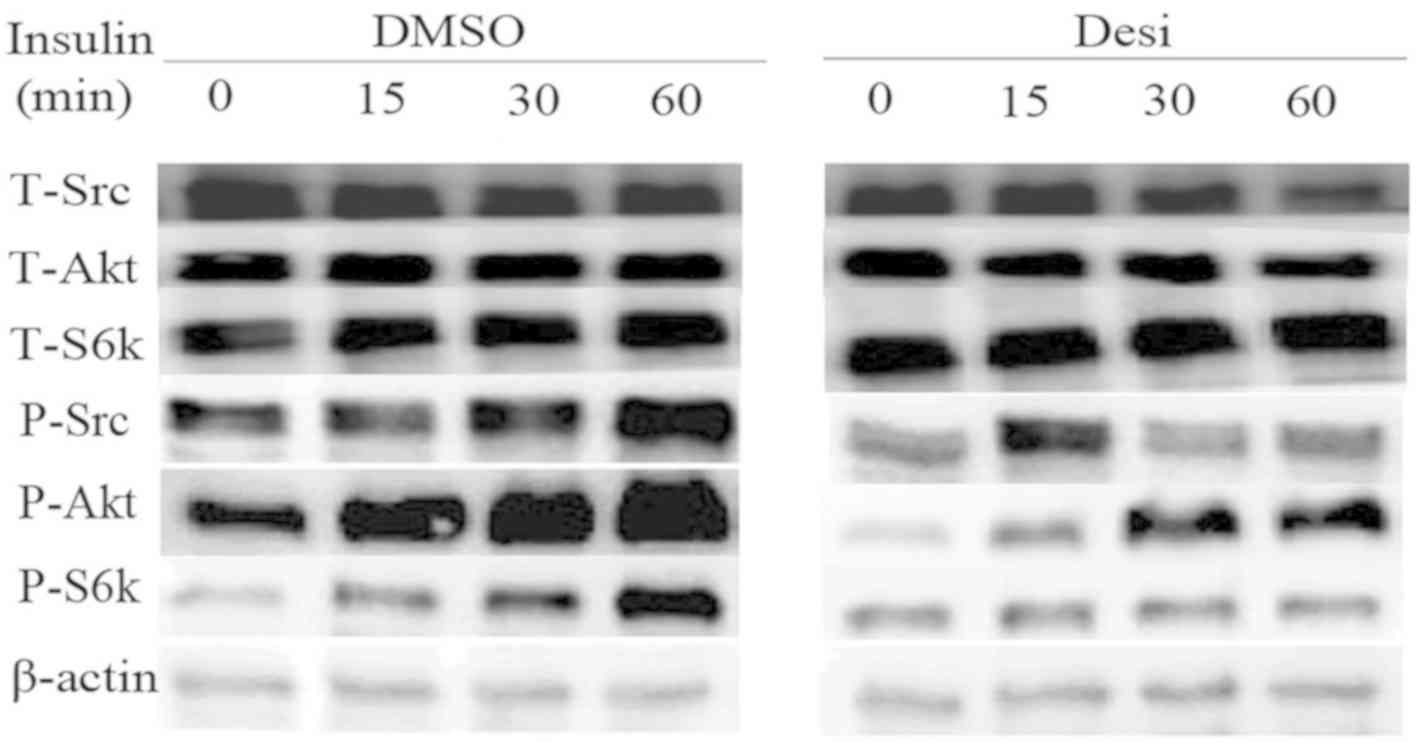
Regulation of the PI3K/Akt
pathway
Results on the PI3K/Akt pathway regulation are
presented in Fig. 5. The expression
intensity of phosphorylated-(P-)Akt, P-SRC proto-oncogene
non-receptor tyrosine kinase (Src) and P-ribosomal protein S6
kinase B1 (S6k) in DMSO group increased gradually with increasing
time of treatment with insulin. Furthermore, the influence of
insulin in Desi group was weakened by the application of Desi.
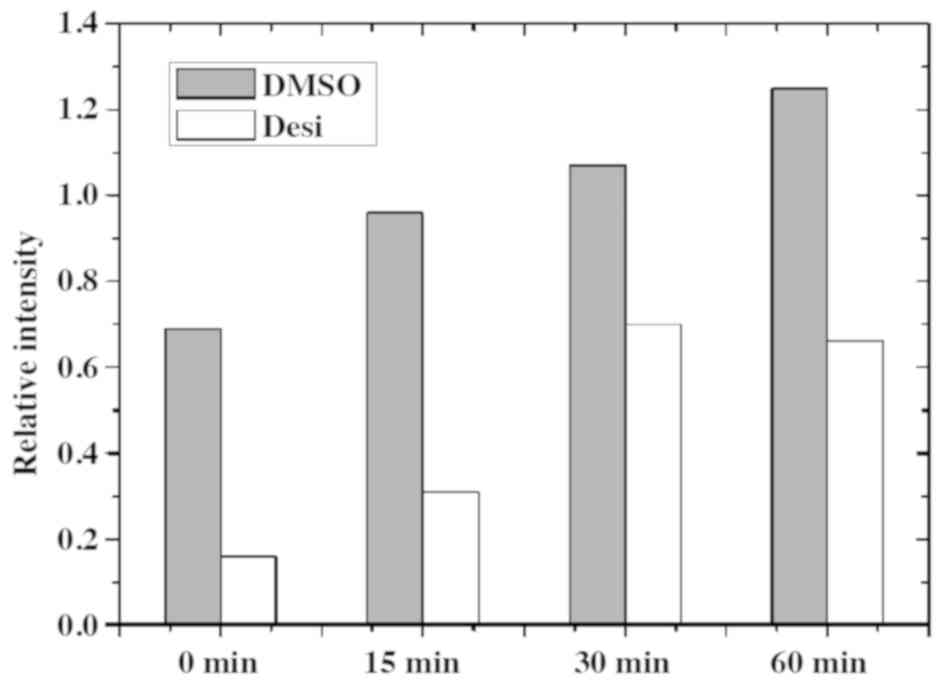
Taking the P-Akt as an example, its quantitative result is shown in
Fig. 6. The relative intensity of
P-Akt in group DMSO at 0 min is 0.70, while that in group Desi
decreases to 0.16. Furthermore, the relative intensity of P-Akt in
group Desi are less than that in group DMSO at 15, 30 and 60
min.
Discussion
In the present study, MALDI-imaging and MALDI-TOF-MS
were used to investigate the differences in the expression levels
of lipid biomarkers in GBT and TBT samples. A total of 31 lipid
peaks with differential expression properties were detected in the
GBT and TBT samples. A total of 15 lipid peaks exhibited higher
expression intensity in TBT compared with GBT samples. Furthermore,
14 lipid peaks were identified as sphingomyelin peaks. As
previously reported, sphingomyelin can be hydrolyzed into ceramide
via acid sphingomyelinase (ASM) (20,21). The
results demonstrated that ceramide and IGF-1R had similar membrane
distribution. The live cell staining results indicated that IGF-1R
slowly entered the cell from the cell membrane, resulting in
increased IGF-1R fluorescence in the inner area of cell. These
results were in accordance with a previous study that reported that
ceramide can bind to IGF-1R and is involved in cell signal
transduction (22). The drug Desi
was able to inhibit the accumulation of ceramide on the cell
membrane. Insulin was able to stimulate IGF-1R expression, although
IGF-1R expression was inhibited by treatment with Desi. Similar
results were also observed for the expression levels of proteins
P-Src, P-Akt and P-S6k from the PI3K/Akt signaling pathway.
Previous studies reported that the dysregulation of the IGF-1R
signaling pathway results in the development of malignant gliomas
(19,23,24). In
addition, glioma cell senescence and apoptosis can be influenced by
the activity of the PI3K/Akt signaling pathway (25,26).
Due to the difficulty of obtaining brain tissues,
only three GBT samples and three normal control TBT samples were
collected and used in the present study. For MALDI-imaging, it is
advantageous to obtain cancer tissues and normal tissues from the
same individual; however, it is difficult to perform experiments on
glioma tissue and normal brain tissue from the same person.
Therefore, the brain tissues for glioma research were usually
collected from different individuals (27–29). The
results of the present study were based on a limited sample size,
and the findings would be more valuable and reliable if they were
based on a larger sample size. These first-stage results may serve
as the research foundation for further studies. There are several
topics requiring further investigation, including how the opposite
alterations in the same type of lipid biomarkers may be used to
form a diagnostic pattern for patients with glioma. Additionally,
it should be investigated how to predict the functional effect of
these differentially expressed lipid biomarkers between GBT and
normal TBT by pathway enrichment analysis. In the future, these
issues will be addressed in a study with a larger sample size.
In conclusion, the present study demonstrated that
sphingomyelin peaks may be identified as biomarkers in GBT samples
compared with normal control TBT samples. Furthermore, insulin
could stimulate the high expression of ceramide and of P-Akt from
the PI3K/Akt signaling pathway. However, Desi inhibited the
increase in ceramide and P-Akt expression. Future study will
investigate the association between these sphingomyelins and the
survival rate of patients with glioma, and the expression intensity
variation of these sphingomyelin along with the clinical treatment
process of patients with glioma.
Acknowledgements
The authors would like to thank Dr Zuogang Guo
(China Southern Power Grid Company Limited) for critically
evaluating this manuscript and technical assistance.
Funding
This work was supported by the National Natural
Science Foundation of China (grant no. 30901731) and the Natural
Science Foundation of Guangdong Province (grant no.
2016A030310187).
Availability of data and materials
The datasets used and/or analyzed during the present
study are available from the corresponding author on reasonable
request.
Authors' contributions
XZ collected the samples and performed the study. JX
participated in the data analysis and manuscript preparation. JY
provided support in experimental design and manuscript preparation.
HS and SZ contributed to the conception and design of this research
plan. HS and SZ also participated in the research data discussion,
and critically revised this manuscript. All authors read and
approved the manuscript.
Ethics approval and consent to
participate
The study protocol was approved by the Ethics
Committee of The First Affiliated Hospital of Zhejiang University
and The Second Affiliated Hospital of Zhejiang University. Written
informed consent was obtained from participants for the use of
their tissues in the present study.
Patient consent for publication
Not applicable
Competing interests
The authors declare that they have no competing
interests.
References
|
1
|
Schwartzbaum JA, Fisher JL, Aldape KD and
Wrensch M: Epidemiology and molecular pathology of glioma. Nat Clin
Pract Neurol. 2:494–503. 2006. View Article : Google Scholar : PubMed/NCBI
|
|
2
|
Ohashi R, Matsuda Y, Ishiwata T and Naito
Z: Downregulation of fibroblast growth factor receptor 2 and its
isoforms correlates with a high proliferation rate and poor
prognosis in high-grade glioma. Oncol Rep. 32:1163–1169. 2014.
View Article : Google Scholar : PubMed/NCBI
|
|
3
|
Buczkowicz P, Bartels U, Bouffet E, Becher
O and Hawkins C: Histopathological spectrum of paediatric diffuse
intrinsic pontine glioma: Diagnostic and therapeutic implications.
Acta Neuropathol. 128:573–581. 2014. View Article : Google Scholar : PubMed/NCBI
|
|
4
|
Miller JJ and Wen PY: Emerging targeted
therapies for glioma. Expert Opin Emerg Drugs. 21:441–452. 2016.
View Article : Google Scholar : PubMed/NCBI
|
|
5
|
Yun DP, Wang YQ, Meng DL, Ji YY, Chen JX,
Chen HY and Lu DR: Actin-capping protein CapG is associated with
prognosis, proliferation and metastasis in human glioma. Oncol Rep.
39:1011–1022. 2018.PubMed/NCBI
|
|
6
|
Suh CH, Kim HS, Jung SC, Choi CG and Kim
SJ: Perfusion MRI as a diagnostic biomarker for differentiating
glioma from brain metastasis: A systematic review and
meta-analysis. Eur Radiol. 28:3819–3831. 2018. View Article : Google Scholar : PubMed/NCBI
|
|
7
|
Su L, Yang K, Li S, Liu C, Han J, Zhang Y
and Xu G: Enolase-phosphatase 1 as a novel potential malignant
glioma indicator promotes cell proliferation and migration. Oncol
Rep. 40:2233–2241. 2018.PubMed/NCBI
|
|
8
|
Li J, Xu L, Bao Z, Xu P, Chang H, Wu J,
Bei Y, Xia L, Wu P and Cui G: High expression of PIWIL2 promotes
tumor cell proliferation, migration and predicts a poor prognosis
in glioma. Oncol Rep. 38:183–192. 2017. View Article : Google Scholar : PubMed/NCBI
|
|
9
|
Zhou L, Wang Y, Zhang YT, Geng YP, Si LS
and Wang YL: Proteomics-based analysis of a pair of glioma cell
lines with different tumor forming characteristics. Neurosci Lett.
401:59–64. 2006. View Article : Google Scholar : PubMed/NCBI
|
|
10
|
Tan J, Liu M, Zhang JY, Yao YL, Wang YX,
Lin Y, Song K, Tan J, Wu JR, Cui YH, et al: Capillary morphogenesis
protein 2 is a novel prognostic biomarker and plays oncogenic roles
in glioma. J Pathol. 245:160–171. 2018. View Article : Google Scholar : PubMed/NCBI
|
|
11
|
Hayashi T, Hayakawa Y, Koh M, Tomita T,
Nagai S, Kashiwazaki D, Sugimori M, Origasa H and Kuroda S: Impact
of a novel biomarker, T-LAK cell-originating protein kinase (TOPK)
expression on outcome in malignant glioma. Neuropathology.
38:144–153. 2018. View Article : Google Scholar : PubMed/NCBI
|
|
12
|
Ribom D, Westman-Brinkmalm A, Smits A and
Davidsson P: Elevated levels of alpha-2-Heremans-Schmid
glycoprotein in CSF of patients with low-grade gliomas. Tumour
Biol. 24:94–99. 2003. View Article : Google Scholar : PubMed/NCBI
|
|
13
|
Iwadate Y, Sakaida T, Hiwasa T, Nagai Y,
Ishikur H, Takiguchi M and Yamaura A: Molecular classification and
survival prediction in human gliomas based on proteome analysis.
Cancer Res. 64:2496–2501. 2004. View Article : Google Scholar : PubMed/NCBI
|
|
14
|
Schwartz M, Meyer B, Wirnitzer B and Hopf
C: Standardized processing of MALDI imaging raw data for
enhancement of weak analyte signals in mouse models of gastric
cancer and Alzheimer's disease. Anal Bioanal Chem. 407:2255–2264.
2015. View Article : Google Scholar : PubMed/NCBI
|
|
15
|
Wildburger NC, Wood PL, Gumin J, Lichti
CF, Emmett MR, Lang FF and Nilsson CL: ESI-MS/MS and MALDI–IMS
localization reveal alterations in phosphatidic acid,
diacylglycerol, and DHA in glioma stem cell xenografts. J Proteome
Res. 14:2511–2519. 2015. View Article : Google Scholar : PubMed/NCBI
|
|
16
|
Eberlin LS, Liu X, Ferreira CR, Santagata
S, Agar NY and Cooks RG: Desorption electrospray ionization then
MALDI mass spectrometry imaging of lipid and protein distributions
in single tissue sections. Anal Chem. 83:8366–8371. 2011.
View Article : Google Scholar : PubMed/NCBI
|
|
17
|
Shrivas K, Hayasaka T, Goto-Inoue N,
Sugiura Y, Zaima N and Setou M: Ionic matrix for enhanced MALDI
imaging mass spectrometry for identification of phospholipids in
mouse liver and cerebellum tissue sections. Anal Chem.
82:8800–8806. 2010. View Article : Google Scholar : PubMed/NCBI
|
|
18
|
Wishart DS, Feunang YD, Marcu A, Guo AC,
Liang K, Vázquez-Fresno R, Sajed T, Johnson D, Li C, Karu N, et al:
HMDB 4.0: The human metabolome database for 2018. Nucleic Acids
Res. 46:D608–D617. 2018. View Article : Google Scholar : PubMed/NCBI
|
|
19
|
Lian HW, Zhou Y, Jian ZH and Liu RZ:
MiR-323-5p acts as a tumor suppressor by targeting the insulin-like
growth factor 1 receptor in human glioma cells. Asian Pac J Cancer
Prev. 15:10181–10185. 2014. View Article : Google Scholar : PubMed/NCBI
|
|
20
|
Lin M, Liao W, Dong M, Zhu R, Xiao J, Sun
T, Chen Z, Wu B and Jin J: Exosomal neutral sphingomyelinase 1
suppresses hepatocellular carcinoma via decreasing the ratio of
sphingomyelin/ceramide. FEBS J. 285:3835–3848. 2018. View Article : Google Scholar : PubMed/NCBI
|
|
21
|
Catapano ER, Natale P, Monroy F and
López-Montero I: The enzymatic sphingomyelin to ceramide conversion
increases the shear membrane viscosity at the air-water interface.
Adv Colloid Interface Sci. 247:555–560. 2017. View Article : Google Scholar : PubMed/NCBI
|
|
22
|
Gao X, Lowry PR, Zhou X, Depry C, Wei Z,
Wong GW and Zhang J: PI3K/Akt signaling requires spatial
compartmentalization in plasma membrane microdomains. Proc Natl
Acad Sci USA. 108:14509–14514. 2011. View Article : Google Scholar : PubMed/NCBI
|
|
23
|
Zhou Q, Zhang J, Cui Q, Li X, Gao G, Wang
Y, Xu Y and Gao X: GSK1904529A, an insulin-like growth factor-1
receptor inhibitor, inhibits glioma tumor growth, induces apoptosis
and inhibits migration. Mol Med Rep. 12:3381–3385. 2015. View Article : Google Scholar : PubMed/NCBI
|
|
24
|
Arun S, Ravisankar S and Vanisree AJ:
Implication of connexin30 on the stemness of glioma: Connexin30
reverses the malignant phenotype of glioma by modulating IGF-1R,
CD133 and cMyc. J Neurooncol. 135:473–485. 2017. View Article : Google Scholar : PubMed/NCBI
|
|
25
|
Liao YX, Zhang ZP, Zhao J and Liu JP:
Effects of fibronectin 1 on cell proliferation, senescence and
apoptosis of human glioma cells through the PI3K/Akt signaling
pathway. Cell Physiol Biochem. 48:1382–1396. 2018. View Article : Google Scholar : PubMed/NCBI
|
|
26
|
Nicoletti NF, Erig TC, Zanin RF, Pereira
TC, Bogo MR, Campos MM and Morrone FB: Mechanisms involved in
kinin-induced glioma cells proliferation: The role of ERK1/2 and
PI3K/Akt pathways. J Neurooncol. 120:235–244. 2014. View Article : Google Scholar : PubMed/NCBI
|
|
27
|
Scheidegger R, Wong ET and Alsop DC:
Contributors to contrast between glioma and brain tissue in
chemical exchange saturation transfer sensitive imaging at 3 Tesla.
Neuroimage. 99:256–268. 2014. View Article : Google Scholar : PubMed/NCBI
|
|
28
|
Zhang J, Fan Y, He M, Ma X, Song Y, Liu M
and Xu J: Accuracy of Raman spectroscopy in differentiating brain
tumor from normal brain tissue. Oncotarget. 8:36824–36831.
2017.PubMed/NCBI
|
|
29
|
Krafft C, Sobottka SB, Schackert G and
Salzer R: Analysis of human brain tissue, brain tumors and tumor
cells by infrared spectroscopic mapping. Analyst. 129:921–925.
2004. View
Article : Google Scholar : PubMed/NCBI
|