Introduction
Glioma is a type of primary central nervous system
(CNS) solid tumor that arises from glial cells and is aggressive
and lethal (1). It comprises ~30% of
all CNS tumors and 80% of all malignant brain tumors (2). According to the 2016 World Health
Organization (WHO) guidelines, gliomas can be classified into
grades I–IV depending on ‘integrated diagnosis’, combining
histopathological and molecular features (3). The most malignant type is grade IV
glioblastoma (GBM), the overall survival (OS) time of which is only
~14 months (4). Lower grade glioma
(LGG; grades II and III) exhibits benign tendencies and leads to a
favorable prognosis for patients (5). However, it has a high rate of
recurrence and increases in grade over time (6). Currently, the common treatment
strategies for the treatment of glioma involve surgical resection,
after which adjuvant chemotherapy and/or radiotherapy are used;
however, the clinical outcomes of glioma remain unsatisfactory. The
pathogenesis of glioma involves multiple factors and steps,
comprising genetic and epigenetic alterations. Despite a number of
mechanisms of oncogenesis have been verified in glioma, including
retinoblastoma, p53 and receptor tyrosine kinase signaling
pathways, the genetic factors and precise mechanism of human glioma
remain poorly understood (7).
Therefore, vital molecular biomarkers and oncogenic pathways
associated with accurate diagnosis and patient survival in glioma
require further identification.
Aberrant CpG island methylation is a primary
epigenetic modified form of DNA sequence in malignancy (8). The functions of key genes can be
altered through methylation to modify their expression, including
hypermethylation of tumor suppressor genes (TSGs) and
hypomethylation of oncogenes (9,10). The
methylation status of multiple TSGs may serve as a biomarker for
the early diagnosis and prediction of prognosis (11). For example, promoter
methylation-induced silencing of the O6-methylguanine-DNA
methyltransferase DNA-repair gene has been demonstrated to be a
powerful predictor of the sensitivity of alkylating chemotherapy in
patients with glioma with long survival rates (12). The methylation level of death
associated protein kinase 1 is associated with clinical features
and outcomes of glioma; hypermethylation at site-1,527 or together
with site-1,543 indicates good sensitivity to postoperative
therapies, particularly radiotherapy (13). A number of TSGs associated with cell
cycle, proliferation and DNA repair have been identified in glioma,
including cyclin dependent kinase inhibitor 2A (CDKN2A, also
known as P16INK4a, P14ARF), TNF
receptor superfamily member 11a (TNFRSF11A) and nuclear
receptor binding SET domain protein 1 (NSD1) (14–17).
Therefore, identifying differentially methylated genes (DMGs) by
comparing the differences in DNA methylation status of glioma with
that of normal brain tissue is crucial for elucidating the
development, progression and metastasis of glioma and may be used
as a guide for targeting drugs for glioma.
At present, microarray analysis based on
high-throughput platforms is an efficient tool that has been
applied to screen virtual genetic or epigenetic alterations in
carcinogenesis, and to identify biomarkers for the diagnosis and
prognosis of cancer (18). In the
present study, DMGs were examined in glioma by online
bioinformatics resources. The expression profile of GSE28094 from
the Gene Expression Omnibus (GEO) database was downloaded to
identify the DMGs between glioma and normal brain tissue.
Subsequently, hierarchical clustering and functional enrichment
analyses of the Gene Ontology (GO) and Kyoto Encyclopedia of Genes
and Genomes (KEGG) pathways by Database for Annotation
Visualization and Integrated Discovery (DAVID) for the DMGs were
performed. A protein-protein interaction (PPI) network of DMGs was
constructed and the main hub genes with high degree of connectivity
were examined by Search Tool for the Retrieval of Interacting Genes
(STRING), and the results were further validated by The Cancer
Genome Atlas (TCGA) data to identify DMGs in the expression of
glioma. This study provided comprehensive biological information
for DMGs and novel targets for the diagnosis and accurate treatment
of glioma.
Materials and methods
Microarray data
To identify DMGs between glioma and normal brain
tissue, the GSE28094 gene expression microarray, contributed by
Fernandez et al (19), was
downloaded from the GEO database (https://www.ncbi.nlm.nih.gov/gds/) of the National
Center for Biotechnology Information, a public functional genomics
data repository. GSE28094 was based on the GPL9183 platform
(Illumina GoldenGate Methylation Cancer Panel I). For the present
study, 90 gliomas and 6 normal brain tissues were collected from
GSE28094.
Data processing of DMGs
GEO2R (https://www.ncbi.nlm.nih.gov/geo/geo2r/) online
software was used to analyze GSE28094 and detect DMGs between
gliomas and normal brain tissues. GEO2R is an interactive online
tool in which ≥2 groups of samples can be compared in a GEO series
to display differentially expressed genes under specific
experimental conditions (20). The
adjusted P-values were used to decrease the false positive rate
using the Benjamini and Hochberg false discovery rate method.
Adjusted P<0.05 and |t|>2 were used as the cut-off values for
detecting DMGs. Finally, 349 DMGs were obtained, including 167
upregulated and 182 downregulated genes.
GO and KEGG pathway analyses of
DMGs
GO analysis served as a crucial tool to annotate
genes and gene products and to identify characteristic biological
functions using high-throughput genome or transcriptome data
(21), including biological process
(BP), cellular component (CC) and molecular function (MF). KEGG is
a collection of databases that can help to annotate genomes,
biological pathways, diseases, chemical substances and drugs
(22). DAVID (version 6.8;
http://david.ncifcrf.gov/) was used to
perform KEGG pathway enrichment analysis for the selected DMGs.
P<0.05 was considered to indicate a statistically significant
difference.
PPI network and module analysis
PPI analysis was performed to illustrate the
interactions and functions of the selected DMGs via STRING (version
11.0; http://string-db.org). Cytoscape is a
vital workflow component for executing network visualization,
analysis and publishing tasks (23).
To illustrate the potential interactions among those DMGs, STRING
in Cytoscape (version 3.6.0) was applied and the DMGs were mapped
into STRING. A confidence score ≥0.4 and a maximum number of
interactors=0 were set as the cut-off criterion. Molecular complex
detection (MCODE, version 1.5.1) is a method to analyze densely
connected regions in PPI networks (24). This method was used to screen modules
of the PPI network in Cytoscape with a degree cut-off=2, node score
cut-off=0.2, k-core=2 and maximum depth=100. The pathway analysis
of genes in these modules was also performed by DAVID. In addition,
the top 20 hub genes with a high degree of connectivity were
inserted into STRING with a confidence score of ≥0.4 and a maximum
number of interactors=0. GO and KEGG pathway analyses were also
used to examine the potential interactions.
TCGA data validation of the hub
DMGs
In view of the small sample size of this study,
further validation analysis was performed to verify the results of
TCGA data. GEPIA (http://gepia.cancer-pku.cn/index.html) is a publicly
available interactive web server that can analyze the RNA
sequencing expression data of 9,736 tumors and 8,587 normal samples
from TCGA and GTEx projects by a standard processing pipeline
(25). It supports customizable
functions, including tumor and normal tissue differential
expression analyses, and information can be obtained on the
expression level of hub DMGs in glioma and normal brain tissue.
Boxplots were displayed to visualize the association. By acquiring
pathologically confirmed immunohistochemical data of glioma and
normal brain tissue based on the Human Protein Atlas (HPA;
http://www.proteinatlas.org/), the
expression of these hub DMGs was further validated. Hub DMGs in
glioma were identified using HPA. From the extensive sample
collection of antibodies against the DMGs, the sample with the
strongest intensity and quantity was selected. The normal brain
tissue stained for caspase 3 (CASP3) expression was from a
female patient (age, 45 years; patient ID, 1539; staining, not
detected; intensity, negative; quantity, negative; location, none),
and the glioma tissue was from a male patient (age, 56 years;
patient ID, 131; staining, medium; intensity, moderate; quantity,
75–25%; location, nuclear). The normal brain tissue stained for
erb-b2 receptor tyrosine kinase 2 (ERBB2) expression was
from a female patient (age, 54 years; patient ID, 2523; staining,
not detected; intensity, negative; quantity, negative; location,
none), and the glioma tissue was from a male patient (age, 66
years; patient ID, 206; staining, high; intensity, strong;
quantity, >75%; location, cytoplasmic/membranous).
Survival analysis of hub genes
GEPIA was used to further investigate the
relapse-free survival and OS time data of the DMGs by Kaplan-Meier
survival curves. The hazard ratio (HR) with 95% confidence
intervals and log-rank P-value were calculated and indicated in the
plot. Log-rank P<0.05 was considered to indicate a statistically
significant difference in the survival curve.
Results
Identification of DMGs in glioma
After the analysis of GSE28094, a total of 349 DMGs
were obtained between glioma and normal brain tissue, including 167
upregulated (hypermethylated) and 182 downregulated
(hypomethylated) genes (Table
SI).
GO functional enrichment analysis
In order to further understand the underlying
mechanism of these DMGs in glioma, all DMGs were imported to the
DAVID software. GO function results showed that upregulated DMGs
were particularly enriched in BP, including positive and negative
regulation of ‘cell proliferation’, ‘positive regulation of
transcription from RNA polymerase II promoter’, ‘protein
autophosphorylation’ and ‘regulation of apoptosis’ (Table I). As for CC, the DMGs were enriched
in ‘cytoplasm’, ‘plasma membrane’, ‘nucleoplasm’, ‘perinuclear
region of cytoplasm’ and ‘extracellular region’ (Table I). In addition, MF was enriched
predominantly in ‘protein binding’, ‘transcription factor binding’,
‘protein heterodimerization activity’, ‘receptor binding’ and ‘ATP
binding’ (Table I).
 | Table I.GO analysis of differentially
methylated genes associated with glioma. |
Table I.
GO analysis of differentially
methylated genes associated with glioma.
| A,
Hypermethylation |
|---|
|
|---|
| GO analysis | Term | Count | % | P-value |
|---|
|
GOTERM_BP_DIRECT | GO:0008285~negative
regulation of cell proliferation | 23 | 14.7436 |
1.43×10⁻¹¹ |
|
GOTERM_BP_DIRECT | GO:0008284~positive
regulation of cell proliferation | 24 | 15.3846 |
5.14×10⁻¹¹ |
|
GOTERM_BP_DIRECT | GO:0045944~positive
regulation of transcription from RNA polymerase II promoter | 34 | 21.7949 |
6.75×10⁻¹¹ |
|
GOTERM_BP_DIRECT | GO:0046777~protein
autophosphorylation | 15 | 9.6154 |
6.80×10⁻¹⁰ |
|
GOTERM_BP_DIRECT |
GO:0042981~regulation of apoptotic
process | 16 | 10.2564 |
1.23×10⁻⁹ |
|
GOTERM_CC_DIRECT |
GO:0005737~cytoplasm | 79 | 50.6410 |
6.58×10⁻⁹ |
|
GOTERM_CC_DIRECT | GO:0005886~plasma
membrane | 61 | 39.1026 |
3.46×10⁻⁶ |
|
GOTERM_CC_DIRECT |
GO:0005654~nucleoplasm | 45 | 28.8462 |
1.77×10⁻⁵ |
|
GOTERM_CC_DIRECT |
GO:0048471~perinuclear region of
cytoplasm | 18 | 11.5385 |
2.05×10⁻⁵ |
|
GOTERM_CC_DIRECT |
GO:0005576~extracellular region | 30 | 19.2308 |
7.41×10⁻⁵ |
|
GOTERM_MF_DIRECT | GO:0005515~protein
binding | 121 | 77.5641 |
4.77×10⁻¹² |
|
GOTERM_MF_DIRECT |
GO:0008134~transcription factor
binding | 16 | 10.2564 |
4.30×10⁻⁸ |
|
GOTERM_MF_DIRECT | GO:0046982~protein
heterodimerization activity | 18 | 11.5385 |
1.01×10⁻⁶ |
|
GOTERM_MF_DIRECT | GO:0005102~receptor
binding | 15 | 9.6154 |
3.80×10⁻⁶ |
|
GOTERM_MF_DIRECT | GO:0005524~ATP
binding | 32 | 20.5128 |
8.54×10⁻⁶ |
|
| B,
Hypomethylation |
|
| GO
analysis | Term | Count | % | P-value |
|
|
GOTERM_BP_DIRECT | GO:0006955~immune
response | 32 | 18.4971 |
1.89×10⁻¹⁸ |
|
GOTERM_BP_DIRECT | GO:0071222~cellular
response to lipopolysaccharide | 15 | 8.6705 |
6.78×10⁻¹² |
|
GOTERM_BP_DIRECT |
GO:0018108~peptidyl-tyrosine
phosphorylation | 16 | 9.2486 |
3.60×10⁻¹¹ |
|
GOTERM_BP_DIRECT |
GO:0006954~inflammatory response | 22 | 12.7168 |
2.12×10⁻¹⁰ |
|
GOTERM_BP_DIRECT |
GO:0022617~extracellular matrix
disassembly | 10 | 5.7804 |
6.50×10⁻⁸ |
|
GOTERM_CC_DIRECT |
GO:0005615~extracellular space | 56 | 32.3699 |
3.22×10⁻²² |
|
GOTERM_CC_DIRECT |
GO:0005576~extracellular region | 55 | 31.7919 |
6.24×10⁻¹⁸ |
|
GOTERM_CC_DIRECT | GO:0009986~cell
surface | 22 | 12.7168 |
2.62×10⁻⁸ |
|
GOTERM_CC_DIRECT | GO:0005887~integral
component of plasma membrane | 35 | 20.2312 |
1.66×10⁻⁷ |
|
GOTERM_CC_DIRECT | GO:0005886~plasma
membrane | 67 | 38.7283 |
6.33×10⁻⁷ |
|
GOTERM_MF_DIRECT | GO:0005125~cytokine
activity | 20 | 11.5607 |
1.17×10⁻¹⁴ |
|
GOTERM_MF_DIRECT | GO:0004713~protein
tyrosine kinase activity | 17 | 9.8266 |
2.94×10⁻¹³ |
|
GOTERM_MF_DIRECT | GO:0008083~growth
factor activity | 15 | 8.6705 |
8.36×10⁻¹⁰ |
|
GOTERM_MF_DIRECT |
GO:0046934~phosphatidylinositol-4,5-bisphosphate
3-kinase activity | 9 | 5.2023 |
1.74×10⁻⁷ |
|
GOTERM_MF_DIRECT |
GO:0004715~non-membrane spanning protein
tyrosine kinase activity | 8 | 4.6243 |
3.29×10⁻⁷ |
For downregulated DMGs, enriched BP included ‘immune
response’, ‘cellular response to lipopolysaccharide’,
‘peptidyl-tyrosine phosphorylation’, ‘inflammatory response’ and
‘extracellular matrix disassembly’ (Table I). CC analysis revealed enrichment in
‘extracellular space and region’, ‘cell surface’, ‘integral
component of plasma membrane’ and ‘plasma membrane’ (Table I). In addition, MF showed enrichment
in ‘cytokine activity’, ‘protein tyrosine kinase activity’, ‘growth
factor activity’, ‘phosphatidylinositol-4,5-bisphosphate 3-kinase
activity’ and ‘non-membrane spanning protein tyrosine kinase
activity’ (Table I). This
information suggested that DMGs may serve a crucial function in the
tumor immune microenvironment in glioma.
Pathway functional enrichment
analysis
KEGG pathway enrichment analysis identified that
upregulated DMGs were significantly enriched in pathways in
‘cancer’, ‘signaling pathways regulating pluripotency of stem
cells’, ‘PI3K-AKT signaling pathway’, ‘focal adhesion’ and
‘melanoma’. However, downregulated DMGs exhibited enrichment in the
pathways of ‘cytokine-cytokine receptor interaction’, ‘type I
diabetes mellitus’, ‘graft-vs.-host disease’, ‘rheumatoid
arthritis’ and ‘TNF signaling pathway’. These screened pathways
suggested that DMGs may have a vital function in the etiology and
pathogenesis of glioma (Table
II).
| Table II.KEGG pathway analysis of
differentially methylated genes associated with glioma. |
Table II.
KEGG pathway analysis of
differentially methylated genes associated with glioma.
| A,
Hypermethylation |
|---|
|
|---|
| KEGG analysis | Term | Count | % | P-value |
|---|
| KEGG_PATHWAY | hsa05200:Pathways
in cancer | 35 | 22.4 |
1.73×10⁻¹⁷ |
| KEGG_PATHWAY | hsa04550:Signaling
pathways regulating pluripotency of stem cells | 15 | 9.6 |
2.32×10⁻⁸ |
| KEGG_PATHWAY | hsa04151:PI3K-AKT
signaling pathway | 21 | 13.5 |
2.17×10⁻⁷ |
| KEGG_PATHWAY | hsa04510:Focal
adhesion | 16 | 10.3 |
4.91×10⁻⁷ |
| KEGG_PATHWAY |
hsa05218:Melanoma | 10 | 6.4 |
1.17×10⁻⁶ |
|
| B,
Hypomethylation |
|
| KEGG
analysis | Term | Count | % | P-value |
|
| KEGG_PATHWAY |
hsa04060:Cytokine-cytokine receptor
interaction | 25 | 14.5 |
1.68×10⁻¹² |
| KEGG_PATHWAY | hsa04940:Type I
diabetes mellitus | 12 | 6.9 |
6.46×10⁻¹¹ |
| KEGG_PATHWAY |
hsa05332:Graft-vs.-host disease | 11 | 6.4 |
9.97×10⁻¹¹ |
| KEGG_PATHWAY | hsa05323:Rheumatoid
arthritis | 15 | 8.7 |
1.94×10⁻¹⁰ |
| KEGG_PATHWAY | hsa04668:TNF
signaling pathway | 15 | 8.7 |
2.79×10⁻⁹ |
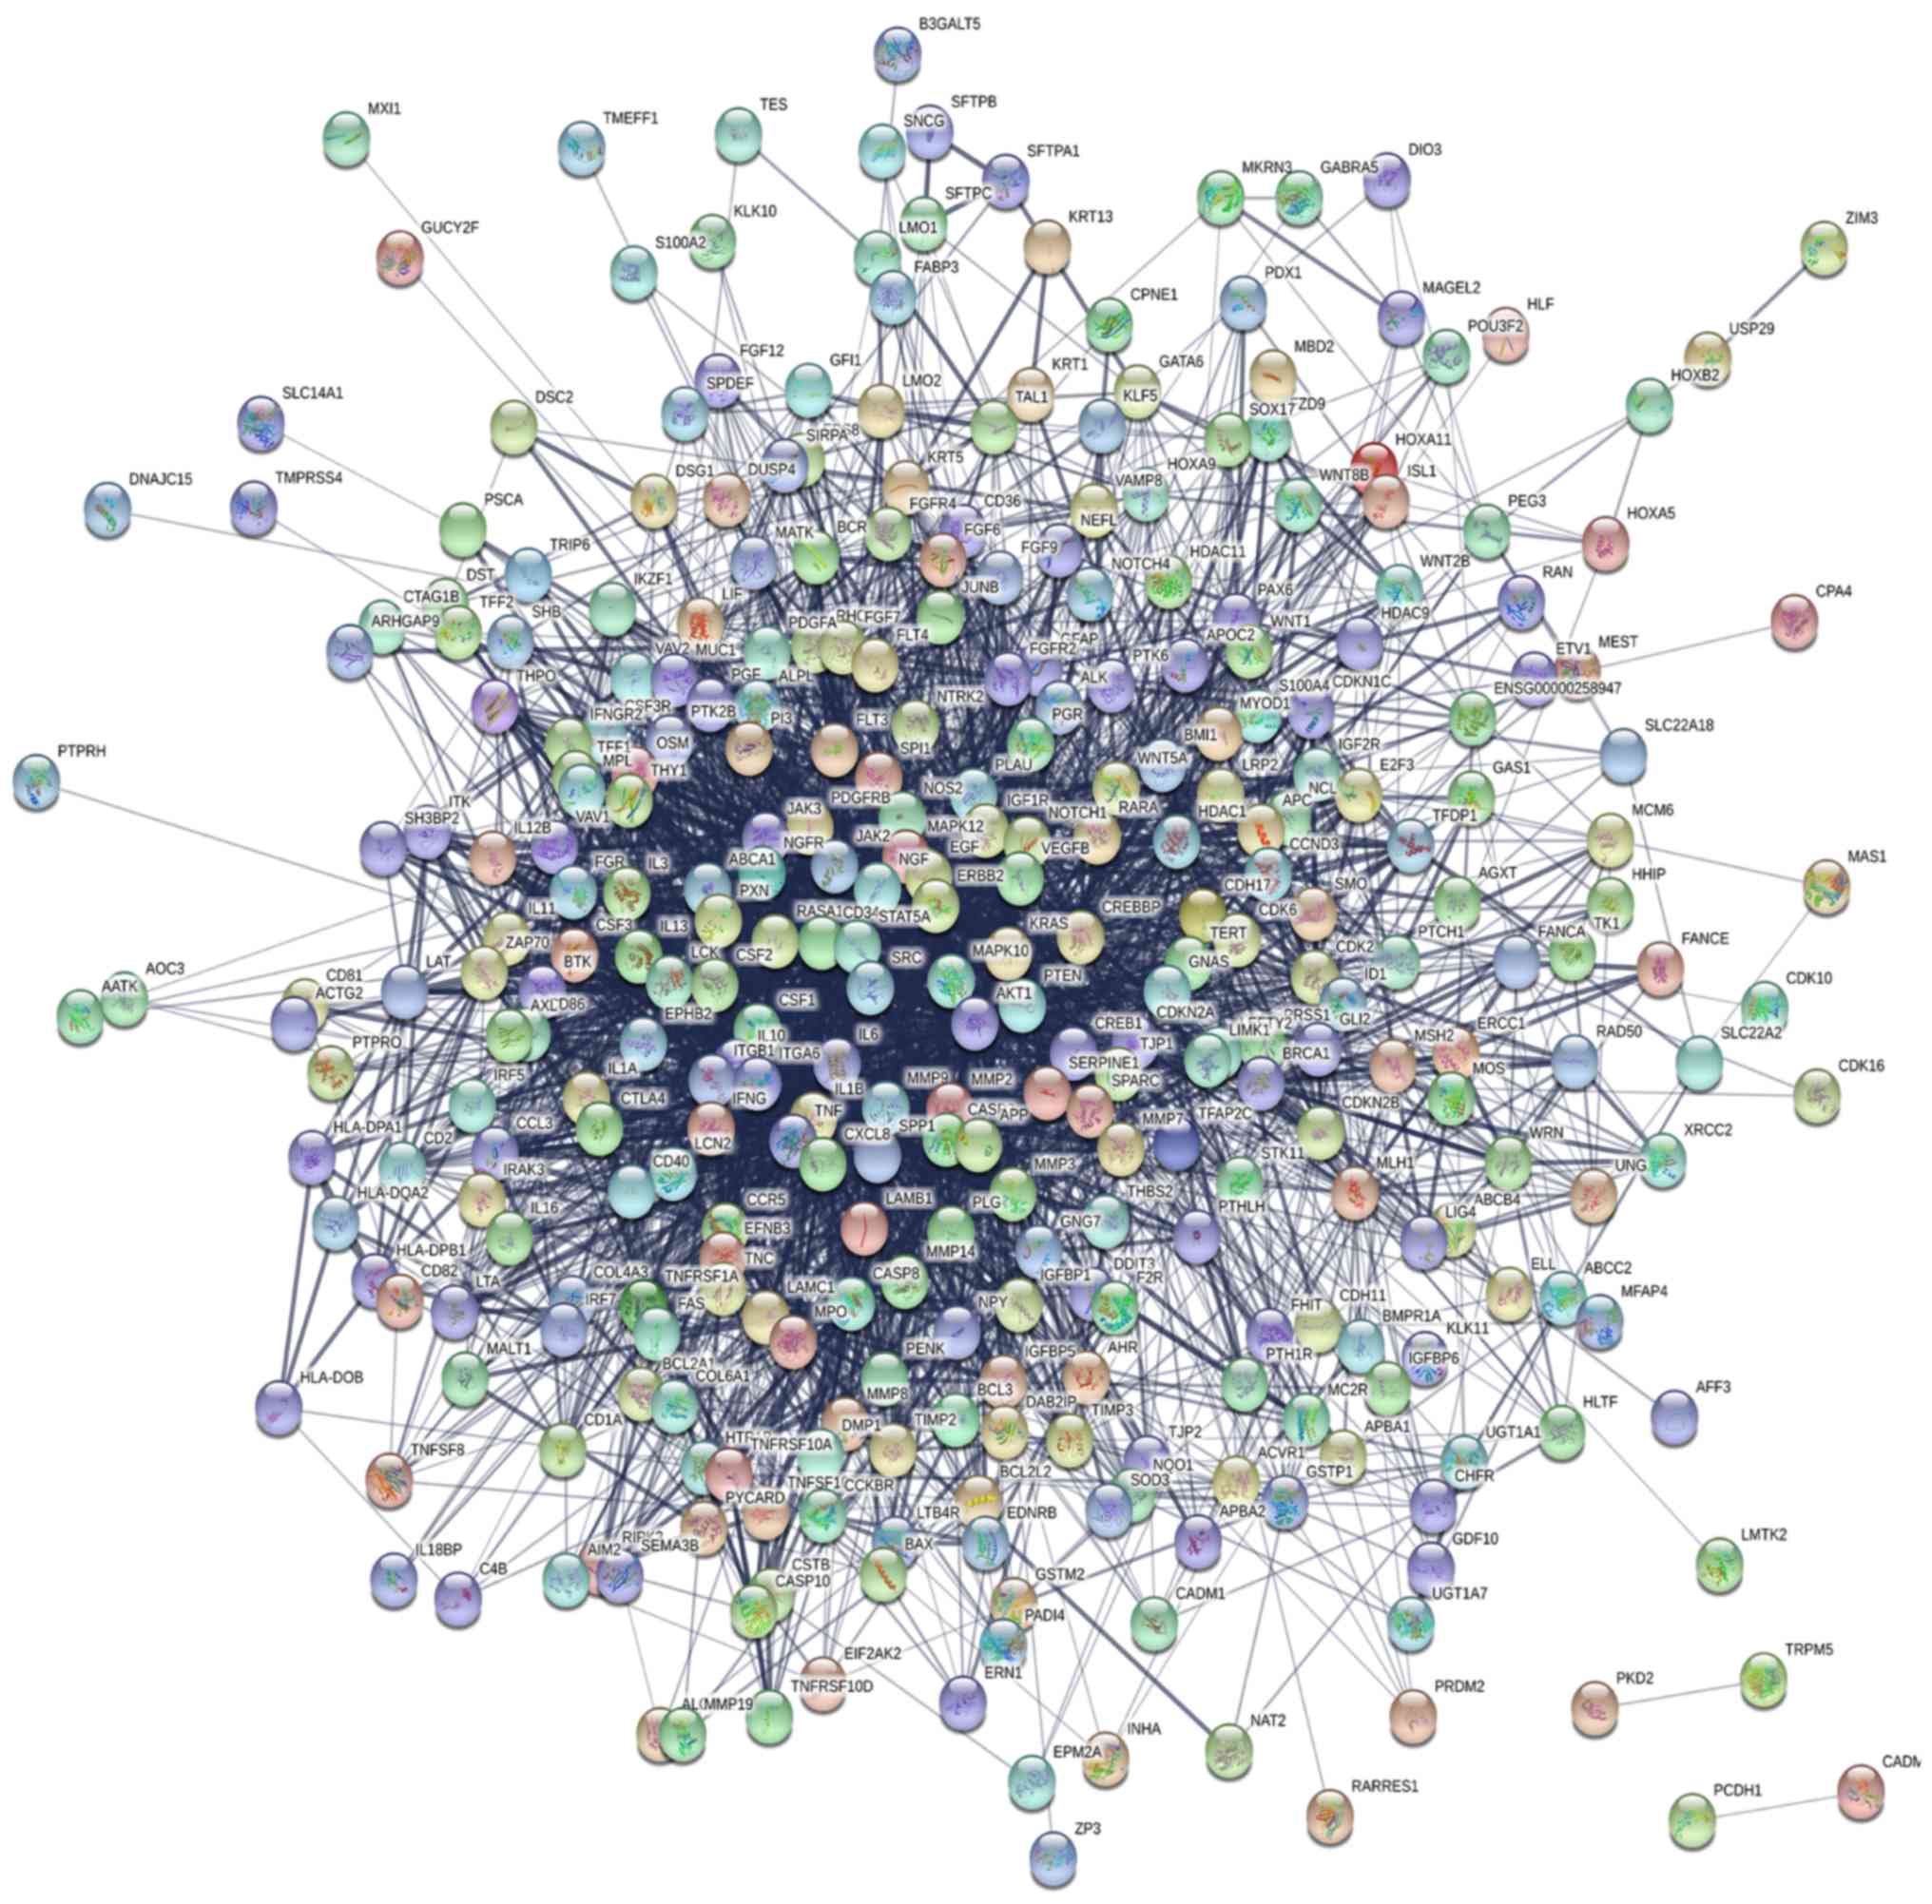
PPI network construction and module
analysis
Based on the information in the STRING protein query
and the data downloaded from public databases, a PPI DMG network
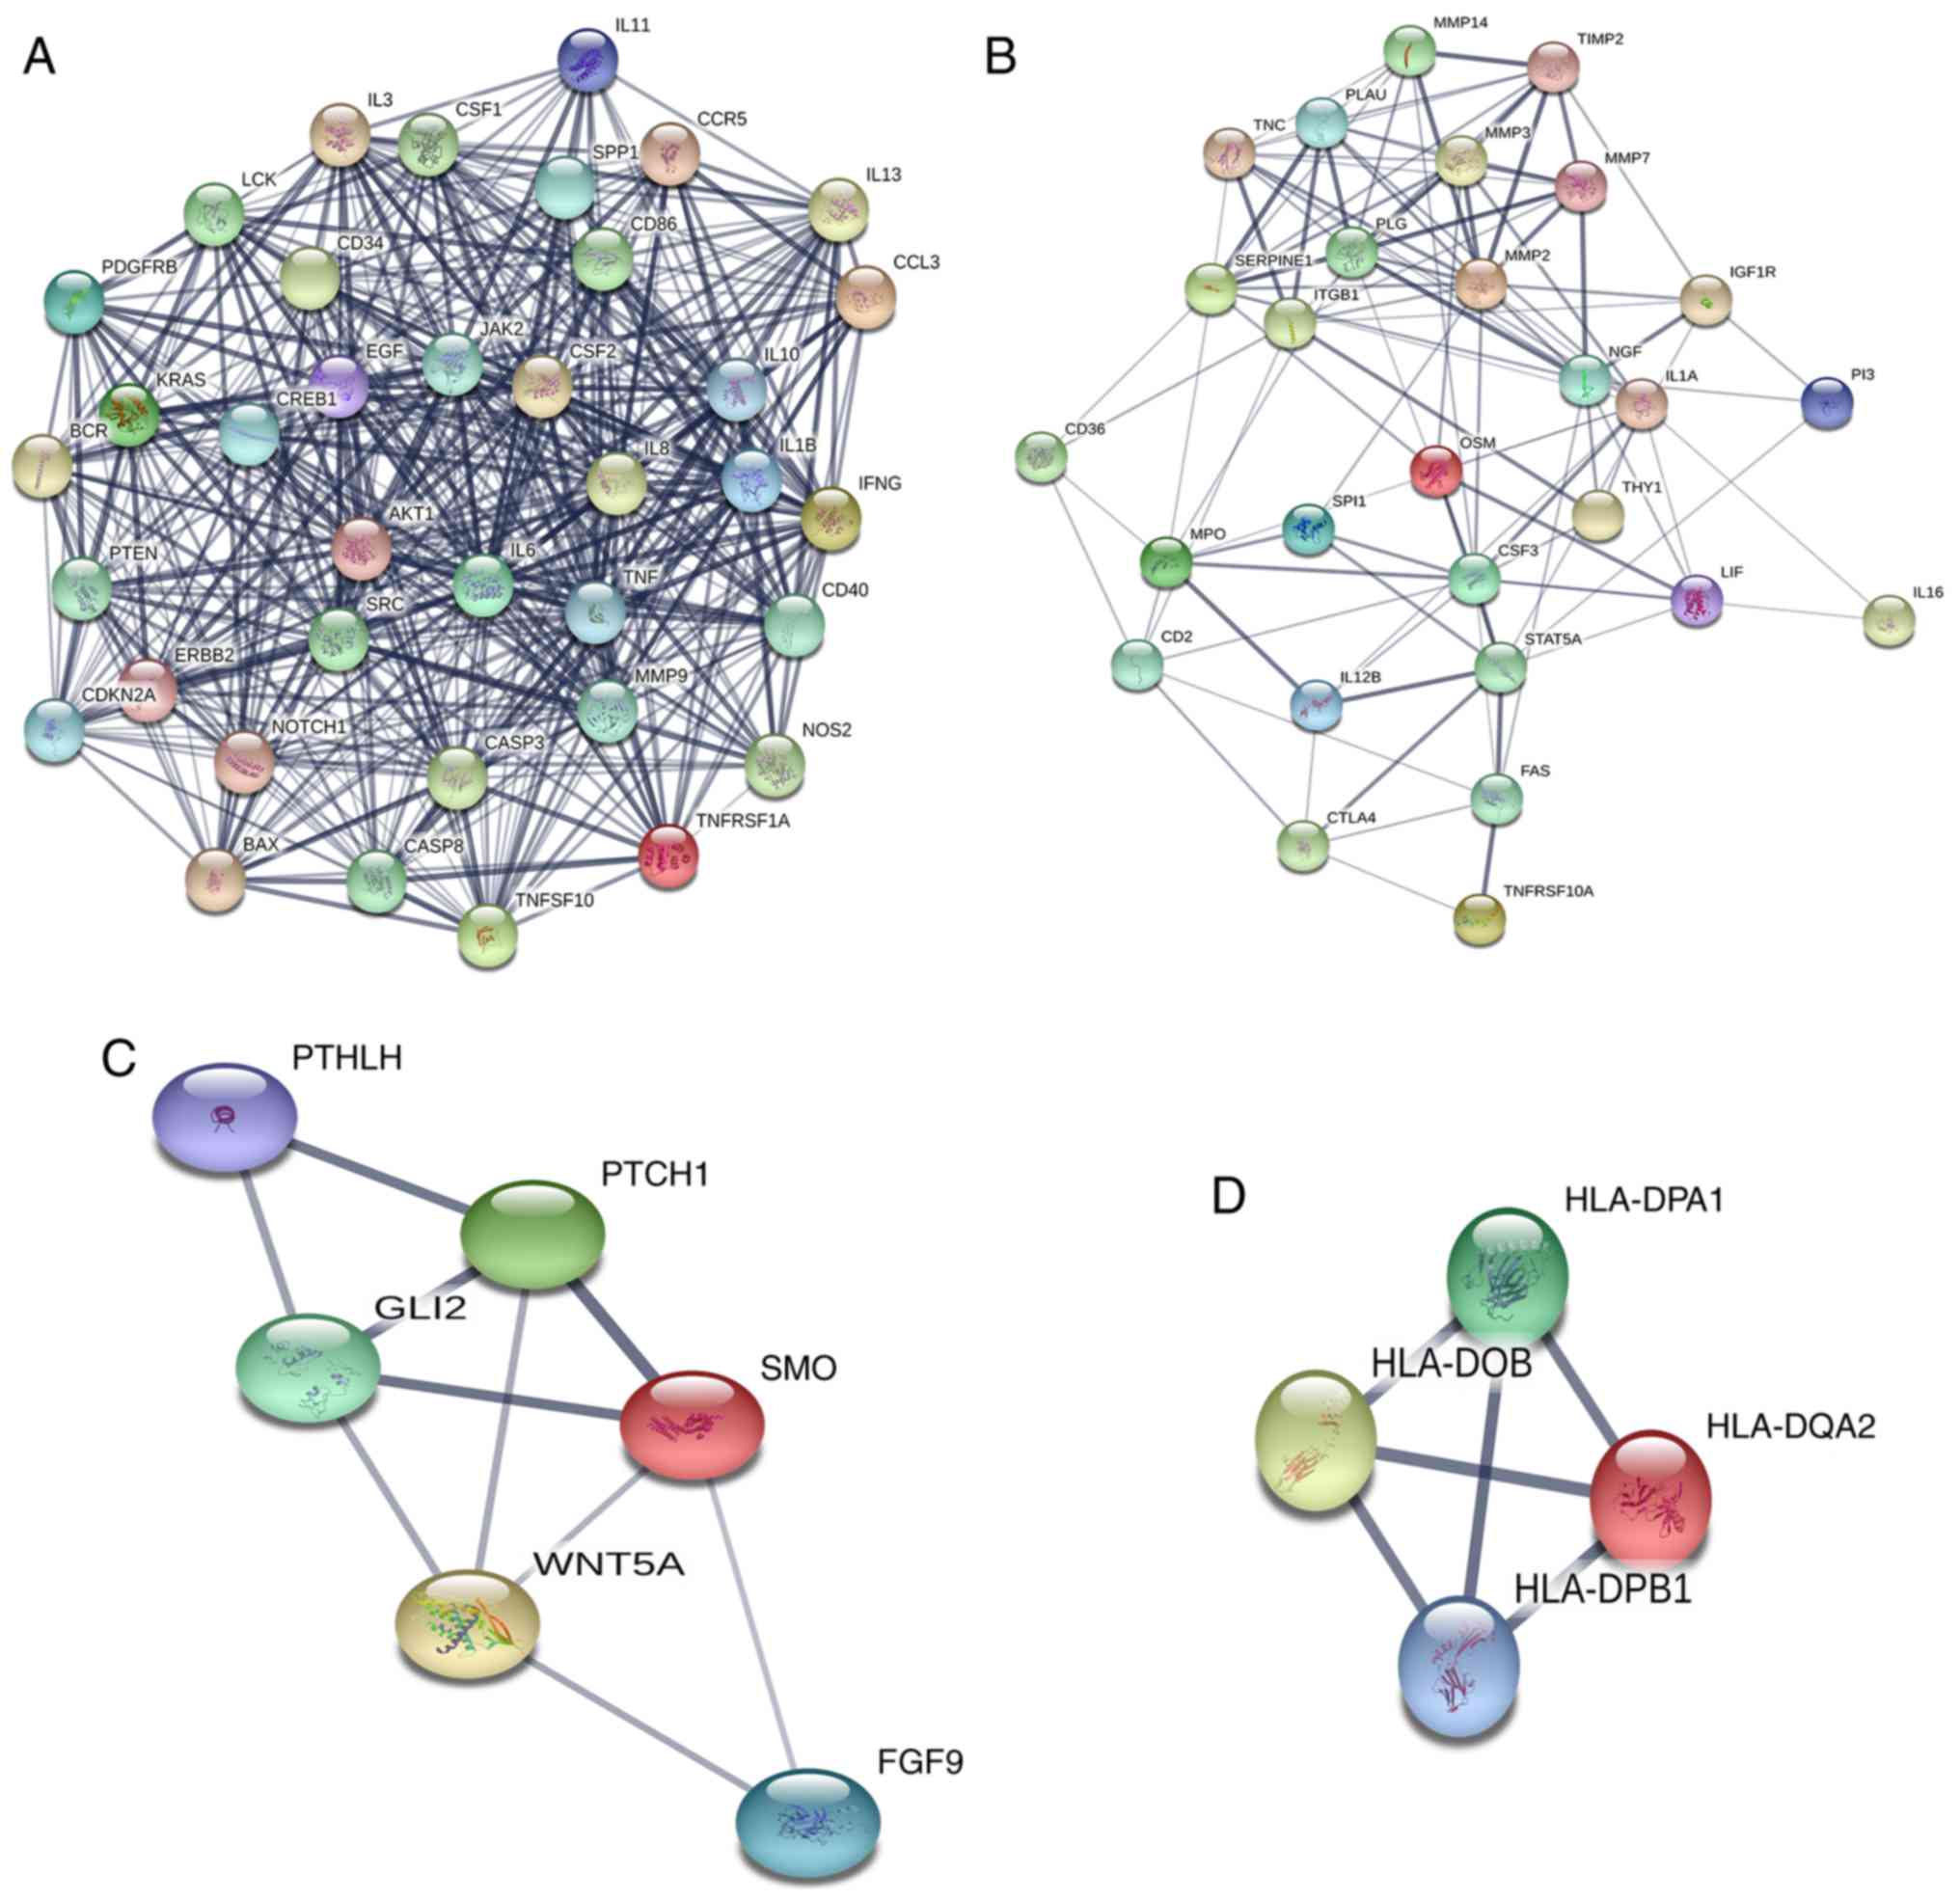
was constructed with 349 nodes and 3,796 edges (Fig. 1). To examine the significant modules
in this PPI network, MCODE in Cytoscape was performed. Interactions
with a score of >0.9 were considered significant. The top four
modules with the highest scores in the network were selected
(Table III). The four modules were
mapped into STRING (Fig. 2), and
these four core modules were mainly associated with
‘cytokine-cytokine receptor interaction’, ‘proteoglycans in
cancer’, ‘basal cell carcinoma’, ‘Jak-STAT signaling pathway’ and
‘cancer pathway’ by KEGG pathway enrichment analysis (Table IV).
| Table III.Modules of the protein-protein
interaction networks. |
Table III.
Modules of the protein-protein
interaction networks.
| Category | Score | Nodes | Edges | Genes |
|---|
| 1 | 27.056 | 37 | 487 | IL10, IL1B,
IFNG, MMP9, CREB1, CASP8, TNFSF10, IL13, LCK, IL8, BAX, AKT1, NOS2,
PTEN, SPP1, KRAS, JAK2, TNFRSF1A, TNF, CD34, CD86, PDGFRB, IL11,
IL6, CD40, CASP3, EGF, NOTCH1, ERBB2, CCL3, CCR5, BCR, SRC, CSF1,
CDKN2A, IL3, CSF2 |
| 2 | 8 | 28 | 108 | TNC, CSF3,
ITGB1, IL1A, CD2, FAS, OSM, MPO, TNFRSF10A, PLG, MMP7, STAT5A,
THY1, CD36, IGF1R, CTLA4, SERPINE1, SPI1, PLAU, LIF, MMP14, IL16,
NGF, IL12B, MMP3, PI3, MMP2, TIMP2 |
| 3 | 4 | 6 | 10 | SMO, PTCH1,
GLI2, WNT5A, PTHLH, FGF9 |
| 4 | 4 | 4 | 6 | HLA-DQA2,
HLA-DPA1, HLA-DPB1, HLA-DOB |
| Table IV.The enriched pathways of modules. |
Table IV.
The enriched pathways of modules.
| Module | Term | P-value | FDR | Genes |
|---|
| 1 |
hsa05152:Tuberculosis |
2.06×10⁻¹² |
2.45×10⁻⁹ | AKT1, TNFRSF1A,
CASP3, IL6, TNF, BAX, CREB1, CASP8, IFNG, IL1B, JAK2, NOS2,
IL10 |
| 1 |
hsa05145:Toxoplasmosis |
1.12×10⁻¹¹ |
1.33×10⁻⁸ | AKT1, TNFRSF1A,
CASP3, TNF, CCR5, CASP8, IFNG, JAK2, CD40, NOS2, IL10 |
| 1 | hsa05142:Chagas
disease (American trypanosomiasis) |
2.27×10⁻¹⁰ |
2.69×10⁻⁷ | AKT1, TNFRSF1A,
IL6, CCL3, TNF, CASP8, IFNG, IL1B, NOS2, IL10 |
| 1 |
hsa04060:Cytokine-cytokine receptor
interaction |
1.68×10⁻⁹ |
2.00×10⁻⁶ | TNFRSF1A, IL6,
TNFSF10, CCL3, TNF, CCR5, IFNG, IL1B, IL13, CD40, IL10,
IL11 |
| 1 | hsa05161:Hepatitis
B |
4.48×10⁻⁹ |
5.33×10⁻⁶ | AKT1, CASP3,
IL6, TNF, KRAS, BAX, CREB1, MMP9, CASP8, PTEN |
| 2 |
hsa04060:Cytokine-cytokine receptor
interaction |
1.44×10⁻⁴ |
1.57×10⁻¹ | OSM, LIF,
TNFRSF10A, CSF3, FAS, IL12B, IL1A |
| 2 |
hsa05205:Proteoglycans in cancer |
5.35×10⁻⁴ |
5.82×10⁻¹ | IGF1R, FAS,
IL12B, MMP2, ITGB1, PLAU |
| 2 |
hsa05162:Measles |
1.05×10⁻³ | 1.14 | TNFRSF10A,
STAT5A, FAS, IL12B, IL1A |
| 2 | hsa04630:Jak-STAT
signaling pathway |
1.45×10⁻³ | 1.57 | OSM, LIF, CSF3,
STAT5A, IL12B |
| 2 |
hsa05202:Transcriptional misregulation in
cancer |
2.44×10⁻³ | 2.62 | IGF1R, SPI1,
MPO, MMP3, PLAU |
| 3 | hsa05217:Basal cell
carcinoma |
1.82×10⁻⁶ |
1.29×10⁻³ | WNT5A, SMO,
PTCH1, GLI2 |
| 3 | hsa05200:Pathways
in cancer |
1.05×10⁻⁵ |
7.46×10⁻³ | WNT5A, SMO,
FGF9, PTCH1, GLI2 |
| 3 | hsa04340:Hedgehog
signaling pathway |
8.86×10⁻⁵ |
6.29×10⁻² | SMO, PTCH1,
GLI2 |
| 3 |
hsa05205:Proteoglycans in cancer |
4.86×10⁻³ | 3.40 | WNT5A, SMO,
PTCH1 |
| 3 | hsa04390:Hippo
signaling pathway |
8.50×10⁻² | 46.77 | WNT5A,
GLI2 |
| 4 |
hsa05310:Asthma |
7.49×10⁻⁸ |
5.78×10⁻⁵ | HLA-DPA1,
HLA-DPB1, HLA-DQA2, HLA-DOB |
| 4 |
hsa05332:Graft-vs.-host disease |
1.01×10⁻⁷ |
7.77×10⁻⁵ | HLA-DPA1,
HLA-DPB1, HLA-DQA2, HLA-DOB |
| 4 | hsa05330:Allograft
rejection |
1.43×10⁻⁷ |
1.11×10⁻⁴ | HLA-DPA1,
HLA-DPB1, HLA-DQA2, HLA-DOB |
| 4 | hsa04940:Type I
diabetes mellitus |
2.12×10⁻⁷ |
1.63×10⁻⁴ | HLA-DPA1,
HLA-DPB1, HLA-DQA2, HLA-DOB |
| 4 | hsa04672:Intestinal
immune network for IgA production |
2.99×10⁻⁷ |
2.31×10⁻⁴ | HLA-DPA1,
HLA-DPB1, HLA-DQA2, HLA-DOB |
Validation of the hub genes in TCGA
database
The top 20 DMGs with the highest degree of
connectivity were selected as hub genes in the PPI network. The top
20 hub genes were annotated as AKT serine/threonine kinase 1
(AKT1), SRC proto-oncogene (also known as non-receptor
tyrosine kinase; SRC), epidermal growth factor (EGF),
tumor necrosis factor (TNF), IL6, NOTCH1, interleukin
8 (IL8), MMP9, IL10, CASP3, interleukin 1 β
(IL1B), colony stimulating factor 2 (CSF2),
phosphatase and tensin homolog (PTEN), ERBB2, CDKN2A,
CD34 molecule (CD34), Janus kinase 2 (JAK2),
interferon gamma (IFNG), KRAS proto-oncogene (KRAS)
and cAMP responsive element binding protein 1 (CREB1). In
addition, GEPIA was used to determine the expression levels of hub
genes between glioma and normal brain tissue. Compared with that in
normal brain tissue, the expression level of the four hub genes,
including NOTCH1, CASP3, IL1B and CREB1, was
significantly elevated both in LGG and GBM (Fig. 3). Boxplots were used to visualize the
expression levels of these four hub genes. Furthermore, the
immunohistochemical data in glioma and normal brain tissue based on
HPA data showed that the expression of CASP3 and
ERBB2 increased in glioma (Fig.
3). In addition, the expression level of hypomethylated genes
increased in GBM compared with that in normal brain tissue,
including IL6, notch receptor 1 (NOTCH1), matrix
metallopeptidase 9 (MMP9), IL10, IL1B and
CREB1 (Table V). For the
aforementioned hub genes, the significant consistency of
methylation and expression status partially confirmed the
reliability and stability of the results.
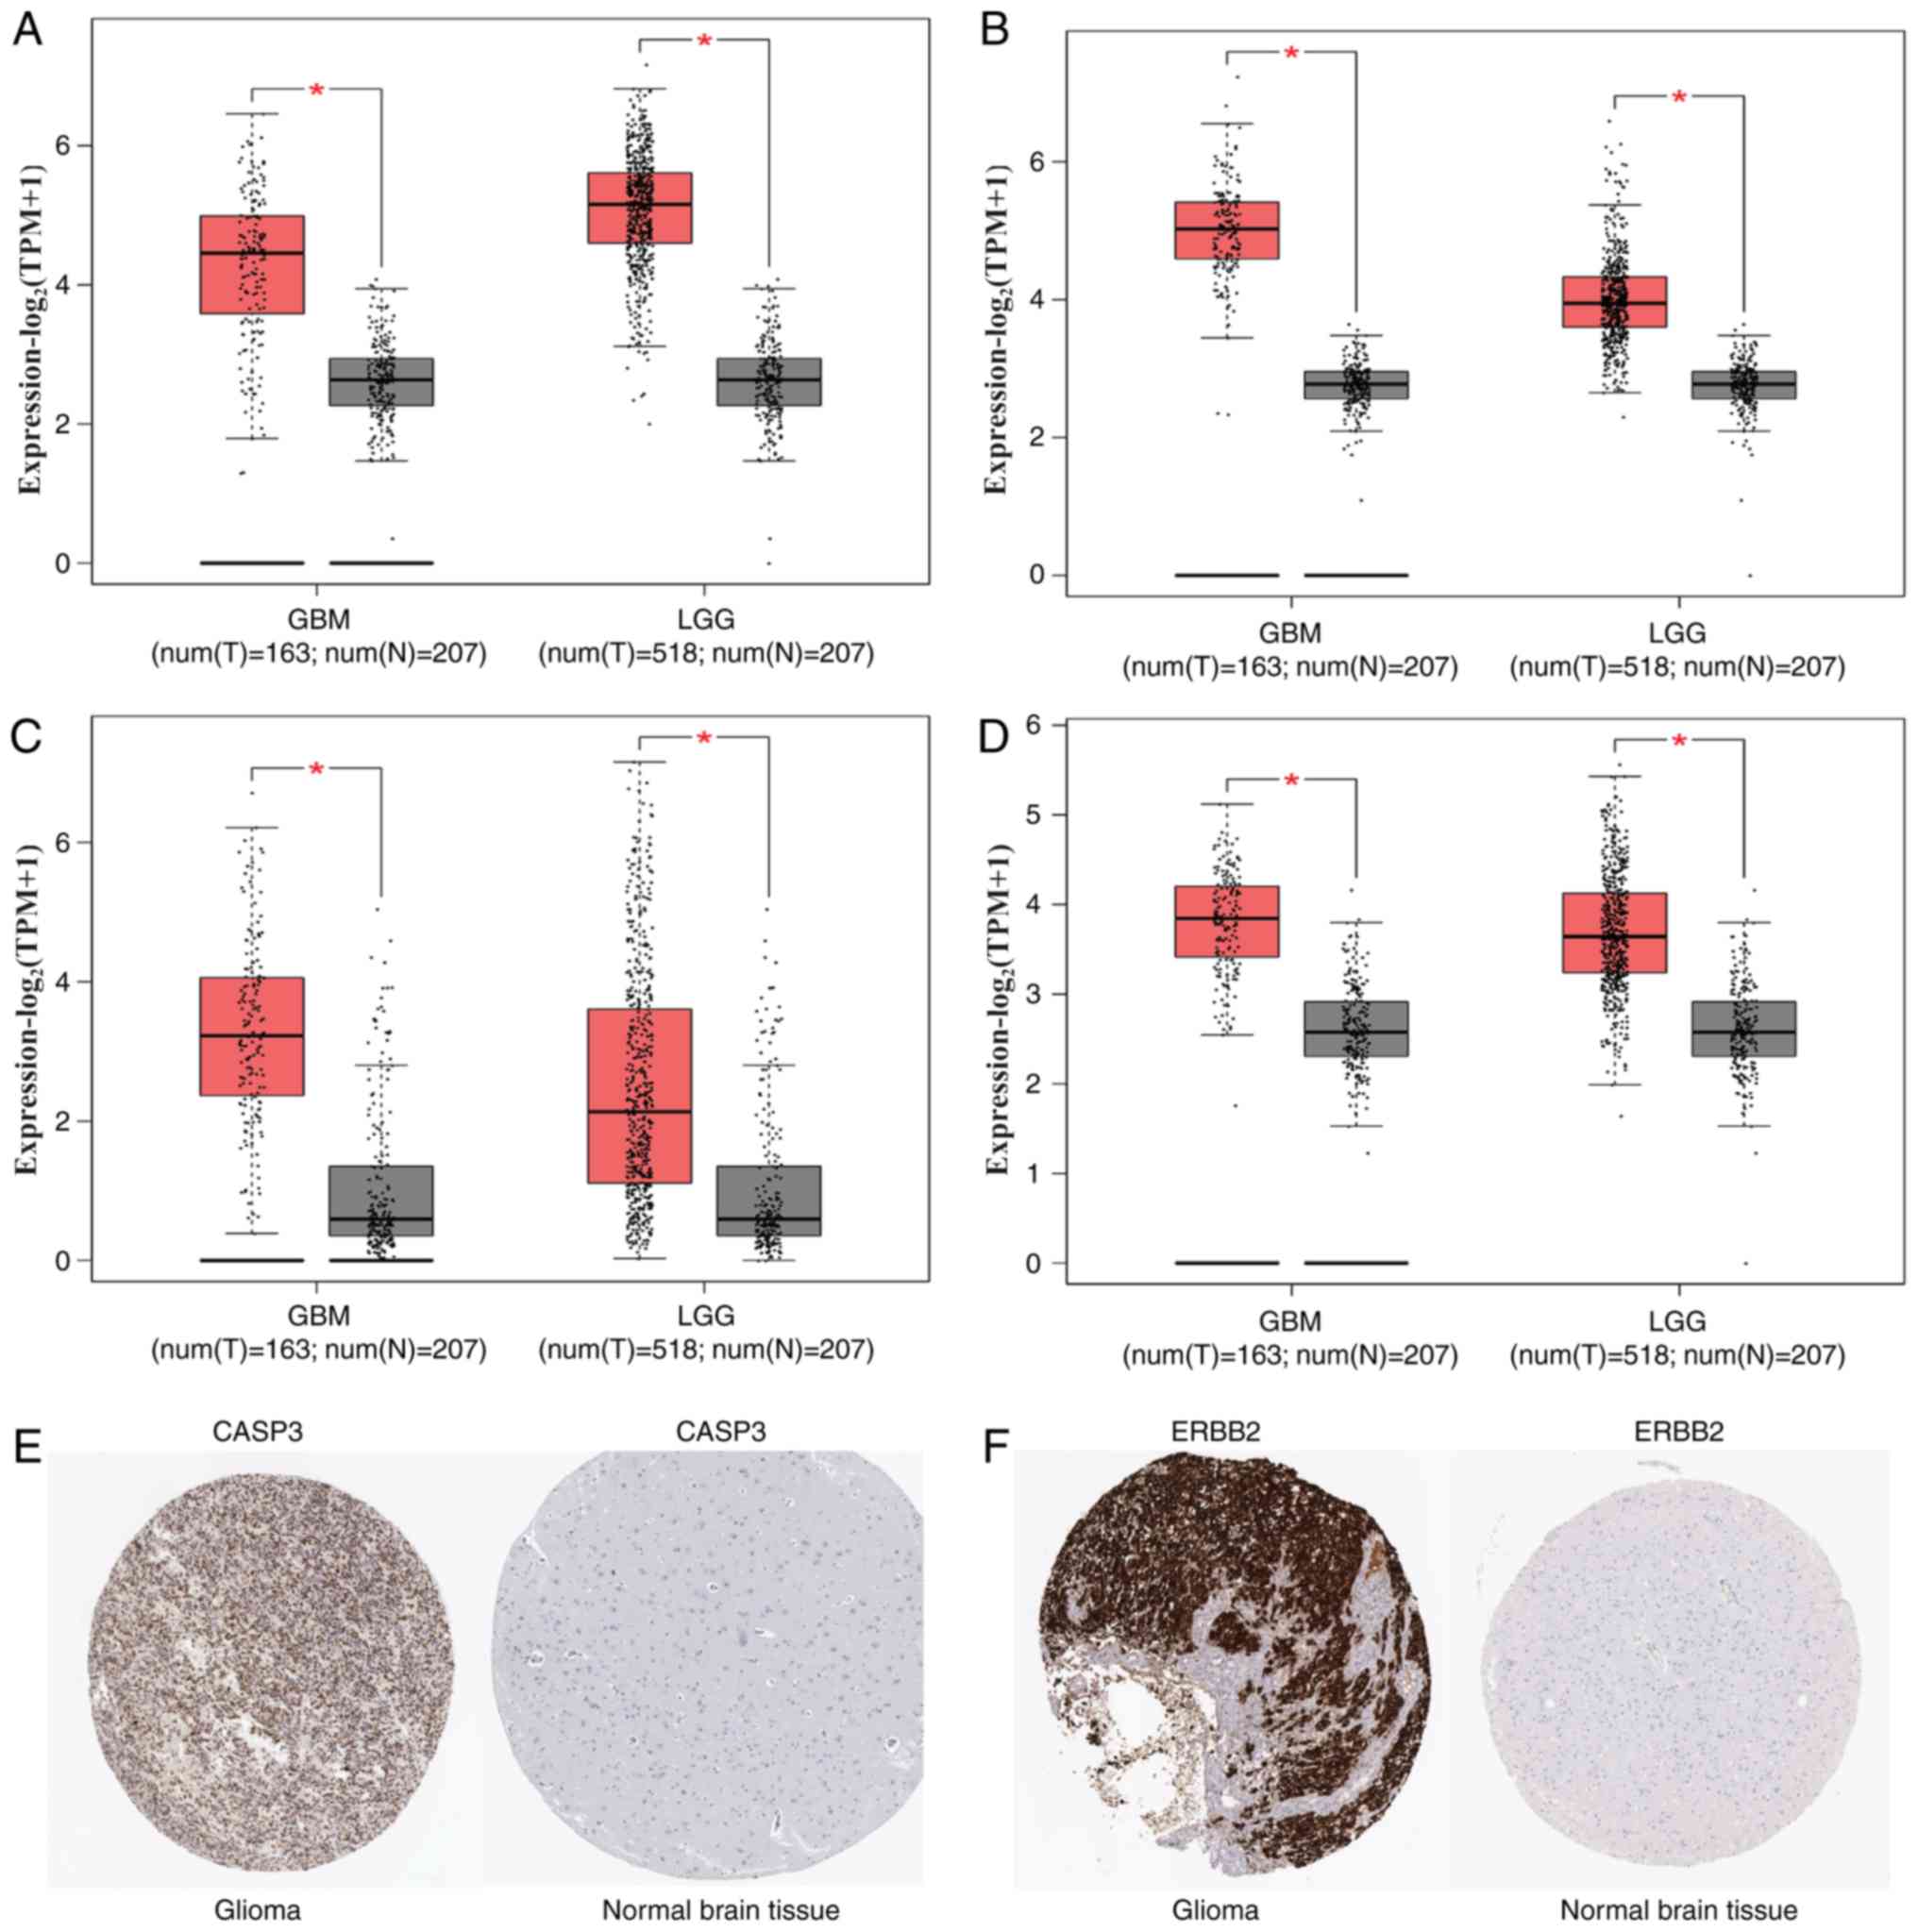 | Figure 3.Expression level of the hub genes in
glioma and normal brain tissues. (A-D) Expression level of (A)
NOTCH1, (B) CASP3, (C) IL1B and (D)
CREB1 in glioma and normal brain tissues. Red indicates
glioma, gray indicates normal brain tissue. (E) CASP3 protein was
strongly upregulated in glioma tissues compared with normal brain
tissues based on the Human Protein Atlas database. (F) ERBB2
protein was strongly upregulated in glioma tissues compared with
normal brain tissues based on the Human Protein Atlas database.
*P<0.05. GBM, glioblastoma multiforme; LGG, brain lower grade
glioma; TPM, transcripts per million. NOTCH1, notch receptor
1; CASP3, caspase 3; IL1B, interleukin 1 β;
CREB1, cAMP responsive element binding protein 1;
ERBB2, erb-b2 receptor tyrosine kinase 2. |
| Table V.Top 20 hub genes with the highest
degree of connectivity, and validation of the hub genes in The
Cancer Genome Atlas database. |
Table V.
Top 20 hub genes with the highest
degree of connectivity, and validation of the hub genes in The
Cancer Genome Atlas database.
| Gene | Degree of
connectivity | Methylation
status | Adjusted
P-value | P-value | Expression
status |
|---|
| AKT1 | 121 |
Hypermethylation |
1.09×10⁻⁵ |
4.71×10⁻⁷ | Upregulation |
| SRC | 112 |
Hypomethylation |
2.08×10⁻³ |
2.27×10⁻⁴ | No change |
| EGF | 112 |
Hypomethylation |
1.35×10⁻² |
2.54×10⁻³ | No change |
| TNF | 110 |
Hypomethylation |
4.62×10⁻² |
1.43×10⁻² | No change |
| IL6 | 108 |
Hypomethylation |
4.76×10⁻² |
1.47×10⁻² | Upregulation |
| NOTCH1 | 88 |
Hypomethylation |
5.76×10⁻¹³ |
4.59×10⁻¹⁵ | Upregulation |
| IL8 | 81 |
Hypomethylation | 1.30
×10−3 |
1.26×10⁻⁴ | No change |
| MMP9 | 77 |
Hypomethylation |
2.64×10⁻² |
6.41×10⁻³ | Upregulation |
| IL10 | 76 |
Hypomethylation |
4.29×10⁻² |
1.31×10⁻² | Upregulation |
| CASP3 | 75 |
Hypermethylation |
2.70×10⁻² |
6.66×10⁻³ | Upregulation |
| IL1B | 74 |
Hypomethylation |
1.43×10⁻² |
2.78×10⁻³ | Upregulation |
| CSF2 | 73 |
Hypomethylation |
3.50×10⁻² |
9.68×10⁻³ | No change |
| PTEN | 72 |
Hypermethylation |
1.90×10⁻² |
4.13×10⁻³ | No change |
| ERBB2 | 70 |
Hypermethylation |
1.18×10⁻² |
2.10×10⁻³ | Upregulation |
| CDKN2A | 67 |
Hypermethylation |
3.58×10⁻² |
1.00×10⁻² | Upregulation |
| CD34 | 66 |
Hypermethylation |
8.65×10⁻⁴ |
7.93×10⁻⁵ | No change |
| JAK2 | 63 |
Hypermethylation |
2.23×10⁻⁵ |
1.05×10⁻⁶ | No change |
| IFNG | 63 |
Hypomethylation |
3.77×10⁻² |
1.07×10⁻² | No change |
| KRAS | 59 |
Hypermethylation |
9.14×10⁻³ |
1.49×10⁻³ | No change |
| CREB1 | 58 |
Hypomethylation |
1.53×10⁻⁵ |
7.03×10⁻⁷ | Upregulation |
Kaplan-Meier plots and expression
level of hub DMGs
The prognostic data of the 20 hub DMGs were obtained
from GEPIA. The results indicated that overexpression of
MMP9 (HR, 3.6; P<0.001), EGF (HR, 2.0;
P=6.1×10⁻⁸), CASP3 (HR, 4.3; P<0.001),
IL6 (HR, 2.7; P=1.4×10⁻¹³), IL10 (HR, 2.8;
P=4.1×10⁻¹³) and ERBB2 (HR, 2.1;
P=1×10⁻⁸) was significantly associated with shorter OS
time. By contrast, the high expression of NOTCH1 (HR, 0.53;
P=9×10⁻⁷) and SRC (HR, 0.62; P=0.00026) was
associated with longer OS time in glioma (Fig. 4).
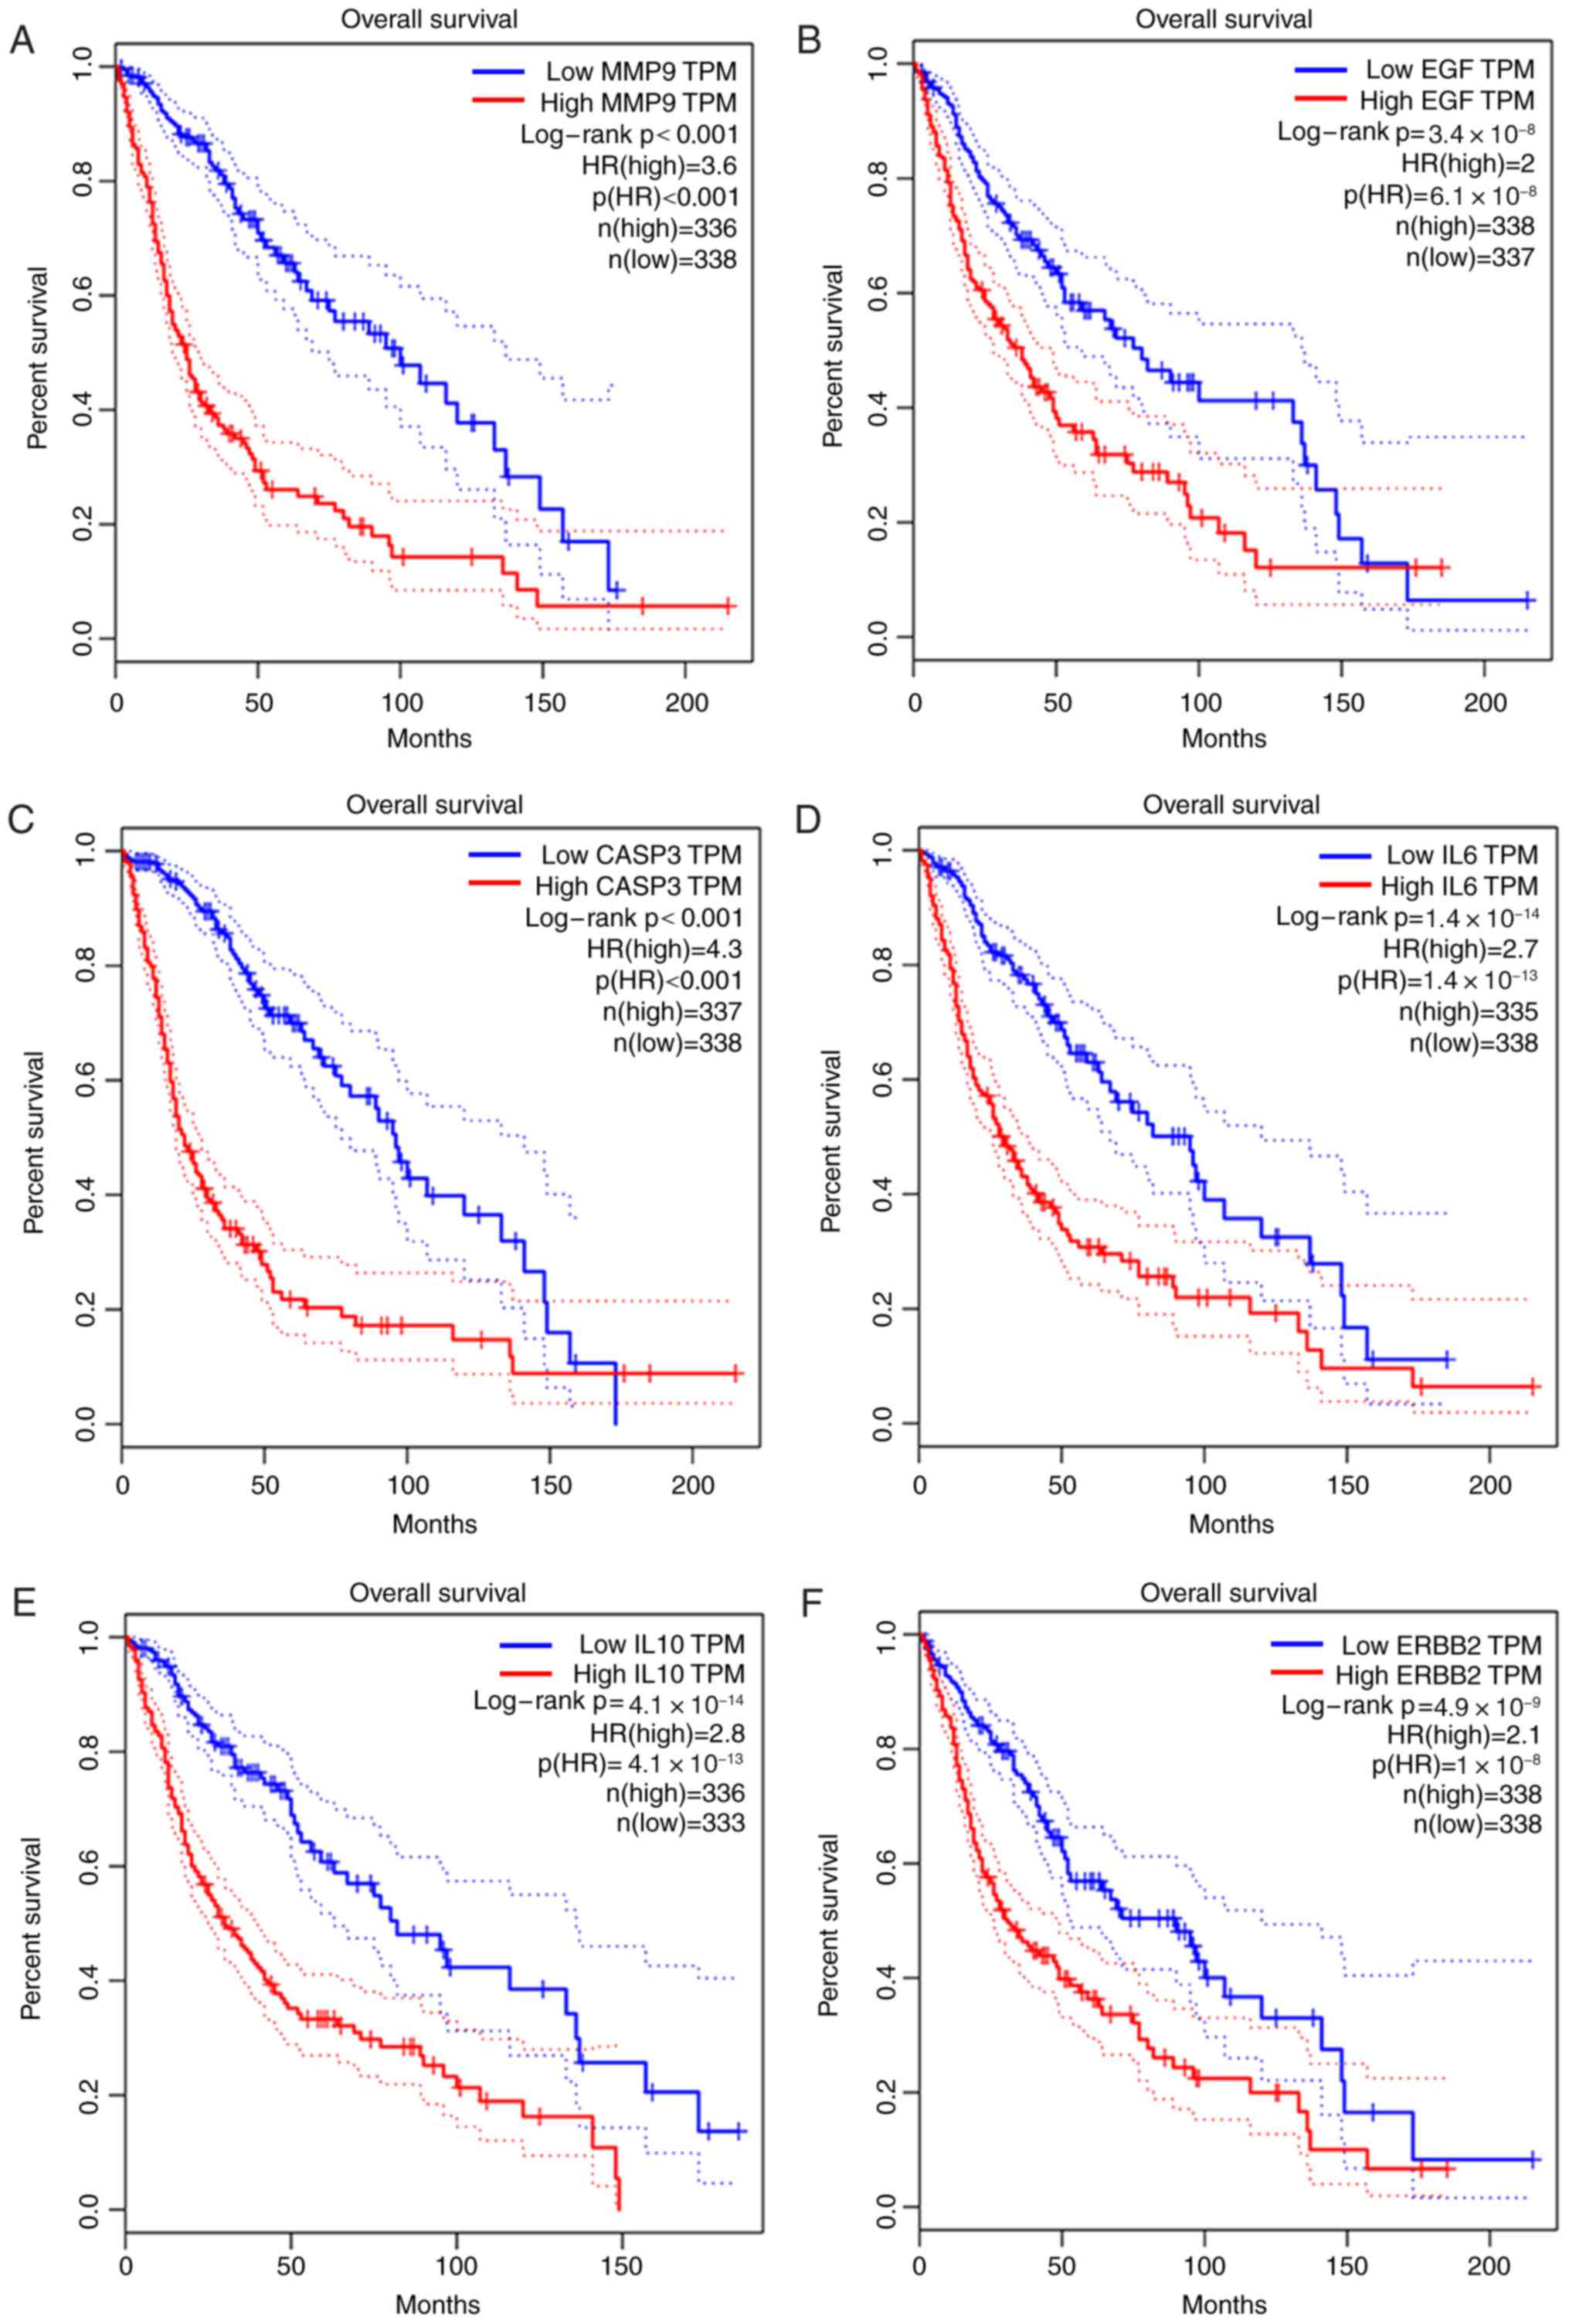 | Figure 4.Prognostic value of eight
differentially methylated genes in patients with glioma. (A-F) High
expression of (A) MMP9, (B) EGF, (C) CASP3,
(D) IL6, (E) IL10 and (F) ERBB2 was
significantly associated with poor prognosis in glioma patients. (G
and H) High expression of (G) NOTCH1 and (H) SRC was
associated with improved prognosis in glioma patients. HR, hazard
ratio; TPM, Transcripts per million; MMP9, matrix
metallopeptidase 9; EGF, epidermal growth factor;
CASP3, caspase 3; IL6, interleukin 6; IL10,
interleukin 10; ERBB2, erb-b2 receptor tyrosine kinase 2;
NOTCH1, notch receptor 1; SRC, SRC
proto-oncogene. |
Discussion
Glioma is the most common malignant tumor of the CNS
(26). Despite drastic treatment,
including neurosurgical resection after which radiotherapy in
combination with temozolomide is used, a poor prognosis and high
recurrence rate remains (27).
Genetic and epigenetic alterations play a vital role in cellular
transformation and therapy resistance (28). Therefore, potential specific
molecular biomarkers and core therapeutic targets require further
investigation. Global genomic hypomethylation and promoter
hypermethylation of key genes is a hallmark of various types of
cancer, such as lymphoma, breast and ovarian cancer (29). DNA methylation can alter the
expression level of genes, which can further influence the
proliferation and migration of tumor cells (30). Hypomethylation has been verified to
result in chromosome instability by activating the transcription of
the commonly silenced transposons, similar to repetitive sequences
(31). Aberrant gene promoter region
hypermethylation of certain tumor suppressor genes, such as
MLH1, MGMT, and CDKN2A genes, can lead to epigenetic
silencing of such gene expression, which is associated with vital
biological processes, including DNA repair and cell cycle control
(32). Therefore, in order to gain a
further understanding of the underlying mechanisms that affect the
incidence and development of glioma, epigenetic alterations require
further investigation. Bioinformatics analysis provides objective
data for this purpose. In the present study, the GSE28094 dataset,
containing 90 gliomas and 6 normal brain tissues, was extracted
from GEO as a discovery set. Numerous bioinformatics tools detected
a total of 349 DMGs, including 167 hypermethylated genes and 182
hypomethylated genes, which may be associated with the
tumorigenicity and progression of glioma.
As revealed by GO analysis, hypomethylated genes in
glioma were enriched in BPs of ‘immune response’, ‘cellular
response to lipopolysaccharide’, ‘peptidyl-tyrosine
phosphorylation’, ‘inflammatory response’ and ‘extracellular matrix
(ECM) disassembly’. MF indicated enrichment in ‘cytokine activity’,
‘protein tyrosine kinase activity’, ‘growth factor activity’,
‘phosphatidylinositol-4,5-bisphosphate 3-kinase activity’ and
‘non-membrane spanning protein tyrosine kinase activity’. In
addition, for hypermethylated genes in glioma, GO analysis
indicated that enriched BPs were positive and negative regulation
of ‘cell proliferation’, ‘positive regulation of transcription from
RNA polymerase II promoter’, ‘protein autophosphorylation’ and
‘regulation of apoptotic process’. MF enrichment revealed ‘protein
binding’, ‘transcription factor binding’, ‘protein
heterodimerization activity’, ‘receptor binding’ and ‘ATP binding’.
These results suggested that dysregulation of cell proliferation
and apoptosis may serve an important role in the occurrence and
development of tumors, which was in agreement with previous studies
(33,34). As a major component of tumor local
microenvironment, the ECM affects tumor progression by promoting
cell transformation and metastasis (35). Notably, ECM anomalies also lead to
stromal cell deregulation and facilitate tumor-associated
angiogenesis and inflammation, which comprise the tumorigenic
microenvironment (35). It has been
reported that active but dysfunctional immune responses are
associated with cancer (36).
Clinical data have indicated that immune stimulation and immune
suppression simultaneously occur in patients with cancer, with
increased concentrations of TNFα, interleukin (IL)6, IL8 and IL10
(37), which is in accordance with
the results of the present study. Therefore, tumor-promoting immune
disorder may serve a pivotal role in glioma oncogenesis, suggesting
that cancer immunotherapy is likely to become a key part of the
clinical management of glioma.
KEGG analysis revealed that DMGs were significantly
enriched in pathways including ‘cancer’, ‘signaling pathways
regulating pluripotency of stem cells’, ‘PI3K-AKT signaling
pathway’, ‘focal adhesion’ and ‘melanoma’. Activated AKT
modulates the function of numerous substrates, such as mTOR,
glycogen synthase kinase 3 β or forkhead box protein O1, which are
involved in the regulation of cell metabolism, proliferation, cell
cycle progression and survival (38). In recent years, the PI3K/AKT
signaling pathway has been associated with tumorigenesis and
development of GBM (39).
Pluripotent mouse embryonic stem cells can be expanded in large
numbers in vitro by symmetrical self-renewal (40). Self-renewal entails proliferation
with a concomitant suppression of differentiation, which is
responsible for the occurrence and progression of cancer (40). Furthermore, differentially methylated
regions in induced pluripotent stem cells, derived by epigenetic
reprogramming, are significantly enriched in specific tissues and
cancer, demonstrating that hypermethylation and hypomethylation of
cytosine-phosphate-guanine islands are broadly involved in tissue
differentiation, epigenetic reprogramming and cancer (41).
In addition, focal adhesion is associated with tumor
cell migration and invasion (42). A
previous study have shown that the expression and activity of focal
adhesion kinase, an intracellular non-receptor tyrosine kinase, is
frequently associated with cell adhesion, migration, survival,
proliferation, differentiation and angiogenesis in cancer (43). These findings demonstrated the
reliability of the present results, indicating the critical role of
the PI3K/AKT signaling pathway, pluripotency of stem cells and
focal adhesion kinase in the tumorigenicity of glioma, providing a
promising therapeutic target for glioma.
The PPI network for DMGs uncovered the overview of
their functional connections. The top 20 hub genes were also
selected, in which five DMGs with a high degree of connectivity
were identified: AKT1, SRC, EGF, TNF and IL6 (gene
count >100). Furthermore, TCGA database analysis was used to
validate the top 20 hub genes. The results revealed that the
hypomethylation of IL6, NOTCH1, MMP9, IL10, IL1B and
CREB1 was associated with high expression levels in glioma.
Moreover, immunochemistry images of these hub genes were obtained
from HPA. Compared with that of the other eight hub genes (AKT1,
IL6, NOTCH1, MMP9, IL10, IL1B, CDKN2A and CREB1), the
expression intensity and quantity of CASP3 and ERBB2
were higher in glioma. Therefore, the immunochemistry images of
CASP3 and ERBB2 were selected to visualize their
differential expression level in glioma vs. normal brain tissue. It
was revealed that eight genes were associated with survival, which
were either protective or risky, based on HR. NOTCH1 and
SRC were defined as protective with HR<1, whereas IL6,
MMP9, IL10, CASP3, ERBB2 and EGF were defined as risky
with HR>1. The aforementioned genes identified in the present
study may serve as valuable prognostic biomarkers in glioma.
In previous studies, a number of these hub genes
have already been examined as promising predictors of glioma. For
instance, ILs, including IL6 and IL10, two important
Th2-associated cytokines, are often co-expressed in glioma and
further participate in malignancy progression and lead to an
unfavorable prognosis (44,45). MMP9 contributes to the
degradation of ECM, angiogenesis and the invasiveness of glioma
(46). AKT1 kinase is a crucial
member of activated proliferation and survival pathways in cancer,
which has the ability to suppress apoptosis, deregulate the cell
cycle and alter the angiogenic potential (47). Increased levels of AKT in ~80% of all
GBM cases suggested that activation of the AKT pathway was strongly
implicated in the development of GBM (48). Epidermal growth factor receptor
(EGFR) is activated by binding of its extracellular ligand, EGF,
resulting in enhanced cell proliferation, growth and survival
(49). A series of signaling pathway
cascades activated by EGF/EGFR are associated with GBM progression,
including activation of K-RAS and AKT signaling and mammalian
target of rapamycin, together with PI3K pathways (50). Accumulating evidence shows that
NOTCH1 is upregulated in classical and proneural subtypes of
GBM, and is associated with tumor grade (51). NOTCH1 inhibition suppresses
the biological behavior of metastasis, invasion and
epithelial-mesenchymal transition (52). SRC is one of several oncogenic
tyrosine kinases, which is activated in various types of cancer to
influence survival and metastasis, such as lung cancer, breast
cancer and melanoma (53). The
SRC-linked STAT3/MMP pathway is responsible for glioma stem cell
(GSC) maintenance and growth (54);
therefore, the inhibition of the SRC/STAT3 pathway may be a novel
therapeutic target in glioma. The CREB1 gene plays a crucial
role in the development and progression in various types of cancer,
such as colon cancer, ovarian cancer and bladder cancer (55). Overexpression of CREB1 is
significantly associated with advanced WHO grade, Karnofsky
Performance Scale and short survival time of patients with glioma
(56). Furthermore, inhibition of
CREB1 activation can prevent GSC self-renewal and suppress
neoplastic growth (57). The
ERBB2 proto-oncogene (also known as HER2) is one of
the most useful molecules for classification and prognosis in
cancer, and its activation and downstream signals are highly
dependent on dimerization with EGFR (58). ERBB2, in combination with
survivin and CD99 molecule, has the ability to form branched
multipeptides, which stably bind with T2 cells to exhibit 40–60 and
60–80% cytotoxic activity against the U251 GBM and primary cells,
respectively; therefore, they are promising candidates for
immunotherapeutic GBM treatment (59). Caspases are well-renowned proteases
that play a central role in initiating and executing cell apoptosis
(60). A number of human cancer cell
lines, such as MCF7, HCC1500, CRL1500, MDA-MB-231, A549, DU145,
HepG2, HeLa and HGC27, upregulate ERBB2 expression, which
promotes tumor survival via inhibiting the apoptotic activity of
CASP3/8 (61). Therefore,
apoptosis-associated CASP3 is an important gene in human
carcinogenesis. According to previous studies, the underlying
mechanism of IFNG in glioma remains unclear, and further
research is necessary (62).
In summary, through bioinformatics analysis of
glioma microarray gene expression data, a total of 349 DMGs were
obtained between glioma and normal brain tissue, including 167
hypermethylated and 182 hypomethylated genes. The results showed
that IL6, MMP9, IL10, CASP3, ERBB2 and EGF, which
were associated with the tumor immune microenvironment, may act in
the progression of malignant glioma. Molecular biological
experiments are further required to elucidate the function and
mechanism of these identified candidate DMGs in glioma, thereby
offering new implications on glioma immune microenvironment and
immune-related therapy.
Supplementary Material
Supporting Data
Acknowledgements
Not applicable.
Funding
The present study was supported by grants from the
Resource Sharing Platform Construction of Science and Technology
Department of the Autonomous Region (grant no. PT1802) and the
Xinjiang Medical University Graduate Innovation Entrepreneurship
Start-up Fund (grant no. CXCY2018018).
Availability of data and materials
The datasets used during the current study are
available from the corresponding author on reasonable request.
Authors' contributions
All authors participated in the preparation of the
manuscript. WZ conceived and designed the study. JX, HXG and WS
conducted the research. YZ and QW standardized the procedure for
sequence search. WLC, ML and MBW contributed to data analysis and
revised the manuscript. JX wrote the first draft of the manuscript.
All authors read and approved the final version of the
manuscript.
Ethics approval and consent to
participate
Not applicable.
Patient consent for publication
Not applicable.
Competing interests
The authors declare no competing interests.
References
|
1
|
Hu T and Xi J: Identification of COX5B as
a novel biomarker in high-grade glioma patients. Onco Targets Ther.
10:5463–5470. 2017. View Article : Google Scholar : PubMed/NCBI
|
|
2
|
Song X, Zhang N, Han P, Moon BS, Lai RK,
Wang K and Lu W: Circular RNA profile in gliomas revealed by
identification tool UROBORUS. Nucleic Acids Res. 44:e872016.
View Article : Google Scholar : PubMed/NCBI
|
|
3
|
Louis DN, Perry A, Reifenberger G, von
Deimling A, Figarella-Branger D, Cavenee WK, Ohgaki H, Wiestler OD,
Kleihues P and Ellison DW: The 2016 World Health Organization
classification of tumors of the central nervous system: A summary.
Acta Neuropathol. 131:803–820. 2016. View Article : Google Scholar : PubMed/NCBI
|
|
4
|
Komotar RJ, Otten ML, Gaetan M and
Connolly ES Jr: Radiotherapy plus concomitant and adjuvant
temozolomide for glioblastoma-a critical review. Clin Med Oncol.
2:421–422. 2008.PubMed/NCBI
|
|
5
|
Sturm D, Pfister SM and Jones DTW:
Pediatric gliomas: Current concepts on diagnosis, biology, and
clinical management. J Clin Oncol. 35:2370–2377. 2017. View Article : Google Scholar : PubMed/NCBI
|
|
6
|
Duffau H: Paradoxes of evidence-based
medicine in lower-grade glioma: To treat the tumor or the patient?
Neurology. 91:657–662. 2018. View Article : Google Scholar : PubMed/NCBI
|
|
7
|
Demuth T and Berens ME: Molecular
mechanisms of glioma cell migration and invasion. J Neurooncol.
70:217–228. 2004. View Article : Google Scholar : PubMed/NCBI
|
|
8
|
Yang AS, Estecio MR, Garcia-Manero G,
Kantarjian HM and Issa JP: Comment on ‘Chromosomal instability and
tumors promoted by DNA hypomethylation’ and ‘Induction of tumors in
nice by genomic hypomethylation’. Science. 302:11532003. View Article : Google Scholar : PubMed/NCBI
|
|
9
|
Manel E: CpG island hypermethylation and
tumor suppressor genes: A booming present, a brighter future.
Oncogene. 21:5427–5440. 2002. View Article : Google Scholar : PubMed/NCBI
|
|
10
|
Feinberg AP and Vogelstein B:
Hypomethylation of ras oncogenes in primary human cancers. Biochem
Biophys Res Commun. 111:47–54. 1983. View Article : Google Scholar : PubMed/NCBI
|
|
11
|
Zhang L, Wang M, Wang W and Mo J:
Incidence and prognostic value of multiple gene promoter
methylations in gliomas. J Neurooncol. 116:349–356. 2014.
View Article : Google Scholar : PubMed/NCBI
|
|
12
|
Esteller M, Garcia-Foncillas J, Andion E,
Goodman SN, Hidalgo OF, Vanaclocha V, Baylin SB and Herman JG:
Inactivation of the DNA-repair gene MGMT and the clinical response
of gliomas to alkylating agents. N Engl J Med. 343:1350–1354. 2000.
View Article : Google Scholar : PubMed/NCBI
|
|
13
|
Li X, Pu J, Liu J, Chen Y, Li Y, Hou P,
Shi B and Yang Q: The prognostic value of DAPK1 hypermethylation in
gliomas: A site-specific analysis. Pathol Res Pract. 214:940–948.
2018. View Article : Google Scholar : PubMed/NCBI
|
|
14
|
Arifin MT, Hama S, Kajiwara Y, Sugiyama K,
Saito T, Matsuura S, Yamasaki F, Arita K and Kurisu K: Cytoplasmic,
but not nuclear, p16 expression may signal poor prognosis in
high-grade astrocytomas. J Neurooncol. 77:273–277. 2006. View Article : Google Scholar : PubMed/NCBI
|
|
15
|
Watanabe T, Katayama Y, Yoshino A, Yachi
K, Ohta T, Ogino A, Komine C and Fukushima T: Aberrant
hypermethylation of p14ARF and O6-methylguanine-DNA
methyltransferase genes in astrocytoma progression. Brain Pathol.
17:5–10. 2007. View Article : Google Scholar : PubMed/NCBI
|
|
16
|
Darnay BG, Besse A, Poblenz AT, Lamothe B
and Jacoby JJ: TRAFs in RANK Signaling. Adv Exp Med Biol.
597:152–159. 2007. View Article : Google Scholar : PubMed/NCBI
|
|
17
|
Berdasco M, Ropero S, Setien F, Fraga MF,
Lapunzina P, Losson R, Alaminos M, Cheung NK, Rahman N and Esteller
M: Epigenetic inactivation of the Sotos overgrowth syndrome gene
histone methyltransferase NSD1 in human neuroblastoma and glioma.
Proc Natl Acad Sci USA. 106:21830–21835. 2009. View Article : Google Scholar : PubMed/NCBI
|
|
18
|
Pan Q, Shai O, Lee LJ, Frey BJ and
Blencowe BJ: Deep surveying of alternative splicing complexity in
the human transcriptome by high-throughput sequencing. Nat Genet.
40:1413–1415. 2008. View
Article : Google Scholar : PubMed/NCBI
|
|
19
|
Fernandez AF, Assenov Y, Martin-Subero JI,
Balint B, Siebert R, Taniguchi H, Yamamoto H, Hidalgo M, Tan AC,
Galm O, et al: A DNA methylation fingerprint of 1628 human samples.
Genome Res. 22:407–419. 2012. View Article : Google Scholar : PubMed/NCBI
|
|
20
|
Davis S and Meltzer PS: GEOquery: A bridge
between the Gene Expression Omnibus (GEO) and BioConductor.
Bioinformatics. 23:1846–1847. 2007. View Article : Google Scholar : PubMed/NCBI
|
|
21
|
Ashburner M, Ball CA, Blake JA, Botstein
D, Butler H, Cherry JM, Davis AP, Dolinski K, Dwight SS, Eppig JT,
et al: Gene ontology: Tool for the unification of biology. The Gene
Ontology Consortium. Nat Genet. 25:25–29. 2000. View Article : Google Scholar : PubMed/NCBI
|
|
22
|
Kanehisa M and Goto S: KEGG: Kyoto
Encyclopaedia of Genes and Genomes. Nucleic Acids Res. 28:27–30.
2000. View Article : Google Scholar : PubMed/NCBI
|
|
23
|
Ono K, Muetze T, Kolishovski G, Shannon P
and Demchak B: CyREST: Turbocharging cytoscape access for external
tools via a RESTful API. F1000Res. 4:4782015. View Article : Google Scholar : PubMed/NCBI
|
|
24
|
Bader GD and Hogue CW: An automated method
for finding molecular complexes in large protein interaction
networks. BMC Bioinformatics. 4:22003. View Article : Google Scholar : PubMed/NCBI
|
|
25
|
Tang Z, Li C, Kang B, Gao G, Li C and
Zhang Z: GEPIA: A web server for cancer and normal gene expression
profiling and interactive analyses. Nucleic Acids Res. 45:W98–W102.
2017. View Article : Google Scholar : PubMed/NCBI
|
|
26
|
Ostrom QT, Gittleman H, Farah P, Ondracek
A, Chen Y, Wolinsky Y, Stroup NE, Kruchko C and Barnholtz-Sloan JS:
CBTRUS statistical report: Primary brain and central nervous system
tumors diagnosed in the United States in 2006–2010. Neuro Oncol. 15
(Suppl 2):ii1–ii56. 2013. View Article : Google Scholar : PubMed/NCBI
|
|
27
|
Alexander BM and Cloughesy TF: Adult
Glioblastoma. J Clin Oncol. 35:2402–2409. 2017. View Article : Google Scholar : PubMed/NCBI
|
|
28
|
Bralten LB and French PJ: Genetic
alterations in glioma. Cancers (Basel). 3:1129–1140. 2011.
View Article : Google Scholar : PubMed/NCBI
|
|
29
|
Gaudet F, Hodgson JG, Eden A,
Jackson-Grusby L, Dausman J, Gray JW, Leonhardt H and Jaenisch R:
Induction of tumors in mice by genomic hypomethylation. Science.
300:489–492. 2003. View Article : Google Scholar : PubMed/NCBI
|
|
30
|
Győrffy B, Bottai G, Fleischer T, Munkácsy
G, Budczies J, Paladini L, Børresen-Dale AL, Kristensen VN and
Santarpia L: Aberrant DNA methylation impacts gene expression and
prognosis in breast cancer subtypes. Int J Cancer. 38:87–97. 2016.
View Article : Google Scholar
|
|
31
|
Dai D, Zhou B, Xu W, Jin H and Wang X:
CHFR promoter hypermethylation is associated with gastric cancer
and plays a protective role in gastric cancer process. J Cancer.
10:949–956. 2019. View Article : Google Scholar : PubMed/NCBI
|
|
32
|
Wang ZL, Zhang CB, Cai JQ, Li QB, Wang Z
and Jiang T: Integrated analysis of genome-wide DNA methylation,
gene expression and protein expression profiles in molecular
subtypes of WHO II–IV gliomas. J Exp Clin Cancer Res. 34:1272015.
View Article : Google Scholar : PubMed/NCBI
|
|
33
|
Johnstone RW, Ruefli AA and Lowe SW:
Apoptosis: A link between cancer genetics and chemotherapy. Cell.
108:153–164. 2002. View Article : Google Scholar : PubMed/NCBI
|
|
34
|
Schlabach MR, Luo J, Solimini NL, Hu G, Xu
Q, Li MZ, Zhao Z, Smogorzewska A, Sowa ME, Ang XL, et al: Cancer
proliferation gene discovery through functional genomics. Science.
319:620–624. 2008. View Article : Google Scholar : PubMed/NCBI
|
|
35
|
Lu P, Weaver VM and Werb Z: The
extracellular matrix: A dynamic niche in cancer progression. J Cell
Biol. 196:395–406. 2012. View Article : Google Scholar : PubMed/NCBI
|
|
36
|
Chen DS and Mellman I: Oncology meets
immunology: The cancer-immunity cycle. Immunity. 39:1–10. 2013.
View Article : Google Scholar : PubMed/NCBI
|
|
37
|
Lippitz BE: Cytokine patterns in patients
with cancer: A systematic review. Lancet Oncol. 14:e218–e228. 2013.
View Article : Google Scholar : PubMed/NCBI
|
|
38
|
Fresno Vara JA, Casado E, de Castro J,
Cejas P, Belda-Iniesta C and González-Barón M: PI3K/Akt signalling
pathway and cancer. Cancer Treat Rev. 30:193–204. 2004. View Article : Google Scholar : PubMed/NCBI
|
|
39
|
Majewska E and Szeliga M: AKT/GSK3β
signaling in glioblastoma. Neurochem Res. 42:918–924. 2017.
View Article : Google Scholar : PubMed/NCBI
|
|
40
|
Burdon T, Smith A and Savatier P:
Signalling, cell cycle and pluripotency in embryonic stem cells.
Trends Cell Biol. 12:432–438. 2002. View Article : Google Scholar : PubMed/NCBI
|
|
41
|
Doi A, Park IH, Wen B, Murakami P, Aryee
MJ, Irizarry R, Herb B, Ladd-Acosta C, Rho J, Loewer S, et al:
Differential methylation of tissue- and cancer-specific CpG island
shores distinguishes human induced pluripotent stem cells,
embryonic stem cells and fibroblasts. Nat Genet. 41:1350–1353.
2009. View
Article : Google Scholar : PubMed/NCBI
|
|
42
|
Sood AK, Coffin JE, Schneider GB, Fletcher
MS, DeYoung BR, Gruman LM, Gershenson DM, Schaller MD and Hendrix
MJ: Biological significance of focal adhesion kinase in ovarian
cancer: Role in migration and invasion. Am J Pathol. 165:1087–1095.
2004. View Article : Google Scholar : PubMed/NCBI
|
|
43
|
Luo M and Guan JL: Focal adhesion kinase:
A prominent determinant in breast cancer initiation, progression
and metastasis. Cancer Lett. 289:127–139. 2010. View Article : Google Scholar : PubMed/NCBI
|
|
44
|
Cao F, Zhang Q, Chen W, Han C, He Y, Ran Q
and Yao S: IL-6 increases SDCBP expression, cell proliferation, and
cell invasion by activating JAK2/STAT3 in human glioma cells. Am J
Transl Res. 9:4617–4626. 2017.PubMed/NCBI
|
|
45
|
Samaras V, Piperi C, Korkolopoulou P,
Zisakis A, Levidou G, Themistocleous MS, Boviatsis EI, Sakas DE,
Lea RW, Kalofoutis A and Patsouris E: Application of the ELISPOT
method for comparative analysis of interleukin (IL)-6 and IL-10
secretion in peripheral blood of patients with astroglial tumors.
Mol Cell Biochem. 304:343–351. 2007. View Article : Google Scholar : PubMed/NCBI
|
|
46
|
Xue Q, Cao L, Chen XY, Zhao J, Gao L, Li
SZ and Fei Z: High expression of MMP9 in glioma affects cell
proliferation and is associated with patient survival rates. Oncol
Lett. 13:1325–1330. 2017. View Article : Google Scholar : PubMed/NCBI
|
|
47
|
Carpten JD, Faber AL, Horn C, Donoho GP,
Briggs SL, Robbins CM, Hostetter G, Boguslawski S, Moses TY, Savage
S, et al: A transforming mutation in the pleckstrin homology domain
of AKT1 in cancer. Nature. 448:439–444. 2007. View Article : Google Scholar : PubMed/NCBI
|
|
48
|
Holland EC, Celestino J, Dai C, Schaefer
L, Sawaya RE and Fuller GN: Combined activation of Ras and Akt in
neural progenitors induces glioblastoma formation in mice. Nat
Genet. 25:55–57. 2000. View
Article : Google Scholar : PubMed/NCBI
|
|
49
|
Kjær IM, Olsen DA, Alnor A, Brandslund I,
Bechmann T and Madsen JS: EGFR and EGFR ligands in serum in healthy
women; reference intervals and age dependency. Clin Chem Lab Med.
Jul 16–2019.doi: 10.1515/cclm-2019-0376 (Epub ahead of print).
View Article : Google Scholar
|
|
50
|
Thorne AH, Zanca C and Furnari F:
Epidermal growth factor receptor targeting and challenges in
glioblastoma. Neuro Oncol. 18:914–918. 2016. View Article : Google Scholar : PubMed/NCBI
|
|
51
|
Hai L, Zhang C, Li T, Zhou X, Liu B, Li S,
Zhu M, Lin Y, Yu S, Zhang K, et al: Notch1 is a prognostic factor
that is distinctly activated in the classical and proneural subtype
of glioblastoma and that promotes glioma cell survival via the
NF-κB(p65) pathway. Cell Death Dis. 9:1582018. View Article : Google Scholar : PubMed/NCBI
|
|
52
|
Sarkar S, Mirzaei R, Zemp FJ, Wei W,
Senger DL, Robbins SM and Yong VW: Activation of NOTCH signaling by
Tenascin-C promotes growth of human brain tumor-initiating cells.
Cancer Res. 77:3231–3243. 2017. View Article : Google Scholar : PubMed/NCBI
|
|
53
|
Li MY, Peng WH, Wu CH, Chang YM, Lin YL,
Chang GD, Wu HC and Chen GC: PTPN3 suppresses lung cancer cell
invasiveness by counteracting Src-mediated DAAM1 activation and
actin polymerization. Oncogene. Aug 12–2019.doi:
10.1038/s41388-019-0948-6 (Epub ahead of print). View Article : Google Scholar
|
|
54
|
Guryanova OA, Wu Q, Cheng L, Lathia JD,
Huang Z, Yang J, MacSwords J, Eyler CE, McLendon RE, Heddleston JM,
et al: Nonreceptor tyrosine kinase BMX maintains self-renewal and
tumorigenic potential of glioblastoma stem cells by activating
STAT3. Cancer Cell. 19:498–511. 2011. View Article : Google Scholar : PubMed/NCBI
|
|
55
|
Tong L, Wang Y, Ao Y and Sun X: CREB1
induced lncRNA HAS2-AS1 promotes epithelial ovarian cancer
proliferation and invasion via the miR-466/RUNX2 axis. Biomed
Pharmacother. 115:1088912019. View Article : Google Scholar : PubMed/NCBI
|
|
56
|
Dong H, Cao W and Xue J: Long noncoding
FOXD2-AS1 is activated by CREB1 and promotes cell proliferation and
metastasis in glioma by sponging miR-185 through targeting AKT1.
Biochem Biophys Res Commun. 508:1074–1081. 2019. View Article : Google Scholar : PubMed/NCBI
|
|
57
|
Mukherjee S, Tucker-Burden C, Kaissi E,
Newsam A, Duggireddy H, Chau M, Zhang C, Diwedi B, Rupji M, Seby S,
et al: CDK5 Inhibition resolves PKA/cAMP-independent activation of
CREB1 signaling in glioma stem cells. Cell Rep. 23:1651–1664. 2018.
View Article : Google Scholar : PubMed/NCBI
|
|
58
|
Brennan PJ, Kumagai T, Berezov A, Murali R
and Greene MI: HER2/Neu: Mechanisms of
dimerization/oligomerization. Oncogene. 19:6093–6101. 2000.
View Article : Google Scholar : PubMed/NCBI
|
|
59
|
Kim YH, Tran TA, Lee HJ, Jung SI, Lee JJ,
Jang WY, Moon KS, Kim IY, Jung S and Jung TY: Branched multipeptide
immunotherapy for glioblastoma using human leukocyte
antigen-A*0201-restricted cytotoxic T-lymphocyte epitopes from
ERBB2, BIRC5 and CD99. Oncotarget. 7:50535–50547. 2016.PubMed/NCBI
|
|
60
|
Bagnjuk K, Kast VJ, Tiefenbacher A,
Kaseder M, Yanase T, Burges A, Kunz L, Mayr D and Mayerhofer A:
Inhibitor of apoptosis proteins are potential targets for treatment
of granulosa cell tumors-implications from studies in KGN. J
Ovarian Res. 12:762019. View Article : Google Scholar : PubMed/NCBI
|
|
61
|
Arman K, Ergün S, Temiz E and Öztuzcu S:
The interrelationship between HER2 and CASP3/8 with apoptosis in
different cancer cell lines. Mol Biol Rep. 41:8031–8036. 2014.
View Article : Google Scholar : PubMed/NCBI
|
|
62
|
Michaelsen SR, Urup T, Olsen LR, Broholm
H, Lassen U and Poulsen HS: Molecular profiling of short-term and
long-term surviving patients identifies CD34 mRNA level as
prognostic for glioblastoma survival. J Neurooncol. 137:533–542.
2018. View Article : Google Scholar : PubMed/NCBI
|