Introduction
Breast cancer is one of the most common types of
malignant tumor in women worldwide (1). With >2 million new cases diagnosed
in 2018 worldwide, the incidence rate of breast cancer is
increasing year by year (2).
According to the statistics of 2014, China accounts for 12.2% of
newly diagnosed cases and 9.6% of deaths worldwide (3). The survival time of breast cancer has
been prolonged with the development of early detection and modern
treatment technology (4). At
present, the prognosis of breast cancer is mainly evaluated by
clinicopathological characteristics, including as age, tumor size,
lymph node metastasis and histological grade (5). Breast cancer is a highly heterogeneous
tumor at the molecular level. Based on the expression levels of
estrogen receptor (ER), progesterone receptor, HER2 and Ki-67
protein, breast cancer is classified into Luminal A, Luminal B,
HER2 overexpression and Basal-like types (6–8). The
genetic heterogeneity of breast cancer leads to different
therapeutic effects and prognosis of patients with the same
pathological type and clinical stage under identical clinical
treatment (9,10). Therefore, large-scale genomic studies
on the pathogenesis and prognosis of breast cancer have become a
hotspot (11). Screening genes for
early diagnosis, genotyping and prognosis of breast cancer by gene
chip technology is of great significance for guiding individualized
treatment and improving prognosis (12).
Breast cancer is a multigenic disease with a
multifactorial etiology, and the occurrence of breast cancer is a
complicated multistep process (13,14), in
which numerous signaling pathways are altered to some extent.
Her-2, as an important prognostic factor of breast cancer, is vital
for the Ras signaling pathway (15).
McGlynn et al (16) used
immunohistochemistry to detect the activation of MAPK pathway and
revealed the patients had lower activation of MAPK pathway after
receiving more effective chemotherapy and endocrine therapy. Wnt
signaling pathway, involved in the development of early embryonic
mammary gland, leads to the occurrence of breast cancer when
abnormally activated (17). Shao
et al (18) found that
blocking the expression of β-catenin in Wnt signaling pathway could
induce apoptosis of breast cancer cells. Although much progress has
been made in this area, the molecular pathogenesis of breast cancer
remains not fully understood. The majority of studies use only one
set of mRNA expression chip data from either experimental studies
(19) or databases (20) to perform analysis of breast cancer,
which may have an impact on the analysis results. The present study
integrated data from multiple chip platforms and eliminated batch
effect for preprocessing by using various function packages of R.
In addition, pathway and biological target analysis was performed,
and may identify areas for the prevention, clinical treatment and
prognosis of breast cancer.
Materials and methods
Gene expression profiles
Gene expression profiles were selected from the Gene
Expression Omnibus (GEO) database (https://www.ncbi.nlm.nih.gov/geo) using the following
criteria: i) The samples were breast cancer and normal tissues from
Homo sapiens; ii) gene expression levels were detected using
the Affymetrix Human Genome U133 Plus 2.0 Array (GEO ref. no.
GPL570; Thermo Fisher Scientific, Inc.). A total of three datasets
(accession nos. GSE29431 (21),
GSE42568 (22) and GSE61304
(23,24)) were downloaded. The sample
characteristics of the three datasets are shown in Table I.
 | Table I.Sample characteristics of the three
gene expression datasets used in the present study. |
Table I.
Sample characteristics of the three
gene expression datasets used in the present study.
|
|
| Characteristic |
|---|
|
|
|
|
|---|
| GEO ID | Sample size, n | Tumor tissue, n
(case) | Breast normal
tissue, n (control) |
|---|
| GSE29431 | 66 | 54 | 12 |
| GSE42568 | 121 | 104 | 17 |
| GSE61304 | 62 | 58 | 4 |
Gene expression preprocessing
To remove the effect induced by biological
replicates within a specific dataset and to correct the batch
effect among different datasets, intra- and inter-group
normalization were performed using R Bioconductor (version 3.6;
http://www.bioconductor.org), Affymetrix
microarray analysis (25) and
surrogate variable analysis (sva) packages (26), respectively. The affy R package was
applied to each specific dataset for normalization followed by
background correction using a robust multi-array (RMA) method
(27) and
log2-transformation. The sva package was designed for
the removal of batch effects and other unwanted variation in
high-throughput experiments, such as the experimental conditions,
through identifying and estimating surrogate variables for unknown
sources, removing known batch effects using the ComBat function of
sva package (28) or removing batch
effects with known control probes. In the present study, the sva
package was used to remove all potential batch effects among the
three datasets. Probe IDs were then annotated to gene symbols
according to GPL570 annotation information. The expression values
of genes annotated by more than one probe ID were summarized.
Differential expression analysis
The expression datasets were combined, and the
expression matrix consisting of 216 breast cancer tissue samples
and 33 normal tissue samples was obtained. The differentially
expressed genes (DEGs) in breast cancer samples compared with
normal tissue samples were then identified using the R Bioconductor
limma package (version 3.4.0; http://bioconductor.org/packages/release/bioc/html/limma.html)
(29) with the thresholds of fold
change >2 (upregulated) or <0.5 (downregulated) and false
discovery rate <0.05.
Enrichment analysis
Kyoto Encyclopedia of Genes and Genomes (KEGG)
pathways potentially involved in breast cancer initiation and
progression were identified using the R Bioconductor
clusterProfiler package (version 3.10) (30) with a threshold of P<0.05.
Additionally, the associations between significantly enriched
pathways and expression profile alterations of the genes in these
pathways were explored using the R Bioconductor enrichplot package
(version 1.4; http://github.com/GuangchuangYu/enrichplot). Gene
Ontology (GO) enrichment analysis of differentially expressed genes
in breast cancer was performed through the Database for Annotation,
Visualization, and Integrated Discovery (DAVID; http://david.ncifcrf.gov/). The Biological Processes
(BP) terms were obtained, and the final result was visualized by
the enrichMap function in Cytoscape software.
Construction of disease-specific
network
The breast cancer-specific network containing the
interactions among the DEGs was constructed using the Search Tool
for the Retrieval of Interacting Genes/Proteins (STRING) database
(version 11.0; http://string-db.org). Scores between
0 and 1 were assigned to the interaction pairs deposited in STRING
according to their methods, such as bioinformatics prediction,
high-throughput gene microarray and immunoprecipitation. In the
present study, only interacting pairs with combined scores >0.4
were considered as reliable. Additionally, to highlight the network
modules that represented stronger interactions among genes from the
whole network, module analysis was applied to the breast
cancer-specific network via the enrichmentMap and MCODE plug-in for
Cytoscape software (version 3.5.1) (31).
Evaluation of the association between
hub genes and breast cancer prognosis
Prognosis is an important indicator to assess drug
effectiveness and relations between gene expression and disease
progression. In the present study, the Kaplan-Meier plotter
database (www.kmplot.com), which contains the
genome-wide gene expression profiles of >5,000 breast cancer
samples, was used to evaluate associations between hub genes and
breast cancer prognosis. The samples were classified into two
groups according to the upper quartile expression value of a
specific gene, and overall survival (OS) differences between the
high expression and the low expression group were explored using
the log-rank test. P<0.05 was considered to indicate a
statistically significant difference.
Cell culture, RNA extraction and
reverse transcription-quantitative PCR (RT-qPCR)
The normal breast epithelial (MCF10A) and breast
cancer (MDA-MB-231) cells used in the present study were purchased
from the American Type Culture Collection. The cells were cultured
at a density of 2×10⁴ cells/cm2 in 100-mm
tissue culture dishes (Corning Inc.) with DMEM medium (Solarbio
Science & Technology Co., Ltd.) containing 10% (v/v) FBS and
100 mg/ml penicillin-streptomycin (all Gibco; Thermo Fisher
Scientific, Inc.) at 37°C in a humidified incubator with 5%
CO2. All cells were passaged once after reaching
confluence with 0.25% trypsin-EDTA solution (Sigma-Aldrich; Merck
KGaA).
Total RNA was extracted from MCF10A and MDA-MB-231
cells using TRIzol® reagent (Invitrogen; Thermo Fisher
Scientific, Inc.) according to the manufacturer's protocol. A
NanoDrop-1000 spectrophotometer (Thermo Fisher Scientific, Inc.)
was used to quantify RNA by measuring the optical density, and the
purity was assessed by determining the OD260/OD280 ratio and
samples with a ratio between 1.9 and 2.0 were considered to be
pure. The RNA samples were reverse transcribed to cDNA using
SuperScript™ IV First-Strand Synthesis System (Invitrogen; Thermo
Fisher Scientific, Inc.), with the temperature protocol of 25°C for
10 min, 42°C for 50 min, 70°C for 15 min, and 4°C for cooling. The
cDNA samples were diluted in diethyl pyrocarbonate-treated water at
a ratio of 1:5. qPCR was then performed using a LightCycler 480
SYBR Green I master kit (Roche Applied Science) for 38 cycles of
95°C for 30 sec, 58°C for 50 sec, and 72°C for 1 min. β-actin was
used as an endogenous control gene, and all primers used are listed
in Table II. All samples were run
in triplicate on the ABI 7900HT Real-Time PCR system (Applied
Biosystems; Thermo Fisher Scientific, Inc.). Calculation of
relative expression levels was performed using the 2−ΔΔq
method (32).
| Table II.Primer sequences for quantitative
PCR. |
Table II.
Primer sequences for quantitative
PCR.
| Gene | Primer sequence
(5′-3′) | Product length,
bp | Temperature,
°C |
|---|
| ACACB | F:
CAAGCCGATCACCAAGAGTAAA | 79 | 59 |
|
| R:
CCCTGAGTTATCAGAGGCTGG |
|
|
| ACADM | F:
ACAGGGGTTCAGACTGCTATT | 240 | 58 |
|
| R:
TCCTCCGTTGGTTATCCACAT |
|
|
| ACDC | F:
TGCTGGGAGCTGTTCTACTG | 248 | 59 |
|
| R:
TACTCCGGTTTCACCGATGTC |
|
|
| ACSS2 | F:
AAAGGAGCAACTACCAACATCTG | 159 | 59 |
|
| R:
GCTGAACTGACACACTTGGAC |
|
|
| PCK1 | F:
AAAACGGCCTGAACCTCTCG | 98 | 60 |
|
| R:
ACACAGCTCAGCGTTATTCTC |
|
|
| PLIN1 | F:
TGTGCAATGCCTATGAGAAGG | 154 | 59 |
|
| R:
AGGGCGGGGATCTTTTCCT |
|
|
| β-actin | F:
AGCGAGCATCCCCCAAAGTT | 285 | 60 |
|
| R:
GGGCACGAAGGCTCATCATT |
|
|
Statistical analysis
The data for survival analysis was downloaded from
The Cancer Genome Atlas (TCGA) dataset (www.cancergenome.nih.gov). The survival analysis and
Kaplan-Meier curves plotting were conducted by using survival and
survminer packages in R language. All data are expressed as the
mean ± standard deviation unless otherwise indicated. There were
five samples per group included in order to obtain the statistical
results. Comparisons between multiple groups were evaluated using
one-way ANOVA, followed by Tukey's honestly significant difference
test in GraphPad Prism version 5.0 software (GraphPad Software,
Inc.). P<0.05 was considered to indicate a statistically
significant difference.
Results
DEGs
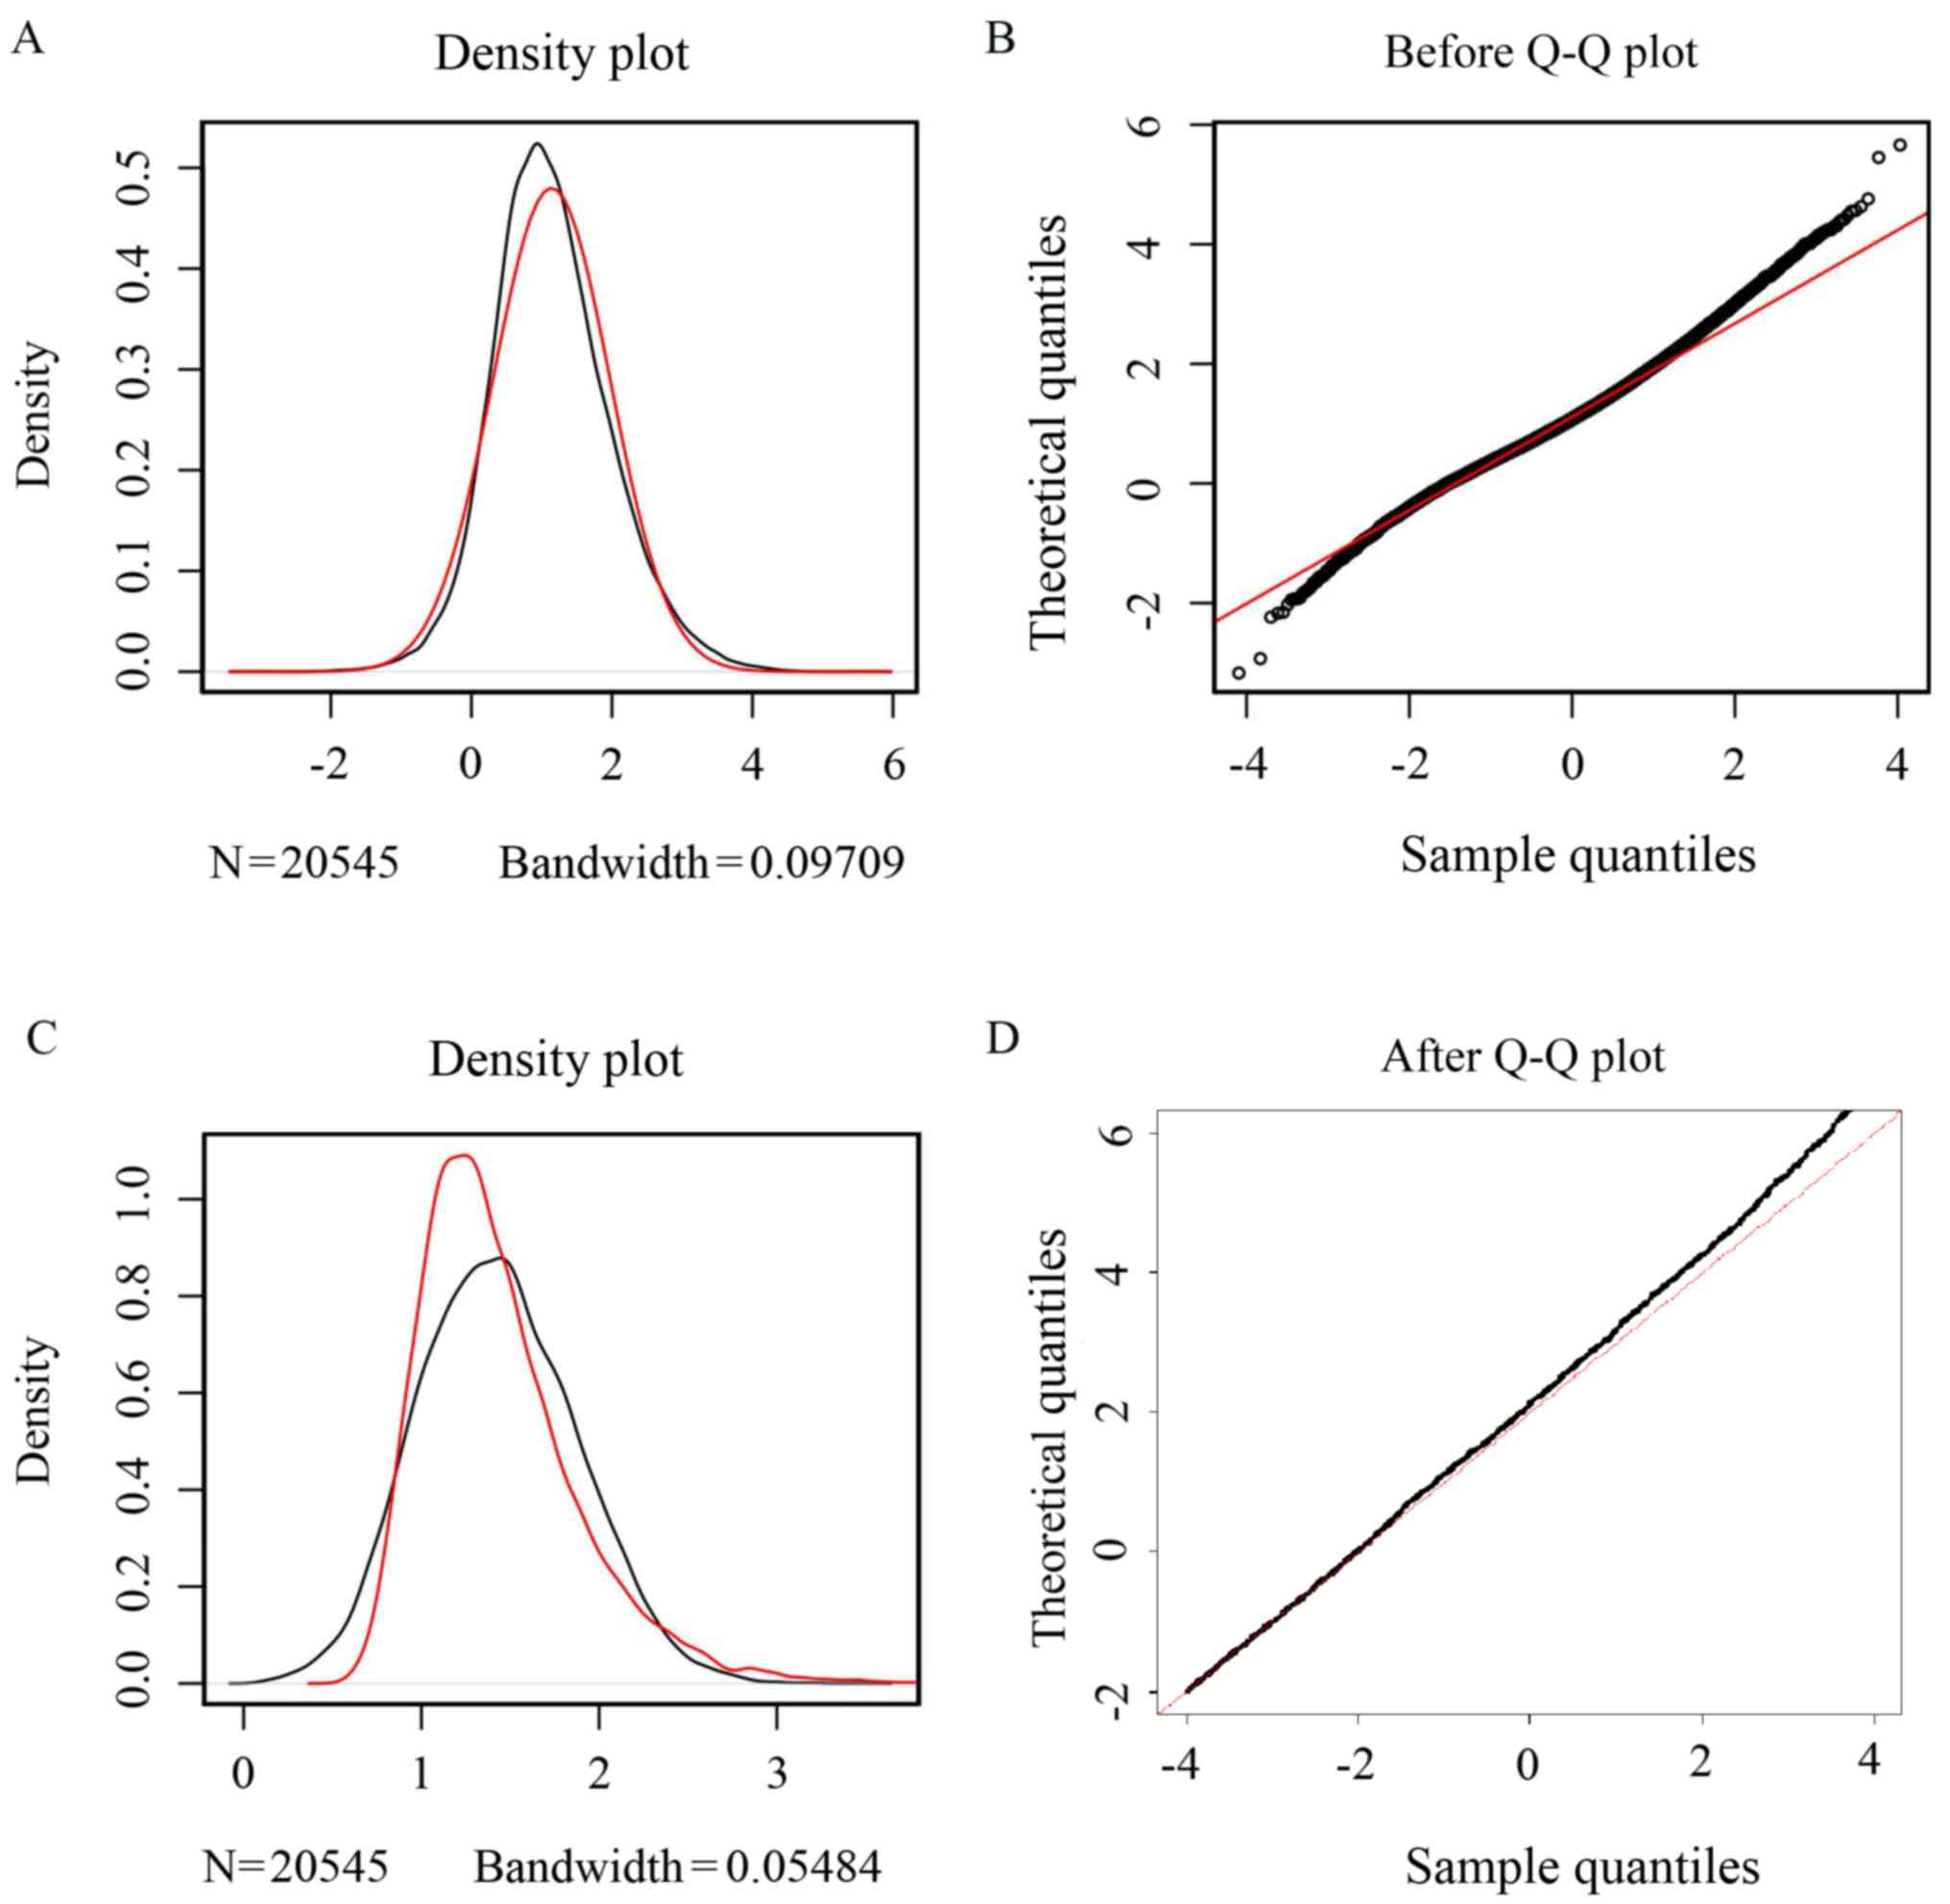
The expression value distributions before and after
correcting the batch effect for the combined datasets are presented
in Fig. 1A-D, respectively. The
density plot of the gene expression distribution (Fig. 1A and C) indicated that the
differences in expression value between breast cancer and normal
tissue samples were magnified by batch effect correction.
Additionally, the quantile-quantile (Q-Q) plots (Fig. 1B and D) revealed that the distance
between dots and the normal distribution line became closer after
the batch effect was removed. Therefore, the gene expression
datasets after normalization should have been reliable for the
subsequent analysis. Differential expression analysis identified a
total of 1,110 DEGs (335 upregulated and 775 downregulated) in
breast cancer samples compared with normal tissue samples. The mean
expression values of those genes in the control and tumor samples
across the three datasets are shown in Table SI.
Significantly enriched KEGG
pathways
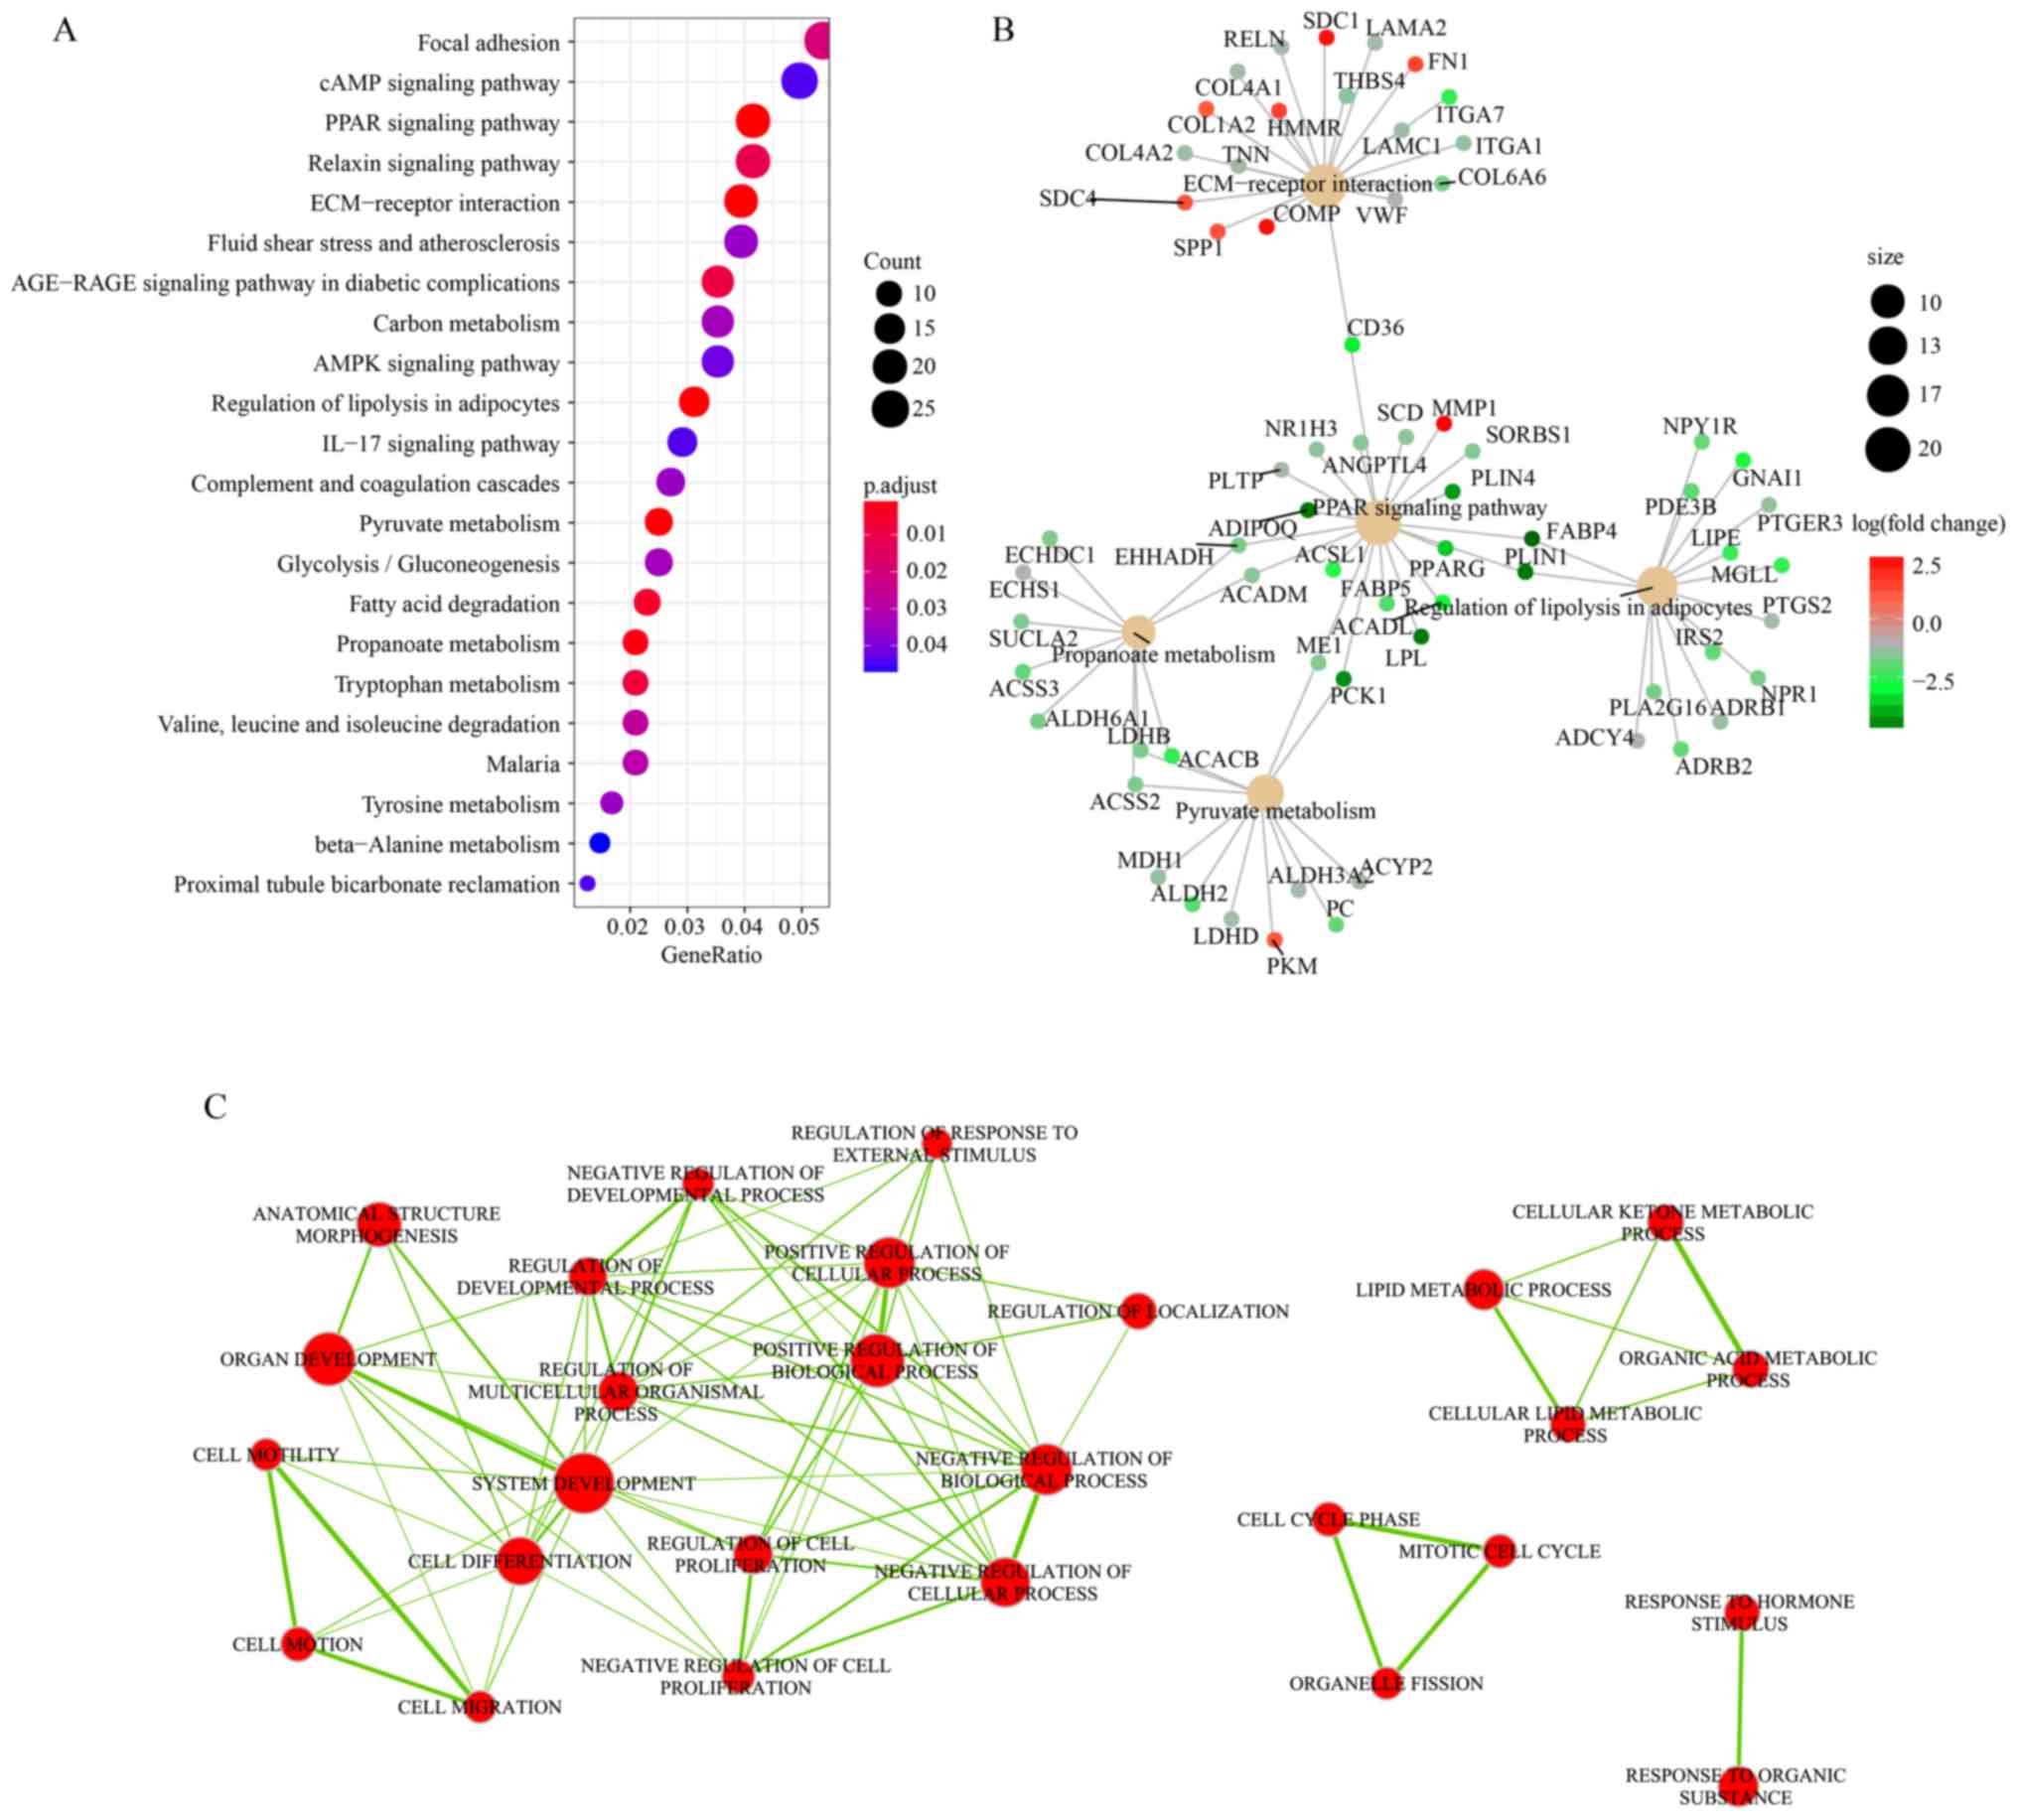
As shown in Fig. 2A,
22 KEGG pathways were enriched with the DEGs identified following
the batch effect correction. The top five KEGG pathways included
‘focal adhesion’, ‘cAMP signaling pathway’, ‘peroxisome
proliferator-activated receptors (PPAR) signaling pathway’,
‘relaxin signaling pathway’, and ‘extracellular matrix
(ECM)-receptor interaction’. The intersecting KEGG pathways were
visualized according to overlapping gene sets. As shown in Fig. 2B, five KEGG pathways were connected
by 10 genes, including CD36, enoyl-CoA hydratase and 3-hydroxyacyl
CoA dehydrogenase (EHHADH), acyl-CoA dehydrogenase medium chain
(ACADM), malic enzyme 1 (ME1), phosphoenolpyruvate carboxykinase 1
(PCK1), fatty acid binding protein 4 (FABP4), perilipin 1 (PLIN1),
acyl-CoA synthetase short chain family member 2 (ACSS2), lactate
dehydrogenase B (LDHB) and acetyl-CoA carboxylase β (ACACB). These
10 genes were considered to be hub genes, and all of them were
downregulated (shown as green nodes) in breast cancer samples. The
core of the intersected KEGG pathways was the ‘PPAR signaling
pathway’. Additionally, the majority of the genes contained in
‘propanoate metabolism’ (9/10), ‘pyruvate metabolism’ (11/12) and
‘regulation of lipolysis in adipocytes’ (13/15) were downregulated
(shown as green nodes) in breast cancer samples, whereas more
upregulated (red nodes) genes were contained in the ‘ECM-receptor
interaction pathway’ (7/19).
Gene Ontology (GO) is another important gene
functions analysis method that could intuitively uncover biological
processes, molecular functions and cellular component terms closely
associated with a list of genes. A total of four GO term clusters
were identified by GO enrichment analysis combined with crosstalk
analysis. The clusters were mainly associated with biological
process regulation, substance metabolism, cell cycle and response
to stimulus (Fig. 2C).
Associations between hub gene
expression and breast cancer OS
In the present study, genes shared by at least two
pathways were considered to serve potential roles in breast cancer
development and considered to be hub genes. The association between
the expression levels of the10 genes and the survival rate of
breast cancer was investigated by Kaplan-Meier survival analysis.
The results indicated that increased expression levels of ACACB,
ACADM, adiponectin, C1Q and collagen domain containing (ACDC),
ACSS2, PCK1 and PLIN1 were significantly associated with improved
breast cancer prognosis (Fig. 3),
which illustrates their potential as tumor suppressor genes.
Tables SII and SIII illustrate the associations between
these hub genes and common breast cancer clinicopathologic
features, including age, sex, ethnicity and survival status in
addition to Tumor-Node-Metastasis (TNM) stage (33). RT-qPCR was performed to validate the
expression levels of ACACB, ACADM, ACDC, ACSS2, PCK1 and PLIN1 in
breast cancer MDA-MB-231 and normal breast epithelial MCF10A cell
lines. As shown in Fig. 4, the
results revealed that the expression levels of the six hub genes
were all downregulated in the MDA-MB-231 cells compared with in the
MCF10A cells. Among them, the differences for ACACB, ACSS2, PCK1
and PLIN1 were all significant.
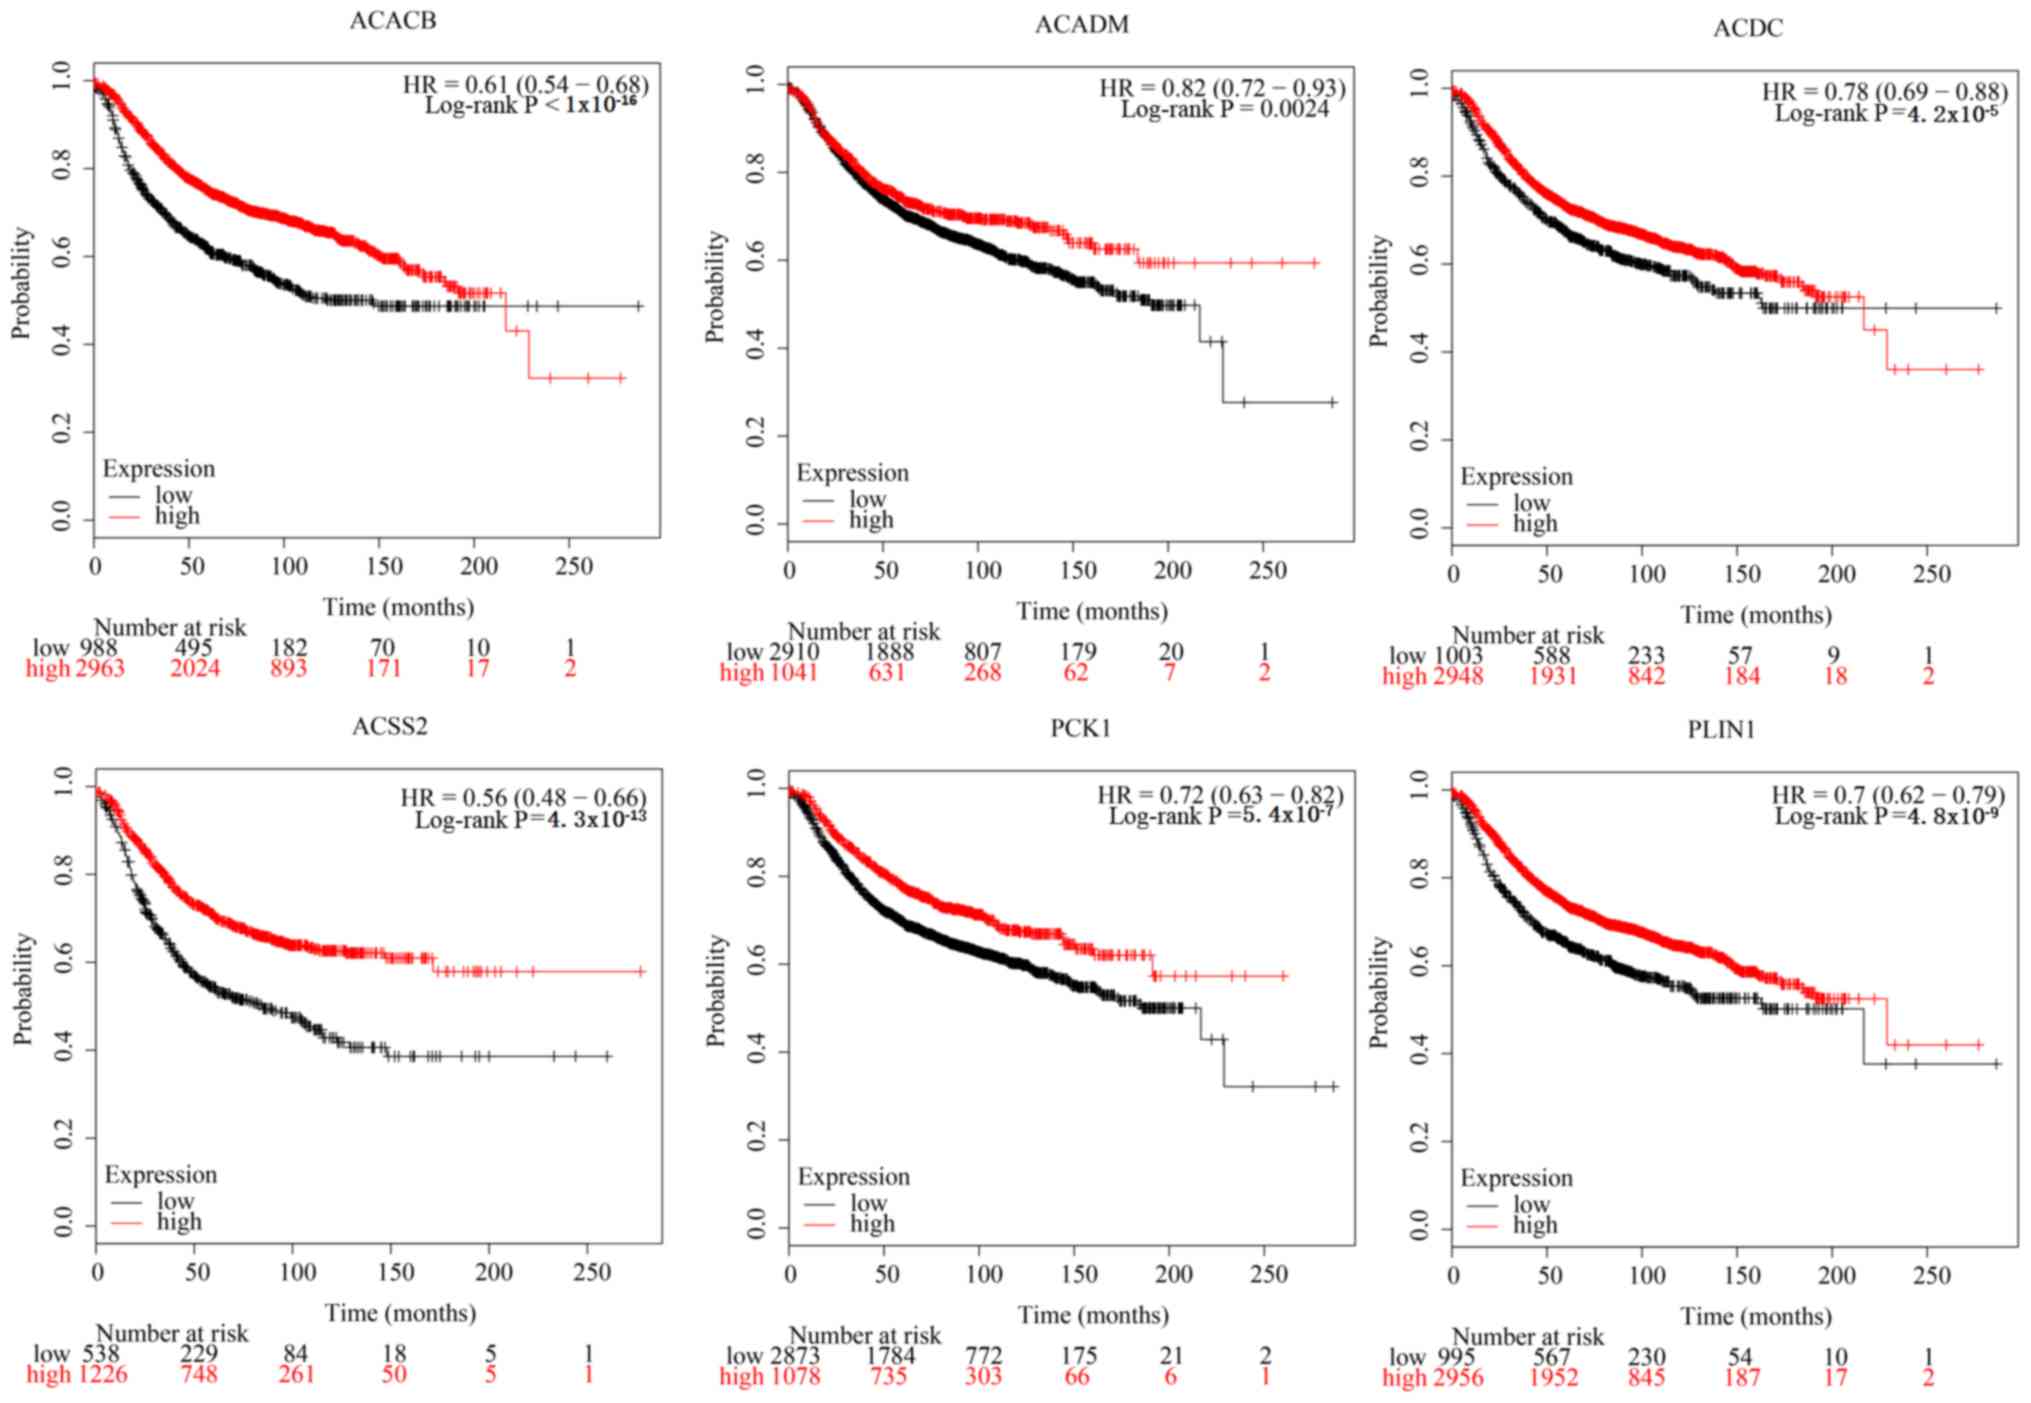 | Figure 3.Kaplan-Meier survival curves of
samples in the Kaplan-Meier plotter database stratified by
expression values of ACACB, ACADM, ACDC, ACSS2, PCK1 and PLIN1. HR,
hazard ratio; ACACB, acetyl-CoA carboxylase β; ACADM, acyl-CoA
dehydrogenase medium chain; ACDC, adiponectin, C1Q and collagen
domain containing; ACSS2, acyl-CoA synthetase short chain family
member 2; PCK1, phosphoenolpyruvate carboxykinase 1; PLIN1,
perilipin 1. |
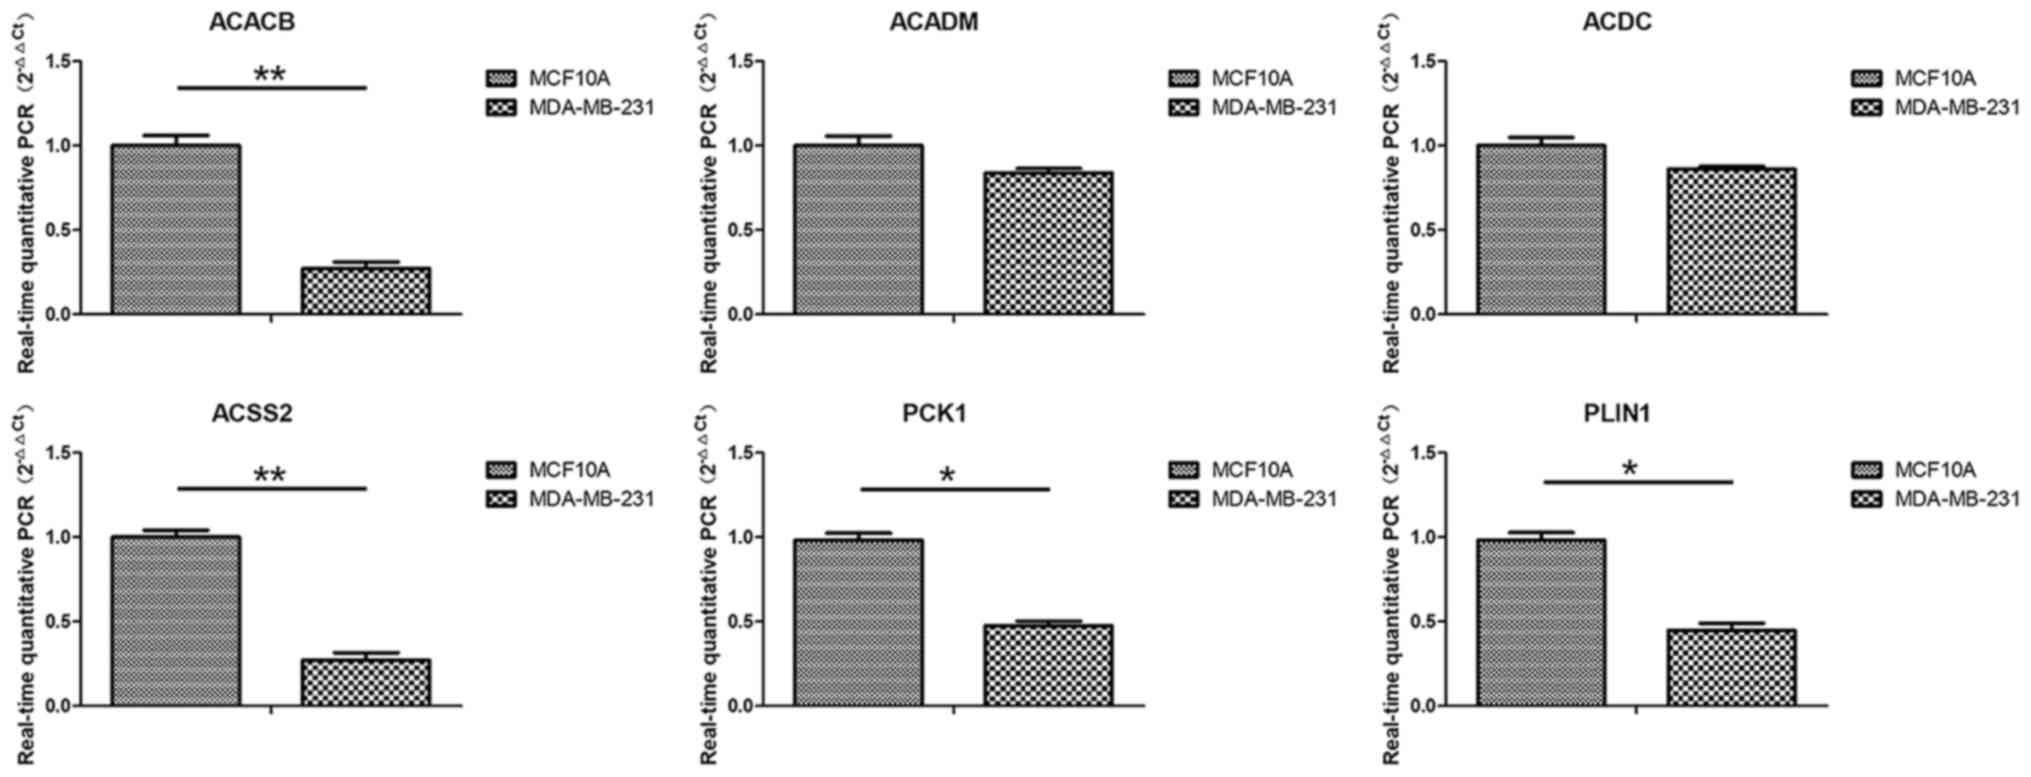 | Figure 4.Expression levels of hub genes
(ACACB, ACADM, ACDC, ACSS2, PCK1 and PLIN1) in normal and tumor
cell lines were evaluated using RT-qPCR. The expression levels were
measured and normalized to β-actin. The gene expression levels of
MDA-MB-231 cells were compared with those of MCF10A cells. The data
are presented as the mean ± SD, n=3. *P<0.05; **P<0.01, as
indicated. ACACB, acetyl-CoA carboxylase β; ACADM, acyl-CoA
dehydrogenase medium chain; ACDC, adiponectin, C1Q and collagen
domain containing; ACSS2, acyl-CoA synthetase short chain family
member 2; PCK1, phosphoenolpyruvate carboxykinase 1; PLIN1,
perilipin 1; RT-qPCR, real-time-quantitative PCR. |
Subsequently, the prognosis values of the six hub
genes were validated based on the TCGA-BRCA dataset (Fig. S1). In addition, Kaplan-Meier
analysis for those six hub genes in triple-negative breast cancer
(TNBC) samples indicated the same impact of genes ACACB, ACADM and
ACSS2, whose increased expression significantly associated with
worse TNBC prognosis, on TNBC prognosis (Fig. S2).
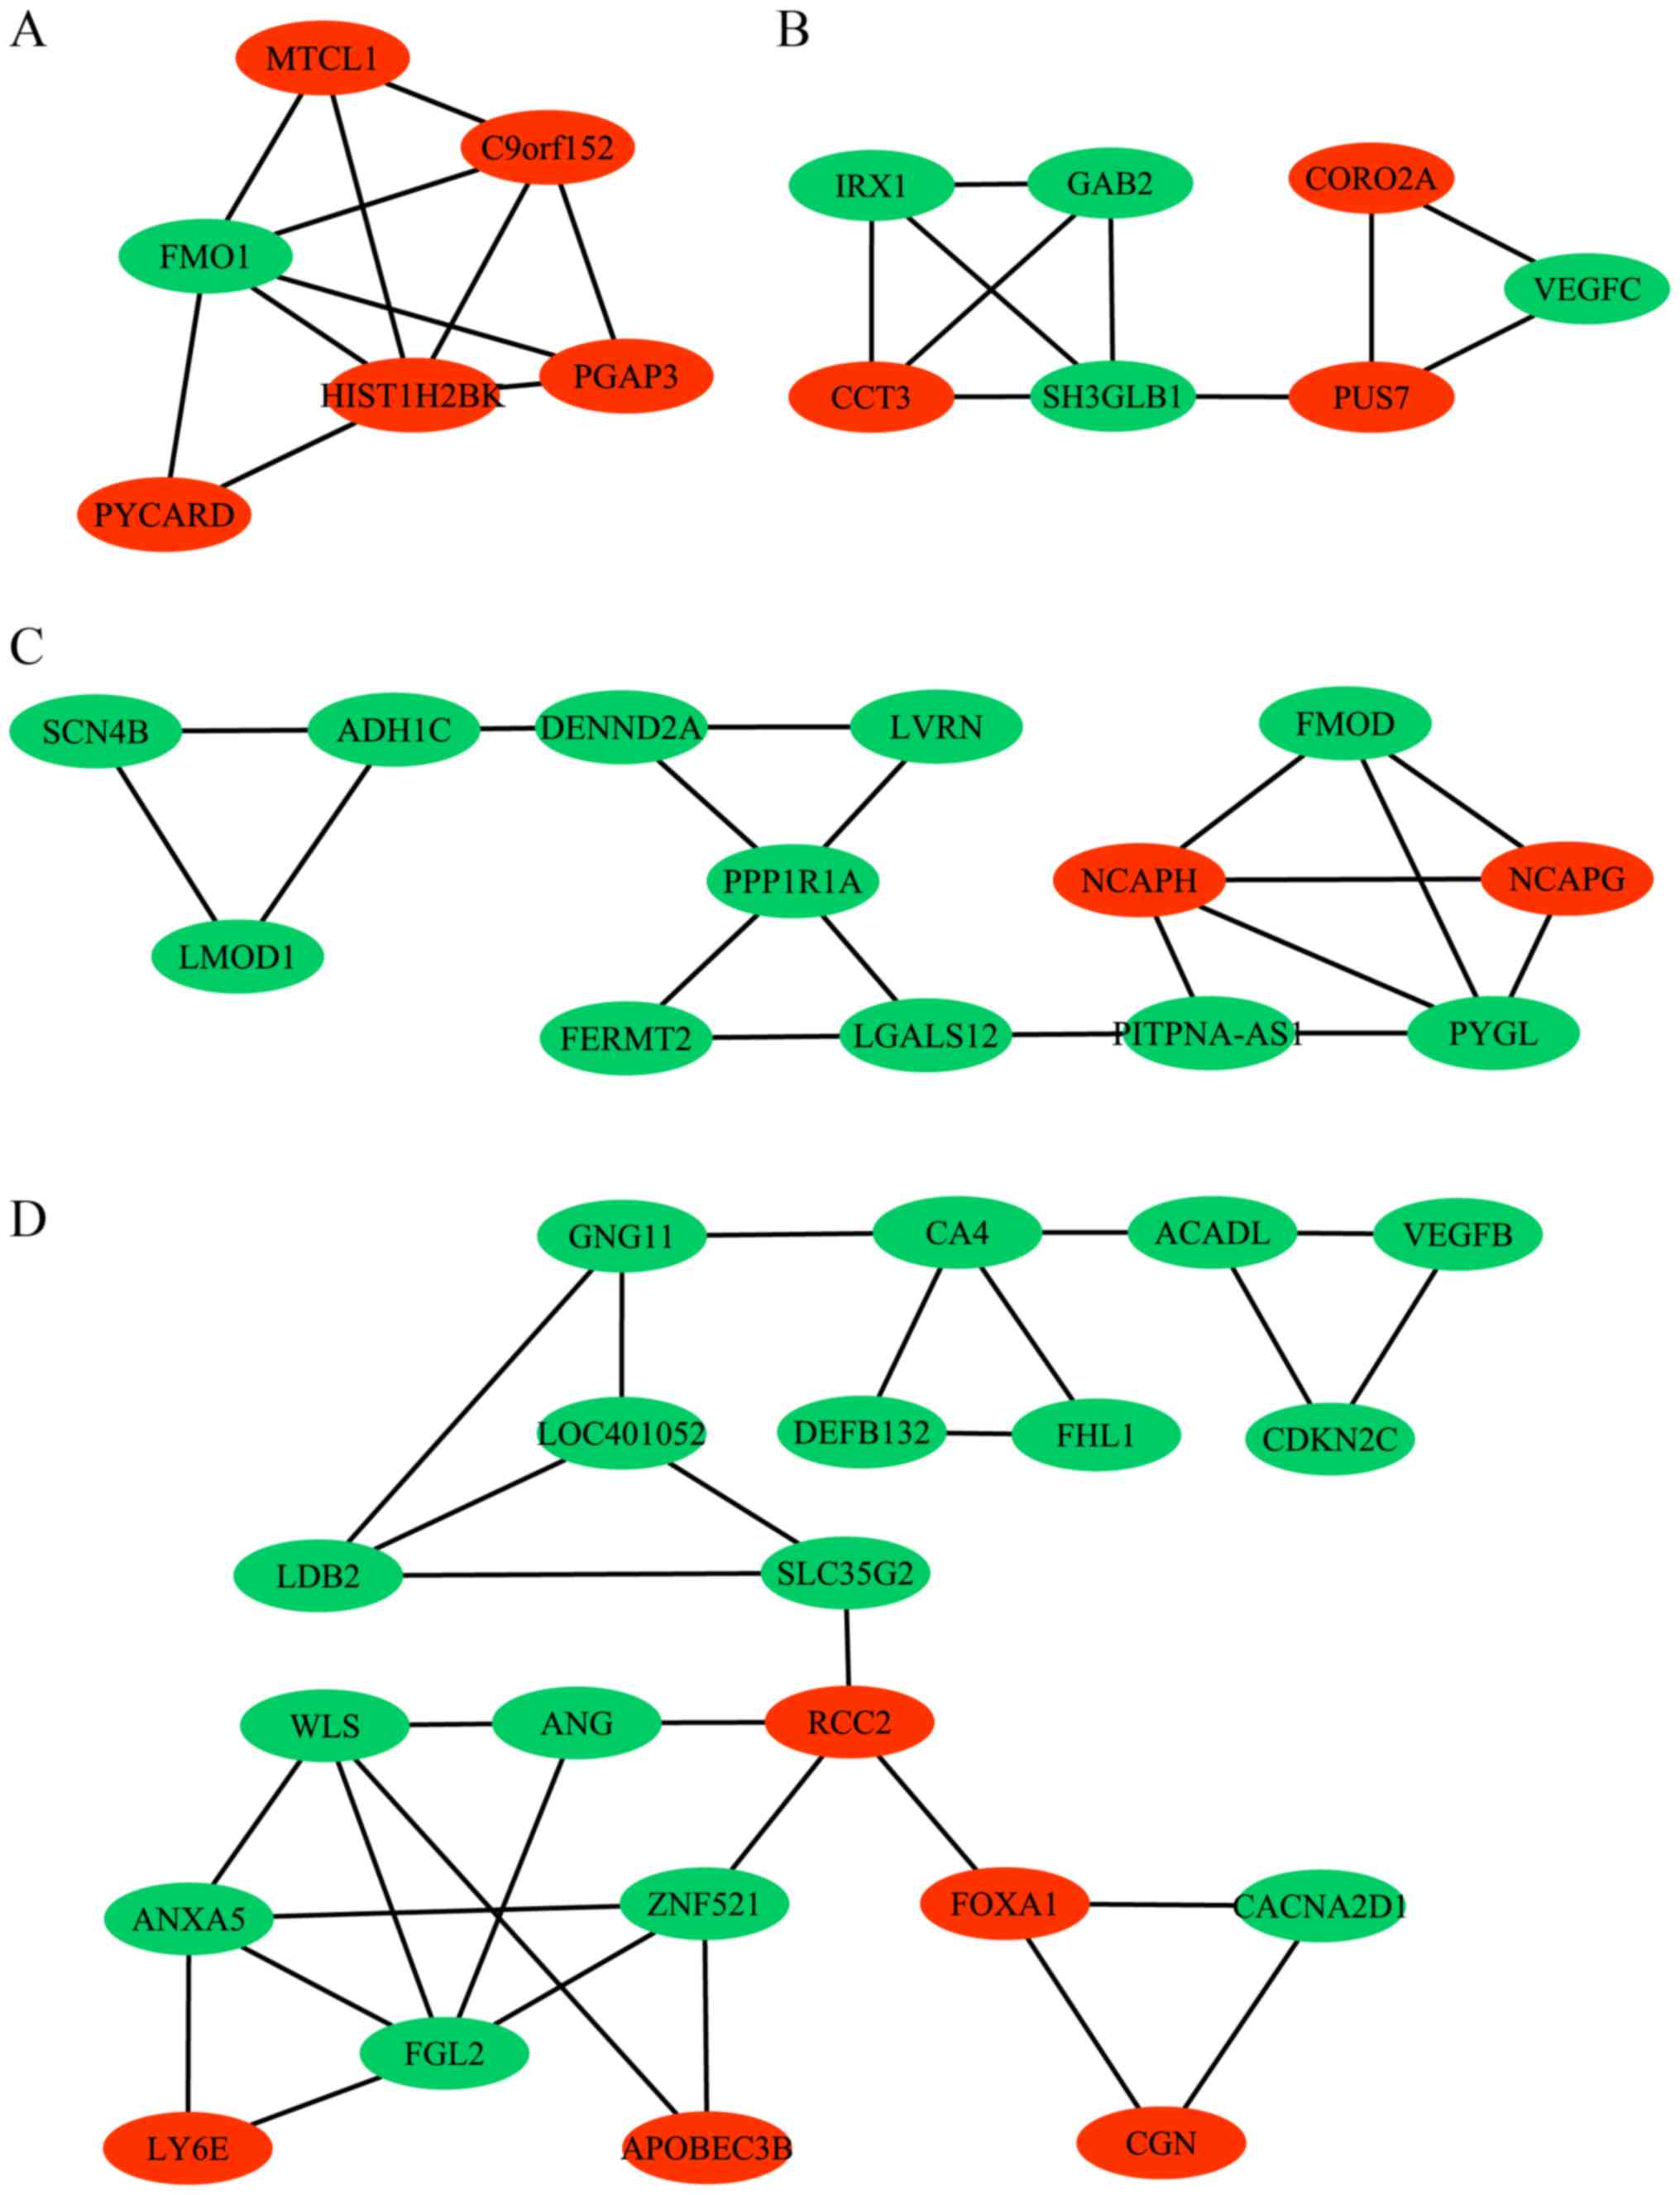
Breast cancer-specific network
Among the 1,110 DEGs that were identified, a total
of 4,937 interaction pairs were identified by the STRING database
with a threshold of combined score >0.4. Additionally, module
analysis was further applied to the whole network for network
interpretability by using the MCODE plug-in in Cytoscape. As a
result, a total of four modules were obtained by MCODE, which
represented the sub-networks, as presented in Fig. 5 with green and red nodes representing
downregulated and upregulated genes in breast cancer,
respectively.
Discussion
Breast cancer is associated with alterations in a
number of growth factors and hormone-regulated signaling pathways
(34). Clinical data demonstrated
that the breast epithelial cells in high estrogen concentration
would increase the risk of breast cancer (35). The expression of vascular endothelial
growth factor (VEGF) is enhanced under hypoxic conditions inside
the tumor, and the neovascular wall promotes the metastasis of
tumor cells (36). Poor prognosis of
different subtypes is the result of alterations in distinct
signaling pathways or transcriptional programs (37). The luminal A subtype has the longest
disease-free survival, due to the low mutation rate of TP53 and
sensitivity to endocrine therapy (3). The prognosis of the luminal B subtype
is worse than that of the luminal A type, which may be associated
with the positive expression of Her-2 receptor and the high
expression of Ki67 (38). The poor
prognosis of Her-2 subtype is due to the upregulation of epidermal
growth factor receptor, which promotes the proliferation and
metastasis of cancer cells (38).
The high mutation rate of TP53 and overexpression of EGFR in TNBC
(tri-negative breast cancer) subtype results in lower tumor
differentiation and poorest prognosis (39). In the past decade, gene microarray
and immunohistochemistry techniques have been applied to explore
the molecular typing and prognosis prediction of breast cancer. The
21-gene Oncotype (40), 70-gene
MammaPrint signature (41) and
76-gene expression profile (42)
have high ability to predict the prognosis of patients with breast
cancer. Combined with traditional pathological types and clinical
data they provide useful guidance for clinical treatment. Since
currently the gene expression profiles that are available from
different databases have their own limitations, such as samples
from patients that were limited to one clinic or geographical
region, or errors may occur between different platforms, research
on prognostic genes for breast cancer is continuing in order to
identify more accurate and widely applicable prognostic genes.
In the present study, the results of the analysis of
breast cancer from 249 samples, including 216 tumor and 33 normal
tissue samples, were described. The present study differed from
previously reported gene expression profiles, and their data were
presented from different microarray platforms, for example 48/70
genes in a study by Hartmann et al (41) were identified on the Affymetrix U133a
array while 38/76 genes in a study by Wang et al (42) were identified on the Agilent array.
The data from the three datasets included in the present study were
all obtained from the same microarray platform (Affymetrix U133a
array) and R bioconductor was used to eliminate the batch effect.
KEGG pathway enrichment analysis of DEGs in breast cancer revealed
that ‘focal adhesion pathway’, ‘PPAR signaling pathway’,
‘ECM-receptor interaction’, ‘regulation of lipolysis in
adipocytes’, ‘pyruvate metabolism’ and ‘propanoate metabolism
pathway’ were significantly enriched. Focal adhesion kinase is a
central regulator of focal adhesion, influencing cell proliferation
and migration (43,44). Focal adhesions serve as mechanical
links to the ECM and signaling center of cell communication, and
have been implicated in tumor invasion (45). The findings of the present study were
consistent with research that suggests early tumor cell migration
and invasion of neighboring tissues are mediated by focal adhesion
signaling (46). PPARs are nuclear
hormone receptors that are activated by fatty acids and their
derivatives (47). The findings also
indicated that the PPAR signaling pathway may be an important
predictor of breast cancer response to neoadjuvant chemotherapy
(48). Adipocytes are a major
component of breast tissue. Obesity is associated with increased
recurrence and reduced survival of breast cancer. Increasing
evidence suggests that obesity leads to larger breast tumor size,
high risk of distant metastasis and increased mortality (49,50).
Breast tumor cells exposed to adipocyte-conditioned media or in
coculture with adipocytes exhibit the ability to alter
proliferation, migration and invasion (51–53).
Similar effects have also been observed in 3-D cultures and
xenograft models (53,54). The enrichment analysis results
provided genes that may be involved in lipolysis in adipocytes on
tumor cells and may lead to the development of novel cancer control
strategies.
A gene concept network was constructed and revealed
that the five significant pathways, ‘PPAR signaling pathway’,
‘ECM-receptor interaction’, ‘propanoate metabolism’, ‘pyruvate
metabolism’, and ‘regulation of lipolysis in adipocytes’ identified
from the KEGG analysis were linked by 10 downregulated genes,
including CD36, EHHADH, ACADM, ME1, PCK1, FABP4, PLIN1, ACSS2, LDHB
and ACACB. Survival analysis demonstrated that the expression
levels of ACACB, ACADM, ACDC, ACSS2, PCK1 and PLIN1 were
significantly positively associated with the survival of patients
with breast cancer. Notably, the low expression gene ACACB screened
in the present study is also included in the 76-gene expression
profile (42). ACC2, encoded by the
ACACB gene, serves an important role in the oxidation of fatty
acids (55). Low expression levels
of ACACB indicate an increase in fatty acid oxidation (56). In a previous study that evaluated
changes in expression of several selected genes, patients with high
levels of ACACB had better prognosis following neoadjuvant
chemotherapy, and with the exception of ER-patients, ACACB adds
independent prognostic value in multivariable models including all
24 genes in the 126 patients, as well as the ER+/HER2-patients
(57). Inhibition of ACC2 reduces
proliferation and de novo lipogenesis of tumor cells
(58,59). In addition, inhibition of ACC2
rewires cancer metabolism and enables head and neck squamous cell
carcinoma cells to survive inhibition of the Warburg effect by
addition of cetuximab (60). The
present analysis demonstrated that ACACB was downregulated in
breast cancer and positively associated with survival time thus
supported previous studies that inhibition of fatty acid synthesis
may be a promising target to reduce drug resistance of tumor
cells.
As presented in Fig.
2A, with the exception of various cancer-associated pathways,
such as tyrosine metabolism, the Ras signaling pathway occurs
multiple times. Ras is a small guanosine triphosphate-binding
protein that serves an important role in signal transduction
pathways that influence cellular proliferation, apoptosis,
cytoskeletal organization and other important biological processes
(61). Ras mutations lead to
constitutive activation of the Ras signaling pathway in certain
human cancer types (62). The
majority of patients with colorectal cancer have codon 12 and 13
mutations of K-Ras, which occur in the early stage of the
development of cancer (63). While
Ras genes are not commonly mutated in human breast cancer, this
signaling pathway can be activated by mutations within associated
genes, including tyrosine kinase receptors, such as HER2, as well
as kinases downstream of Ras, such as mitogen-activated protein
kinase (MAPK) or extracellular regulated protein kinase (ERK)
(64). Despite large genomic surveys
such as The Cancer Genome Atlas demonstrating infrequent canonical
mutations in this signaling pathway, several studies (65–67)
support targeting the Ras/mitogen-activated protein kinase cell
signaling pathway in breast cancer.
In the present study, by selecting samples and
removing the batch effect of different datasets, pathway and
biological target analysis was performed to obtain several
candidate genes that may be involved in breast cancer progression
and reoccurrence. Gene prognostic models can provide more accurate
prognostic evaluation than clinicopathological indicators, and thus
provide a more important reference value for the selection of
individualized treatment options. However, since the dataset used
did not provide information regarding the breast cancer types, the
pathogenesis mechanism associated with the molecular
characteristics of different cancer types requires further
analysis.
Supplementary Material
Supporting Data
Acknowledgements
Not applicable.
Funding
No funding was received.
Availability of data and materials
The datasets generated and/or analyzed during the
current study are available in the GEO repository, https://www.ncbi.nlm.nih.gov/geo/query/acc.cgi?acc=GSE29431,
https://www.ncbi.nlm.nih.gov/geo/query/acc.cgi?acc=GSE42568
and https://www.ncbi.nlm.nih.gov/geo/query/acc.cgi?acc=GSE61304.
Authors' contributions
JB contributed to the design of the study, wrote the
manuscript and analyzed the data. XZ and XK revised the manuscript
and contributed to the design of the study. LJ and PW acquired,
analyzed and interpreted the data. ZW made substantial
contributions to the conception and design of the present study,
and revised the manuscript. All authors read and approved the final
manuscript.
Ethics approval and consent to
participate
Not applicable.
Patient consent for publication
Not applicable.
Competing interests
The authors declare that they have no competing
interests.
References
|
1
|
Siegel RL, Miller KD and Jemal A: Cancer
statistics, 2018. CA Cancer J Clin. 68:7–30. 2018. View Article : Google Scholar : PubMed/NCBI
|
|
2
|
Bray F, Ferlay J, Soerjomataram I, Siegel
RL, Torre LA and Jemal A: Global cancer statistics 2018: GLOBOCAN
estimates of incidence and mortality worldwide for 36 cancers in
185 countries. CA Cancer J Clin. 68:394–424. 2018. View Article : Google Scholar : PubMed/NCBI
|
|
3
|
Fan L, Strasser-Weippl K, Li JJ, St Louis
J, Finkelstein DM, Yu KD, Chen WQ, Shao ZM and Goss PE: Breast
cancer in China. Lancet Oncol. 15:e279–e289. 2014. View Article : Google Scholar : PubMed/NCBI
|
|
4
|
Al-Mubarak M, Sacher AG, Ocana A,
Vera-Badillo F, Seruga B and Amir E: Fulvestrant for advanced
breast cancer: A meta-analysis. Cancer Treat Rev. 39:753–758. 2013.
View Article : Google Scholar : PubMed/NCBI
|
|
5
|
Qiu AF, Miao ZL, Ge GK, Wang CB, Bian J,
Ma HY and Xu Q: Response and prognosis of neoadjuvant dose-dense or
standard schedule chemotherapy with anthracyclines and taxanes for
Luminal B breast cancer. Zhonghua Yi Xue Za Zhi. 97:3466–3470.
2017.PubMed/NCBI
|
|
6
|
Perou CM, Sørlie T, Eisen MB, van de Rijn
M, Jeffrey SS, Rees CA, Pollack JR, Ross DT, Johnsen H, Akslen LA,
et al: Molecular portraits of human breast tumors. Nature.
406:747–752. 2000. View
Article : Google Scholar : PubMed/NCBI
|
|
7
|
Sorlie T, Tibshirani R, Parker J, Hastie
T, Marron JS, Nobel A, Deng S, Johnsen H, Pesich R, Geisler S, et
al: Repeated observation of breast tumor subtypes in independent
gene expression data sets. Proc Natl Acad Sci USA. 100:8418–8423.
2003. View Article : Google Scholar : PubMed/NCBI
|
|
8
|
Hu Z, Fan C, Oh DS, Marron JS, He X,
Qaqish BF, Livasy C, Carey LA, Reynolds E, Dressler L, et al: The
molecular portraits of breast tumors are conserved across
microarray platforms. BMC Genomics. 7:962006. View Article : Google Scholar : PubMed/NCBI
|
|
9
|
Kumar M, Sahu RK, Goyal A, Sharma S, Kaur
N, Mehrotra R, Singh UR and Hedau S: BRCA1 promoter methylation and
expression-associations with ER+, PR+ and HER2+ subtypes of breast
carcinoma. Asian Pac J Cancer Prev. 18:3293–3299. 2017.PubMed/NCBI
|
|
10
|
Meisel J, Zhang C, Neely C, Mendoza P, You
S, Han T, Liu Y, Sahin AA, O'Regan R and Li X: Evaluation of
prognosis in hormone receptor-positive/HER2-negative and lymph
node-negative breast cancer with low oncotype DX recurrence score.
Clin Breast Cancer. 18:347–352. 2018. View Article : Google Scholar : PubMed/NCBI
|
|
11
|
Nik-Zainal S, Davies H, Staaf J,
Ramakrishna M, Glodzik D, Zou X, Martincorena I, Alexandrov LB,
Martin S, Wedge DC, et al: Landscape of somatic mutations in 560
breast cancer whole-genome sequences. Nature. 534:47–54. 2016.
View Article : Google Scholar : PubMed/NCBI
|
|
12
|
Moldovan L, Mitroi A, Petrescu C and
Aschie M: Classification of breast carcinomas according to gene
expression profiles. J Med Life. 6:14–17. 2013.PubMed/NCBI
|
|
13
|
Shaposhnikov SA, Akopov SB, Chernov IP,
Thomsen PD, Joergensen C, Collins AR, Frengen E and Nikolaev LG: A
map of nuclear matrix attachment regions within the breast cancer
loss of heterozygosity region on human chromosome16q22.1. Genomics.
89:354–361. 2007. View Article : Google Scholar : PubMed/NCBI
|
|
14
|
Tryndyak V, Kovalchuk O and Pogribny IP:
Identification of differentially methylated sites within
unmethylated DNA domains in normal and cancer cells. Anal Biochem.
356:202–207. 2006. View Article : Google Scholar : PubMed/NCBI
|
|
15
|
Hakim AA, Barry CP, Barnes HJ, Anderson
KE, Petitte J, Whitaker R, Lancaster JM, Wenham RM, Carver DK,
Turbov J, et al: Ovarian Adenocarcinomas in the Laying Hen and
Women Share Similar Alterations in p53, ras and HER-2/neu. Cancer
Prev Res (Phila). 2:114–121. 2009. View Article : Google Scholar : PubMed/NCBI
|
|
16
|
Mcglynn LM, Kirkegaard T, Edwards J, Tovey
S, Cameron D, Twelves C, Bartlett JM and Cooke TG: Ras/Raf-1/MAPK
pathway mediates response to tamoxifen but not chemotherapy in
breast cancer patients. Clin Cancer Res. 15:1487–1495. 2009.
View Article : Google Scholar : PubMed/NCBI
|
|
17
|
Boras-Granic K and Wysolmerski JJ: Wnt
signaling in breast organogenesis. Organogenesis. 4:116–122. 2008.
View Article : Google Scholar : PubMed/NCBI
|
|
18
|
Shao H, Ma J, Guo T and Hu R: Triptolide
induces apoptosis of breast cancer cells via a mechanism associated
with the Wnt/β-catenin signaling pathway. Exp Ther Med. 8:505–508.
2014. View Article : Google Scholar : PubMed/NCBI
|
|
19
|
Klintman M, Buus R, Cheang MC, Sheri A,
Smith IE and Dowsett M: Changes in expression of genes representing
key biologic processes after neoadjuvant chemotherapy in breast
cancer, and prognostic implications in residual disease. Clin
Cancer Res. 22:2405–2416. 2016. View Article : Google Scholar : PubMed/NCBI
|
|
20
|
Liu F, Wu Y, Mi Y, Gu L, Sang M and Geng
C: Identification of core genes and potential molecular mechanisms
in breast cancer using bioinformatics analysis. Pathol Res Pract.
215:1524362019. View Article : Google Scholar : PubMed/NCBI
|
|
21
|
Cuadros M, Cano C, López FJ, Talavera P,
García-Peréz I, Blanco A and Concha Á: HER2 status in breast
cancer: Experience of a Spanish national reference Centre. Clin
Transl Oncol. 13:335–340. 2011. View Article : Google Scholar : PubMed/NCBI
|
|
22
|
Clarke C, Madden SF, Doolan P, Aherne ST,
Joyce H, O'Driscoll L, Gallagher WM, Hennessy BT, Moriarty M, Crown
J, et al: Correlating transcriptional networks to breast cancer
survival: A large-scale coexpression analysis. Carcinogenesis.
34:2300–2381. 2013. View Article : Google Scholar : PubMed/NCBI
|
|
23
|
Grinchuk OV, Motakis E, Yenamandra SP, Ow
GS, Jenjaroenpun P, Tang Z, Yarmishyn AA, Ivshina AV and Kuznetsov
VA: Sense-antisense gene-pairs in breast cancer and associated
pathological pathways. Oncotarget. 6:42197–42221. 2015. View Article : Google Scholar : PubMed/NCBI
|
|
24
|
Aswad L, Yenamandra SP, Ow GS, Grinchuk O,
Ivshina AV and Kuznetsov VA: Genome and transcriptome delineation
of two major oncogenic pathways governing invasive ductal breast
cancer development. Oncotarget. 6:36652–36674. 2015. View Article : Google Scholar : PubMed/NCBI
|
|
25
|
Linton KM, Hey Y, Saunders E, Jeziorska M,
Denton J, Wilson CL, Swindell R, Dibben S, Miller CJ, Pepper SD, et
al: Acquisition of biologically relevant gene expression data by
Affymetrix microarray analysis of archival formalin-fixed
paraffin-embedded tumours. Br J Cancer. 98:1403–1414. 2008.
View Article : Google Scholar : PubMed/NCBI
|
|
26
|
Leek JT and Storey JD: Capturing
heterogeneity in gene expression studies by surrogate variable
analysis. PLoS Genet. 3:1724–1735. 2007. View Article : Google Scholar : PubMed/NCBI
|
|
27
|
Irizarry RA, Hobbs B, Collin F,
Beazer-Barclay YD, Antonellis KJ, Scherf U and Speed TP:
Exploration, normalization, and summaries of high density
oligonucleotide array probe level data. Biostatistics. 4:249–264.
2003. View Article : Google Scholar : PubMed/NCBI
|
|
28
|
Wang M, Huang J, Liu Y, Ma L, Potash JB
and Han S: COMBAT: A combined association test for genes using
summary statistics. Genetics. 207:883–891. 2017. View Article : Google Scholar : PubMed/NCBI
|
|
29
|
Smyth GK: Limma: Linear models for
microarray data. Bioinf Computat Biol Solutions Using R
Bioconductor. 397–420. 2011.
|
|
30
|
Yu G, Wang LG, Han Y and He QY:
clusterProfiler: An R package for comparing biological themes among
gene clusters. OMICS. 16:284–287. 2012. View Article : Google Scholar : PubMed/NCBI
|
|
31
|
Shannon P, Markiel A, Ozier O, Baliga NS,
Wang JT, Ramage D, Amin N, Schwikowski B and Ideker T: Cytoscape: A
software environment for integrated models of biomolecular
interaction networks. Genome Res. 13:2498–2504. 2003. View Article : Google Scholar : PubMed/NCBI
|
|
32
|
Livak KJ and Schmittgen TD: Analysis of
relative gene expression data using real-time quantitative PCR and
the 2(-Delta Delta C(T)) method. Methods. 25:402–408. 2001.
View Article : Google Scholar : PubMed/NCBI
|
|
33
|
Belldegrun A, Tsui KH, deKernion JB and
Smith RB: Efficacy of nephron-sparing surgery for renal cell
carcinoma: Analysis based on the new 1997 tumor-node-metastasis
staging system. J Clin Oncol. 17:2868–2875. 1999. View Article : Google Scholar : PubMed/NCBI
|
|
34
|
Wright KL, Adams JR, Liu JC, Loch AJ, Wong
RG, Jo CE, Beck LA, Santhanam DR, Weiss L, Mei X, et al: Ras
signaling is a key determinant for metastatic dissemination and
poor survival of luminal breast cancer patients. Cancer Res.
75:4960–4972. 2015. View Article : Google Scholar : PubMed/NCBI
|
|
35
|
Paliouras M, Borgono C and Diamandis EP:
Human tissue kallikreins: The cancer biomarker family. Cancer Lett.
249:61–79. 2007. View Article : Google Scholar : PubMed/NCBI
|
|
36
|
Jin Q, Hemminki K, Enquist K, Lenner P,
Grzybowska E, Klaes R, Henriksson R, Chen B, Pamula J, Pekala W, et
al: Vascular endothelial growth factor polymorphisms in relation to
breast cancer development and prognosis. Clin Cancer Res.
11:3647–3653. 2005. View Article : Google Scholar : PubMed/NCBI
|
|
37
|
Gatza ML, Lucas JE, Barry WT, Kim JW, Wang
Q, Crawford MD, Datto MB, Kelley M, Mathey-Prevot B, Potti A and
Nevins JR: A pathway-based classification of human breast cancer.
Proc Natl Acad Sci USA. 107:6994–6999. 2010. View Article : Google Scholar : PubMed/NCBI
|
|
38
|
Wiechmann L, Sampson M, Stempel M, Jacks
LM, Patil SM, King T and Morrow M: Presenting features of breast
cancer differ by molecular subtype. Ann Surg Oncol. 16:2705–2710.
2009. View Article : Google Scholar : PubMed/NCBI
|
|
39
|
Savage K, Leung S, Todd SK, Brown LA,
Jones RL, Robertson D, James M, Parry S, Rodrigues Pinilla SM,
Huntsman D and Reis-Filho JS: Distribution and significance of
caveolin 2 expression in normal breast and invasive breast cancer:
An immunofluorescence and immunohistochemical analysis. Breast
Cancer Res Treat. 110:245–256. 2008. View Article : Google Scholar : PubMed/NCBI
|
|
40
|
Paik S, Shak S, Tang G, Kim C, Baker J,
Cronin M, Baehner FL, Walker MG, Watson D, Park T, et al: A
multigene assay to predict recurrence of tamoxifen-treated,
node-negative breast cancer. N Engl J Med. 351:2817–2826. 2004.
View Article : Google Scholar : PubMed/NCBI
|
|
41
|
Hartmann S, Gerber B, Elling D, Heintze K
and Reimer T: The 70-Gene signature as prognostic factor for
elderly women with hormone Receptor-Positive, HER2-Negative breast
cancer. Breast Care (Basel). 7:19–24. 2012. View Article : Google Scholar : PubMed/NCBI
|
|
42
|
Wang Y, Klijn JG, Zhang Y, Sieuwerts AM,
Look MP, Yang F, Talantov D, Timmermans M, Meijer-van Gelder ME, Yu
J, et al: Gene-expression profiles to predict distant metastasis of
lymph-node-negative primary breast cancer. Lancet. 365:671–679.
2005. View Article : Google Scholar : PubMed/NCBI
|
|
43
|
Chan KT, Cortesio CL and Huttenlocher A:
FAK alters invadopodia and focal adhesion composition and dynamics
to regulate breast cancer invasion. J Cell Biol. 185:357–370. 2009.
View Article : Google Scholar : PubMed/NCBI
|
|
44
|
Hiscox S, Barnfather P, Hayes E, Bramble
P, Christensen J, Nicholson RI and Barrett-Lee P: Inhibition of
focal adhesion kinase suppresses the adverse phenotype of
endocrine-resistant breast cancer cells and improves endocrine
response in endocrine-sensitive cells. Breast Cancer Res Treat.
125:659–669. 2011. View Article : Google Scholar : PubMed/NCBI
|
|
45
|
Chen CS, Alonso JL, Ostuni E, Whitesides
GM and Ingber DE: Cell shape provides global control of focal
adhesion assembly. Biochem Biophys Res Commun. 307:355–361. 2003.
View Article : Google Scholar : PubMed/NCBI
|
|
46
|
Tamura M, Gu J, Takino T and Yamada KM:
Tumor suppressor PTEN inhibition of cell invasion, migration, and
growth: Differential involvement of focal adhesion kinase and
p130Cas. Cancer Res. 59:442–449. 1999.PubMed/NCBI
|
|
47
|
Hihi AK, Michalik L and Wahli W: PPARs:
Transcriptional effectors of fatty acids and their derivatives.
Cell Mol Life Sci. 59:790–798. 2002. View Article : Google Scholar : PubMed/NCBI
|
|
48
|
Chen YZ, Xue JY, Chen CM, Yang BL, Xu QH,
Wu F, Liu F, Ye X, Meng X, Liu GY, et al: PPAR signaling pathway
may be an important predictor of breast cancer response to
neoadjuvant chemotherapy. Cancer Chemother Pharmacol. 70:637–644.
2012. View Article : Google Scholar : PubMed/NCBI
|
|
49
|
Balaban S, Shearer RF, Lee LS, van
Geldermalsen M, Schreuder M, Shtein HC, Cairns R, Thomas KC,
Fazakerley DJ, Grewal T, et al: Adipocyte lipolysis links obesity
to breast cancer growth: Adipocyte-derived fatty acids drive breast
cancer cell proliferation and migration. Cancer Metab. 5:12017.
View Article : Google Scholar : PubMed/NCBI
|
|
50
|
Ligibel JA and Strickler HD: Obesity and
its impact on breast cancer: Tumor incidence, recurrence, survival,
and possible interventions. Am Soc Clin Oncol Educ Book. 52–59.
2013.doi: 10.1200/EdBook_AM.2013.33.52. View Article : Google Scholar : PubMed/NCBI
|
|
51
|
Dirat B, Bochet L, Dabek M, Daviaud D,
Dauvillier S, Majed B, Wang YY, Meulle A, Salles B, Le Gonidec S,
et al: Cancer-associated adipocytes exhibit an activated phenotype
and contribute to breast cancer invasion. Cancer Res. 71:2455–2465.
2011. View Article : Google Scholar : PubMed/NCBI
|
|
52
|
Carter JC and Church FC: Mature breast
adipocytes promote breast cancer cell motility. Exp Mol Pathol.
92:312–317. 2012. View Article : Google Scholar : PubMed/NCBI
|
|
53
|
Wang C, Gao C, Meng K, Qiao H and Wang Y:
Human adipocytes stimulate invasion of breast cancer MCF-7 cells by
secreting IGFBP-2. PLoS One. 10:e01193482015. View Article : Google Scholar : PubMed/NCBI
|
|
54
|
Delort L, Lequeux C, Dubois V, Dubouloz A,
Billard H, Mojallal A, Damour O, Vasson MP and Caldefie-Chézet F:
Reciprocal interactions between breast tumor and its adipose
microenvironment based on a 3D adipose equivalent model. PLoS One.
8:e662842013. View Article : Google Scholar : PubMed/NCBI
|
|
55
|
Riancho JA, Vázquez L, García-Pérez MA,
Sainz J, Olmos JM, Hernández JL, Pérez-López J, Amado JA,
Zarrabeitia MT, Cano A and Rodríguez-Rey JC: Association of ACACB
polymorphisms with obesity and diabetes. Mol Genet Metab.
104:670–676. 2011. View Article : Google Scholar : PubMed/NCBI
|
|
56
|
Ma L, Mondal AK, Murea M, Sharma NK,
Tönjes A, Langberg KA, Das SK, Franks PW, Kovacs P, Antinozzi PA,
et al: The effect of ACACB cis-variants on gene expression and
metabolic traits. PLoS One. 6:e238602011. View Article : Google Scholar : PubMed/NCBI
|
|
57
|
Klintman M, Buus R, Cheang MC, Sheri A,
Smith IE and Dowsett M: Changes in expression of genes representing
key biologic processes after neoadjuvant chemotherapy in breast
cancer, and prognostic implications in residual disease. Clin
Cancer Res. 22:2405–2416. 2016. View Article : Google Scholar : PubMed/NCBI
|
|
58
|
Jones JE, Esler WP, Patel R, Lanba A, Vera
NB, Pfefferkorn JA and Vernochet C: Inhibition of Acetyl-CoA
carboxylase 1 (ACC1) and 2 (ACC2) reduces proliferation and de novo
lipogenesis of EGFRviii human glioblastoma cells. PLoS One.
12:e01695662017. View Article : Google Scholar : PubMed/NCBI
|
|
59
|
Svensson RU, Parker SJ, Eichner LJ, Kolar
MJ, Wallace M, Brun SN, Lombardo PS, Van Nostrand JL, Hutchins A,
Vera L, et al: Inhibition of acetyl-CoA carboxylase suppresses
fatty acid synthesis and tumor growth of non-small-cell lung cancer
in preclinical models. Nat Med. 22:1108–1119. 2016. View Article : Google Scholar : PubMed/NCBI
|
|
60
|
Luo J, Hong Y, Lu Y, Qiu S, Chaganty BK,
Zhang L, Wang X, Li Q and Fan Z: Acetyl-CoA carboxylase rewires
cancer metabolism to allow cancer cells to survive inhibition of
the Warburg effect by Cetuximab. Cancer Lett. 384:39–49. 2017.
View Article : Google Scholar : PubMed/NCBI
|
|
61
|
Bifulco M: Role of the isoprenoid pathway
in ras transforming activity, cytoskeleton organization, cell
proliferation and apoptosis. Life Sci. 77:1740–1749. 2005.
View Article : Google Scholar : PubMed/NCBI
|
|
62
|
Kreeger PK, Mandhana R, Alford SK, Haigis
KM and Lauffenburger DA: RAS mutations affect tumor necrosis
factor-induced apoptosis in colon carcinoma cells via
ERK-modulatory negative and positive feedback circuits along with
Non-ERK pathway effects. Cancer Res. 69:8191–8199. 2009. View Article : Google Scholar : PubMed/NCBI
|
|
63
|
Bazan V, Migliavacca M, Zanna I, Tubiolo
C, Grassi N, Latteri MA, La Farina M, Albanese I, Dardanoni G,
Salerno S, et al: Specific codon 13 K-ras mutations are predictive
of clinical outcome in colorectal cancer patients, whereas codon 12
K-ras mutations are associated with mucinous histotype. Ann Oncol.
13:1438–1446. 2002. View Article : Google Scholar : PubMed/NCBI
|
|
64
|
Sun T, Aceto N, Meerbrey KL, Kessler JD,
Zhou C, Migliaccio I, Nguyen DX, Pavlova NN, Botero M, Huang J, et
al: Activation of multiple proto-oncogenic tyrosine kinases in
breast cancer via loss of the PTPN12 phosphatase. Cell.
144:703–718. 2011. View Article : Google Scholar : PubMed/NCBI
|
|
65
|
Li T and Sparano JA: Inhibiting Ras
signaling in the therapy of breast cancer. Clin Breast Cancer.
3:405–420. 2003. View Article : Google Scholar : PubMed/NCBI
|
|
66
|
Del Grosso C, Antoniol G, Merlo E, et al:
The impact of Ras/MAPK/S6K signaling pathway on prediction of
clinical outcome in metastatic Her-2 positive breast cancer
patients treated with trastuzumab. Cancer Res. 74 (19
Suppl):Abstract nr LB-181. 2014.
|
|
67
|
Giltnane JM and Balko JM: Rationale for
targeting the Ras/MAPK pathway in triple-negative breast cancer.
Discov Med. 17:275–283. 2014.PubMed/NCBI
|