Introduction
Severe acute respiratory syndrome-coronavirus
nonstructural protein-10 (SARS-CoV nsp-10) is the main
transcriptase of SARS that cleaves polyproteins orf1a (187–260 kDa)
and orf1b (345–422 kDa) during infection (1). Human embryo lung cellular protein
interacting with SARS-CoV nsp-10 (HEPIS) is a novel gene that was
previously isolated from a cDNA library of human embryonic lung
tissue and the protein it encodes interacts with SARS-CoV nsp10
(2). The HEPIS gene is
expressed as two different isoforms, isoform A and isoform B, which
are 220 and 147 amino acids long, respectively (2,3).
Previously, it was demonstrated that HEPIS is differentially
expressed in ten different types of cancer, including stomach,
liver, and prostate cancer (4).
Furthermore, the transcription factors Oct-1, NF-κB and C-Jun are
associated with transcriptional regulation of the HEPIS gene
(4). Breast cancer is one of the
most common malignancies affecting women worldwide (5,6), with
the incidence of 92.8 per 100,000 women in western Europe in 2018
(7). Breast cancer progression is a
complex process comprising cell cycle dysregulation (8) and metastasis to distant organs
(9). A variety of steroid hormones,
such as estrogen and progesterone (10), and the expression of specific genes,
such as zinc finger E-box-binding homeobox 1 and matrix
metallopeptidases (9), have been
attributed to the growth and metastasis of breast cancer cells. A
previous study showed that the transcription factor Zinc finger
E-box-binding homeobox 1 regulates the expression of the p21
and CDK4 genes to promote breast cancer cell proliferation
(11). Bone morphogenetic protein 6
has been found to inhibit breast cancer cell proliferation by
targeting microRNA-192 and its direct target RB transcriptional
corepressor 1 (12). Clinically,
therapeutic interventions for the growth and metastasis of breast
cancer remain limited. Our previous study demonstrated that the
expression of HEPIS was significantly higher in T-47D compared with
ZR-75-30, MDA-MB-231 and MCF-7 cells (4). However, the function of HEPIS in
breast cancer cell proliferation has not yet been elucidated, and
the elucidation of such a mechanism may provide novel approaches
for therapy.
In order to reveal the role of HEPIS in the
development of breast cancer, the function of HEPIS in MCF-7
cell proliferation and the regulated genes of HEPIS was
investigated in the present study. Our results may provide a basis
for establishing a more effective treatment strategy for breast
cancer.
Materials and methods
Plasmid construction
Full-length HEPIS isoform A and B coding sequence
(CDS) was amplified from MCF-7 cDNA using PCR with the following
primers: Forward, 5′-TTCAAGCTTATGTCTGCCCATATGTCAGG-3′ and reverse,
5′-TAAGGATCCGTCACAGGATTTCTCTAAGTCT-3′. The PCR fragments were run
on an agarose gel, photographed, recovered, digested with
HindIII (AAGCTT) and BamHI (GGATCC) and cloned into
the pEGFP-C3 vector (BD Biosciences). pEGFP-C3-HEPISa plasmid
contained the CDS sequence of HEPIS isoform A, whereas
pEGFP-C3-HEPISb plasmid contained the CDS sequence of HEPIS isoform
B.
The partial human HEPIS CDS was amplified from MCF-7
cDNA using PCR with the following primers: Forward,
5′-ATACTCGAGGAAGTGGAGCAGGATGTA-3′ and reverse,
5′-ATAGCGGCCGCTCAGTCACAGGATTTCTC-3′, and the PCR fragments were
cloned into the psiCHECK™−2 (Promega Corporation) vector using
XhoI (CTCGAG) and NotI (GCGGCCGC) restriction sites.
This partial human HEPIS CDS sequence contained the targeting site
of the small interfering (si)RNAs described below.
The target siRNA sequences for human HEPIS were
5′-GATGCTAACCTCCAAGTTT-3′, 5′-GCAAGCAGCAGAAGAGAAA-3′ and
5′-AGTTTAGTCCTGCAGAGAT-3′. These oligonucleotides were annealed and
ligated into pSilencer 4.1-CMVneo (Ambion; Thermo Fisher
Scientific, Inc.) to construct HEPIS-specific siRNA expression
plasmids siHEPIS-1, siHEPIS-2, and siHEPIS-3, respectively,
according to the manufacturer's protocol. pSilencer 4.1-CMVneo
expressing scrambled siRNA (Ambion; Thermo Fisher Scientific, Inc.)
was used as si-control.
Cell culture
HeLa and MCF-7 cells (ATCC) were maintained in high
glucose DMEM (Gibco; Thermo Fisher Scientific, Inc.) supplemented
with 10% fetal bovine serum (FBS; HyClone; GE Healthcare Life
Sciences), penicillin (100 U/ml) and streptomycin (100 U/ml) and
incubated at 37°C with 5% CO2.
Cell transfection
HeLa and MCF-7 cells were transfected with plasmid
using Lipofectamine™ 2000 (Thermo Fisher Scientific, Inc.),
according to the manufacturer's protocol.
HeLa cells were seeded at a density of
1×10⁴ cells/well in 96-well plates, after 24 h of
culture, the cells were transfected with 200 ng/well
pEGFP-C3-HEPISa, pEGFP-C3-HEPISb, or pEGFP-C3 for subcellular
localization. HeLa cells were seeded at a density of
7×10⁴ cells/well in 24-well plates. After 24 h of
culture, the cells were transfected with 800 ng/well pEGFP-C3,
pEGFP-C3-HEPISa or pEGFP-C3-HEPISb plasmids for reverse
transcription-quantitative PCR (RT-qPCR).
MCF-7 cells were seeded at a density of
1×10⁴ cells/well in 96-well plates. After 24 h of
culture, the cells were co-transfected with 100 ng/well of either
si-control, siHEPIS-1, siHEPIS-2 or siHEPIS-3 and 100 ng/well
psiCHECK™-2-HEPIS for silencing target site selection; the cells
were transfected with 200 ng/well pEGFP-C3-HEPISa, pEGFP-C3-HEPISb,
pEGFP-C3, siHEPIS-3 or si-control for Cell Counting Kit-8 (CCK-8)
assay; the cells were co-transfected with 80 ng/well of
pEGFP-C3-HEPISa, pEGFP-C3-HEPISb, pEGFP-C3, siHEPIS-3 or
si-control, 80 ng/well of pNF-κB-Luc and 40 ng/well pRL-TK for
Dual-luciferase reporter (DLR) assay.
MCF-7 cells were seeded at a density of
7×10⁴ cells/well in 24-well plates. After 24 h of
culture, the cells transfected with 800 ng/well pEGFP-C3,
pEGFP-C3-HEPISa, pEGFP-C3-HEPISb, si-control or siHEPIS-3 plasmids
for 5-Ethynyl-2′-deoxyuridine (EdU) cell proliferation assay and
RT-qPCR; the cells were transfected with 800 ng/well of either
pEGFP-C3-HEPISa, pEGFP-C3-HEPISb or pEGFP-C3 for western blotting.
The cells were transfected with 800 ng/well of either
pEGFP-C3-HEPISa or pEGFP-C3 for gene chip assay.
Transmembrane domain prediction
The transmembrane domain of HEPIS was predicted by
Transmembrane Hidden Markov Model (TMHMM) Server v.2.0 (http://www.cbs.dtu.dk/services/TMHMM/).
Subcellular localization
HeLa cells were transfected as aforementioned. At 24
h post-transfection, the cells were stained with DAPI for 30 mins
at 37°C, and visualized under an inverted fluorescent microscope as
described previously (13).
Western blotting
MCF-7 cells were transfected with EGFP-C3-HEPISa,
pEGFP-C3-HEPISb or pEGFP-C3 as aforementioned. At 24 h
post-transfection, western blotting was performed as described
previously (14). Primary antibodies
specific for GFP (cat. no. SC-8334; Santa Cruz; 1:1,000 dilution)
and β-actin (cat. no. ab8227; Abcam; 1:1,000 dilution) and a
secondary antibody Goat Anti-Rabbit IgG H&L (HRP) (cat. no.
ab6721; Abcam; 1:10,000 dilution) were used.
Silencing target site selection using
the psiCHECK™-2 vector
MCF-7 cells were transfected with the psiCHECK™-2
vector as aforementioned. At 24 h, the cells were lysed and cell
lysates were assayed for firefly and Renilla luciferase
activity using a Dual-Luciferase Reporter Assay System (Promega
Corporation) according to the manufacturer's protocol.
Renilla luciferase activity was normalized to firefly
luciferase activity. Experiments were performed in triplicate.
CCK-8 assay
MCF-7 cells were transfected as aforementioned. At
24 h, the cells were seeded into 96-well plates at a density of
2×10³ cells/well, with six replicates per experiment.
The CCK-8 assay (Dojindo Molecular Technologies, Inc.) was
performed 1, 2, 3, 4 and 5 days after transfection as described
previously (13).
EdU cell proliferation assay
For the EdU assay, MCF-7 cells were transfected as
aforementioned. The cells were incubated with 50 µM EdU at 37°C for
1 h 48 h after transfection. The cells were fixed with 4%
paraformaldehyde at 37°C for 30 min and stained with 5 mg/ml
Hoechst as described previously (12). Images were captured and EdU-positive
cells were calculated as described previously (12).
DLR assay
The pNF-κB-Luc reporter plasmid (PathDetect; Agilent
Technologies, Inc.) contains the NF-κB response element,
GGGAATTTCCGGGAATTTCCGGGAACCGGATTGACCGGCCATGGCGATCGCCCTTAAAGGCCCTTAAAGGCCCTTTTTCCGGGAATTTCC,
which was cloned into the 3′UTR of firefly luciferase. pNF-κB-Luc
was therefore used to measure transcriptional activity of NF-κB.
The internal control pRL-TK plasmid contained the Renilla
luciferase gene (Promega Corporation). MCF-7 cells transfected with
as aforementioned. At 24 h post-transfection, the DLR assay was
performed using Dual-Luciferase Reporter Assay System (Promega
Corporation) according to the manufacturer's protocol. Firefly
luciferase activity was normalized to Renilla luciferase
activity.
RNA in situ hybridization
An RNA microarray containing samples from 39 cases
of breast cancer and matching adjacent normal tissue was obtained
from Shanxi Chaoying Biotechnology Co., Ltd. (cat. no. BR804a). An
antisense probe with a sequence matching part of HEPIS was used:
5′-FITC-TCTGCCCATATGTCAGGATTGGAAATAATGGAT-3′. Hybridization was
performed as previously described (15). DAPI was used as the counterstain. The
stained cells were visualized and images were captured using a
laser scanning confocal microscope under consistent excitation
wavelength among all groups. The results of the staining were
analyzed using ImageJ software version 1.46 (National Institutes of
Health).
Gene chip assay
MCF-7 cells were transfected as aforementioned.
After 48 h of transfection, RNA was extracted using TRIzol (cat.
no. 15596-018; Invitrogen; Thermo Fisher Scientific, Inc.), and
further purified using an RNeasy mini kit (cat. no. 74106) and
RNase-Free DNase set (cat. no. 79254; both Qiagen GmbH). Total RNA
was amplified and labeled using the low input quick amp labeling
kit, one-color (cat. no. 5190-2305; Agilent Technologies, Inc.),
according to the manufacturer's protocol. Labeled complementary RNA
(cRNA) was purified using the RNeasy mini kit (cat. no. 74106;
Qiagen GmbH) as previously described (16). Each slide (Agilent SurePrint G3 Human
Gene Expression Microarray 8×60K) was hybridized with 600 ng
Cy3-labeled cRNA using a hybridization kit (cat. no. 5188-5242) and
washed in staining dishes with wash buffer kit (cat. no. 5188-5327;
all Agilent Technologies, Inc.) 17 h after hybridization, according
to the manufacturer's instructions. Slides were scanned using an
Agilent microarray scanner (cat. no. G2565CA; Agilent Technologies,
Inc.) with the following default settings: Dye channel, green; scan
resolution, 3 µm; photomultiplier tube, 100%, color depth, 16 bit.
Data were extracted using Feature Extraction software v10.7
(Agilent Technologies, Inc.). Raw data were normalized using the
quantile algorithm, limma packages in R version 3.5.3 (http://www.R-project.org/) (17). Two samples were used for gene chip
assay.
Gene Ontology (GO) and Kyoto
Encyclopedia of Genes and Genomes (KEGG) enrichment analysis
Differentially expressed mRNAs were identified as
|log2(fold change)|≥2 and P<0.05. GO enrichment
(http://geneontology.org, release number
2019-01-01) and KEGG pathway (http://www.genome.jp/kegg, release number 91.0, July
2019) analysis of the differentially expressed mRNAs were performed
as described previously (18).
Reverse transcription-quantitative PCR
(RT-qPCR)
MCF-7 and HeLa cells were transfected as
aforementioned and 24 h after transfection, the RNA was extracted
using TRIzol® (Invitrogen; Thermo Fisher Scientific,
Inc.) and purified using RNeasy mini kit (Qiagen GmbH). Total RNA
(0.5 µg) from each sample was used for first-strand cDNA synthesis
using M-MLV reverse transcription kit (Promega Corporation)
according to the manufacturer's protocol. The specific products of
human HEPIS were amplified using qPCR with the following primers:
HEPIS forward, 5′-GCCAAAGCCCAGTGTTAAAAG-3′ and reverse,
5′-GGAGGTTAGCATCACATTGTCA-3′; and GAPDH forward,
5′-TGACTTCAACAGCGACACCCA-3′ and reverse,
5′-CACCCTGTTGCTGTAGCCAAA-3′. GAPDH was used as an internal
control.
MCF-7 cells were transfected with pEGFP-C3-HEPISa or
pEGFP-C3 as aforementioned, and 24 and 48 h after transfection, RNA
extraction, purification and reverse transcription were performed
as aforementioned. Specific products of human interleukin 2
receptor subunit α (IL2RA), interferon α and β receptor
subunit 2 (IFNAR2) and IFNA8 genes were amplified
using qPCR using the following primers: IL2RA forward,
5′-GGCAGCGGAGACAGAGGAA-3′ and reverse, 5′-CCTGGGCGACCATTTAGC-3′;
IFNAR2 forward, 5′-TGATAGCGATACTGAGGC-3′ and reverse,
5′-CTGGGATTCTGTAGAGGTG-3′; and IFNA8 forward
5′-GACTCATCTGCTGCTTTG-3′ and reverse, 5′-GAATCATTTCCGTGTTGTA-3′.
GAPDH was used as an internal control.
Universal PCR Max Mix (Applied Biosystems) was used
for qPCR, according to the manufacturer's protocol QPCR was
performed using the following thermocycling conditions: 94°C for 15
sec, 60°C for 15 sec and 72°C for 15 sec for 40 cycles.
Quantification was performed using the 2−ΔΔCq method as
described previously (19).
Statistical analysis
Data are presented as the mean ± standard deviation.
SPSS v9.0 software (SPSS, Inc.) was used for statistical analysis.
The data of RT-qPCR and EdU cell proliferation assay were analyzed
using Student's t-test, the CCK-8 data were analyzed using one-way
ANOVA followed by a Dunnett's post hoc test. Optical density or
integrated optical density of breast cancer or normal breast tissue
was analyzed using Student's t-test. P<0.05 was considered to
indicate a statistically significant difference. Data represent
three independent experiments.
Results
Characterization and subcellular
localization of HEPIS
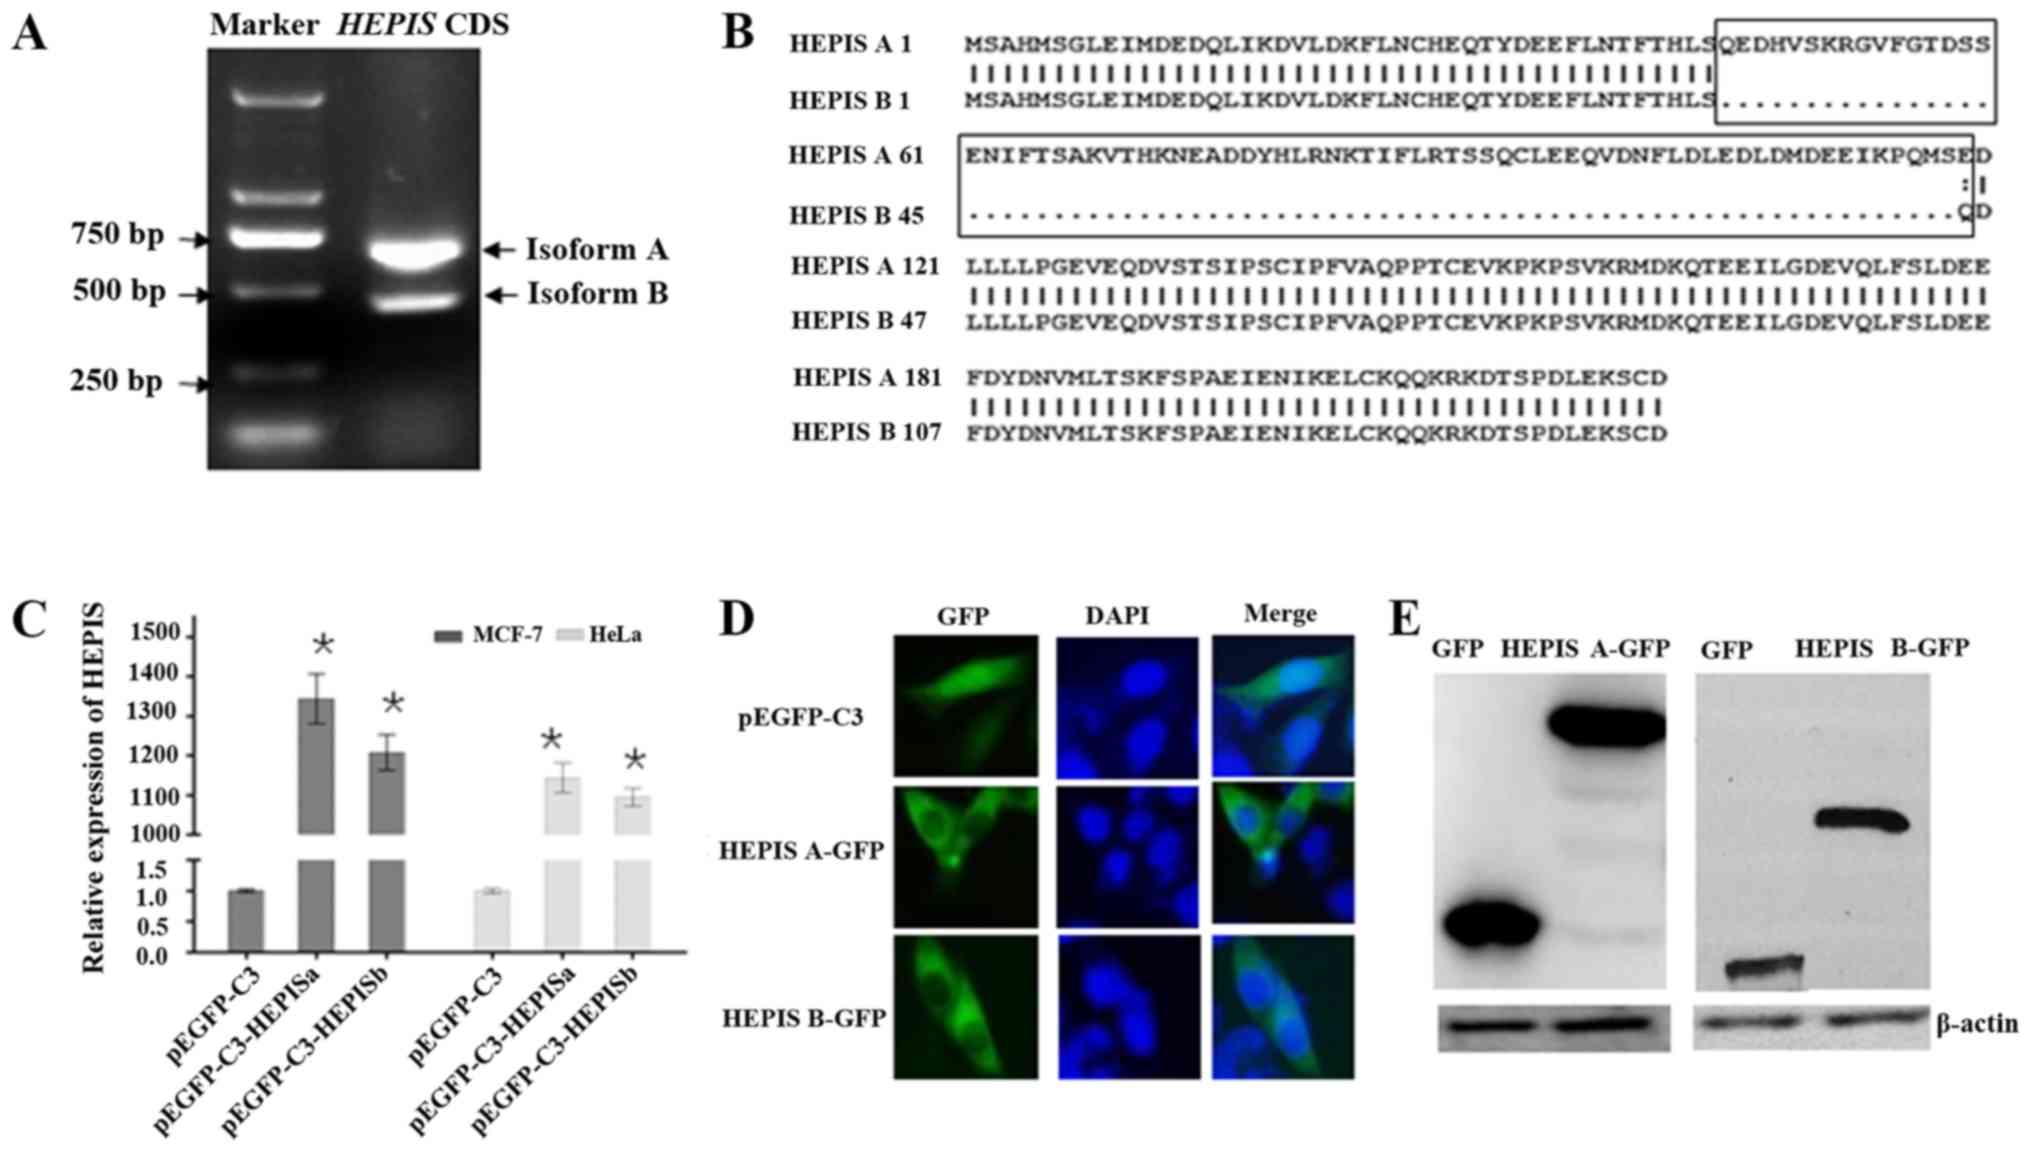
HEPIS exists in two different isoforms, A and B. PCR
was performed to determine the expression levels of the A and B
isoforms in MCF-7 cells. The results revealed that both the
isoforms were expressed in MCF-7 cells. Isoform A was the most
abundant form of HEPIS, based on the intensity of the band
(Fig. 1A). Isoforms A and B consist
of 220 and 147 amino acids, respectively (Fig. 1B), with predicted molecular masses of
28 and 18 kDa, respectively. Protein analyses on TMHMM revealed
that the HEPIS protein has no predicted transmembrane domain,
suggesting that it may be a soluble protein. To determine its
subcellular localization, cDNAs of both the isoforms were fused to
GFP in the pEGFP-C3 vector and transfected into HeLa cells.
Overexpression of HEPISa and HEPISb was confirmed using qPCR
(Fig. 1C). HEPISa-GFP and HEPISb-GFP
fusion proteins were primarily expressed in the cytoplasm of HeLa
cells (Fig. 1D). Results of the
western blot analysis revealed that pEGFP-C3-HEPISa expressed a
55-kDa HEPISa-GFP fusion protein, and pEGFP-C3-HEPISb plasmids
expressed a 45-kDa HEPISb-GFP fusion protein in MCF-7 cells
(Fig. 1E).
 | Figure 1.Characterization and subcellular
localization of HEPIS. (A) HEPIS mRNA expression levels (isoforms A
and B) in MCF-7 breast cancer cells detected using PCR and gel
electrophoresis. (B) Protein sequence alignment of HEPIS isoforms A
and B. The box indicates different amino acid sequences. Amino
acids are presented in a single letter code. (C) HeLa and MCF-7
cells were transfected with pEGFP-C3, pEGFP-C3-HEPISa, or
pEGFP-C3-HEPISb. The HEPIS mRNA levels were detected using
quantitative PCR 24 h after transfection. *P<0.05 vs. pEGFP-C3.
(D) HeLa cells were transfected with pEGFP-C3, pEGFP-C3-HEPISa, or
pEGFP-C3-HEPISb, and nuclei were stained with DAPI was used to
stain nuclei. GFP and DAPI staining were visualized using
fluorescence microscopy. Magnification, ×10. (E) MCF-7 cells were
transfected with pEGFP-C3, pEGFP-C3-HEPISa or pEGFP-C3-HEPISb.
Western blot analysis with anti-GFP antibodies was performed to
determine the expression of HEPIS-GFP in MCF-7 cells. HEPIS, human
embryo lung cellular protein interacting with severe acute
respiratory syndrome-coronavirus nonstructural protein-10; CDS,
coding sequence; GFP, green fluorescence protein. |
HEPIS expression in breast cancer
tissue
In our previous study, it was reported that HEPIS
was differentially expressed in T-47D, ZR-75-30, MDA-MB-231 and
MCF-7 breast cancer cell lines (4).
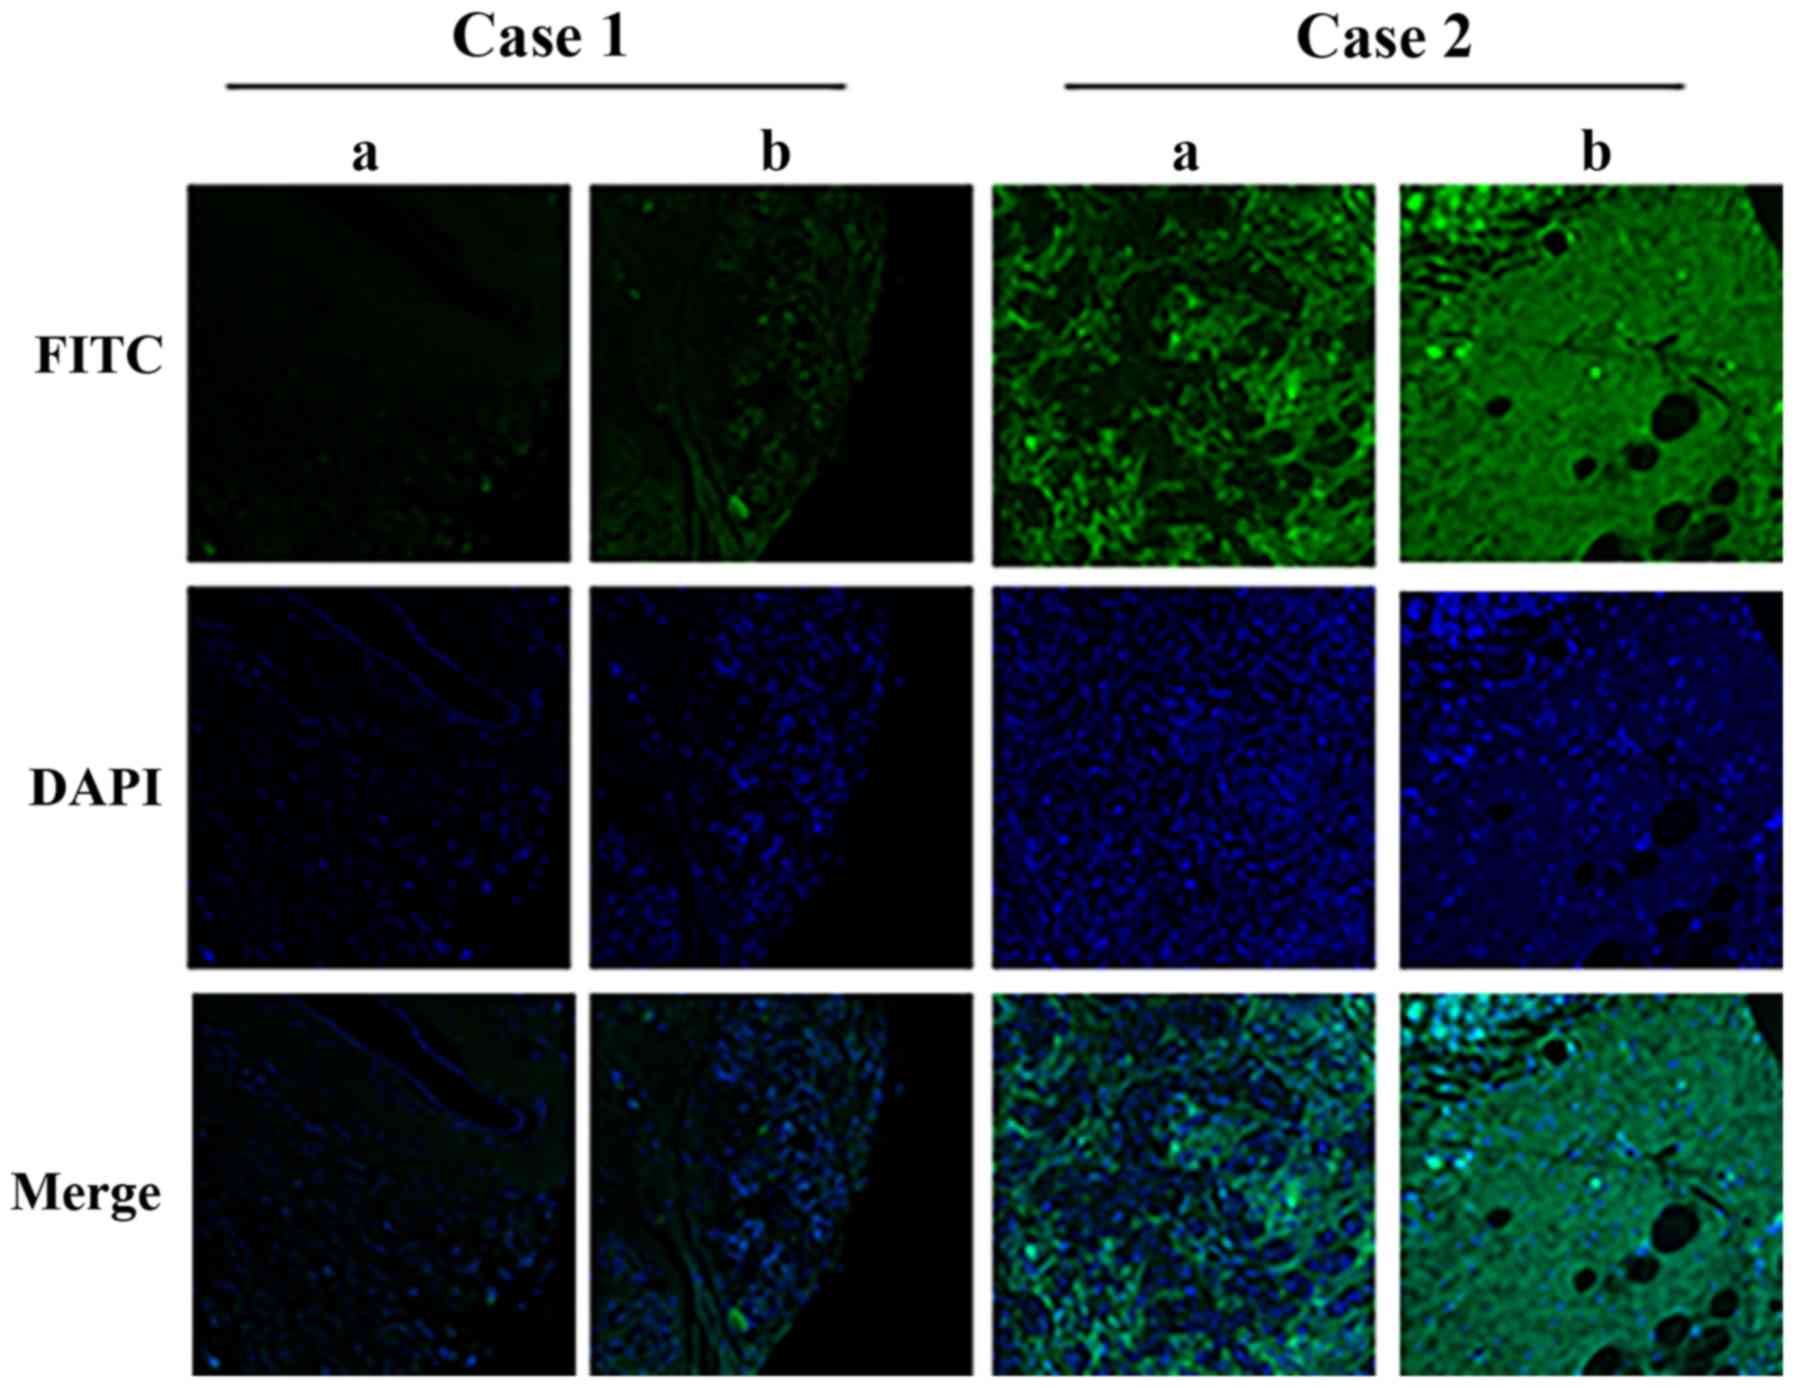
In the present study, RNA in situ hybridization was
performed using a tissue microarray containing breast cancer tissue
and adjacent normal tissue from 39 cases to study the expression of
HEPIS. HEPIS-positive staining was primarily found in the cytoplasm
of case 2 (Fig. 2). The integrated
optical density of HEPIS was significantly lower (P<0.05) in
malignant breast cancer tissue compared with the adjacent normal
breast tissue (Table I).
 | Table I.Expression of HEPIS in breast cancer
and normal breast tissue specimens. |
Table I.
Expression of HEPIS in breast cancer
and normal breast tissue specimens.
| Specimen | Number | Optical
density | Integrated optical
density |
|---|
| Normal breast
tissue | 39 |
0.038±0.001a |
187±13.51a |
| Breast cancer | 39 | 0.020±0.001 | 109±10.72 |
HEPIS overexpression reduces
proliferation of MCF-7 cells
A previous study reported that HEPIS reduces the
proliferation of HeLa cell (2). To
assess the effect of HEPIS on the proliferation of breast cancer
cells, MCF-7 cells were transfected with the HEPIS-expressing
plasmids pEGFP-C3-HEPISa or pEGFP-C3-HEPISb, and a CCK-8 assay was
performed. As shown in Fig. 3A, the
results of the CCK-8 assay indicated that overexpression of both
isoforms of HEPIS in MCF-7 cells significantly decreased the cell
proliferation compared with MCF-7 cells transfected with empty
vector controls. To test the effect of knockdown of endogenous
HEPIS expression on MCF-7 cell proliferation, three different siRNA
plasmids which targeted human HEPIS were constructed
(siHEPIS-1, siHEPIS-2 and siHEPIS-3), and the ability of these
three plasmids to inhibit HEPIS gene expression using a DLR
assay with the psiCHECK™-2 vector was performed. The results
revealed that HEPIS expression was lowest in cells
transfected with siHEPIS-3 (Fig.
3B). Results of the qPCR analysis showed that overexpression of
siHEPIS-3 significantly reduced the expression of HEPIS at
the transcriptional level (Fig. 3C).
As shown in Fig. 3D, the knockdown
of HEPIS by siHEPIS-3 significantly increased the number of
MCF-7 cells compared with the control, confirming that HEPIS
has a growth-inhibiting effect on MCF-7 cells. Furthermore, the
results of the EdU proliferation assay revealed that overexpression
of both isoforms of HEPIS decreased the number of cells in
the S phase from 51.2 to 38.1% (HEPISa) or 36.3% (HEPISb) (Fig. 3E). In contrast, HEPIS
knockdown resulted in a marked increase in the number of cells in
the S phase, showing an increase from 47.1 to 63.8% (Fig. 3F). Based on the above results, it was
confirmed that HEPIS inhibits MCF-7 cell proliferation.
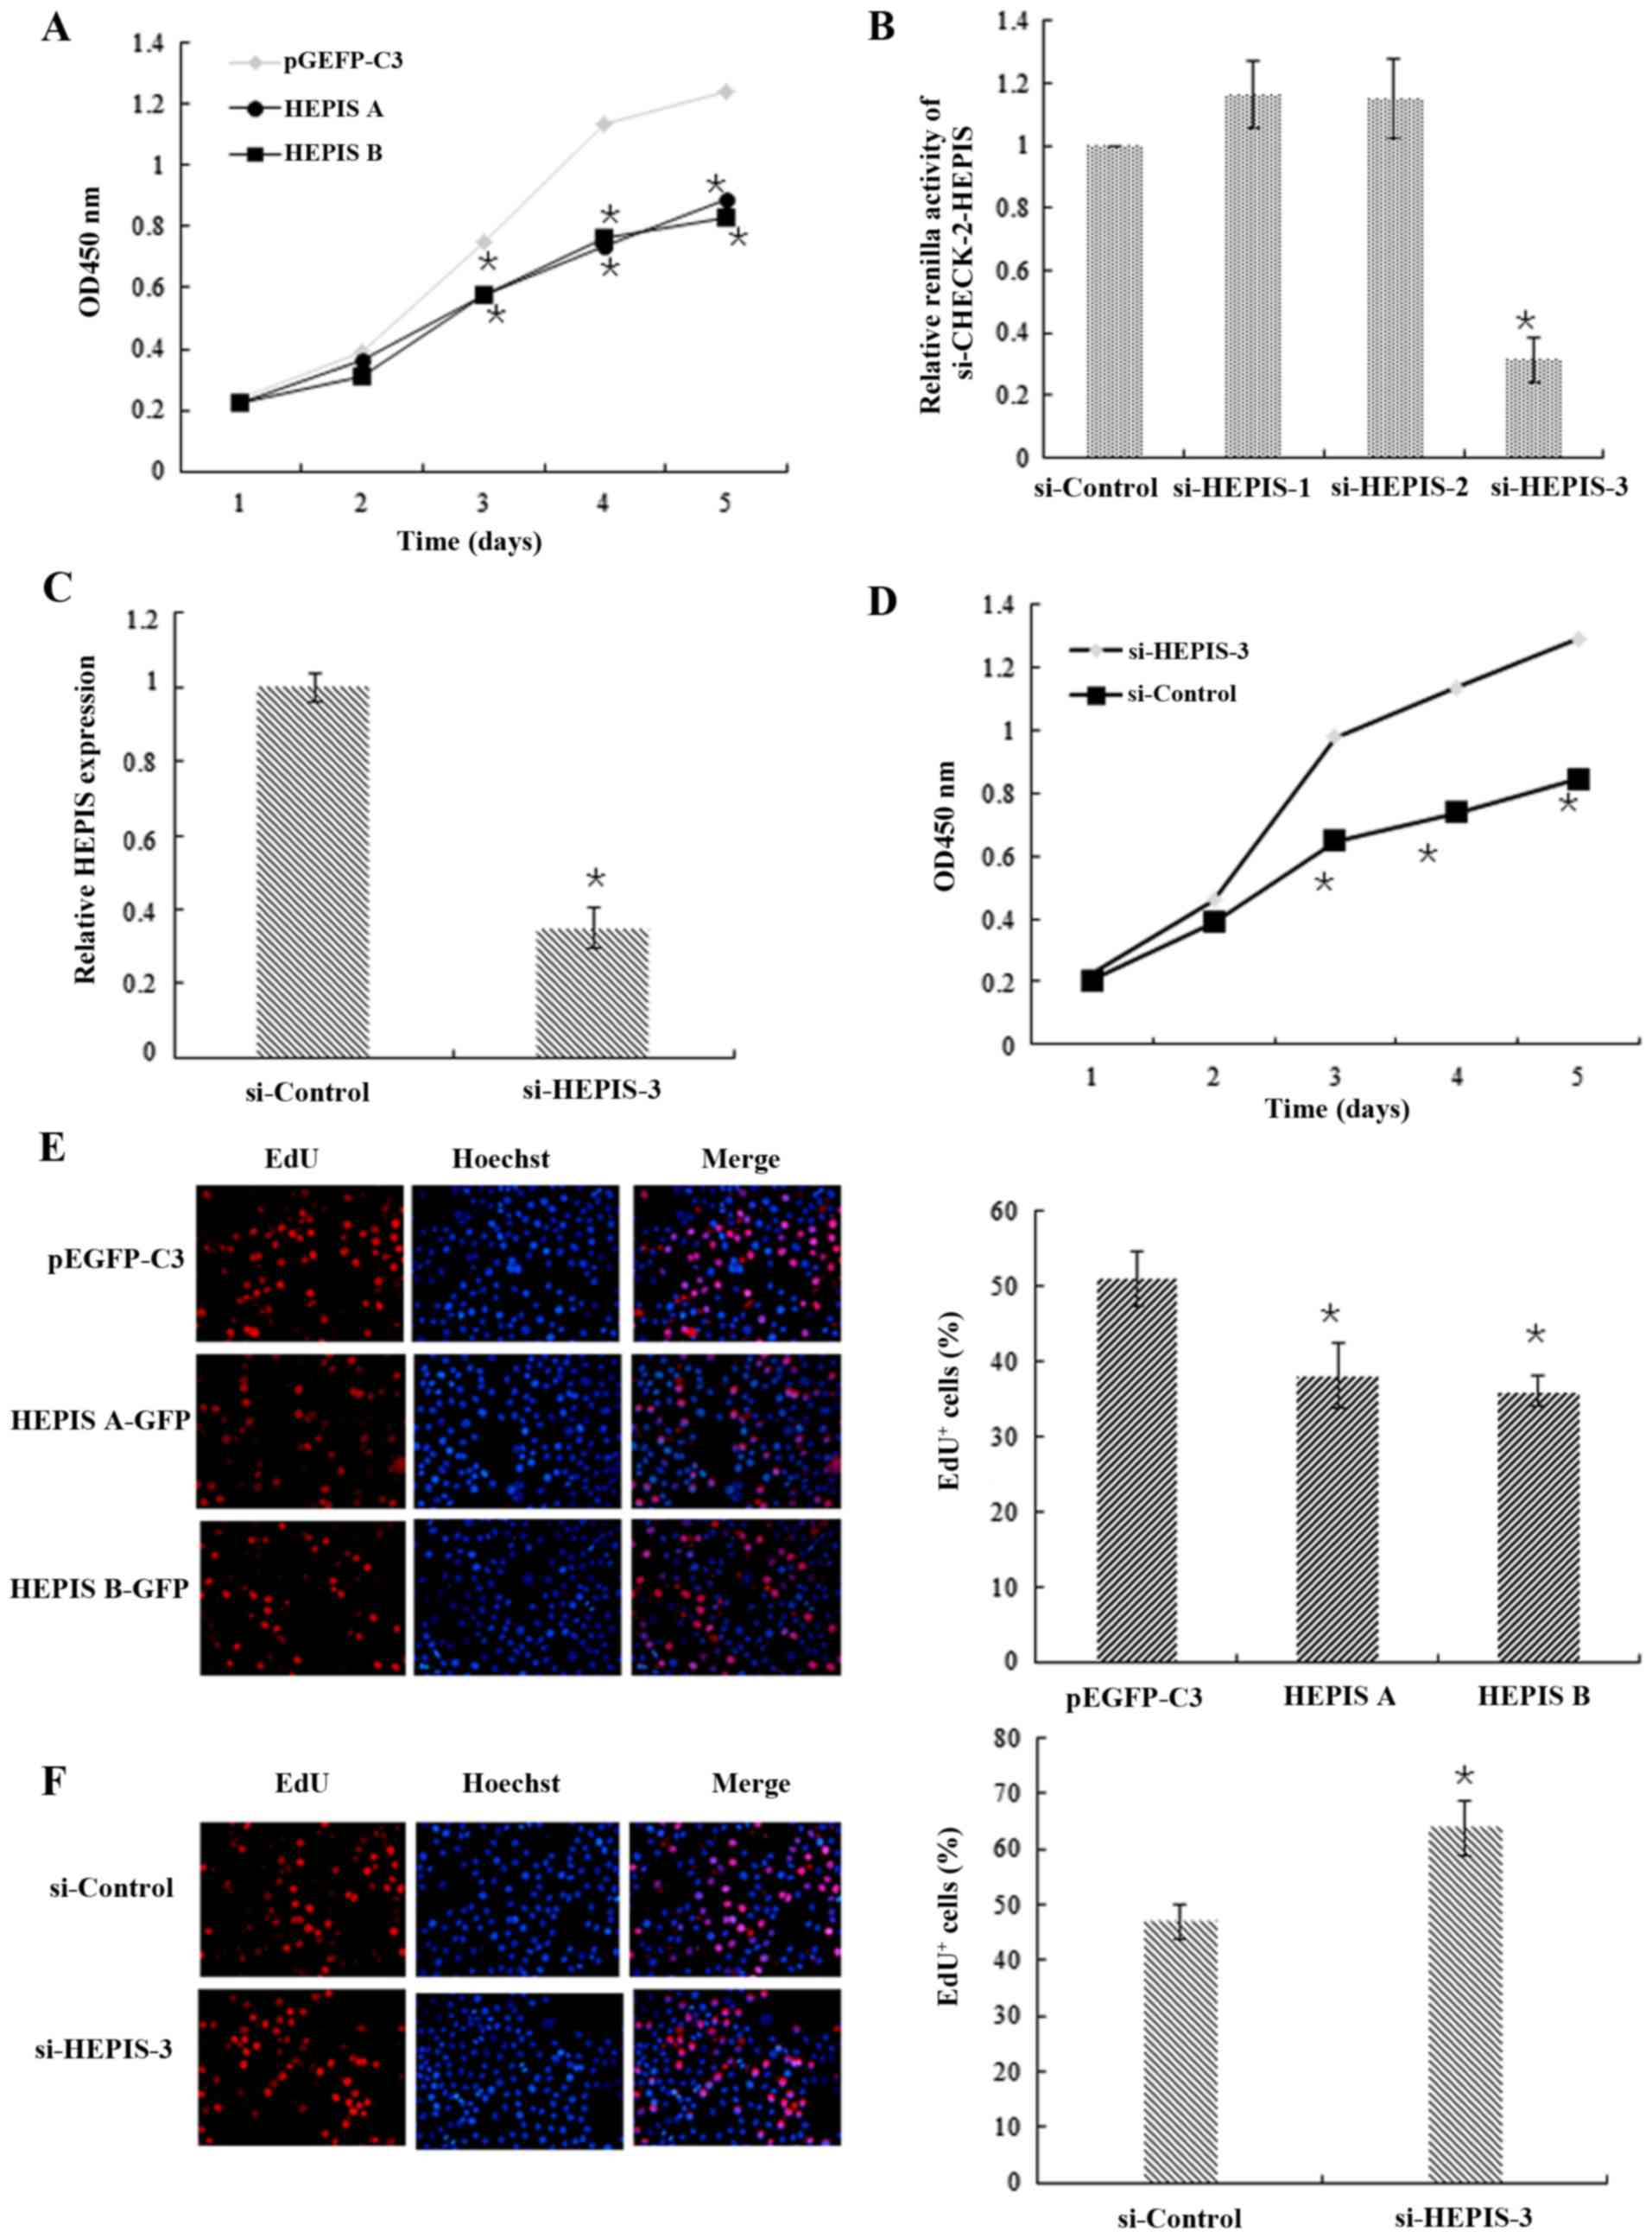 | Figure 3.HEPIS inhibits the proliferation of
MCF-7 breast cancer cells. (A) CCK-8 assay of MCF-7 cells
transfected with pEGFP-C3, pEGFP-C3-HEPISa, or pEGFP-C3-HEPISb.
*P<0.05 vs. pEGFP-C3. (B) MCF-7 cells were co-transfected with
siHEPIS-1, siHEPIS-2, siHEPIS-3 or si-control, with
psiCHECK-2-HEPIS. The dual-luciferase reporter assay was performed,
and the Renilla luciferase data are normalized to the
expression of firefly luciferase. *P<0.05 vs. si-control. (C)
MCF-7 cells were transfected with either si-control or siHEPIS-3.
The HEPIS mRNA levels were detected using quantitative PCR,
24 h after transfection. *P<0.05. (D) CCK-8 assay of MCF-7 cells
transfected with either si-control or siHEPIS-3. *P<0.05. (E)
MCF-7 cells were transiently transfected with pEGFP-C3,
pEGFP-C3-HEPISa or pEGFP-C3-HEPISb. Cell proliferation was measured
using immunofluorescence analysis of EdU incorporation. *P<0.05
vs. pEGFP-C3. (F) MCF-7 cells were transiently transfected with
si-control or siHEPIS-3. Cell proliferation was measured by
immunofluorescence analysis of EdU incorporation. *P<0.05 vs.
si-control. CCK-8, Cell Counting Kit-8; HEPIS, human embryo lung
cellular protein interacting with severe acute respiratory
syndrome-coronavirus nonstructural protein-10; EdU,
5-Ethynyl-2′-deoxyuridine; GFP, green fluorescence protein; si,
small interfering. |
HEPIS overexpression inhibits the
transcriptional activity of NF-κB
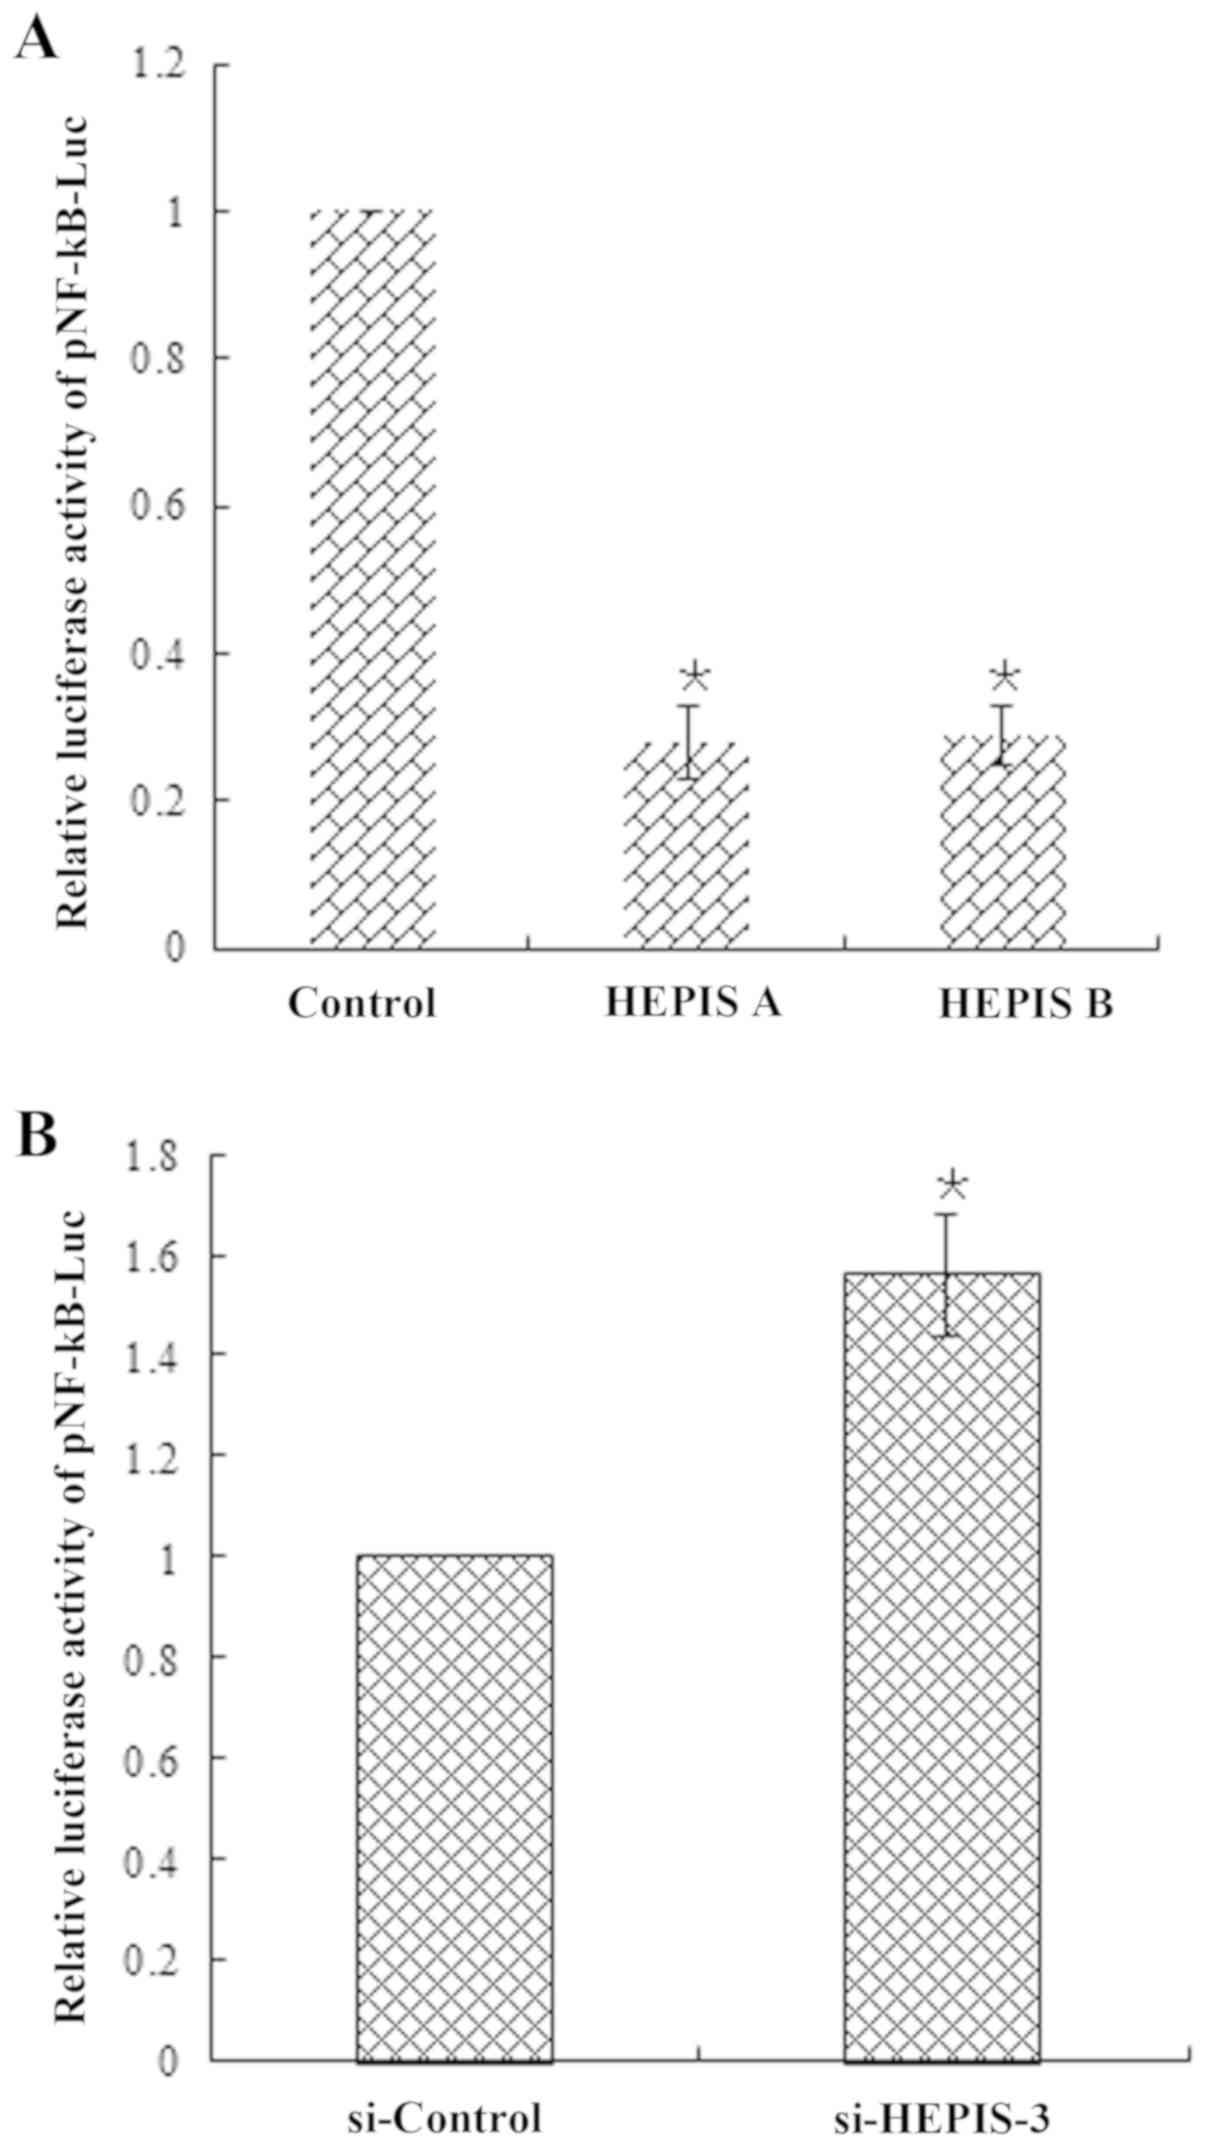
The DLR assay was performed to further identify the
potential cellular pathways regulated by HEPIS, which
revealed that the two isoforms of HEPIS overexpression
significantly inhibited the NF-kB reporter gene in MCF-7 cells
compared with the control group (Fig.
4A). By contrast, HEPIS knockdown resulted in a
significant increase in NF-κB reporter gene activity (Fig. 4B).
Gene profiles and detection of
differentially expressed mRNAs
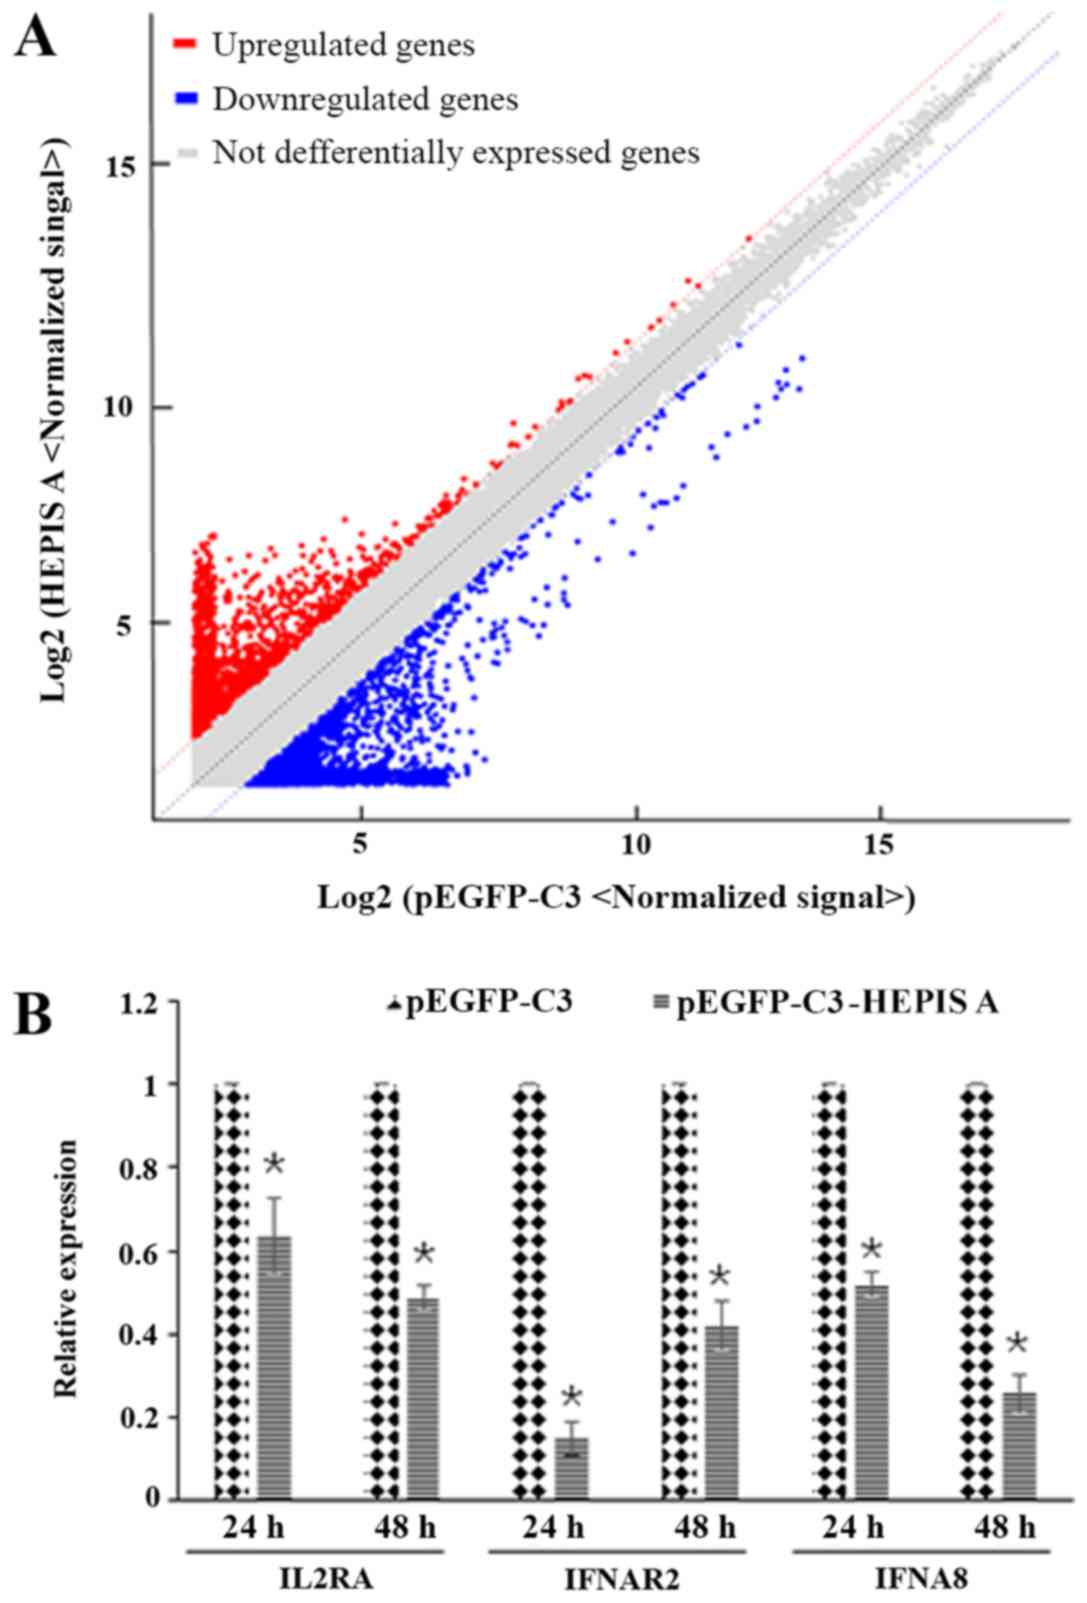
To understand the molecular changes following
HEPIS overexpression, gene chip analysis was performed to
identify the mRNAs that were differentially expressed between the
HEPIS-overexpressing MCF-7 cells and control cells. Results
of the gene chip assay showed that 2,231 genes were differentially
expressed in HEPIS-overexpressing cells, including 1,095
genes that were upregulated and 1,136 that were downregulated
(Fig. 5A). The differentially
expressed genes were analyzed using GO enrichment and KEGG pathway
analysis. Top 10 significant enrichment pathways from GO enrichment
analysis included ‘transmembrane receptor protein serine/threonine
kinase activity’ and ‘regulation of T cell tolerance induction’,
among others (Table II). Top 15
significant enrichment pathways from KEGG pathways are listed in
Table III and included
‘mitogen-activated protein kinase (MAPK) signaling pathway’, ‘Janus
kinase-signal transducer and activator of transcription (JAK-STAT)
signaling pathway’, ‘focal adhesion’ and others. The IL2RA,
IFNAR2, and IFNA8 genes were selected for qPCR analysis,
as they were enriched in the JAK-STAT signaling pathway, from the
KEGG enrichment analysis. qPCR results confirmed that the mRNA
levels of these three genes were downregulated in
HEPIS-overexpressing MCF-7 cells compared with that in the pEGFP-C3
group at 24 and 48 h post-transfection (Fig. 5B).
| Table II.Top 10 pathways from GO enrichment
analysis. |
Table II.
Top 10 pathways from GO enrichment
analysis.
| GO ID | Description | Type | P-value | Gene count | Genes | Enrichment
factor |
|---|
| GO:0017121 | Phospholipid
scrambling | BP | 0.0014 | 4 | ANO7, P2RX7,
PLSCR2, ANO3 | 7 |
| GO:0002664 | Regulation of T
cell tolerance induction | BP | 0.0014 | 4 | HLA-B, CD86, CBLB,
IL2RA | 7 |
| GO:0042659 | Regulation of cell
fate specification | BP | 0.0018 | 4 | FGF2, POU5F1, GFI1,
DKK1 | 6.5 |
| GO:0070307 | Lens fiber cell
development | BP | 0.0018 | 4 | FGFR3, FGFR2,
WNT7A, WNT7B | 6.5 |
| GO:0002517 | T cell tolerance
induction | BP | 0.0018 | 4 | HLA-B, CD86, CBLB,
IL2RA | 6.5 |
| GO:0004675 | Transmembrane
receptor protein serine/threonine kinase activity | MF | 0.0031 | 4 | ACVR1, ACVR1B,
AMHR2, TGFBR3 | 5.69 |
| GO:0010888 | Negative regulation
of lipid storage | BP | 0.0031 | 4 | TNF, PPARA, NR1H2,
ABCA1 | 5.69 |
| GO:0043552 | Positive regulation
of phosphatidylinositol 3-kinase activity | BP | 0.0002 | 7 | TGFB1, CCL19, FGF2,
PDGFB, FGFR3, FLT1, CCL21 | 5.69 |
| GO:0010560 | Positive regulation
of glycoprotein biosynthetic process | BP | 0.0031 | 4 | CCL19, PXYLP1,
CCL21, SLC51B | 5.69 |
| GO:0043551 | Regulation of
phosphatidylinositol 3-kinase activity | BP | 0.0001 | 9 | CCL19, PDGFB,
FGFR3, PIK3R5, CCL21, KIAA0226, TGFB1, FGF2, FLT1 | 5.39 |
| Table III.Top 15 pathways from Kyoto
Encyclopedia of Genes and Genomes enrichment analysis. |
Table III.
Top 15 pathways from Kyoto
Encyclopedia of Genes and Genomes enrichment analysis.
| Pathway ID | Description | P-value | Gene count | Genes | Enrichment
factor |
|---|
| hsa00780 | ‘Biotin
metabolism’ | 0.0152 | 1 | BTD | 7.83 |
| hsa04320 | ‘Dorso-ventral axis
formation’ | 0.0031 | 5 | PIWIL3, MAPK3,
ETV7, ETS1, NOTCH1) | 4.19 |
| hsa04976 | ‘Bile
secretion’ | 0.0007 | 10 | ABCC2, SLCO1A2,
ABCG5, SLC9A1, SLC10A1, EPHX1, etc. | 3.31 |
| hsa05330 | ‘Allograft
rejection’ | 0.0133 | 5 | HLA-DQB1, CD86,
HLA-DQA1, HLA-B, TNF | 3.09 |
| hsa05332 | ‘Graft-vs.-host
disease’ | 0.0189 | 5 | HLA-DQB1, CD86,
HLA-DQA1, HLA-B, TNF | 2.86 |
| hsa04940 | ‘Type I diabetes
mellitus’ | 0.0234 | 5 | HLA-DQB1, CD86,
HLA-DQA1, HLA-B, TNF | 2.73 |
| hsa00770 | ‘Pantothenate and
CoA biosynthesis’ | 0.0867 | 2 | DPYS, PPCDC | 2.61 |
| hsa04660 | ‘T cell receptor
signaling pathway’ | 0.0052 | 11 | PAK7, PIK3R5, CBLC,
PTPRC, MAPK3, etc. | 2.46 |
| hsa04930 | ‘Type II diabetes
mellitus’ | 0.0379 | 5 | CACNA1B, CACNA1G,
PIK3R5, MAPK3, TNF | 2.45 |
| hsa05211 | ‘Renal cell
carcinoma’ | 0.0192 | 7 | PAK7, PIK3R5,
MAPK3, ETS1, TGFB1, FLCN, etc. | 2.45 |
| hsa04630 | ‘JAK-STAT signaling
pathway’ | 0.0211 | 13 | IFNL2, IL2RA, LEP,
IFNAR2, IFNA8, etc. | 2.4 |
| hsa04672 | ‘Intestinal immune
network for IgA production’ | 0.4137 | 5 | HLA-DQB1, CXCL12,
TGFB1, CD86, HLA-DQA1 | 1.93 |
| hsa04510 | ‘Focal
adhesion’ | 0.0359 | 15 | PXN, PAK7, FLT1,
ZYX, ACTN2, COMP, etc. | 1.73 |
| hsa04010 | ‘MAPK signaling
pathway’ | 0.0364 | 18 | NGF, FGF3, NR4A1,
FGFR2, FGF2, FGFR3, etc. | 1.66 |
| hsa04310 | ‘Wnt signaling
pathway’ | 0.3337 | 8 | WNT7B, WNT7A, WIF1,
FOSL1, SFRP1, CAMK2B, etc. | 1.31 |
Discussion
Previously, the HEPIS isoform B has been identified
as 147 amino acid long protein with several casein kinase II
phosphorylation sites (2). In the
present study, HEPIS isoforms A and B were both found to be
expressed in MCF-7 cells. Of these, isoform A was the more
abundantly expressed isoform. Similar to the present study, a
previous study also showed that overexpression of HEPIS isoform B
reduced the proliferation of HeLa cells (2). In the present study, it was
demonstrated that overexpression of both HEPIS isoforms
significantly inhibited cell cycle progression in MCF-7 breast
cancer cells by inhibiting G1-S transition, and RNA interference
targeting HEPIS exhibited resulted in increased cell cycle
progression, confirming the potential role of HEPIS in the
regulation of cell proliferation. Our group previously reported
that HEPIS expression was significantly increased in four
breast cancer cell lines: T-47D, ZR-75-30, MDA-MB-231, and MCF-7
(4). In addition, the HEPIS
expression levels were 8-fold higher in the T-47D cell line
compared with that in the MCF-7 cell line (4). Cell proliferation is a complex process
that is regulated by multiple genes, such as c-Myc and cyclin D1
(8). The difference in expression of
the HEPIS gene does not completely determine the growth rate of
MCF-7 and T-47D cells. HEPIS in esophageal squamous cell carcinoma
exhibits upregulated expression compared with adjacent normal
tissue, whereas in rectal adenocarcinoma, the reverse has been
observed; therefore HEPIS may possess varying functions in
different types of cancer, due to each cancer having its own
complex mechanism (4). In the
present study HEPIS expression was down-regulated in breast cancer
tissue compared with the adjacent normal tissue.
NF-κB belongs is a member the Rel/NF-κB family, and
it is a hetero- or homo-dimeric transcription factor (20,21).
NF-κB serves a vital role in cell proliferation and apoptosis
(20,22). The results of the present study
demonstrated that HEPIS inhibits the activity of the NF-κB reporter
gene. HEPIS may serve an important role by regulating NF-κB signal
pathway.
The JAK-STAT signaling pathway transmits information
from extracellular signals, including a wide array of cytokines
(IFN-α, IFN-γ, etc.) and growth factors (epidermal growth factor,
platelet-derived growth factor, etc.) (23). This pathway plays a role in
proliferation, migration and apoptosis (24,25), and
disruption or dysregulation of this pathway can result in prostate
cancer (26) or breast cancer
(27). MAPKs are a highly conserved
family of serine/threonine protein kinases, and are involved in
different cellular processes, such as proliferation, survival,
apoptosis, differentiation, motility and development (28). ERK, JNK/stress-activated protein
kinase, and p38 are three major MAPK families that serve important
roles in tumor progression in breast cancer (29,30).
KEGG pathway analysis showed that the differentially expressed
genes, which were regulated by HEPIS, were functionally
enriched in the MAPK and JAK-STAT signaling pathways. Therefore,
HEPIS may regulate the progression of breast cancer by influencing
the MAPK and JAK-STAT signaling pathways.
The IL-2/IL-2 receptor pathway is involved in the
regulation of carcinoma cell proliferation, and endogenous IL-2
promotes growth and protects tumor cells from apoptosis (31). IFN/IFNAR2 leads to the
phosphorylation of JAK/STAT and gene induction, as well as
antiviral and antiproliferative cellular responses (32). In the present study, qPCR results
revealed that IL2RA and IFNAR2 were downregulated by
HEPIS. Therefore, HEPIS may inhibit MCF-7 cell proliferation by
regulating IL2RA and IFNAR2.
In conclusion, the results showed that HEPIS is
primarily expressed in the cytoplasm of MCF-7 cells and inhibits
the activity of the NF-κB reporter gene. Furthermore,
the novel function of HEPIS was revealed as a proliferation
inhibitor in breast cancer progression. Results from the gene chip
analysis revealed that 2,231 genes were differentially expressed in
the HEPIS overexpression group; these genes were enriched in
the MAPK and JAK-STAT signaling pathways. The differential
expression of the IL2RA, IFNAR2, and IFNA8 genes was
confirmed using qPCR. Together, HEPIS may represent a novel
target molecule for repression of breast cancer progression.
Acknowledgements
Not applicable.
Funding
This study was supported by grants from the General
Higher Education Young Talents Program of Hebei Province (grant no.
BJ2014027) and the Natural Science Foundation of Hebei Province
(grant nos. H2018209140 and C2017209062).
Availability of data and materials
The datasets used and/or analyzed during the present
study are available from the corresponding author on reasonable
request.
Authors' contributions
FH, YZ, and ML performed the in vitro
experiments. YZ and YB analyzed the gene chip data. XZ performed
the RNA in situ hybridization. FH and XZ were major contributors in
writing the manuscript. All authors read and approved the final
manuscript.
Ethics approval and consent to
participate
Not applicable.
Patient consent for publication
Not applicable.
Competing interests
The authors declare that they have no competing
interests.
References
|
1
|
Sawicki SG, Sawicki DL, Younker D, Meyer
Y, Thiel V, Stokes H and Siddell SG: Functional and genetic
analysis of coronavirus replicase-transcriptase proteins. PLoS
Pathog. 1:e392005. View Article : Google Scholar : PubMed/NCBI
|
|
2
|
Hong M, Li W, Wang L, Jiang L, Liu L, Zhao
H and Li Q: Identification of a novel transcriptional repressor
(HEPIS) that interacts with nsp-10 of SARS coronavirus. Viral
Immunol. 21:153–162. 2008. View Article : Google Scholar : PubMed/NCBI
|
|
3
|
Huttlin EL, Ting L, Bruckner RJ, Gebreab
F, Gygi MP, Szpyt J, Tam S, Zarraga G, Colby G, Baltier K, et al:
The BioPlex Network: A systematic exploration of the human
interactome. Cell. 162:425–440. 2015. View Article : Google Scholar : PubMed/NCBI
|
|
4
|
Hu F and Zhang Y: Expression profile and
promoter analysis of HEPIS. Exp Ther Med. 15:569–575.
2018.PubMed/NCBI
|
|
5
|
Al-Hajj M, Wicha MS, Benito-Hernandez A,
Morrison SJ and Clarke MF: Prospective identification of
tumorigenic breast cancer cells. Proc Natl Acad Sci USA.
100:3983–3988. 2003. View Article : Google Scholar : PubMed/NCBI
|
|
6
|
Proceedings of the National Academy of
Sciences of the United States of America, . Annual subject and
author indexes. Proc Natl Acad Sci USA. 87 (Suppl):S10069–S10240.
1990.
|
|
7
|
Bray F, Ferlay J, Soerjomataram I, Siegel
RL, Torre LA and Jemal A: Global cancer statistics 2018: GLOBOCAN
estimates of incidence and mortality worldwide for 36 cancers in
185 countries. CA Cancer J Clin. 68:394–424. 2018. View Article : Google Scholar : PubMed/NCBI
|
|
8
|
Pike MC, Spicer DV, Dahmoush L and Press
MF: Estrogens, progestogens, normal breast cell proliferation, and
breast cancer risk. Epidemiol Rev. 15:17–35. 1993. View Article : Google Scholar : PubMed/NCBI
|
|
9
|
Braun S and Harbeck N: Molecular markers
of metastasis in breast cancer: Current understanding and prospects
for novel diagnosis and prevention. Expert Rev Mol Med. 3:1–14.
2001. View Article : Google Scholar : PubMed/NCBI
|
|
10
|
Darbre PD and King RJ: Steroid hormone
regulation of cultured breast cancer cells. Cancer Treat Res.
40:307–341. 1988. View Article : Google Scholar : PubMed/NCBI
|
|
11
|
Hu F, Wang C, Du J, Sun W, Yan J, Mi D,
Zhang J, Qiao Y, Zhu T and Yang S: DeltaEF1 promotes breast cancer
cell proliferation through down-regulating p21 expression. Biochim
Biophys Acta. 1802:301–312. 2010. View Article : Google Scholar : PubMed/NCBI
|
|
12
|
Hu F, Meng X, Tong Q, Liang L, Xiang R,
Zhu T and Yang S: BMP-6 inhibits cell proliferation by targeting
microRNA-192 in breast cancer. Biochim Biophys Acta.
1832:2379–2390. 2013. View Article : Google Scholar : PubMed/NCBI
|
|
13
|
Hu F, Gou L, Liu Q, Zhang W, Luo M and
Zhang X: G-patch domain containing 2, a gene highly expressed in
testes, inhibits nuclear factor-KB and cell proliferation. Mol Med
Rep. 11:1252–1257. 2015. View Article : Google Scholar : PubMed/NCBI
|
|
14
|
Liu Q, Song YJ, Meng LJ, Hu F, Gou LX, Jia
CH, Tang HM, Wang WJ, Li M, Zhang XJ and Jia MC: Role of LM23 in
cell proliferation and apoptosis and its expression during the
testis development. Asian J Androl. 15:539–544. 2013. View Article : Google Scholar : PubMed/NCBI
|
|
15
|
Hu F, Yang S, Lv S, Peng Y, Meng L, Gou L
and Zhang X: Analysis of AC3-33 gene expression in multiple organ
cancer and adjacent normal tissue by RNA in situ
hybridization. Oncol Lett. 9:2795–2798. 2015. View Article : Google Scholar : PubMed/NCBI
|
|
16
|
Zhao F, Pan S, Gu Y, Guo S, Dai Q, Yu Y
and Zhang W: Small activating RNA restores the activity of the
tumor suppressor HIC-1 on breast cancer. PLoS One. 9:e864862014.
View Article : Google Scholar : PubMed/NCBI
|
|
17
|
R Core Team, . R: A language and
environment for statistical computingR Foundation for Statistical
Computing; Vienna, Austria: 2012, https://www.R-project.org
|
|
18
|
Zhang X, Hao L, Meng L, Liu M, Zhao L, Hu
F, Ding C, Wang Y, He B, Pan Y, et al: Digital gene expression tag
profiling analysis of the gene expression patterns regulating the
early stage of mouse spermatogenesis. PLoS One. 8:e586802013.
View Article : Google Scholar : PubMed/NCBI
|
|
19
|
Livak KJ and Schmittgen TD: Analysis of
relative gene expression data using real-time quantitative PCR and
the 2(-Delta Delta C(T)) method. Methods. 25:402–408. 2001.
View Article : Google Scholar : PubMed/NCBI
|
|
20
|
Huxford T, Malek S and Ghosh G: Structure
and mechanism in NF-kappa B/I kappa B signaling. Cold Spring Harb
Symp Quant Biol. 64:533–540. 1999. View Article : Google Scholar : PubMed/NCBI
|
|
21
|
Baldwin AS Jr: The NF-kappa B and I kappa
B proteins: New discoveries and insights. Annu Rev Immunol.
14:649–683. 1996. View Article : Google Scholar : PubMed/NCBI
|
|
22
|
Gebel HM, Braun DP, Tambur A, Frame D,
Rana N and Dmowski WP: Spontaneous apoptosis of endometrial tissue
is impaired in women with endometriosis. Fertil Steril.
69:1042–1047. 1998. View Article : Google Scholar : PubMed/NCBI
|
|
23
|
Rawlings JS, Rosler KM and Harrison DA:
The JAK/STAT signaling pathway. J Cell Sci. 117:1281–1283. 2004.
View Article : Google Scholar : PubMed/NCBI
|
|
24
|
Igaz P, Toth S and Falus A: Biological and
clinical significance of the JAK-STAT pathway; lessons from
knockout mice. Inflamm Res. 50:435–441. 2001. View Article : Google Scholar : PubMed/NCBI
|
|
25
|
O'Shea JJ, Gadina M and Schreiber RD:
Cytokine signaling in 2002: New surprises in the Jak/Stat pathway.
Cell. 109 (Suppl):S121–S131. 2002. View Article : Google Scholar : PubMed/NCBI
|
|
26
|
Kroon P, Berry PA, Stower MJ, Rodrigues G,
Mann VM, Simms M, Bhasin D, Chettiar S, Li C, Li PK, et al:
JAK-STAT blockade inhibits tumor initiation and clonogenic recovery
of prostate cancer stem-like cells. Cancer Res. 73:5288–5298. 2013.
View Article : Google Scholar : PubMed/NCBI
|
|
27
|
Hernandez-Vargas H, Ouzounova M, Le
Calvez-Kelm F, Lambert MP, McKay-Chopin S, Tavtigian SV, Puisieux
A, Matar C and Herceg Z: Methylome analysis reveals Jak-STAT
pathway deregulation in putative breast cancer stem cells.
Epigenetics. 6:428–439. 2011. View Article : Google Scholar : PubMed/NCBI
|
|
28
|
Plotnikov A, Zehorai E, Procaccia S and
Seger R: The MAPK cascades: Signaling components, nuclear roles and
mechanisms of nuclear translocation. Biochim Biophys Acta.
1813:1619–1633. 2011. View Article : Google Scholar : PubMed/NCBI
|
|
29
|
Davidson B, Konstantinovsky S, Kleinberg
L, Nguyen MT, Bassarova A, Kvalheim G, Nesland JM and Reich R: The
mitogen-activated protein kinases (MAPK) p38 and JNK are markers of
tumor progression in breast carcinoma. Gynecol Oncol. 102:453–461.
2006. View Article : Google Scholar : PubMed/NCBI
|
|
30
|
Cocolakis E, Lemay S, Ali S and Lebrun JJ:
The p38 MAPK pathway is required for cell growth inhibition of
human breast cancer cells in response to activin. J Biol Chem.
276:18430–18436. 2001. View Article : Google Scholar : PubMed/NCBI
|
|
31
|
Reichert TE, Kashii Y, Stanson J, Zeevi A
and Whiteside TL: The role of endogenous interleukin-2 in
proliferation of human carcinoma cell lines. Br J Cancer.
81:822–831. 1999. View Article : Google Scholar : PubMed/NCBI
|
|
32
|
Schreiber G and Piehler J: The molecular
basis for functional plasticity in type I interferon signaling.
Trends Immunol. 36:139–149. 2015. View Article : Google Scholar : PubMed/NCBI
|