Introduction
Renal cell carcinoma originates from the renal
tubule or collecting duct epithelial cells, and is one of the most
common malignant tumors in the urinary system, accounting for 85%
of renal malignancies (1). Clear
cell renal cell carcinoma (ccRCC) is the most common renal cell
carcinoma type accounting for ~70% of cases (2). At present, the most widely used tumor
grading system for renal carcinomas is the Fuhrman grading system,
which was first proposed by Fuhrman et al in 1982 (3). According to the tumor cell nucleus
size, the nucleus shape and whether the nucleoli are obvious, renal
carcinoma cases could be divided into 4 grades. The Fuhrman grading
system has important value in evaluating the prognosis of renal
cell carcinomas (4,5), representing the optimal effective
indicator for predicting renal tumor invasion (6). It has been shown that there are
significant differences in the survival rates between groups with
high and low Fuhrman grading levels (7,8). When
tumor cells are divided into low (Fuhrman I–II) and high (Fuhrman
III–IV) grades, satisfactory consistency may be expected. A
previous study has reported that renal tumors with high Fuhrman
grades are more invasive, therefore, a more rigorous follow-up plan
should be implemented after kidney preservation (9).
In recent years, with the rapid development of
energy spectrum CT imaging technology, CT has changed from
single-parameter imaging to multi-parameter imaging, and from
reflecting the gross morphology to microscopic features of lesions,
with tissue specificity (10,11).
FORCE CT pure-spectrum photon technology enables precise separation
of multi-substance components, which can automatically generate
iodine- and single-energy-images, and the following parameters can
be obtained: Virtual network computing (VNC) CT values,
single-energy CT values, mixed energy CT values, iodine
concentration and normalized iodine concentration (NIC) of the
regions of interest (12). Previous
studies have shown that the most important indicator for the
differential diagnosis of ccRCCs is the degree of lesion
enhancement (13,14). Therefore, the lesion enhancement may
be more accurately evaluated with the dual-energy parameters, in
order to identify the pathological grade. It has also been applied
in the diagnosis of renal carcinomas (15–17).
Quantitative and semi-quantitative FORCE dual-energy CT parameters
can reflect the microstructure of tumor tissue to a certain extent.
These parameters can be used as evaluating indexes for the
biological behavior of ccRCC. However, it has rarely been used in
evaluating carcinomas according to the Fuhrman's grading
system.
In this study, to evaluate the value of dual-energy
CT in the renal carcinoma classification, the FORCE dual-energy
parameters and the associated Fuhrman grading results of the ccRCCs
were investigated. Dual-energy CT was used to evaluate the
pathological grades of ccRCC, in order to determine the degree of
malignancy based on imaging findings, to guide the choice of renal
carcinoma treatment options and provide reference for treatment
with nephron sparing surgery and active monitoring of renal
carcinomas.
Materials and methods
Study subjects
This study included a total of 35 patients with
primary single-sided ccRCC, who received abdominal FORCE
dual-energy CT-enhanced scanning and had the diagnosis confirmed by
surgery and pathology, between December 2017 and August 2018 in
Qilu Hospital. Exclusion criteria were as follows: (i) Previous
abdominal surgery, or preoperative radiotherapy, chemotherapy, and
targeted therapy; (ii) cardiovascular disease and kidney disease,
severely affecting the degree of kidney enhancement; and (iii)
imaging showing the cystic kidney cancer with less substantial
composition. Among the included patients, there were 26 males and 9
females, with an mean age of 55.1 years (range, 37–71 years). In
addition, 17 cases of the cases were carcinomas of the left kidney
and 18 cases were located in the right kidney, with maximum and
minimum diameters of 10.1 and 1.3 cm, respectively. Prior written
and informed consent were obtained from every patient, and the
study was approved by the Ethics Review Board of the Qilu
Hospital.
CT scanning
CT scanning was performed with the Somatom FORCE CT
machine (Siemens). Standard protocol was followed as all patients
were asked to hold their breath during the scanning process, and
were subjected to fasting for 4 h prior to the scan, as they
received 500 ml 5% diatrizoate before the enhanced scanning. All
patients received 60–80 ml non-ionic contrast agent iohexol (300
milligrams of iodine per milliliter) by injection into the forearm
with a high-pressure syringe, with the injection flow rate of 3–5
ml/sec. For the arterial phase (medullary phase) and the venous
phase (renal parenchyma phase), scanning delay time was set at 30
and 80 sec after the injection of contrast agent, using the
dual-energy mode, with the tube voltage of 100 kilovolt peak (kVp)
and tin filter (Sn) 150 kVp, respectively. The automatic exposure
system was activated, with the tube currents of 130–180
milliampere-seconds (mAs) and 80–90 mAs, for 100 kVp and Sn 150
kVp, respectively.
Image analysis
Images of 100 kVp and Sn150 kVp were obtained from
the scan, with the reconstructing layer thickness of 1.0 mm and
layer spacing of 1.0 mm. The image data were analyzed with the
dual-energy post-processing workstation (syngo.via; version VB10;
Siemens Healthineers). The iodine maps and virtual network
computing images for the arterial and venous phases were obtained
using the Liver VNC (18) method.
Based on the iodine maps, the VNC CT value (VNCV), iodine overlay
value (IOV), mixed energy CT value (MEV), iodine concentration
(IC), and the tumor IC difference of artery phase and venous phase
(DIC) were measured and recorded. The NIC was measured by the
normalization method, including the NIC based on aorta (NICA), NIC
based on cortex (NICC) and NIC based on medulla (NICM). The
single-energy CT values and the tumor energy spectrum for the
arterial phase of the 40, 60, 80, 100, 120 and 140 kiloelectron
volt (keV) were obtained with the single-energy software. The slope
of the energy spectrum curve was calculated using the following
formula: k=[hounsfield unit (HU)40 keV-HU100 keV]/100 keV-40 keV.
The CT images were independently analyzed, measured and recorded by
two senior imaging diagnosticians in Qilu Hospital with the PACS
system (Agfa Graphics Ltd.) and the FORCE CT workstation, in a
blinded manner in terms of the surgical and pathological results.
The area of interest was selected to be as large as possible where
the necrotic areas and blood vessels were avoided. The data
obtained were comprehensively compared and the consistency of the
researchers was performed using the Kappa-test. Two different
technologists read the measurements, and if their opinions were
different, a third technologist should be involved to settle the
discrepancy. The measurement was conducted again based on the
discussion and negotiation.
Hematoxylin and eosin (HE)
staining
The surgical ccRCC tissures were fixed in 10%
formalin at room temperature for 6–48 h, and the gross pathological
condition was observed. After paraffin embedding at 60°C for 4 h,
the specimens were cut into 4-µm continuous sections, which were
subjected to HE staining (Fuzhou Maixin Biotech Co., Ltd.).
Pathological image analysis
The pathological images were analyzed under light
microscope (magnification, ×100; Olympus Corporation) by two
experienced pathologists from Qilu Hospital in a blinded manner in
terms of CT findings. The specimens diagnosed as ccRCC were graded
using the following Fuhrman grading system: Grade I, small and
round nucleus, diameter 10 µm, and size similar to the red blood
cells, with uniform size and no obvious nucleoli; grade II,
slightly irregular nucleus (nucleoli obvious), with the same size
and diameter of 15 µm; grade III, irregular nucleus (nucleoli large
and obvious), diameter 20 µm; and grade IV, singular nucleus (or
lobulated), diameter ~25 µm and large nucleoli. Using HE staining,
renal carcinomas with the Fuhrman grades of I–II and grades III–IV
were classified as the low-grade group and the high-grade group,
respectively.
Statistical analysis
Data were expressed as mean ± standard error.
Statistical analysis was performed using the SAS 9.2 software (SAS
Institute, Inc.). After the Shapiro-Wilk normality test, the
unpaired Student's t-test was performed for group comparison.
Receiver operator characteristic curve (ROC) analysis was
performed, and the area under curve (AUC), sensitivity and
specificity of each index were analyzed. P<0.05 was considered
to indicate a statistically significant difference.
Results
Dual-energy CT performance
Dual-energy CT performance was first analyzed, and
among these 35 patients with ccRCC, the largest cross-sectional
length of the tumor ranged between 1.3 and 10.1 cm. There were 22
cystic cases and 20 pseudo-enveloped cases. The pseudo-enveloped
cases were persistently mild or moderately enhanced, and the
necrotic cystic area was not enhanced. In 17 cases, the lesions
were located in the left kidney, and in the remaining 18 cases, the
lesions were located in the right kidney. Out of the 35 cases, 24
cases had a maximum cross-sectional long diameter >4 cm, and in
these 24 patients, there were 6 cases with a maximum
cross-sectional long diameter >7 cm. On the other hand, there
were 29 cases with a maximum cross-sectional diameter <7 cm, and
in those patients, there were 11 cases with the maximum
cross-sectional diameter <4 cm. Furthermore, in these 35
patients, there were 31 with uneven enhancement, including necrotic
cystic changes, hemorrhagic non-enhanced areas and obvious blood
supply, and 4 patients with even enhancement, which was defined as
the difference between the highest and lowest CT values in tumor
<20 HU.
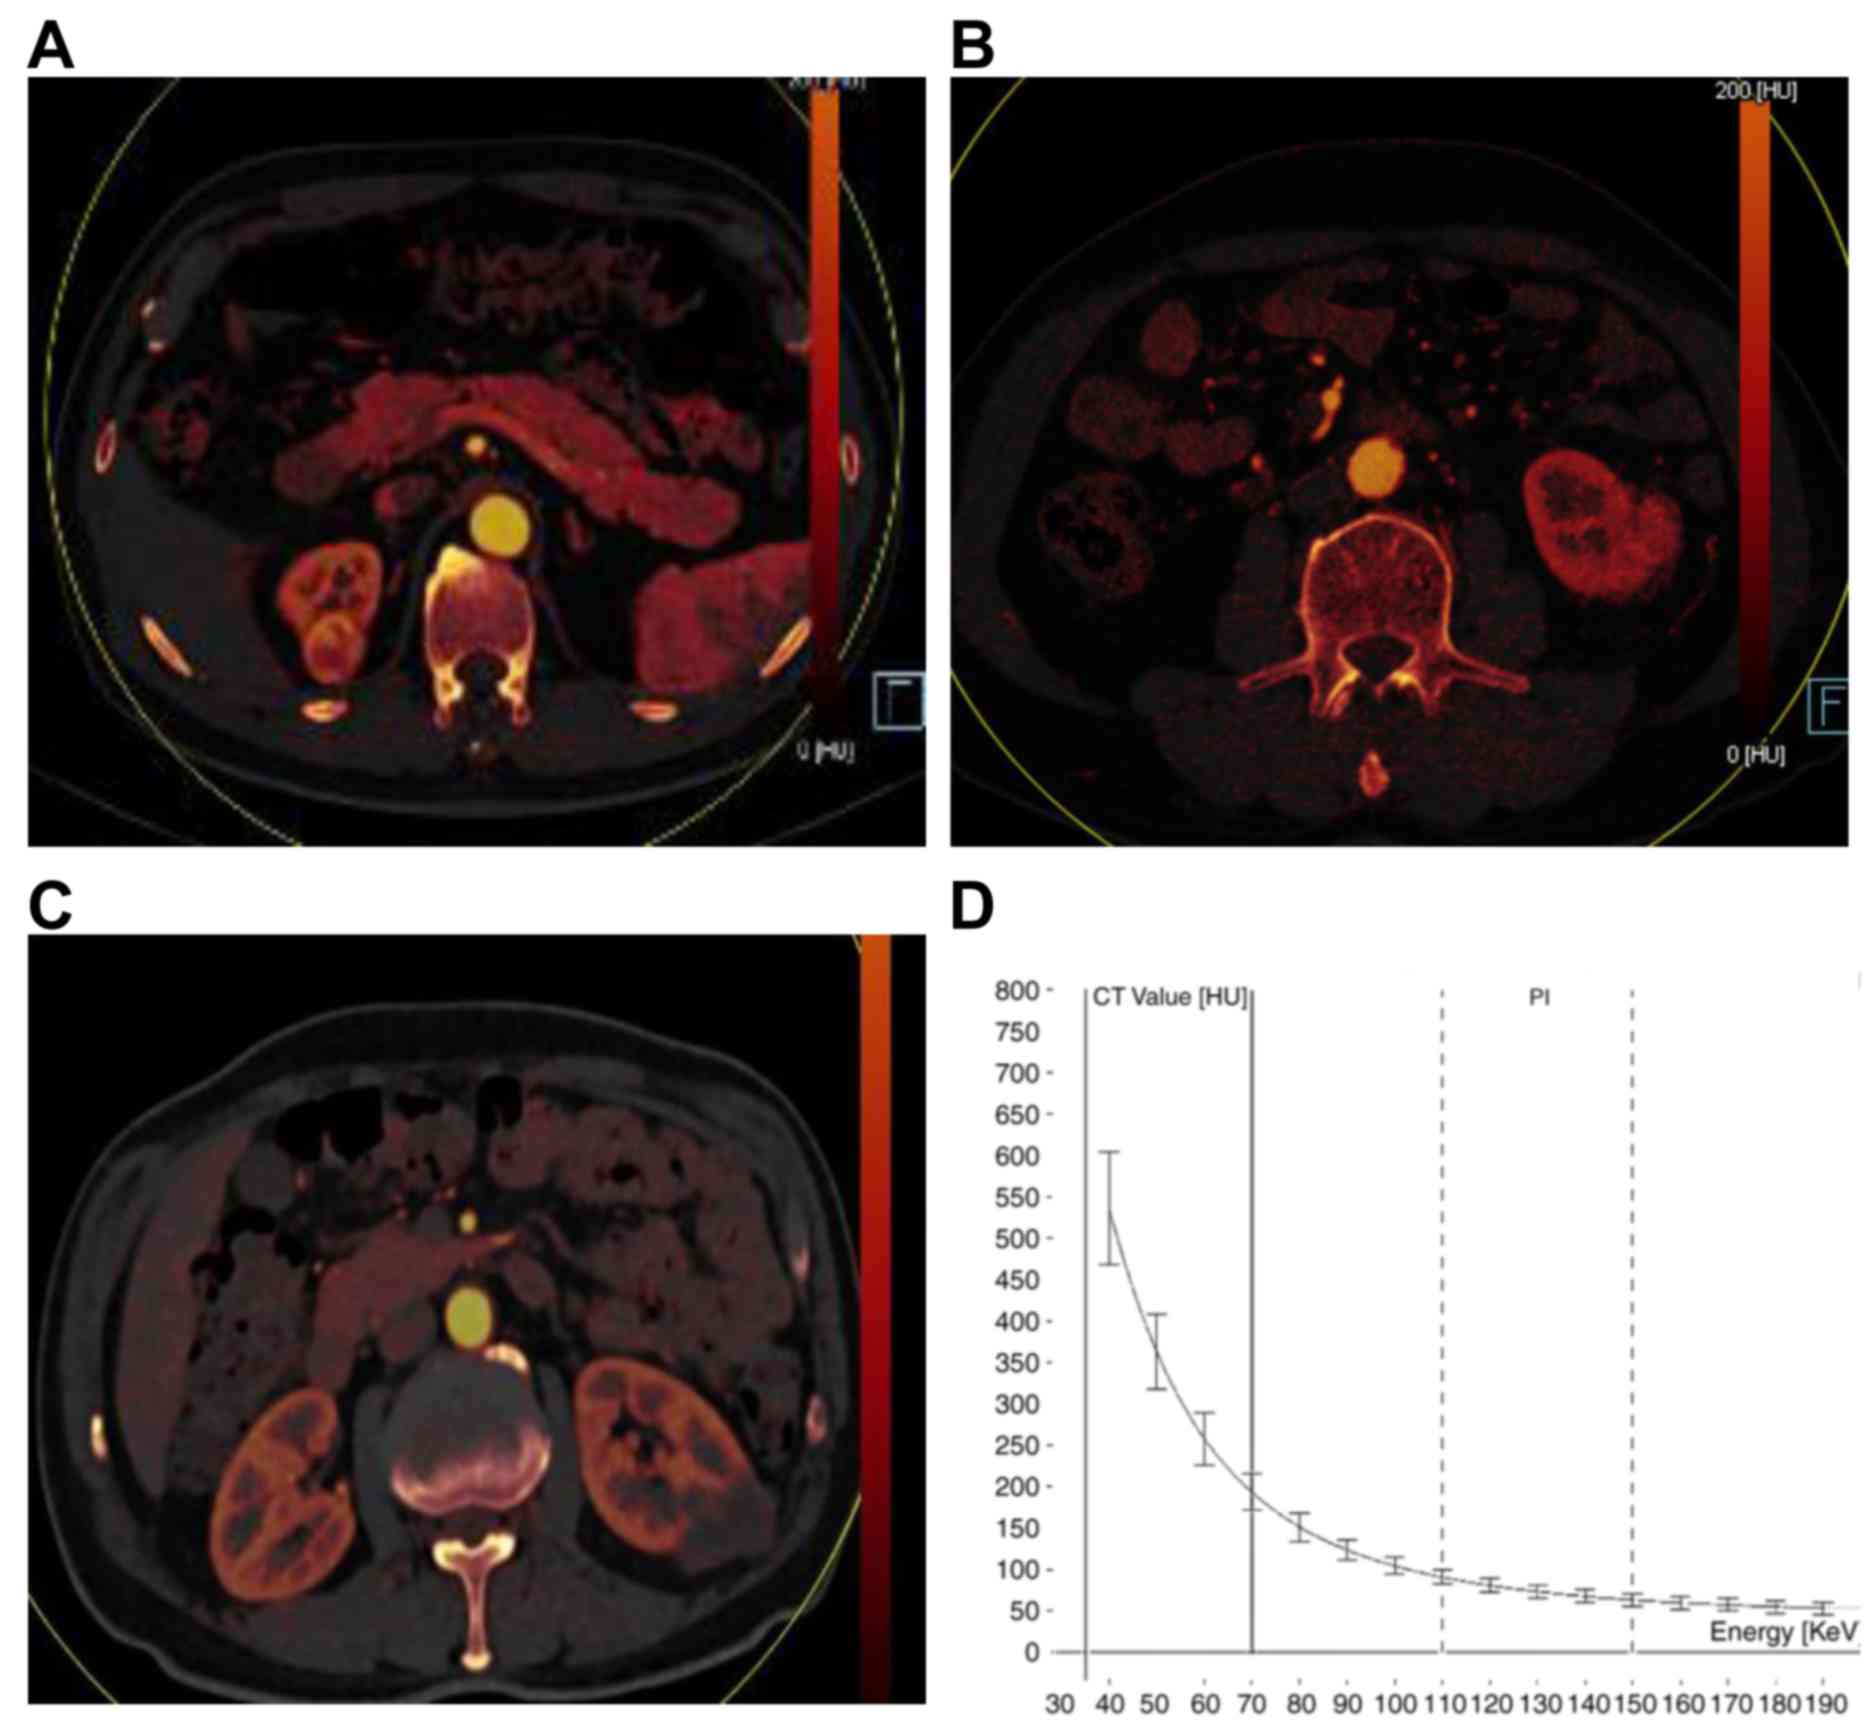
In addition, the majority of the ccRCC tumor was
enhanced for the arterial phase, with a red iodine map (partially
bright orange), similar to the renal cortex (Fig. 1A-C), which was reduced during the
venous phase (Fig. 1D). The
single-energy image showed that, along with the increased
single-energy keV, the single-energy CT value of the tissue was
gradually decreased, and the difference in CT values between
tissues became smaller; while with decreased single-energy keV, the
CT value of the tissue was gradually increased, and the difference
in CT values between tissues became larger (Fig. 2). These results suggest that, the
tissue resolution would be elevated along with the increasing keV
level.
Pathological results
The pathological findings were subsequently
investigated. The results showed that the tumor surface was light
yellow (or grayish white), and the sectional surface could be
multicolored. The non-tumor surface had a flesh-pink coloring. In
some cases, the tumors compressed the surrounding tissue to form a
pseudo-envelope. Changes like focal necrosis, hemorrhage and
calcification were commonly observed.
Among the 35 cases of ccRCCs, there were 2 cases of
Fuhrman grade I, 25 cases of grade II, 7 cases of grade III and 1
case of grade IV. Therefore, there were 27 cases in the low-grade
group and 8 cases in the high-grade group. Focal necrosis,
hemorrhage and calcification were found in 7, 1 and 6 cases
respectively. These results indicate that ccRCCs are rich in blood
supply, with great heterogeneity.
Dual-energy CT iodine map index for
ccRCCs
The Kappa test showed that the two radiologists'
measurement results were consistent. The results of the t-test
comparing the dual-energy CT iodine map index between low- and
high-grade ccRCCs are presented in Table
I, and the mean values of the dual-energy CT iodine map index
for the 35 cases of ccRCCs are shown in Table II. The dual-energy CT parameters for
the venous period in the low-grade group, including the IOV, MEV
and IC, were greater than the high-grade group. Among these
indicators, significant differences were observed in the IOV, MEV
and IC for the arterial phase, and the IOV and IC for the venous
phase between the low- and high-grade groups (P<0.01). In
addition, there was no significant difference in the VNCV for both
phases and the MEV for venous phase between the two groups
(P>0.05). These results suggest that arterial IOV, MEV and IC,
as well as venous IOV and IC, have certain values in the
identification of high and low grades of ccRCC.
 | Table I.Dual-energy CT iodine map indicators
for low- and high-grade clear cell renal cell carcinomas. |
Table I.
Dual-energy CT iodine map indicators
for low- and high-grade clear cell renal cell carcinomas.
| Dual-energy CT iodine
map indicators | Low-grade, n=27 | High-grade, n=8 | t-test | P-value |
|---|
| VNCV | 35.82±1.44 | 37.76±1.84 | −0.68 | 0.501 |
| Arterial phase
IOV | 93.96±7.45 | 48.86±10.57 | 3.03 | 0.005 |
| Arterial phase
MEV | 129.60±7.46 | 87.88±11.28 | 2.77 | 0.009 |
| Arterial phase
IC | 3.98±0.28 | 2.13±0.44 | 3.25 | 0.003 |
| Venous phase IOV | 75.57±5.33 | 43.47± 6.95 | 3.04 | 0.005 |
| Venous phase IC | 3.35±0.26 | 1.93±0.31 | 3.13 | 0.004 |
| DIC | 0.39±0.16 | 0.20± 0.28 | 0.62 | 0.529 |
| Table II.FORCE dual-energy CT normalized
parameters for low- and high-grade clear cell renal cell
carcinomas. |
Table II.
FORCE dual-energy CT normalized
parameters for low- and high-grade clear cell renal cell
carcinomas.
| CT normalized
parameters | Low-grade, n=27 | High-grade, n=8 | t-test | P-value |
|---|
| NICA | 0.33±0.023 | 0.19±0.04 | 2.92 | 0.006 |
| NICC | 0.80±0.05 | 0.48±0.09 | 3.03 | 0.005 |
| NICM | 3.60±0.31 | 3.23±0.55 | 0.57 | 0.572 |
FORCE CT-normalized index for
ccRCC
The results of the t-test comparing the FORCE
CT-normalized index for low- and high-grade ccRCCs are presented in
Table II. The results showed that
the NICA and NICC values for the arterial phase in the low-grade
group were significantly higher than the high-grade group
(P<0.01). However, no significant difference was observed in the
NICM between the low- and high-grade groups (P>0.05). NICA and
NICC values for the arterial phase were used to identify the
pathological grades of renal tumors, while the value of NICM was
not significant.
FORCE dual-energy CT single-energy
index for ccRCCs
The results of the t-test comparing the FORCE
dual-energy CT single-energy index for low- and high-grade ccRCCs,
and the single-energy CT values for the arterial phase (VTA) at
40–140 keV for these 35 cases are presented in Table III. These results revealed that the
CT value for the arterial phase peaked at 40 keV. In addition, with
increase keV, the VTA decreased, and significant differences were
observed in the VTA at the 40, 60, 80 and 100 keV levels between
the low- and high-grade groups (P<0.05), while no significant
differences were observed in the VTA at 120–140 keV levels between
these two groups (P>0.05). Furthermore, the mean k-slopes of the
tumor energy spectrum curves for the low- and high-grade groups
were 4.76±0.36 and 2.65±0.60, respectively, and the k-slope for the
low-grade group was significantly higher than the low-grade group
(P<0.05). These results suggest that the arterial phase CT value
and the energy spectrum curve slope (K) at low keV level (40–100
keV) can be used as an evaluation index for renal tumor
grading.
| Table III.FORCE CT single-energy indicator (VTA,
k) for low- and high-grade clear cell renal cell carcinomas. |
Table III.
FORCE CT single-energy indicator (VTA,
k) for low- and high-grade clear cell renal cell carcinomas.
| Single-energy,
keV | Low-grade, n=27 | High-grade, n=8 | t | P-value |
|---|
| 40 | 366.70±24.66 | 221.50±41.46 | 2.85 | 0.007 |
| 60 | 180.90±10.91 | 119.00±18.40 | 2.76 | 0.009 |
| 80 | 110.80±5.81 | 79.69±9.59 | 2.62 | 0.001 |
| 100 | 80.54±3.52 | 62.60±5.77 | 2.49 | 0.018 |
| 120 | 63.53±2.51 | 53.96±3.92 | 1.88 | 0.069 |
| 140 | 54.73±1.97 | 48.94±2.73 | 1.48 | 0.149 |
| 160 | 50.03±1.72 | 46.31±2.39 | 1.08 | 0.290 |
| k | 4.76±0.36 | 2.65±0.60 | 2.88 | 0.007 |
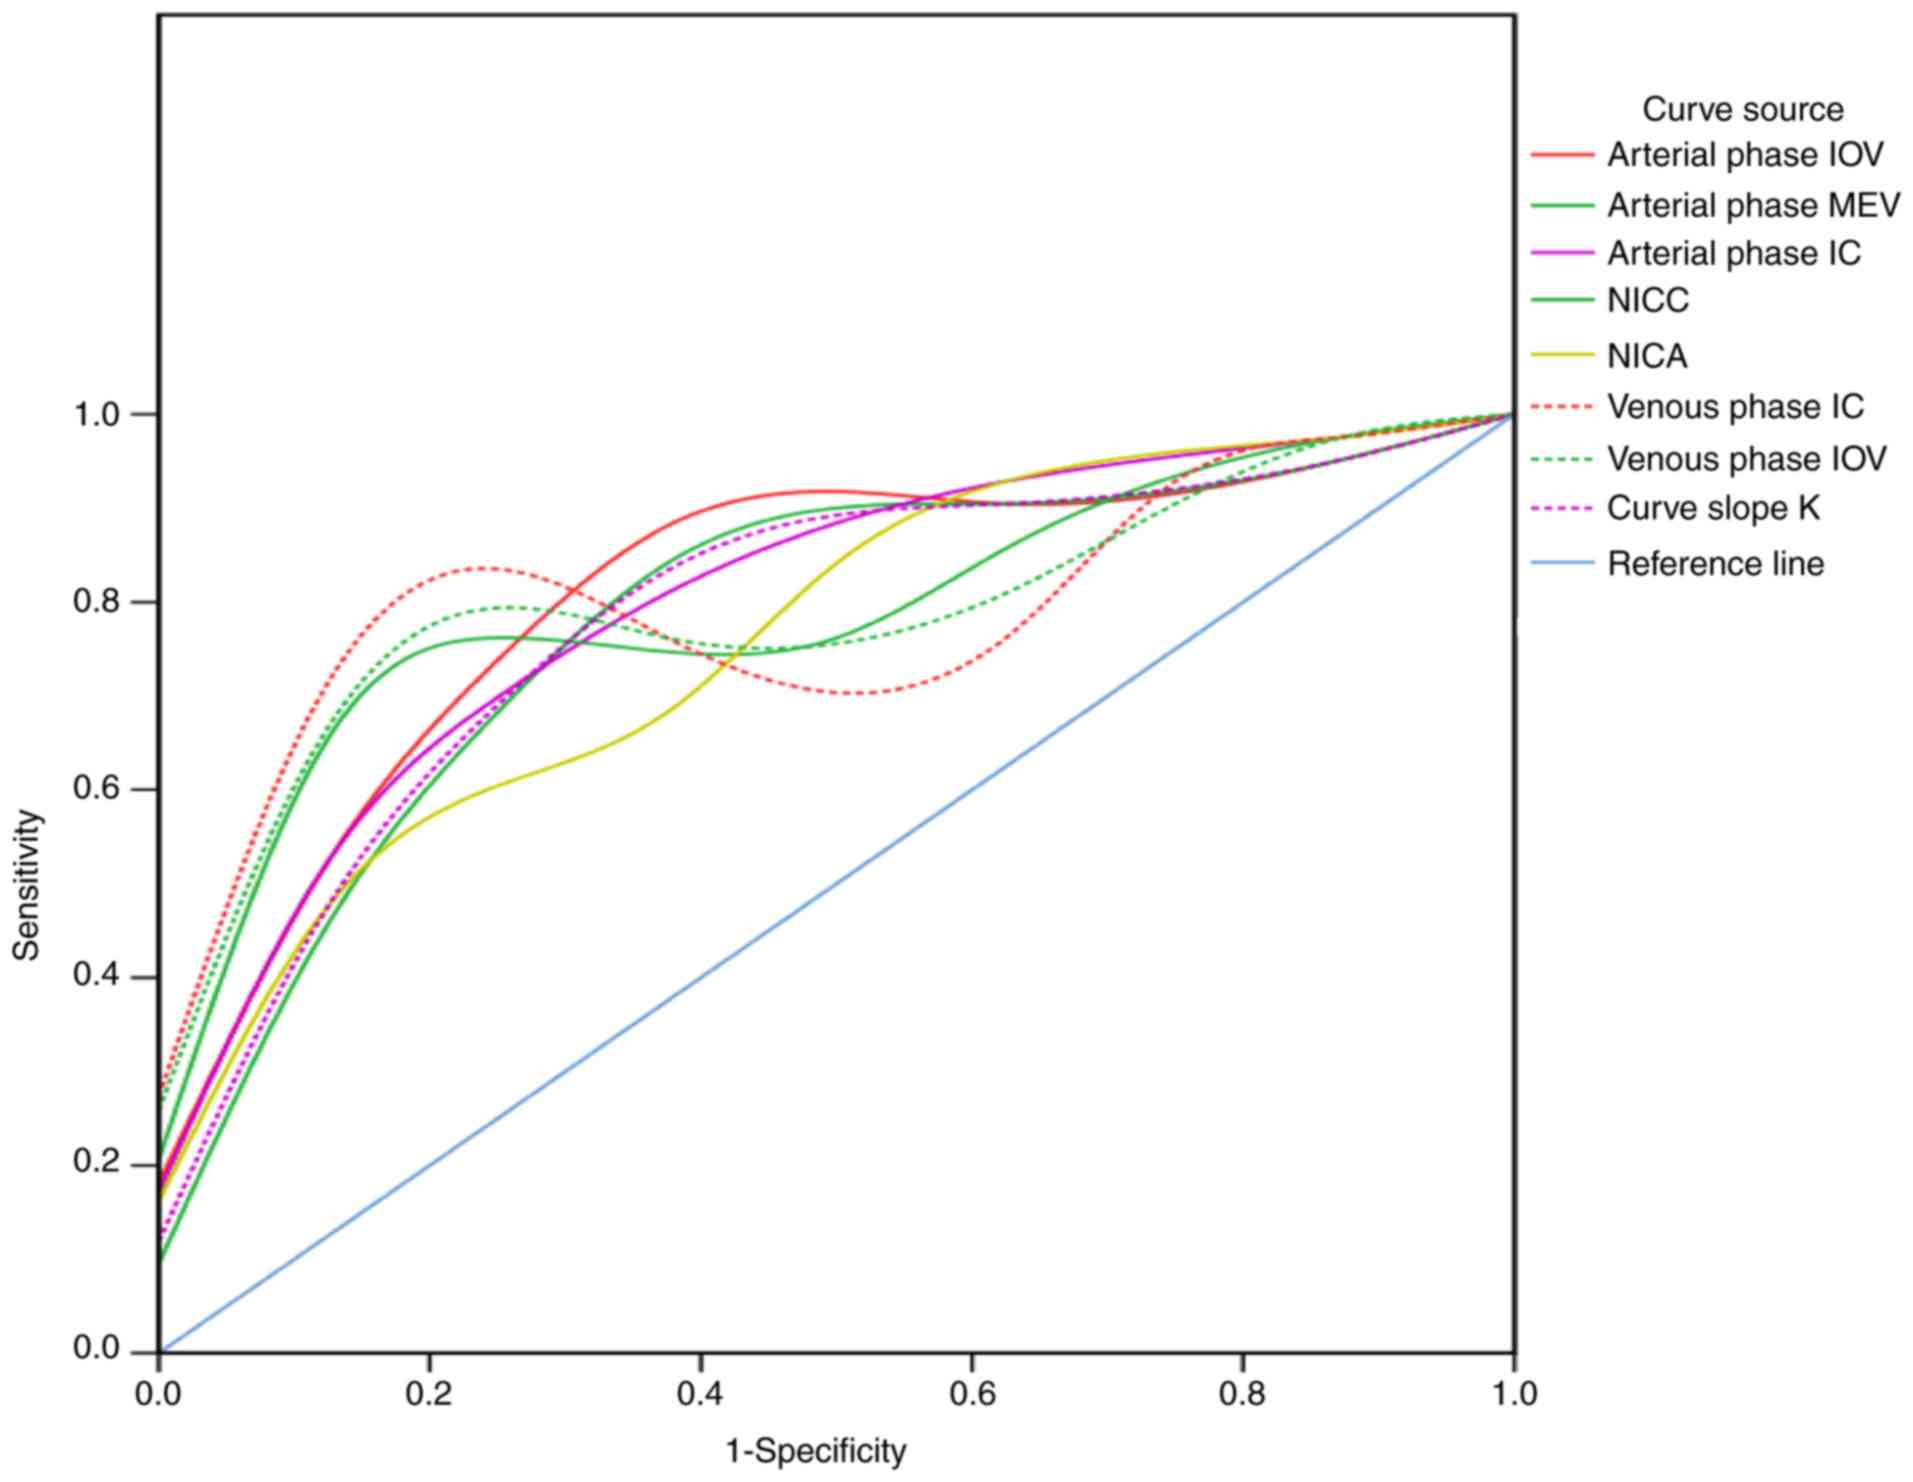
ROC curve analysis of dual-energy CT
parameters for ccRCCs
Results from the ROC curve analysis of dual-energy
CT parameters are presented in Fig.
2 and Table IV. The results
indicated that the AUC values for the arterial phase IOV, arterial
phase MEV, arterial phase IC, aortic NIC, cortical NIC, venous
phase IOV, venous phase IC and curve slope K were 0.81, 0.78, 0.80,
0.76, 0.80, 0.80, 0.81 and 0.79, respectively. This suggests that
the aforementioned indicators may be of high value for the
identification of high- and low-grade ccRCCs. Among these
indicators, the diagnostic cut-off value for arterial phase IOV was
57.30, with sensitivity and specificity of 0.86 and 0.75,
respectively. The diagnostic cut-off value for arterial phase IC
was 2.65, with sensitivity and specificity of 0.76 and 0.75,
respectively. The diagnostic cut-off value for cortical NIC was
0.66, with sensitivity and specificity of 0.76 and 0.88,
respectively. The sensitivity and specificity of IOV were 0.86 and
0.75, respectively, and the sensitivity and specificity of IC were
0.76 and 0.75, respectively. The diagnostic cut-off value for curve
slope K was 3.04, with sensitivity and specificity of 0.76 and
0.75, respectively. These results suggest that dual-energy CT
parameters, including IOV, IC, NIC and K, have certain value in the
identification of high- and low-grades of ccRCCs.
| Table IV.Receiver operator characteristic
curve analysis of dual-energy CT parameters. |
Table IV.
Receiver operator characteristic
curve analysis of dual-energy CT parameters.
| CT parameters | AUC | Cut-off value | Sensitivity | Specificity |
|---|
| Arterial phase
IOV | 0.81 | 57.30 | 0.86 | 0.75 |
| Arterial phase
MEV | 0.78 | 97.35 | 0.76 | 0.75 |
| Arterial phase
IC | 0.80 | 2.65 | 0.76 | 0.75 |
| NICA | 0.76 | 0.21 | 0.91 | 0.50 |
| NICC | 0.80 | 0.66 | 0.76 | 0.88 |
| Venous phase
IOV | 0.80 | 61.60 | 0.76 | 0.88 |
| Venous phase
IC | 0.81 | 2.70 | 0.76 | 0.88 |
| Curve slope K | 0.79 | 3.04 | 0.76 | 0.75 |
Discussion
With the development of imaging technology, energy
spectrum CT imaging has gradually become a research hotspot, and
this has transformed CT from single-parameter imaging to
multi-parameter imaging (19).
Through unique energy spectrum scanning and image post-processing
technology, a wider range of lesions with multiple parameters can
be identified and quantitative analysis can be performed (20). Therefore, CT reflects the gross
morphology of the lesions and the macroscopic features, which may
serve a prospective role in objectively assessing the tissue
characteristics and functional status of the lesions (21–23).
FORCE dual-energy CT represents an extremely
advanced spiral CT, with high density and time resolution (24,25). In
addition to two- and three-dimensional recombination like ordinary
spiral CT, its unique pure-spectrum photon energy purification
technology enables dual-energy imaging, which allows for more
accurate energy-and-material separation (10). Using spectral purification
technology, the radiation dose can be effectively reduced while
meeting the diagnostic requirements. During only one scanning
event, the parameters, such as the VNCV, IOV, MEV, IC, NIC and CT
values at different single-energy levels, can be obtained, and this
study speculated that these parameters are not interfered by normal
affecting factors. Therefore, the technology may allow more precise
measurements of lesion iodine uptake, thereby contributing
quantitative determination of the enhancement degree of tissue and
organs, as well as the blood supply, which effectively reflects the
microstructure and hemodynamic changes of tumor tissues (26). This information may assist in
obtaining a more accurate and comprehensive qualitative and
quantitative disease diagnosis.
Dual-energy CT iodine quantification has been
applied in the differential diagnosis of benign and malignant renal
tumors for tumor classification, and the majority of the machines
are less advanced dual-energy CT (10–12).
FORCE dual-energy CT allows pathological grading of renal tumors by
quantitative determination of substance and energy separately. In
the present study, the results showed that the AUC for arterial
phase IOV, arterial phase MEV, arterial phase IC, aortic NIC,
cortical NIC, venous phase IOV, venous phase IC and curve slope K
of high- and low-grade renal cell carcinomas were 0.810, 0.780,
0.804, 0.762, 0.804, 0.798, 0.807 and 0.786, respectively,
suggesting high value for the pathological grading of renal tumors.
High grade ccRCC cases had low levels of IOV and IC values, which
was in accordance with previous literature (27–29).
Among these indicators, the AUC of the arterial phase IOV was the
largest, with the diagnostic cut-off value of 57.30, and
sensitivity and specificity of 0.857 and 0.750, respectively. The
reason for this may be that the degree of tumor enhancement was
associated with the vascularization status (30–32). The
lower grade was associated with mature microvessels and therefore,
an effective blood supply could be transported to the tumor,
resulting in larger IC and IOC values. In contrast, the higher
grade was associated with less mature microvessels and lower
lumenization level, with an insufficient blood supply leading to
lower levels of IC and IOC values. In addition, the high-grade
tumors had immature vessels with high permeability, which may lead
to increased blood viscosity and interstitial osmotic pressure, as
one of the reasons for the decreased blood flow velocity (27). In order to correct the system iodine
load error, the relative iodine concentration ratios were also used
for the dual-energy CT parameters, including the NIC for the tumor
compared with the aorta, cortex and medulla. These results showed
that there was statistical significance for the normalized NIC
values for the tumor based on aorta and cortex, with the AUC values
of 0.762 and 0.804, respectively, suggesting their diagnostic value
for the high- and low-grade renal cell carcinomas.
The findings of the present study indicated that for
the 40–100 keV single-energy levels, significant differences were
observed in the tumor CT value for the arterial phase between the
low- and high-grade groups, while there was no significant
difference in the CT value at the 120–160 single-energy levels. The
reason may be that higher keV resulted in decreased CT values of
the tissues, and less significant differences in CT values between
tissues, and between low- and high-grade groups. Through the
analysis of the tumor energy spectrum curve, the results showed
that the slope of the energy spectrum curve peaked at the 40–100
keV levels. Therefore, the following curve slope k used herein was
calculated according to the following formulation: k=(HU40
keV-HU100 keV)/100 keV- 40 keV=(HU40
keV-HU100 keV)/60 keV. The results showed that the
AUC value for the k-value in diagnosing advanced ccRCC cases was
0.78, with a diagnostic cut-off value of 3.04, and sensitivity and
specificity of 0.76 and 0.75, respectively, which could be applied
as a useful diagnostic indicator. These results suggest that the
curve slope k has certain value in the pathological grading of
renal tumors.
FORCE dual-energy CT can provide higher accuracy
when reflecting the renal cancer microstructure, with better
diagnostic value compared with conventional enhanced CT. The
dual-energy parameters have certain tissue specificity, which can
accurately reflect the tissue composition (10). However, the iodine map could
accurately extract the iodine representing the enhancement degree,
so as to objectively and accurately reflect the blood supply and
microvessels for the tumors (19).
There are certain limitations to the current study, including a
limited sample size of dual-energy CT-examined cases and a lack of
analysis of other types of renal tumors. Further in-depth studies
are required to address these issues.
Quantitative and semi-quantitative FORCE dual-energy
CT parameters may reflect the microstructure of tumor tissues to a
certain extent. The findings of the present study suggest that
these parameters could be used as an index to evaluate the
biological behavior of ccRCCs, contributing to clinical treatment
choice and prognostic assessment.
Acknowledgements
Not applicable.
Funding
The present study was supported by the Fundamental
Research Funds of Shandong University (grant no. 2014QLKY01).
Availability of data and materials
The datasets used and/or analyzed during the present
study are available from the corresponding author on reasonable
request.
Authors' contributions
AO designed the study and collected the funds. CZ
and NW collected the data. XS and KL performed the statistical
analysis and drafting. AO and DY interpreted the data. KL and DY
searched the literature. CZ and KL prepared the manuscript. All
authors read and approved the final manuscript.
Ethics approval and consent to
participate
Prior written and informed consent were obtained
from every patient. The present study was approved by the Ethics
Review board of Qilu Hospital, Shandong University.
Patient consent for publication
Not applicable.
Competing interests
The authors declare that they have no competing
interests.
References
|
1
|
Kim JK, Kim TK, Ahn HJ, Kim CS, Kim KR and
Cho KS: Differentiation of subtypes of renal cell carcinoma on
helical CT scans. AJR Am J Roentgenol. 178:1499–1506. 2002.
View Article : Google Scholar : PubMed/NCBI
|
|
2
|
Hu Y, Lu J, Li Y, et al: Expression level
of lncRNA CCAT2 is related with the clinical stage of RCC. Chinese
J Clin. 2015.(In Chinese).
|
|
3
|
Fuhrman SA, Lasky LC and Limas C:
Prognostic significance of morphologic parameters in renal cell
carcinoma. Am J Surg Pathol. 6:655–663. 1982. View Article : Google Scholar : PubMed/NCBI
|
|
4
|
Ljungberg B, Cowan NC, Hanbury DC, Hora M,
Kuczyk MA, Merseburger AS, Patard JJ, Mulders PF and Sinescu IC;
European Association of Urology Guideline Group, : EAU guidelines
on renal cell carcinoma: The 2010 Update. Eur Urol. 58:398–406.
2010. View Article : Google Scholar : PubMed/NCBI
|
|
5
|
Lohse CM and Cheville JC: A review of
prognostic pathologic features and algorithms for patients treated
surgically for renal cell carcinoma. Clin Lab Med. 25:433–464.
2005. View Article : Google Scholar : PubMed/NCBI
|
|
6
|
Teng J, Gao Y, Chen M, Wang K, Cui X, Liu
Y and Xu D: Prognostic value of clinical and pathological factors
for surgically treated localized clear cell renal cell carcinoma.
Chin Med J (Engl). 127:1640–1644. 2014.PubMed/NCBI
|
|
7
|
Lang H, Lindner V, de Fromont M, Molinié
V, Letourneux H, Meyer N, Martin M and Jacqmin D: Multicenter
determination of optimal interobserver agreement using the Fuhrman
grading system for renal cell carcinoma: Assessment of 241 patients
with >15-year follow-up. Cancer. 103:625–629. 2005. View Article : Google Scholar : PubMed/NCBI
|
|
8
|
Wang R, Wolf JS Jr, Wood DP Jr, Higgins EJ
and Hafez KS: Accuracy of percutaneous core biopsy in management of
small renal masses. Urology. 73:581–590. 2009. View Article : Google Scholar
|
|
9
|
Lin RF: Predictors of recurrence after
nephron-sparing surgery for renal cell carcinoma. PhD
dissertationFujian Medical University; 2017
|
|
10
|
Punjabi GV: Multi-energy spectral CT:
Adding value in emergency body imaging. Emerg Radiol. 25:197–204.
2018. View Article : Google Scholar : PubMed/NCBI
|
|
11
|
Li Z, Leng S, Yu L, Manduca A and
McCollough CH: An effective noise reduction method for multi-energy
CT images that exploits spatio-spectral features. Med Phys.
44:1610–1623. 2017. View
Article : Google Scholar : PubMed/NCBI
|
|
12
|
Zhou W, Schornak R, Michalak G, Weaver J,
Abdurakhimova D, Ferrero A, Fetterly KA, McCollough CH and Leng S:
Determination of optimal image type and lowest detectable
concentration for iodine detection on a photon counting
detector-based multi-energy CT System. Proc SPIE Int Soc Opt Eng.
10573:105734U2018.PubMed/NCBI
|
|
13
|
Choi SY, Sung DJ, Yang KS, Kim KA, Yeom
SK, Sim KC, Han NY, Park BJ, Kim MJ, Cho SB and Lee JH: Small
(<4 cm) clear cell renal cell carcinoma: Correlation between CT
findings and histologic grade. Abdom Radiol (NY). 41:1160–1169.
2016. View Article : Google Scholar : PubMed/NCBI
|
|
14
|
Coy H, Young JR, Douek ML, Pantuck A,
Brown MS, Sayre J and Raman SS: Association of qualitative and
quantitative imaging features on multiphasic multidetector CT with
tumor grade in clear cell renal cell carcinoma. Abdom Radiol (NY).
44:180–189. 2018. View Article : Google Scholar
|
|
15
|
Brown CL, Hartman RP, Dzyubak OP,
Takahashi N, Kawashima A, McCollough CH, Bruesewitz MR, Primak AM
and Fletcher JG: Dual-energy CT iodine overlay technique for
characterization of renal masses as cyst or solid: A phantom
feasibility study. Eur Radiol. 19:1289–1295. 2009. View Article : Google Scholar : PubMed/NCBI
|
|
16
|
Chandarana H, Megibow AJ, Cohen BA,
Srinivasan R, Kim D, Leidecker C and Macari M: Iodine
quantification with dual-energy CT: Phantom study and preliminary
experience with renal masses. AJR Am J Roentgenol. 196:W693–W700.
2011. View Article : Google Scholar : PubMed/NCBI
|
|
17
|
Mileto A, Nelson RC, Samei E, Jaffe TA,
Paulson EK, Barina A, Choudhury KR, Wilson JM and Marin D: Impact
of dual-energy multi-detector row CT with virtual monochromatic
imaging on renal cyst pseudoenhancement: In vitro and in vivo
study. Radiology. 272:7672014. View Article : Google Scholar : PubMed/NCBI
|
|
18
|
Sauter AP, Muenzel D, Dangelmaier J,
Braren R, Pfeiffer F, Rummeny EJ, Noël PB and Fingerle AA:
Dual-layer spectral computed tomography: Virtual non-contrast in
comparison to true non-contrast images. Eur J Radiol. 104:108–114.
2018. View Article : Google Scholar : PubMed/NCBI
|
|
19
|
McCollough CH, Leng S, Yu L and Fletcher
JG: Dual- and multi-energy CT: Principles, technical approaches,
and clinical applications. Radiology. 276:637–653. 2015. View Article : Google Scholar : PubMed/NCBI
|
|
20
|
Grajo JR, Patino M, Prochowski A and
Sahani DV: Dual energy CT in practice: Basic principles and
applications. Appl Radiol. 45:6–12. 2016.
|
|
21
|
Wang G, Zhang C, Li M, Deng K and Li W:
Preliminary application of high-definition computed tomographic
Gemstone Spectral Imaging in lung cancer. J Comput Assist Tomogr.
38:77–81. 2014. View Article : Google Scholar : PubMed/NCBI
|
|
22
|
Wei J, Zhao J, Zhang X, Wang D, Zhang W,
Wang Z and Zhou J: Analysis of dual-energy spectral CT and
pathological grading of clear cell renal cell carcinoma (ccRCC).
PLoS One. 13:e01956992018. View Article : Google Scholar : PubMed/NCBI
|
|
23
|
Hou WS, Wu HW, Yin Y, Cheng JJ, Zhang Q
and Xu JR: Differentiation of lung cancers from inflammatory masses
with dual-energy spectral CT Imaging. Acad Radiol. 22:337–344.
2015. View Article : Google Scholar : PubMed/NCBI
|
|
24
|
Weis M, Henzler T, Nance JW Jr,
Haubenreisser H, Meyer M, Sudarski S, Schoenberg SO, Neff KW and
Hagelstein C: Radiation dose comparison between 70 kVp and 100 kVp
with spectral beam shaping for non-contrast-enhanced pediatric
chest computed tomography: A prospective randomized controlled
study. Invest Radiol. 52:155–162. 2017. View Article : Google Scholar : PubMed/NCBI
|
|
25
|
Agliata G, Schicchi N, Agostini A, Fogante
M, Mari A, Maggi S and Giovagnoni A: Radiation exposure related to
cardiovascular CT examination: Comparison between conventional
64-MDCT and third-generation dual-source MDCT. Radiol Med.
124:753–761. 2019. View Article : Google Scholar : PubMed/NCBI
|
|
26
|
Kaltenbach B, Wichmann JL, Pfeifer S,
Albrecht MH, Booz C, Lenga L, Hammerstingl R, D'Angelo T, Vogl TJ
and Martin SS: Iodine quantification to distinguish hepatic
neuroendocrine tumor metastasis from hepatocellular carcinoma at
dual-source dual-energy liver. CT Eur J Radiol. 105:20–24. 2018.
View Article : Google Scholar : PubMed/NCBI
|
|
27
|
Li X, Jiang R and Wang B: Differentiation
of renal clear cell carcinoma: Evaluation with dual-source CT
iodine quantification. J Clin Radiol. 35:1542–1545. 2016.
|
|
28
|
Wei J, Zhao J, Zhang X, Wang D, Zhang W,
Wang Z and Zhou J: Analysis of dual energy spectral CT and
pathological grading of clear cell renal cell carcinoma (ccRCC).
PLoS One. 13:e01956992018. View Article : Google Scholar : PubMed/NCBI
|
|
29
|
Zhao J, Zhang P, Chen X, Cao W and Ye Z:
Lesion size and iodine quantification to distinguish low-grade from
high-grade clear cell renal cell carcinoma using dual-energy
spectral computed tomography. J Comput Assist Tomogr. 40:673–677.
2016. View Article : Google Scholar : PubMed/NCBI
|
|
30
|
Ouyang AM, Wei ZL, Su XY, Li K, Zhao D, Yu
DX and Ma XX: Relative computed tomography (CT) enhancement value
for the assessment of microvascular architecture in renal cell
carcinoma. Med Sci Monit. 23:3706–3714. 2017. View Article : Google Scholar : PubMed/NCBI
|
|
31
|
Jia ZZ, Gu HM, Zhou XJ, Shi JL, Li MD,
Zhou GF and Wu XH: The assessment of immature microvascular density
in gliomas with dynamic contrast-enhanced magnetic resonance
imaging. Eur J Radiol. 84:1805–1809. 2015. View Article : Google Scholar : PubMed/NCBI
|
|
32
|
Xiong Z, Liu JK, Hu CP, Zhou H, Zhou ML
and Chen W: Role of immature microvessels in assessing the
relationship between CT perfusion characteristics and
differentiation grade in lung cancer. Arch Med Res. 41:611–617.
2010. View Article : Google Scholar : PubMed/NCBI
|