Ewing's sarcoma (ES) is the second most common
primary malignant bone tumor after osteosarcoma, and it occurs in
children and adolescents (1,2). ES is extremely malignant, with a short
course of disease, rapid recurrence and high transfer rate
(3). With the continuous
improvements in ES treatment, the current 5-year survival rate is
between 65 and 75% (4). However,
owing to the lack of effective diagnostic methods in the early
stages of the disease, ~25% of patients with ES still experience
distant metastasis, which results in poor prognosis (5,6).
Therefore, clarifying the precise molecular mechanisms involved in
the development of ES is essential to develop effective diagnostic
and therapeutic strategies.
Abnormal expression and mutations of genes are
involved in the development and progression of ES. A previous study
has reported that nuclear phosphoprotein (NPM) promotes
proliferation and invasion of ES cells, and elevated NPM
expression may be associated with poor prognosis of ES (7). Insulin-like growth factor 1
(IGF1) and its receptor (IGF1-R) serve a key role in the
progression of ES by interfering with the IGF1R pathway in ES cells
and subsequently inhibiting cell proliferation, promoting apoptosis
and reducing invasion and metastasis (8,9). KIT
proto-oncogene receptor tyrosine kinase is a tyrosine kinase
receptor that is significantly expressed in ES associated with the
proliferative, invasive and metastatic ability of ES cells
(10). Stromal antigen 2 mutation
occurs in 20% of ES cases and is associated with distant
metastasis, although whether it may be considered a prognostic
marker for ES remains controversial (11). Other molecular genetic alterations
associated with ES include abnormal expression of platelet-derived
growth factor receptor β (12,13) and
mammalian target of rapamycin (14),
as well as CDKN2A and TP53 mutations (15,16). A
better understanding of the molecular biology of ES may help
identify novel early diagnostic biomarkers, potential therapeutic
targets or prognostic indicators.
In recent decades, gene chip technology and
bioinformatics have been widely used to screen genetic changes at
the genomic level, which can identify the differentially expressed
genes (DEGs) and functional pathways involved in ES carcinogenesis
and progression. In this study, three mRNA expression profile chip
data sets from Gene Expression Omnibus (GEO) (17) were downloaded and analyzed to obtain
DEGs between ES and normal tissues. Functional and pathway
enrichment analysis and protein-protein interaction (PPI) network
analysis of DEGs were also performed. Finally, LASSO COX regression
model and overall survival rate (OS) analysis of hub genes were
performed. The results provided a useful framework for elucidating
the pathogenesis of ES and its complex molecular biology and for
identifying new key genes that may be used as prognostic biomarkers
for ES.
Raw data from the three data sets (CEL file) were
read using the R language (version 3.1.2; http://r-project.org/) Affy package (20). The original CEL file was removed and
the data were subjected to background correction, bootstrap
correction, quality control and normalization processing. The R
package sva (21) was used to
perform batch effect removal on the three data sets. The data were
converted into a probe expression matrix and analyzed by the R
language limma package (22) to
obtain DEGs. The DEGs were filtered by an adjusted P-value
(adj.P-value) <0.05 and |log2 fold change (FC)|>1.
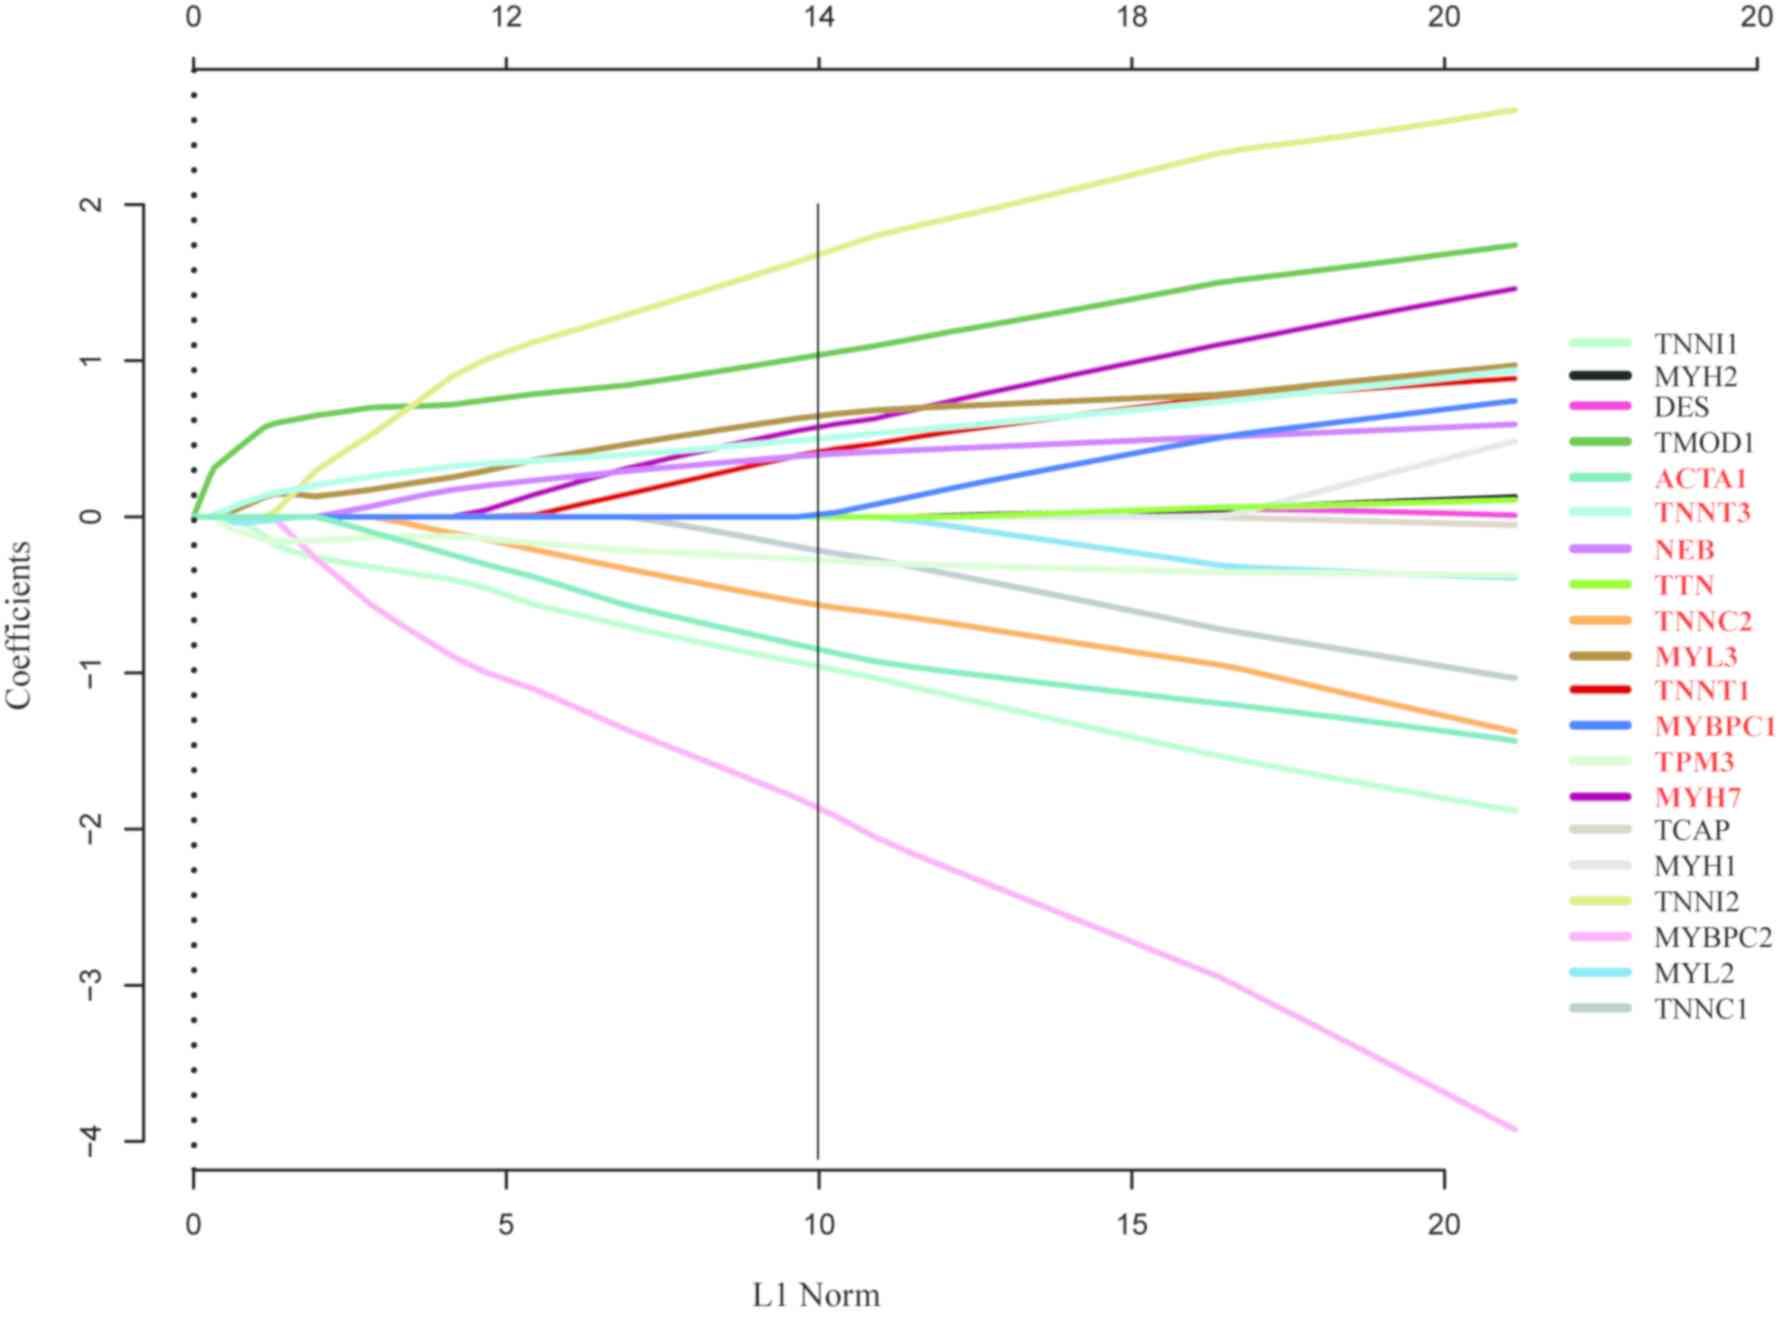
The LASSO COX regression model and Kaplan-Meier OS
analysis were used to screen genes with strong association with
prognosis from the hub genes and assess their effects on survival
in ES. LASSO coefficient profiles of the 10 ES-associated genes
were analyzed, and a vertical line was drawn at the value selected
by 10-fold cross-validation. OS analysis was performed by
R-survival (28) and survminer
(https://cran.r-project.org/web/packages/survminer/index.html)
based on high- and low-expression levels of gene expression
determined by BestSeparation (29),
and data from genes with P<0.05 were retained for display.
To determine the biological functions of the DEGs,
GO and KEGG pathway enrichment analyses were performed using the R
software enrichplot package (23).
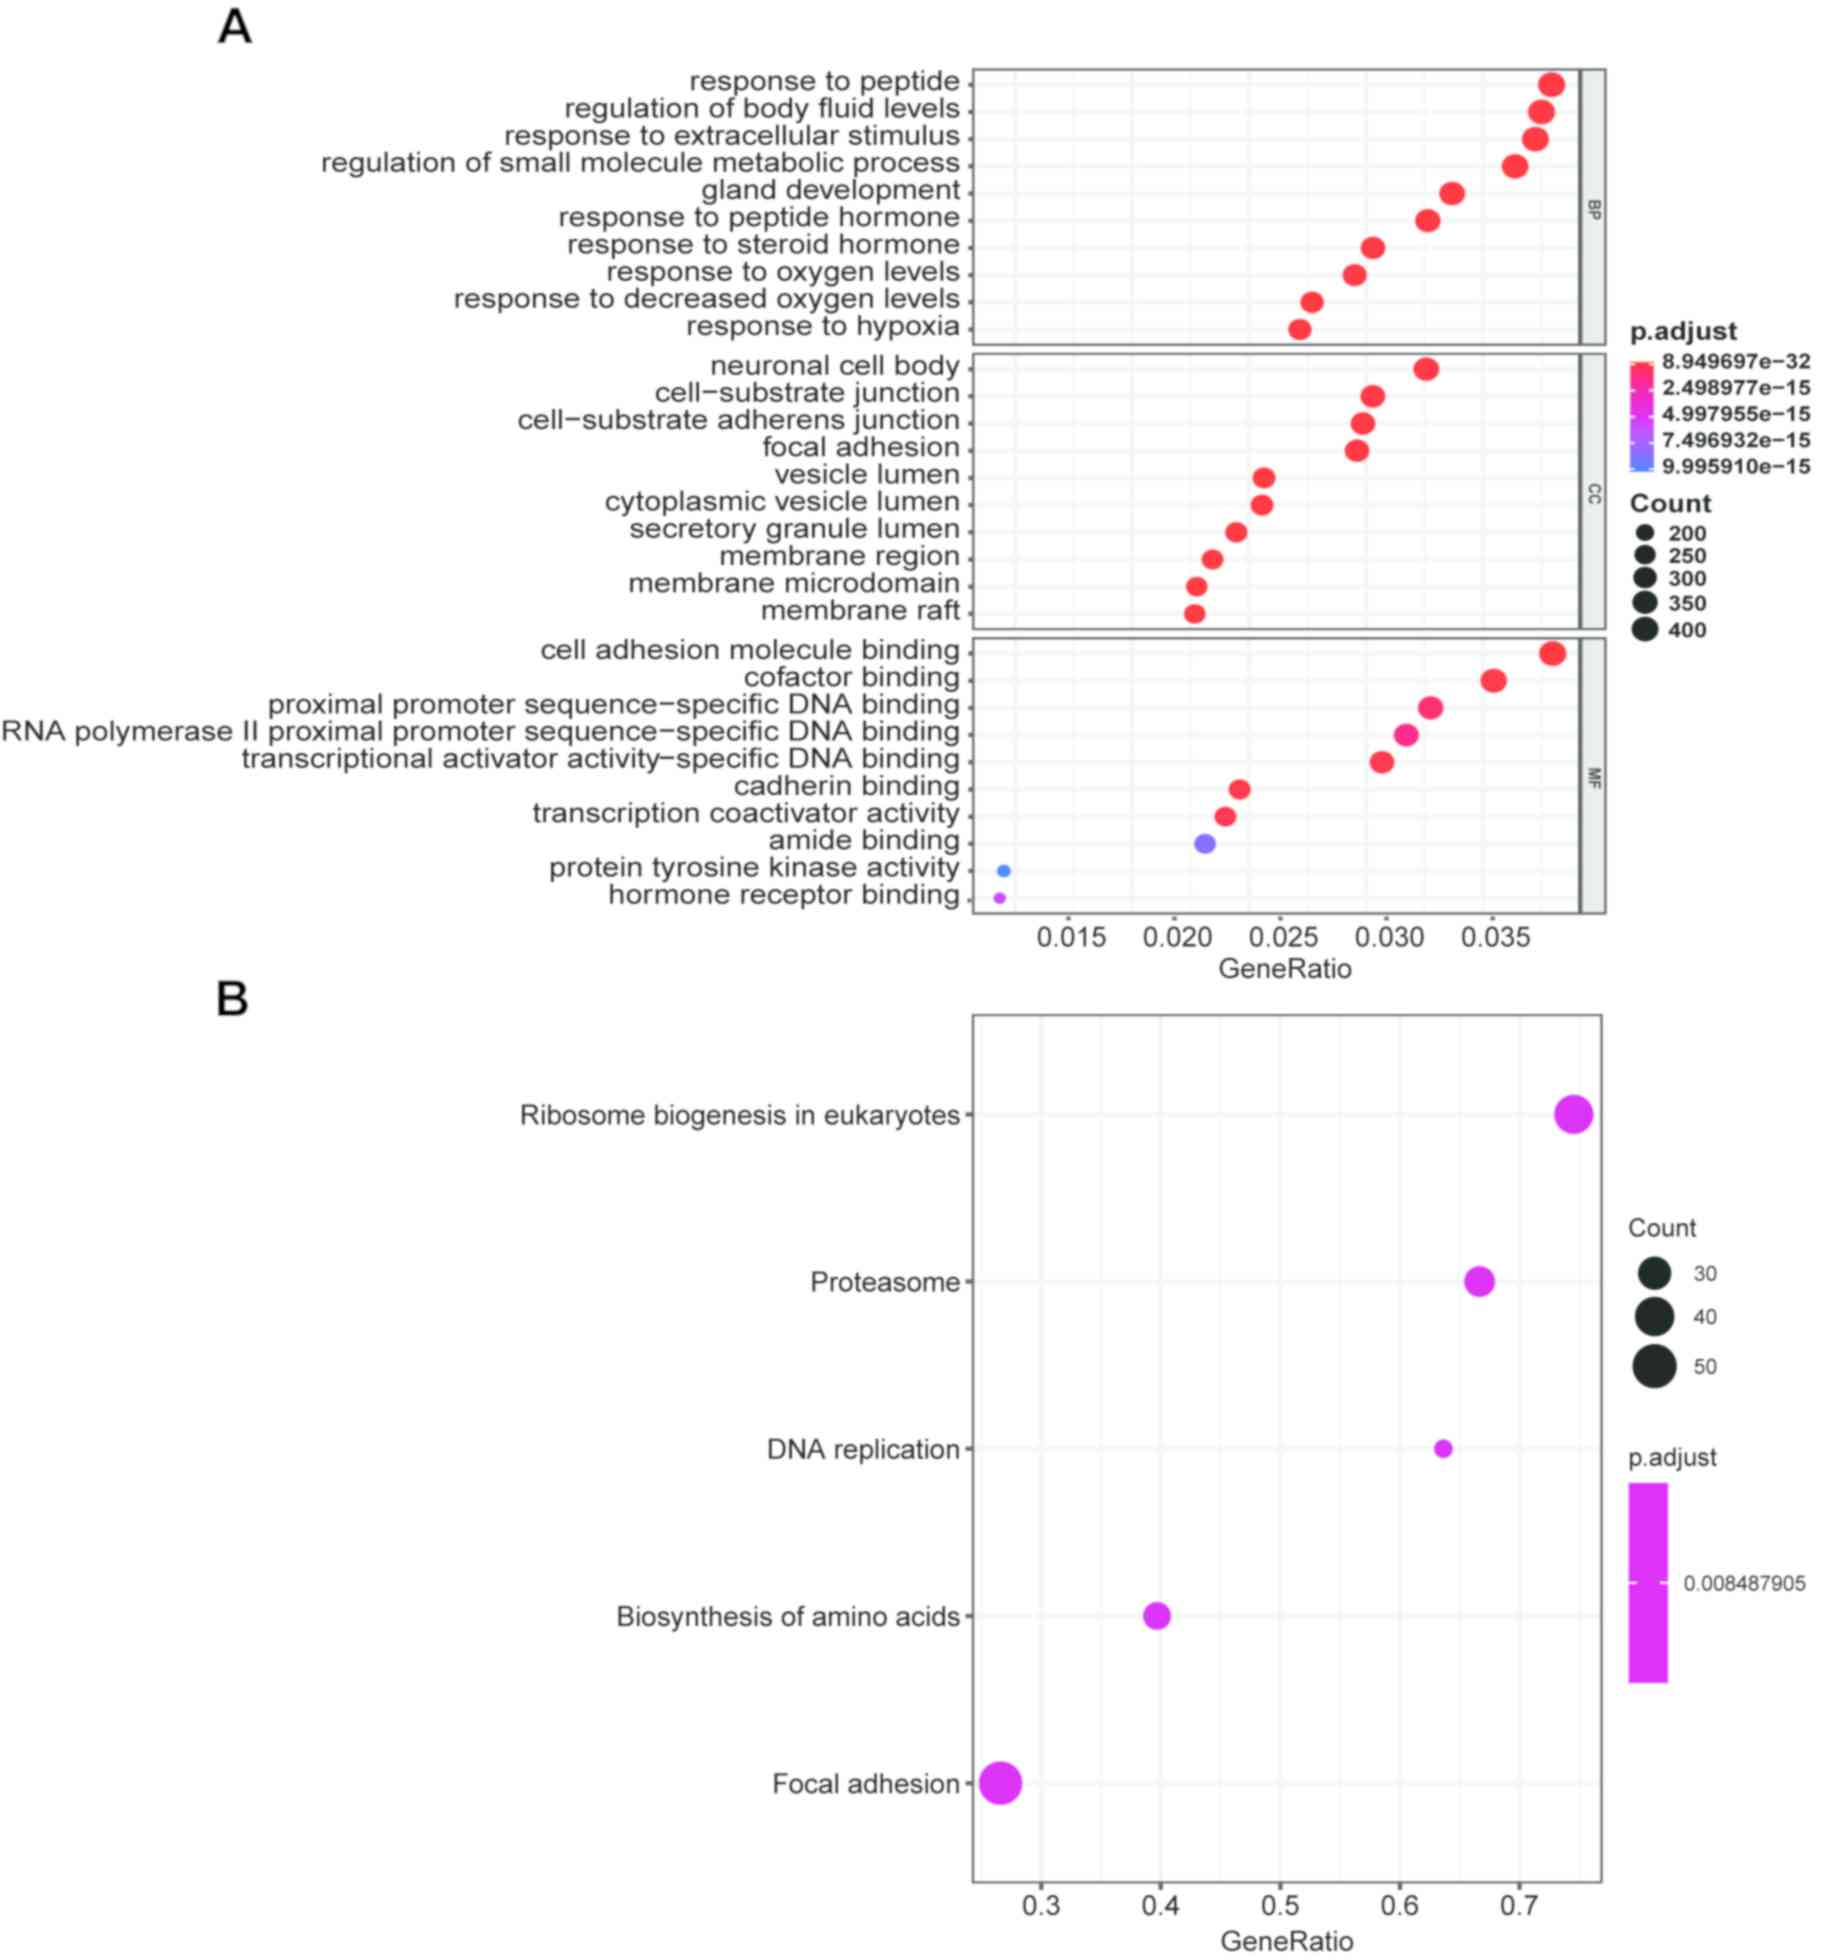
The results of GO analysis demonstrated that the BP changes of the
DEGs were significantly enriched in ‘response to peptides’,
‘regulation of body fluid levels’, ‘response to extracellular
stimulus’, ‘regulation of small molecule metabolic process’ and
‘gland development’ (Fig. 2A).
Changes in MF were mainly enriched in ‘cell adhesion molecule
binding’, ‘cofactor binding’, ‘proximal promoter sequence-specific
DNA binding’, ‘RNA polymerase II proximal promoter
sequence-specific DNA binding’ and ‘transcriptional activator
activity-specific DNA-binding (Fig.
2A). The CC of DEGs varied mainly in ‘neuronal cell body’,
‘cell-substrate junction’, ‘cell-substrate adherens junction’,
‘focal adhesion’ and ‘vesicle lumen’ (Fig. 2A). The results of KEGG pathway
enrichment analysis demonstrated that the DEGs were mainly enriched
in ‘amino acid biosynthesis’, ‘DNA replication’, ‘focal adhesion’,
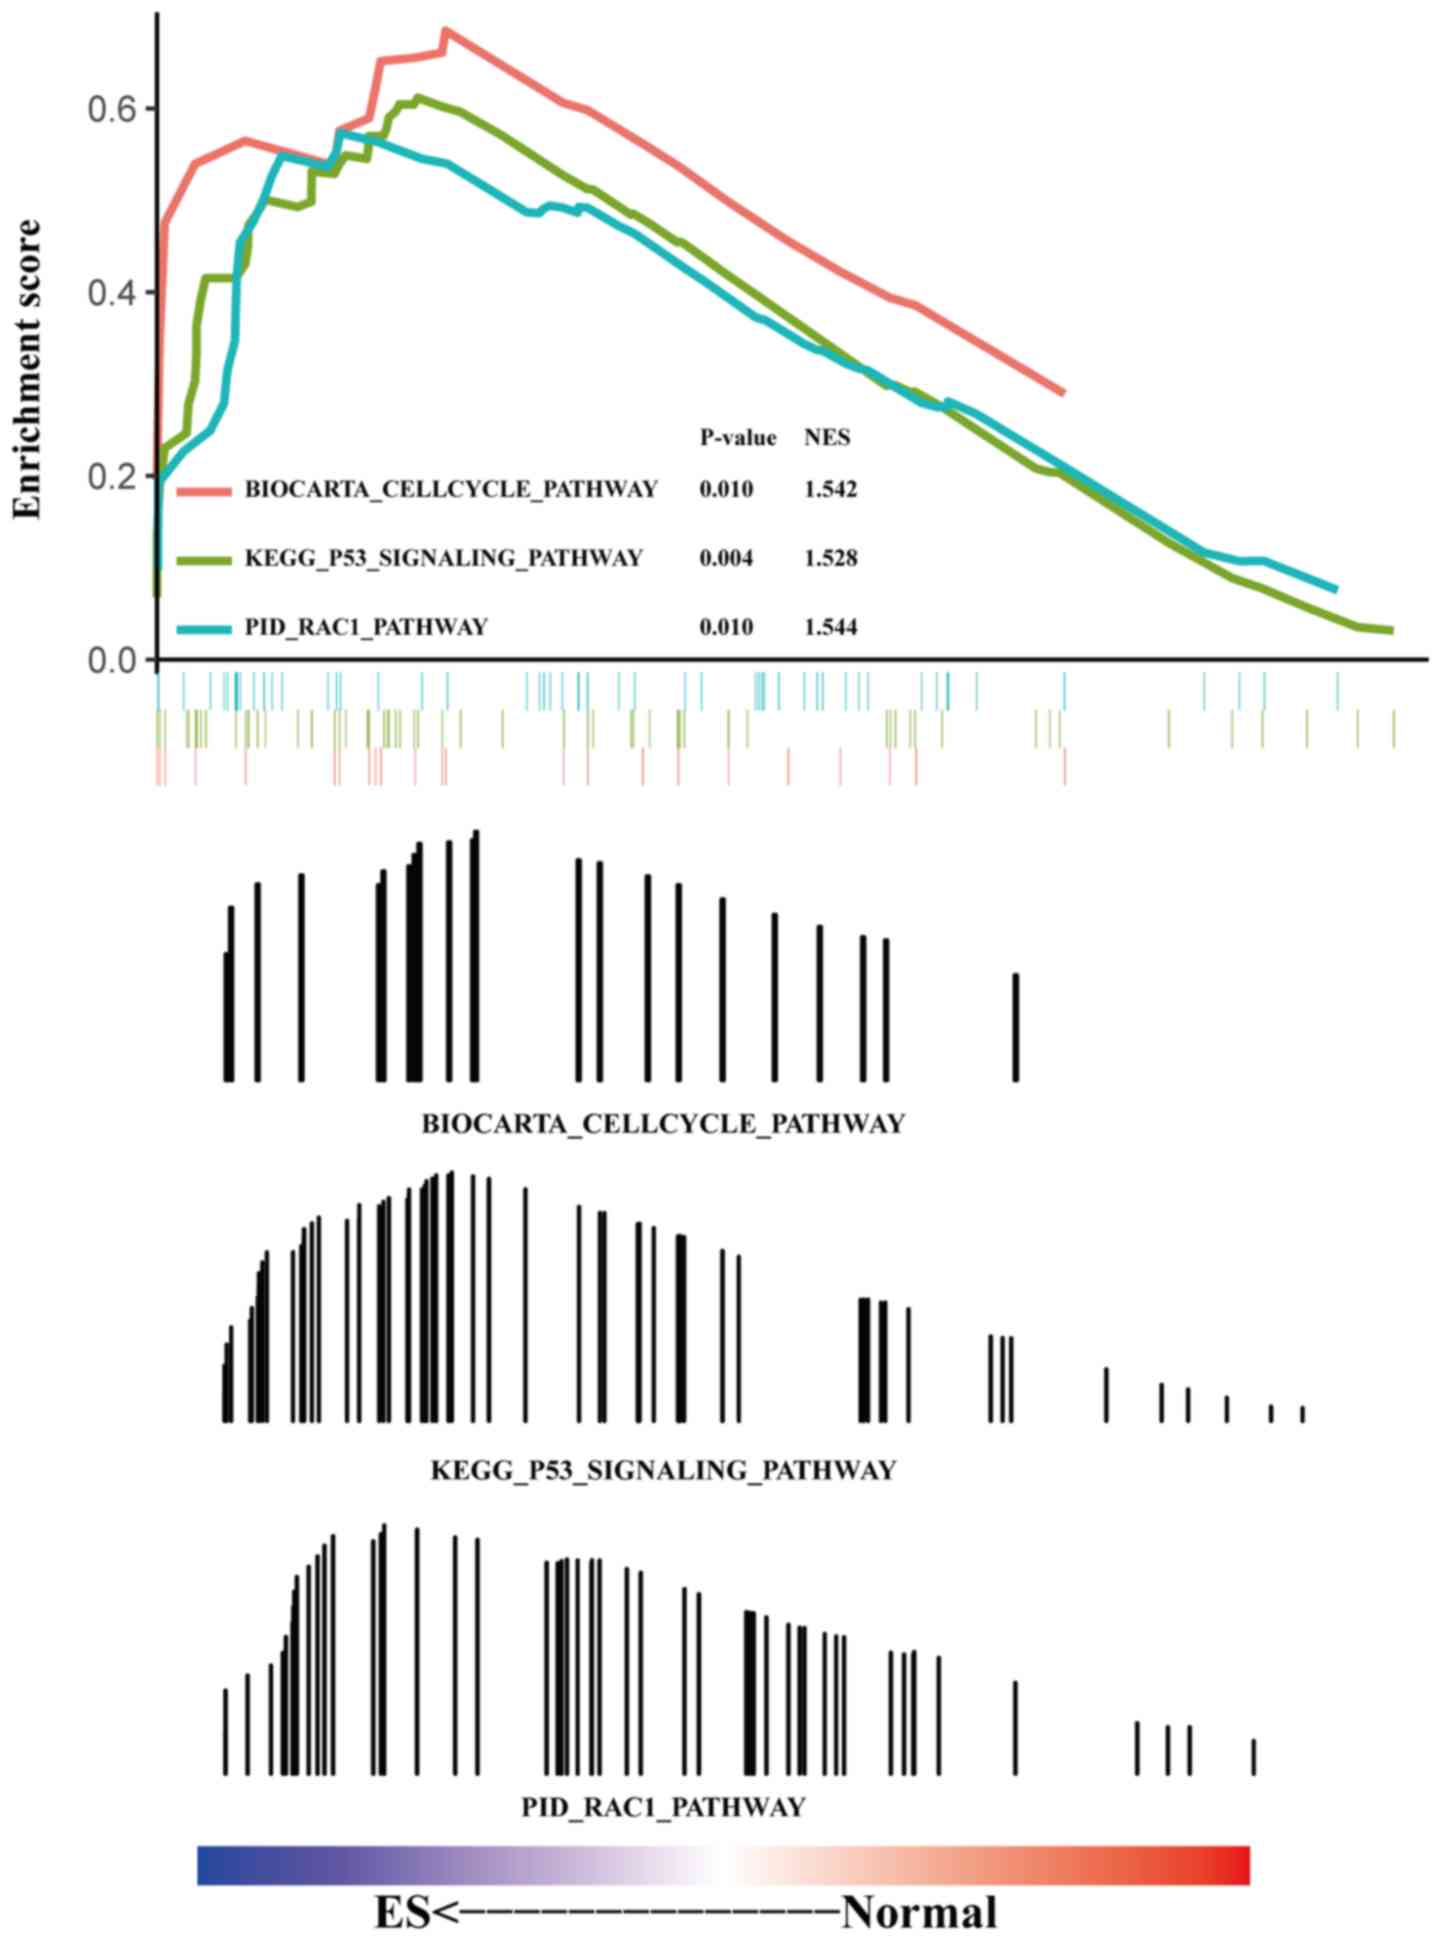
‘proteasome’ and ‘ribosomal biogenesis in eukaryotes’ (Fig. 2B). GSEA results revealed that the
enriched functions and pathways mainly involved the p53 (P=0.004;
NES=1.528), Rac1 (P=0.010; NES=1.544) and cell cycle (P=0.010;
NES=1.542) pathways (Fig. 3).
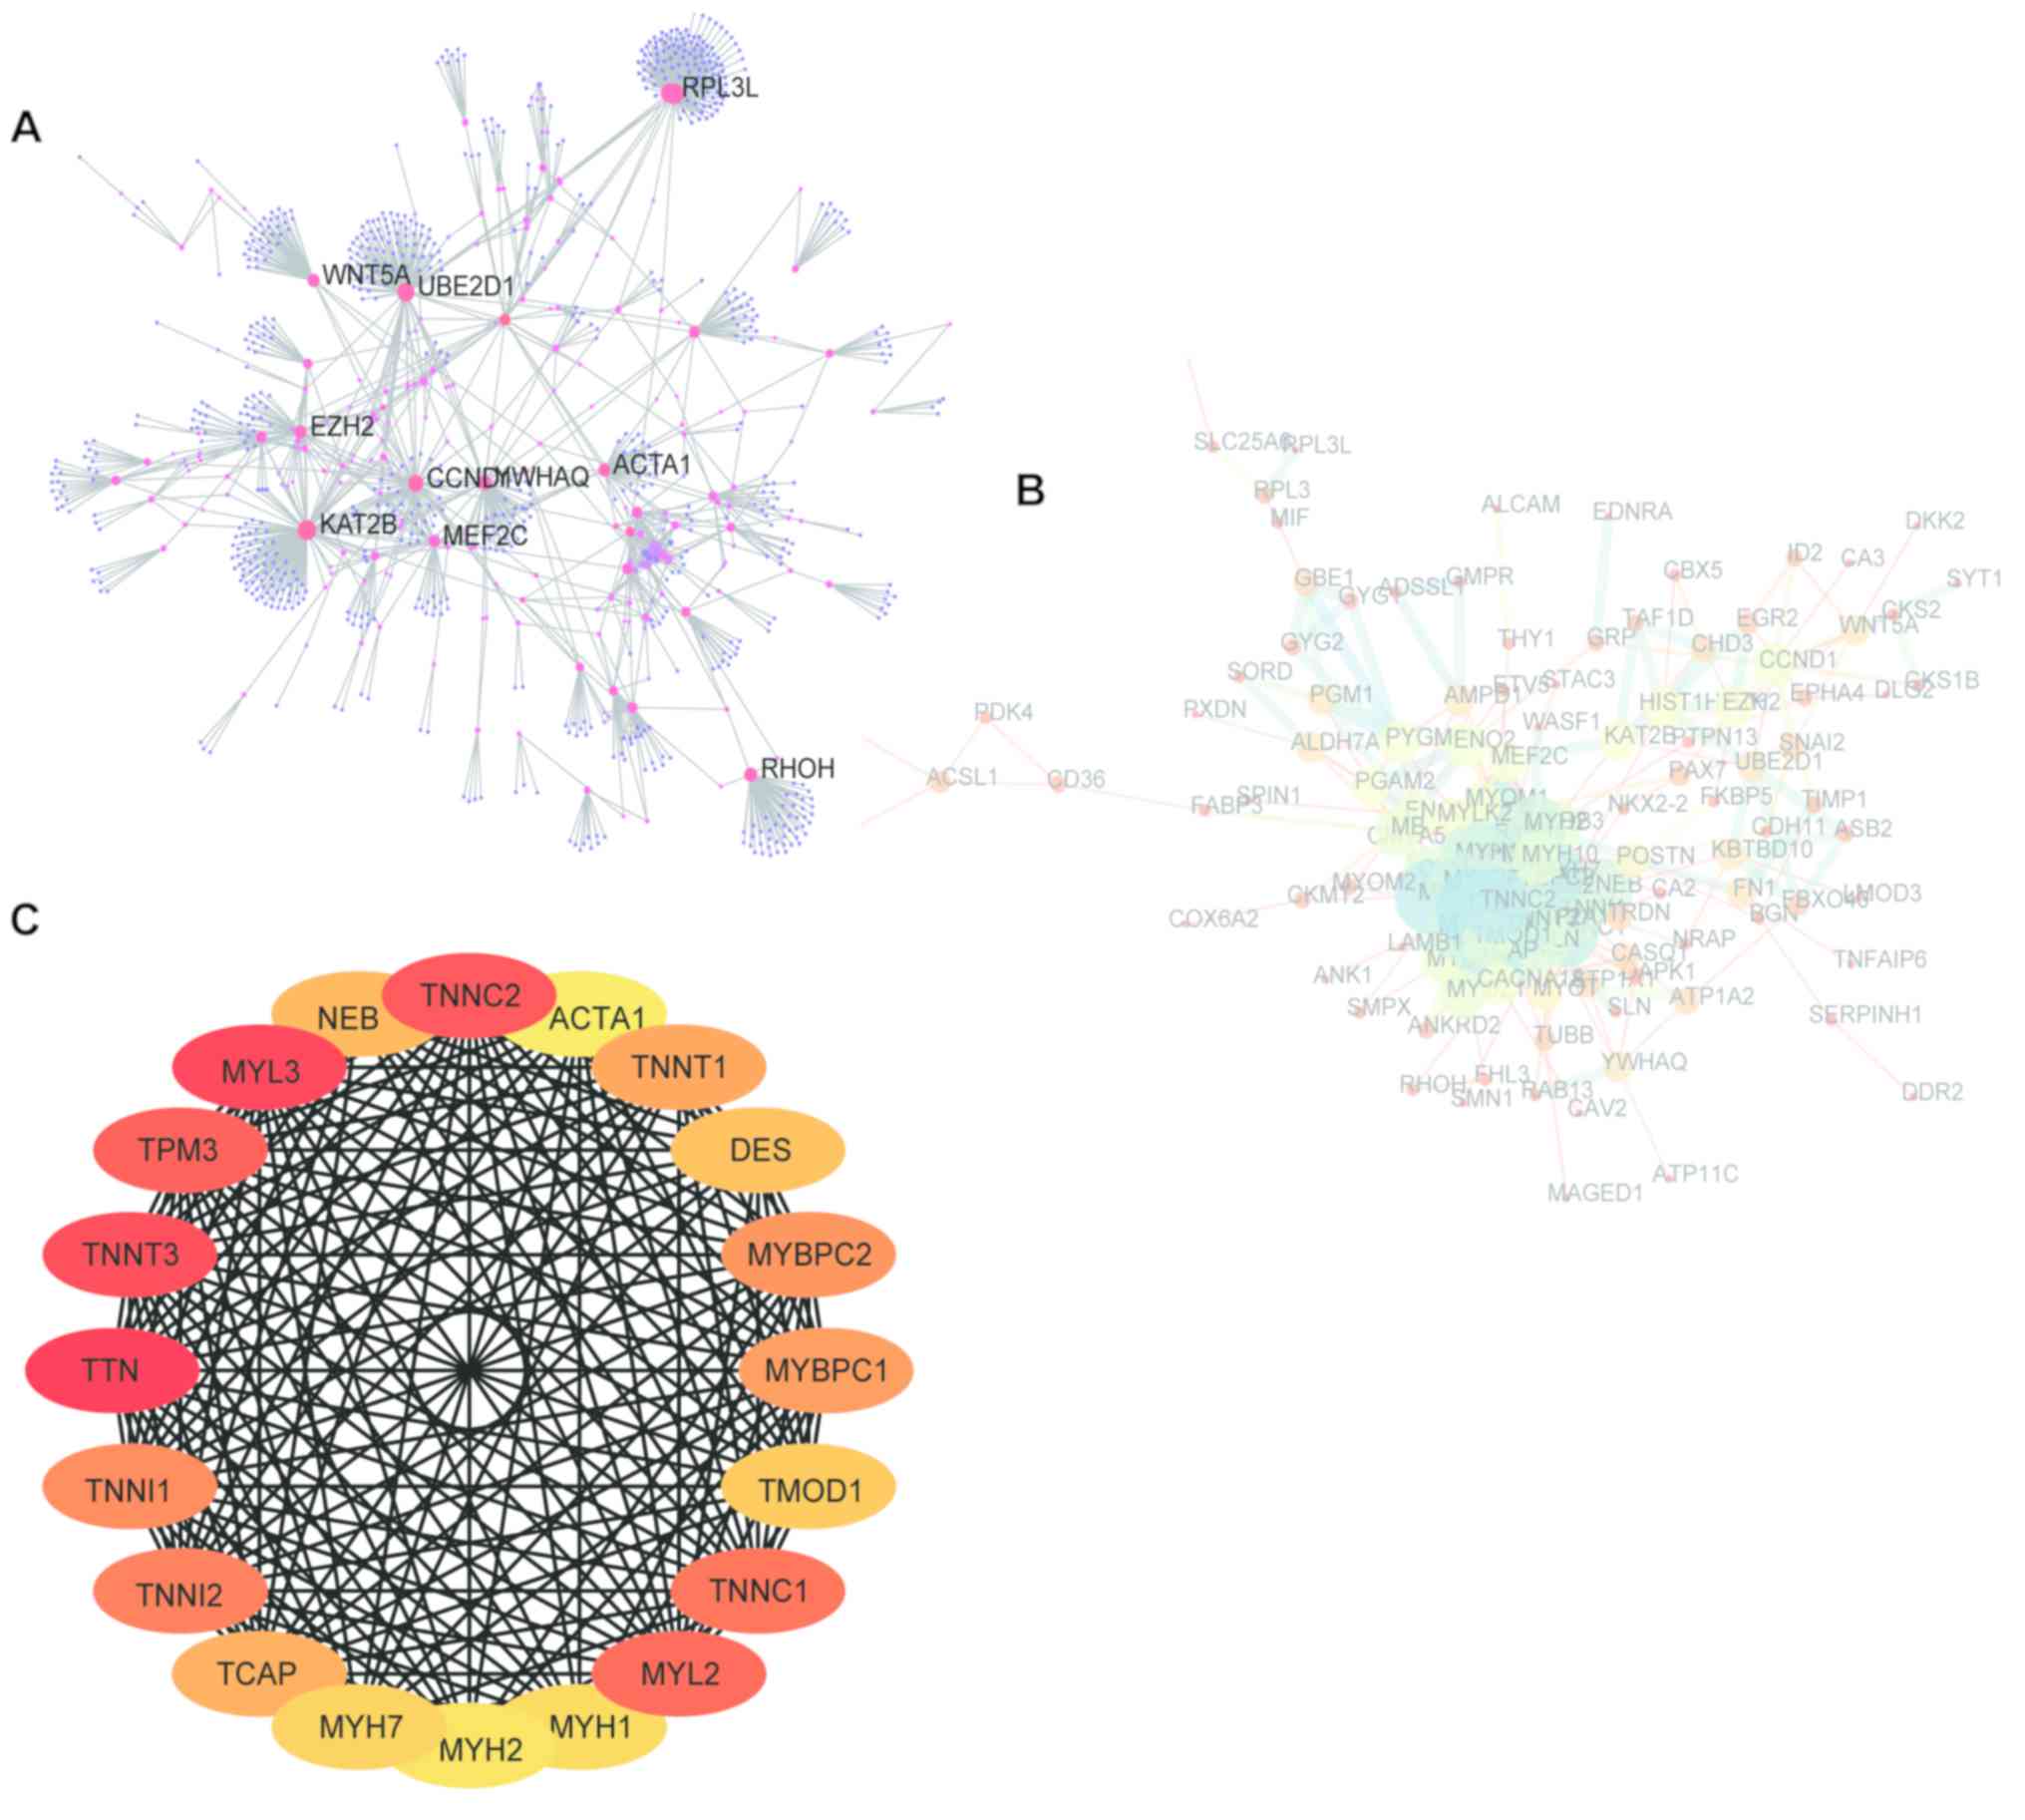
The NetworkAnalyst online tool was used to build a
PPI network of DEGs to analyze PPIs (Fig. 4A). The module with the highest MCC
score in this PPI network was identified using the NetworkAnalyzer
plugin in the Cytoscape software (Fig.
4B). In addition, the cytoHubba plugin was used to select the
top 20 genes in MCC as the hub genes: Titin (TTN), myosin
light-chain 3 (MYL3), fast skeletal muscle troponin T,
troponin C type 2 (fast), tropomyosin 3, MYL2, troponin C
type 1 (slow), troponin I2 fast skeletal type (TNNI2),
troponin I1 slow skeletal type, myosin-binding protein C fast type,
myosin-binding protein C slow type, slow skeletal muscle troponin T
(TNNT1), titin-cap (TCAP), nebulin, desmin,
tropomodulin 1 (TMOD1), myosin heavy-chain 7 (MYH7),
MYH1, MYH2 and skeletal muscle α-actin (Fig. 4C). The functions of these hub genes
are presented in Table I.
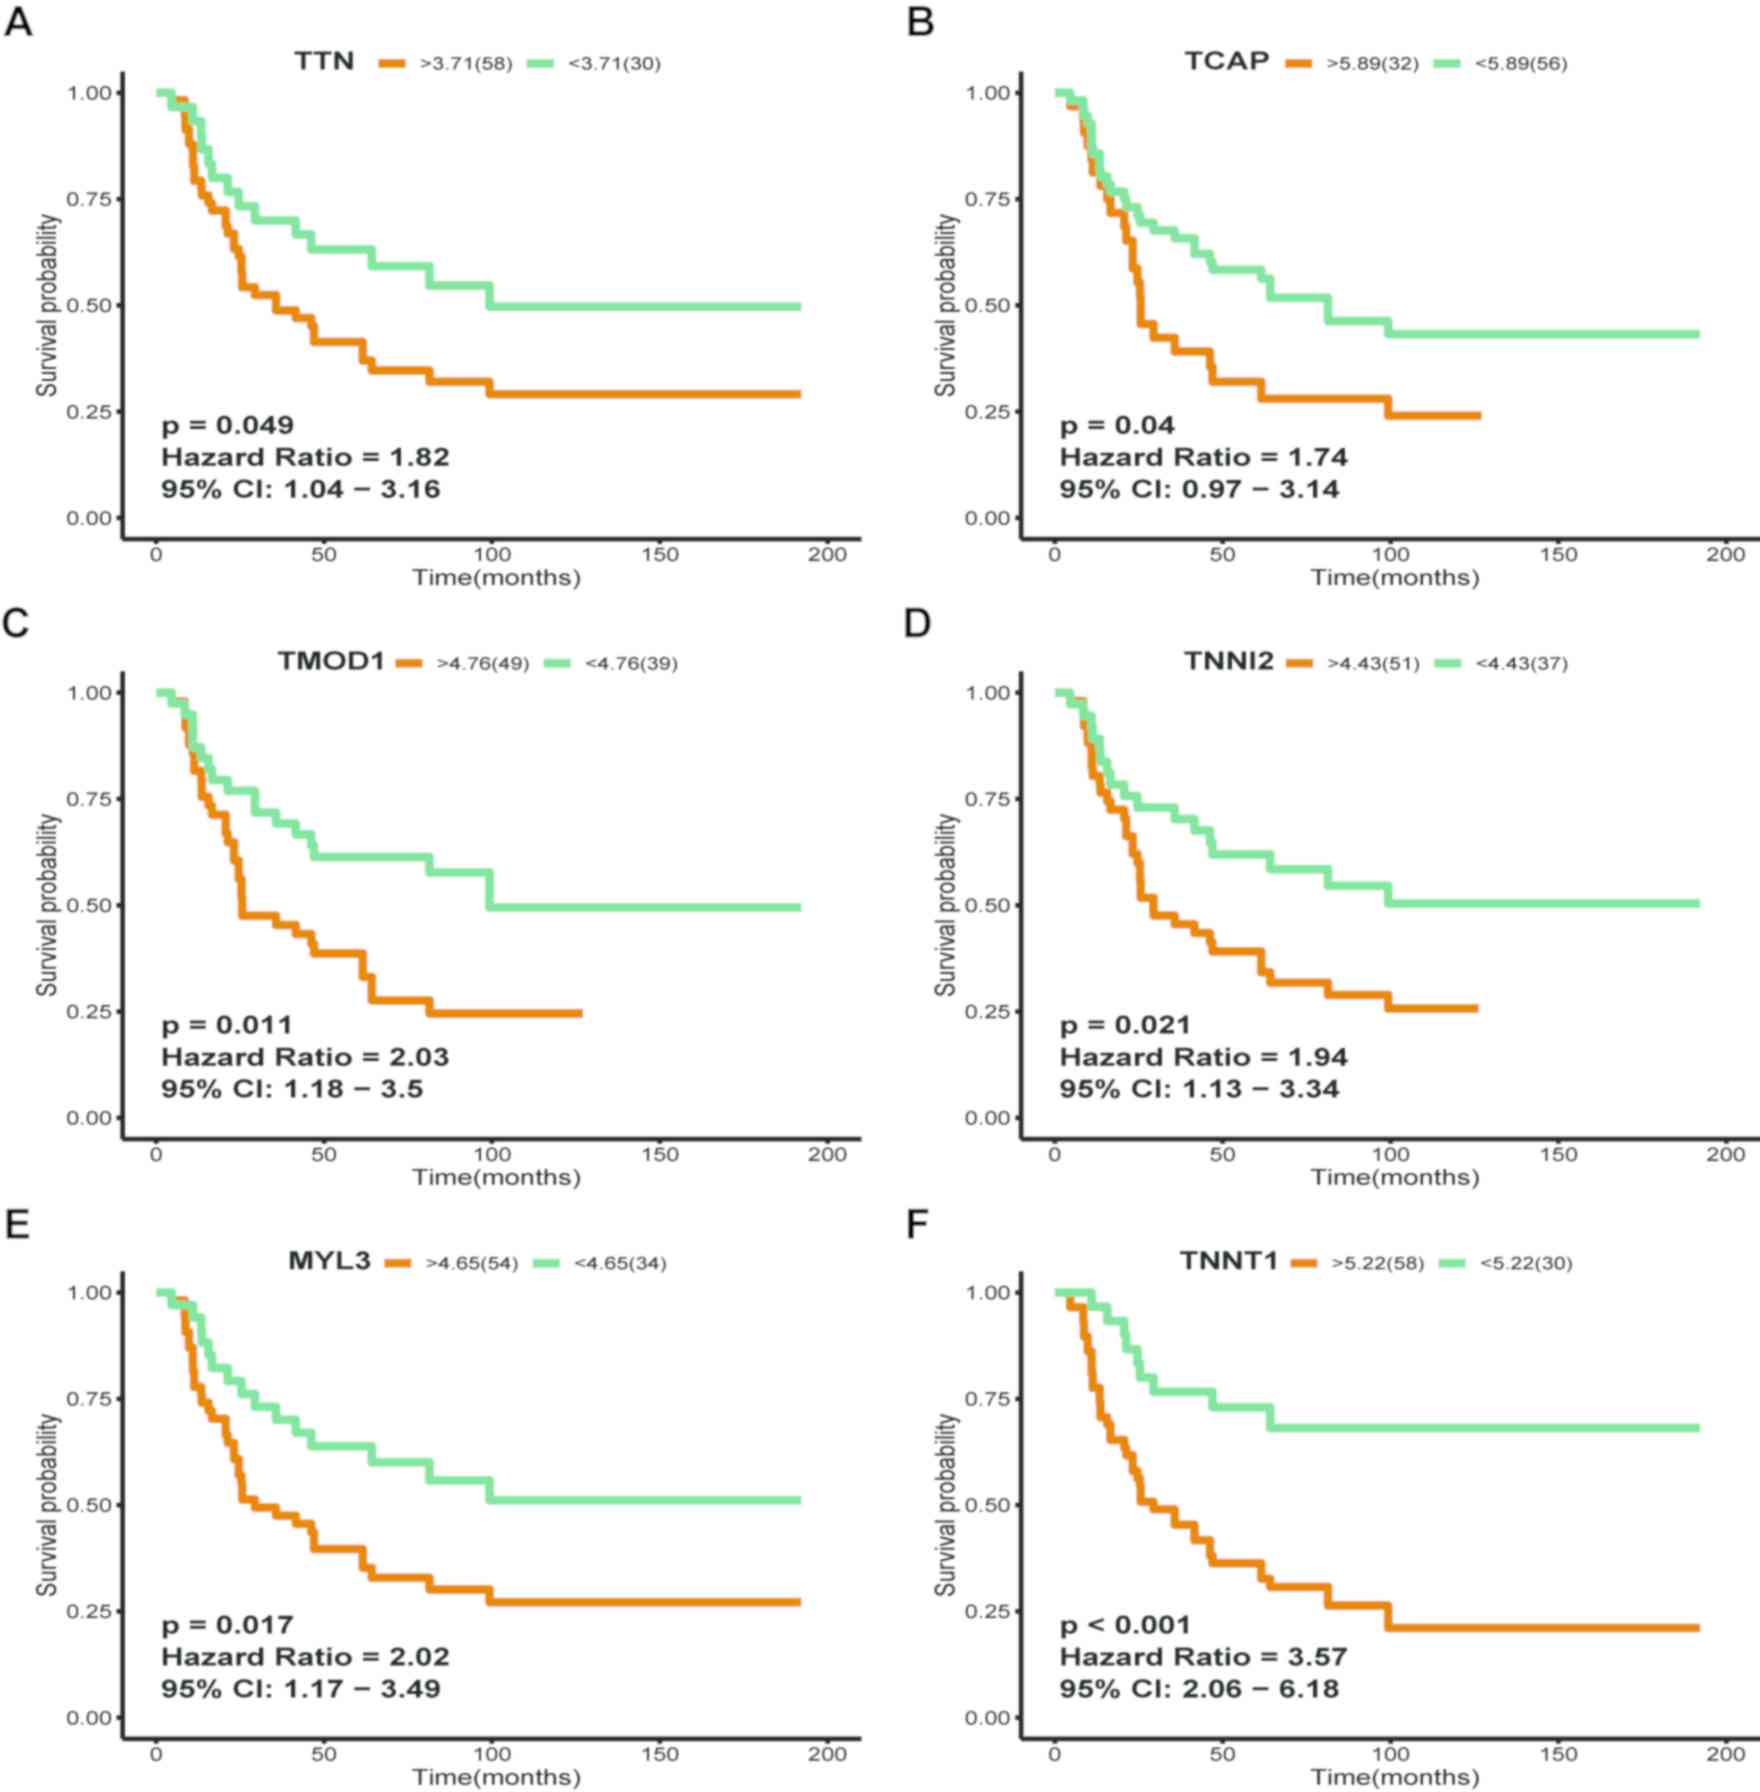
LASSO COX regression and OS analysis of the 20 hub
genes was performed. LASSO COX regression results demonstrated that
10 genes were associated with prognosis (Fig. 5), whereas Kaplan-Meier curves
revealed that high mRNA expression levels of TNNT1 (HR,
3.57; 95% CI, 2.06–6.18; P<0.001), TTN (HR, 1.82; 95% CI,
1.04–3.16; P=0.049), TCAP (HR, 1.74; 95% CI, 0.97–3.14;
P=0.04), TMOD1 (HR, 2.03; 95% CI, 1.18–3.50; P=0.011),
TNNI2 (HR, 1.94; 95% CI, 1.13–3.34; P=0.021) and MYL3
(HR, 2.02; 95% CI, 1.17–3.49; P=0.017) were associated with poor OS
in patients with ES (Fig. 6). Based
on these results, TNNT1, TTN and MYL3 may be key
players in the abnormal signaling pathway of ES and may serve as
potential prognostic biomarkers for ES.
In the present study, three mRNA microarray data
sets were downloaded from the GEO database, and an in-depth
analysis was conducted using bioinformatics methods to obtain DEGs
between ES and normal tissues. Prior to the analysis of the data
sets, the inter-assay difference removal, background correction,
bootstrap correction, quality control and standardization was
performed to ensure that the data were valid for the next step of
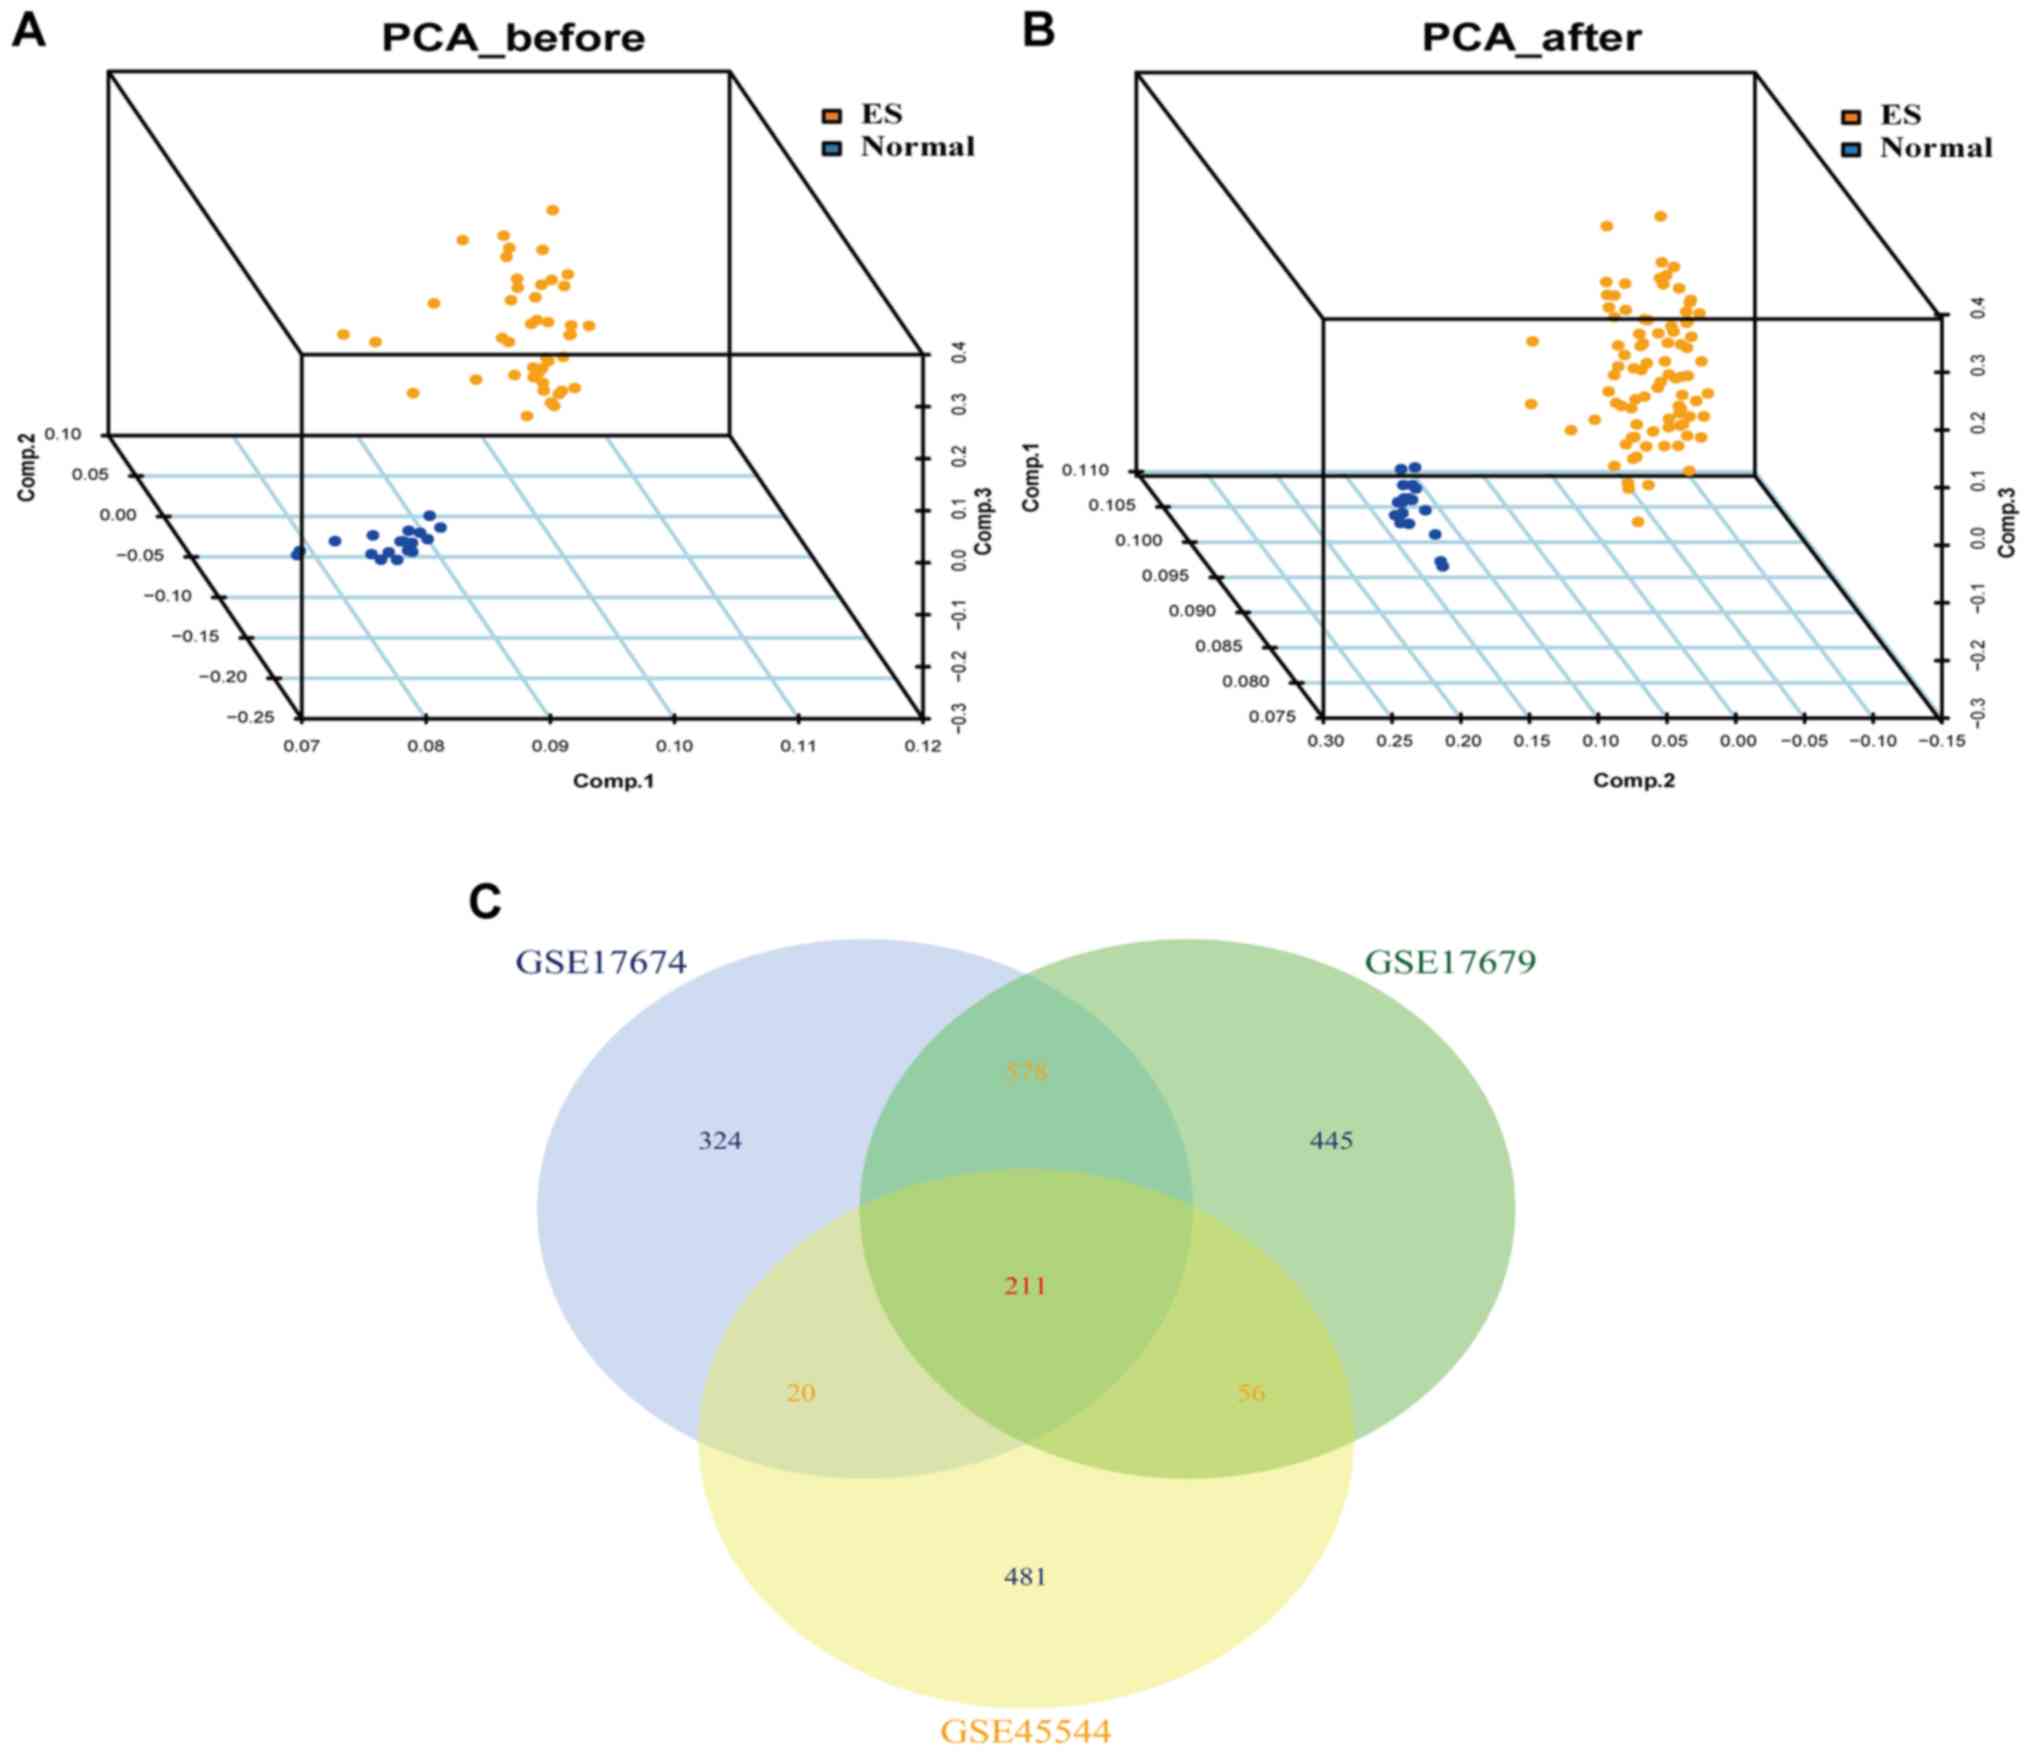
analysis. A total of 211 DEGs were identified in all three datasets
between ES and normal tissues.
Since the general difference analysis (GO and KEGG)
focuses on comparing gene expression differences between two groups
and on genes that are significantly upregulated or downregulated,
genes that are not significantly differentially expressed but serve
important biological significance are easily omitted. This may lead
to neglecting valuable information on the biological
characteristics of certain genes, associations between gene
regulatory networks, functions and significance of genes. The GSEA
software does not need to specify a clear differential gene
threshold; the algorithm performs enrichment analysis on all genes
in the expression profile based on the overall trend of the actual
data; mathematical statistics link the expression spectrum chip
data with biological meaning to avoid missing important information
(24). Therefore, GSEA, GO, and KEGG
pathway enrichment analyses were performed in the present study;
the results demonstrated that the DEGs were mainly involved in
functions and pathways associated with ES development and
progression, including the ‘Rac1 pathway’, ‘cell cycle pathway’,
‘RNA metabolism’ and ‘P53 signaling pathway’. The Rac1 pathway is
closely associated with the invasion and metastasis of ES; a
previous study has demonstrated that Erb-B2 receptor tyrosine
kinase 4 mediates Rac1 GTPase activation and enhances ES invasion
and metastasis in vivo by activating the PI3K-Akt cascade
and focal adhesion kinase (40). The
cell cycle pathway serves a key role in the malignant proliferation
process in breast (41), endometrial
(42), bladder (43) and gastric (44) cancer. A recent study reported that
the cell cycle pathway is also involved in the ES proliferation
process (45). In addition, the P53
and RNA metabolism signaling pathways serve an important role in
the progression of ES (46,47). Collectively, these results are
consistent with the present study.
A number of ES biomarkers in the literature match
the DEGs identified in the present study. For example, Tong et
al (48) analyzed and identified
Fc fragment of immunoglobulin G receptor and transporter,
olfactomedin 1, Cbp/P300-interacting transactivator with glu/asp,
caveolin 1,3-ketodihydrosphingosine reductase, cadherin 3
(CHD3), growth arrest-specific 1, four and a half LIM
domains 3 and thyroid hormone receptor interactor 6 as biomarkers
of ES. Cheung et al (49)
identified six-transmembrane epithelial antigen of prostate1, NK2
homeobox 2 and cyclin D1 as biomarkers of ES based on the gene
expression array approach. Other studies have analyzed global
genomic and transcriptomic expression to identify prognostic
biomarkers for ES, and the results demonstrated that CDH11
(50) and nucleophosmin 1 (51) were biomarkers of ES. All of the above
genes were differentially regulated in the present study.
A PPI network of DEGs was constructed in the present
study to detect interactions between the proteins coded by the
DEGs, and one important module was extracted from the network.
Subsequently, the top 20 genes in MCC were selected from the
important module as the hub genes. To assess the effect of these 20
hub genes on survival in ES, survival analysis was performed using
the LASSO COX regression and Kaplan-Meier curves. The results
revealed that high mRNA expression levels of TNNT1, TTN and
MYL3 were significantly associated with poor OS in patients
with ES, suggesting that these genes may serve an important role in
the development of ES.
The majority of bioinformatics studies focus on a
single microarray data set and use a single method to analyze DEGs.
In the present study, the raw data were derived from three mRNA
microarray data sets, thus increasing the sample size and
confidence. In addition, various analysis methods were applied to
analyze the data in depth, which provided different perspectives.
However, the present study has certain limitations. First, the data
sets selected in the present study have certain heterogeneity.
Although the batch data were removed and quality control and
standardization were performed on the original data, a larger
sample size and higher quality data sets are still required to
verify the reliability of the results of this study. Second, the
present study was a second mining and analysis of previously
published data sets. Although the results of several previous
studies are consistent with the present results, further biological
experiments are needed to verify the function of the identified
DEGs in ES (82–85). Further molecular studies will be
conducted in the future to clarify the specific molecular
mechanisms of these DEGs in ES.
In conclusion, a total of 211 DEGs were identified
by bioinformatics analysis of three mRNA microarray data sets, and
these DEGs may serve key roles in the development of ES. Through
further analysis, 20 Hub genes were screened and three genes
(TNNT1, TTN, and MYL3) were obtained through LASSO
COX regression and OS analysis. These three genes may be potential
prognostic biomarkers for ES. These results provided a theoretical
basis for elucidating the molecular mechanisms underlying ES
development and identifying candidate biomarkers for ES, which may
help in developing new strategies for the diagnosis and treatment
of ES.
Not applicable.
No funding was received.
The datasets used and/or analyzed during the present
study are available from the corresponding author on reasonable
request.
YJD, QQX, GZZ and JW conceived and designed the
study. ZLW, SPL, XGH and YCG contributed to dataset selection and
bioinformatics analysis. ZJM, YGW and XWK performed statistical
analysis. YJD and QQX wrote and revised the manuscript. All authors
read and approved the final manuscript.
Not applicable.
Not applicable.
The authors declare that they have no competing
interests.
|
1
|
Orr WS, Denbo JW, Billups CA, Wu J, Navid
F, Rao BN, Davidoff AM and Krasin MJ: Analysis of prognostic
factors in extraosseous Ewing sarcoma family of tumors: Review of
St. Jude Children's Research Hospital experience. Ann Surg Oncol.
19:3816–3822. 2012. View Article : Google Scholar : PubMed/NCBI
|
|
2
|
Fleuren ED, Versleijen-Jonkers YM, Boerman
OC and van der Graaf WT: Targeting receptor tyrosine kinases in
osteosarcoma and Ewing sarcoma: Current hurdles and future
perspectives. Biochim Biophys Acta. 1845:266–276. 2014.PubMed/NCBI
|
|
3
|
Zhang Z, Huang L, Yu Z, Chen X, Yang D,
Zhan P, Dai M, Huang S, Han Z and Cao K: Let-7a functions as a
tumor suppressor in Ewing's sarcoma cell lines partly by targeting
cyclin-dependent kinase 6. DNA Cell Biol. 33:136–147. 2014.
View Article : Google Scholar : PubMed/NCBI
|
|
4
|
Gaspar N, Hawkins DS, Dirksen U, Lewis IJ,
Ferrari S, Le Deley MC, Kovar H, Grimer R, Whelan J, Claude L, et
al: Ewing sarcoma: Current management and future approaches through
collaboration. J Clin Oncol. 33:3036–3046. 2015. View Article : Google Scholar : PubMed/NCBI
|
|
5
|
Li Y, Shao G, Zhang M, Zhu F, Zhao B, He C
and Zhang Z: miR-124 represses the mesenchymal features and
suppresses metastasis in Ewing sarcoma. Oncotarget. 8:10274–10286.
2017.PubMed/NCBI
|
|
6
|
Felgenhauer JL, Nieder ML, Krailo MD,
Bernstein ML, Henry DW, Malkin D, Baruchel S, Chuba PJ, Sailer SL,
Brown K, et al: A pilot study of low-dose anti-angiogenic
chemotherapy in combination with standard multiagent chemotherapy
for patients with newly diagnosed metastatic Ewing sarcoma family
of tumors: A children's oncology group (COG) phase II study
NCT00061893. Pediatr Blood Cancer. 60:409–414. 2013. View Article : Google Scholar : PubMed/NCBI
|
|
7
|
Haga A, Ogawara Y, Kubota D, Kitabayashi
I, Murakami Y and Kondo T: Interactomic approach for evaluating
nucleophosmin-binding proteins as biomarkers for Ewing's sarcoma.
Electrophoresis. 34:1670–1678. 2013. View Article : Google Scholar : PubMed/NCBI
|
|
8
|
Scotlandi K, Avnet S, Benini S, Manara MC,
Serra M, Cerisano V, Perdichizzi S, Lollini PL, De Giovanni C,
Landuzzi L and Picci P: Expression of an IGF-I receptor dominant
negative mutant induces apoptosis, inhibits tumorigenesis and
enhances chemosensitivity in Ewing's sarcoma cells. Int J Cancer.
101:11–16. 2002. View Article : Google Scholar : PubMed/NCBI
|
|
9
|
Herrero-Martín D, Osuna D, Ordóñez JL,
Sevillano V, Martins AS, Mackintosh C, Campos M, Madoz-Gúrpide J,
Otero-Motta AP, Caballero G, et al: Stable interference of EWS-FLI1
in an Ewing sarcoma cell line impairs IGF-1/IGF-1R signalling and
reveals TOPK as a new target. Br J Cancer. 101:80–90. 2009.
View Article : Google Scholar : PubMed/NCBI
|
|
10
|
Landuzzi L, De Giovanni C, Nicoletti G,
Rossi I, Ricci C, Astolfi A, Scopece L, Scotlandi K, Serra M,
Bagnara GP, et al: The metastatic ability of Ewing's sarcoma cells
is modulated by stem cell factor and by its receptor c-kit. Am J
Pathol. 157:2123–2131. 2000. View Article : Google Scholar : PubMed/NCBI
|
|
11
|
Brohl AS, Solomon DA, Chang W, Wang J,
Song Y, Sindiri S, Patidar R, Hurd L, Chen L, Shern JF, et al: The
genomic landscape of the Ewing sarcoma family of tumors reveals
recurrent STAG2 mutation. PLoS Genet. 10:e10044752014. View Article : Google Scholar : PubMed/NCBI
|
|
12
|
Wang YX, Mandal D, Wang S, Hughes D,
Pollock RE, Lev D, Kleinerman E and Hayes-Jordan A: Inhibiting
platelet-derived growth factor beta reduces Ewing's sarcoma growth
and metastasis in a novel orthotopic human xenograft model. In
Vivo. 23:903–909. 2009.PubMed/NCBI
|
|
13
|
Do I, Araujo ES, Kalil RK, Bacchini P,
Bertoni F, Unni KK and Park YK: Protein expression of KIT and gene
mutation of c-kit and PDGFRs in Ewing sarcomas. Pathol Res Pract.
203:127–134. 2007. View Article : Google Scholar : PubMed/NCBI
|
|
14
|
Ahmed AA, Sherman AK and Pawel BR:
Expression of therapeutic targets in Ewing sarcoma family tumors.
Hum Pathol. 43:1077–1083. 2012. View Article : Google Scholar : PubMed/NCBI
|
|
15
|
Crompton BD, Stewart C, Taylor-Weiner A,
Alexe G, Kurek KC, Calicchio ML, Kiezun A, Carter SL, Shukla SA,
Mehta SS, et al: The genomic landscape of pediatric Ewing sarcoma.
Cancer Discov. 4:1326–1341. 2014. View Article : Google Scholar : PubMed/NCBI
|
|
16
|
Lerman DM, Monument MJ, McIlvaine E, Liu
XQ, Huang D, Monovich L, Beeler N, Gorlick RG, Marina NM, Womer RB,
et al: Tumoral TP53 and/or CDKN2A alterations are not reliable
prognostic biomarkers in patients with localized Ewing sarcoma: A
report from the children's oncology group. Pediatr Blood Cancer.
62:759–765. 2015. View Article : Google Scholar : PubMed/NCBI
|
|
17
|
Barrett T, Wilhite SE, Ledoux P,
Evangelista C, Kim IF, Tomashevsky M, Marshall KA, Phillippy KH,
Sherman PM, Holko M, et al: NCBI GEO: Archive for functional
genomics data sets-update. Nucleic Acids Res. 41((Database Issue)):
D991–D995. 2013.PubMed/NCBI
|
|
18
|
Savola S, Klami A, Myllykangas S, Manara
C, Scotlandi K, Picci P, Knuutila S and Vakkila J: High expression
of complement component 5 (C5) at tumor site associates with
superior survival in Ewing's sarcoma family of tumour patients.
ISRN Oncol. 2011:1687122011.PubMed/NCBI
|
|
19
|
Agelopoulos K, Richter GH, Schmidt E,
Dirksen U, von Heyking K, Moser B, Klein HU, Kontny U, Dugas M,
Poos K, et al: Deep sequencing in conjunction with expression and
functional analyses reveals activation of FGFR1 in Ewing sarcoma.
Clin Cancer Res. 21:4935–4946. 2015. View Article : Google Scholar : PubMed/NCBI
|
|
20
|
Gautier L, Cope L, Bolstad BM and Irizarry
RA: affy-analysis of Affymetrix GeneChip data at the probe level.
Bioinformatics. 20:307–315. 2004. View Article : Google Scholar : PubMed/NCBI
|
|
21
|
Leek JT, Johnson WE, Parker HS, Jaffe AE
and Storey JD: The sva package for removing batch effects and other
unwanted variation in high-throughput experiments. Bioinformatics.
28:882–883. 2012. View Article : Google Scholar : PubMed/NCBI
|
|
22
|
Ritchie ME, Phipson B, Wu D, Hu Y, Law CW,
Shi W and Smyth GK: limma powers differential expression analyses
for RNA-sequencing and microarray studies. Nucleic Acids Res.
43:e472015. View Article : Google Scholar : PubMed/NCBI
|
|
23
|
Yu G, Wang LG, Han Y and He QY:
clusterProfiler: An R package for comparing biological themes among
gene clusters. OMICS. 16:284–287. 2012. View Article : Google Scholar : PubMed/NCBI
|
|
24
|
Subramanian A, Tamayo P, Mootha VK,
Mukherjee S, Ebert BL, Gillette MA, Paulovich A, Pomeroy SL, Golub
TR, Lander ES and Mesirov JP: Gene set enrichment analysis: A
knowledge-based approach for interpreting genome-wide expression
profiles. Proc Natl Acad Sci USA. 102:15545–15550. 2005. View Article : Google Scholar : PubMed/NCBI
|
|
25
|
Smoot ME, Ono K, Ruscheinski J, Wang PL
and Ideker T: Cytoscape 2.8: New features for data integration and
network visualization. Bioinformatics. 27:431–432. 2011. View Article : Google Scholar : PubMed/NCBI
|
|
26
|
Doncheva NT, Assenov Y, Domingues FS and
Albrecht M: Topological analysis and interactive visualization of
biological networks and protein structures. Nat Protoc Nature
protocols. 7:670–685. 2012. View Article : Google Scholar : PubMed/NCBI
|
|
27
|
Chin CH, Chen SH, Wu HH, Ho CW, Ko MT and
Lin CY: cytoHubba: Identifying hub objects and sub-networks from
complex interactome. BMC Syst Biol. 8 (Suppl 4):S112014. View Article : Google Scholar : PubMed/NCBI
|
|
28
|
Durisová M and Dedik L: SURVIVAL-an
integrated software package for survival curve estimation and
statistical comparison of survival rates of two groups of patients
or experimental animals. Methods Find Exp Clin Pharmacol.
15:535–540. 1993.PubMed/NCBI
|
|
29
|
Unal I: Defining an optimal cut-point
value in ROC analysis: An alternative approach. Comput Math Methods
Med. 2017:37626512017. View Article : Google Scholar : PubMed/NCBI
|
|
30
|
Van Mater D and Wagner L: Management of
recurrent Ewing sarcoma: Challenges and approaches. Onco Targets
Ther. 12:2279–2288. 2019. View Article : Google Scholar : PubMed/NCBI
|
|
31
|
Sandberg AA and Bridge JA: Updates on
cytogenetics and molecular genetics of bone and soft tissue tumors:
Ewing sarcoma and peripheral primitive neuroectodermal tumors.
Cancer Genet Cytogenet. 123:1–26. 2000. View Article : Google Scholar : PubMed/NCBI
|
|
32
|
Chaber R, Łach K, Arthur CJ, Raciborska A,
Michalak E, Ciebiera K, Bilska K, Drabko K and Cebulski J:
Prediction of Ewing Sarcoma treatment outcome using attenuated
tissue reflection FTIR tissue spectroscopy. Sci Rep. 8:122992018.
View Article : Google Scholar : PubMed/NCBI
|
|
33
|
Esiashvili N, Goodman M and Marcus RB Jr:
Changes in incidence and survival of Ewing sarcoma patients over
the past 3 decades: Surveillance epidemiology and end results data.
J Pediatr Hematol Oncol. 30:425–430. 2008. View Article : Google Scholar : PubMed/NCBI
|
|
34
|
Bosma SE, Ayu O, Fiocco M, Gelderblom H
and Dijkstra PDS: Prognostic factors for survival in Ewing sarcoma:
A systematic review. Surg Oncol. 27:603–610. 2018. View Article : Google Scholar : PubMed/NCBI
|
|
35
|
Koppenhafer SL, Goss KL, Terry WW and
Gordon DJ: mTORC1/2 and protein translation regulate levels of CHK1
and the sensitivity to CHK1 inhibitors in Ewing sarcoma cells. Mol
Cancer Ther. 17:2676–2688. 2018. View Article : Google Scholar : PubMed/NCBI
|
|
36
|
Lin L, Huang M, Shi X, Mayakonda A, Hu K,
Jiang YY, Guo X, Chen L, Pang B, Doan N, et al:
Super-enhancer-associated MEIS1 promotes transcriptional
dysregulation in Ewing sarcoma in co-operation with EWS-FLI1.
Nucleic Acids Res. 47:1255–1267. 2019. View Article : Google Scholar : PubMed/NCBI
|
|
37
|
Henrich IC, Young R, Quick L, Oliveira AM
and Chou MM: USP6 confers sensitivity to IFN-mediated apoptosis
through modulation of TRAIL signaling in Ewing sarcoma. Mol Cancer
Res. 16:1834–1843. 2018. View Article : Google Scholar : PubMed/NCBI
|
|
38
|
Xia L, Su X, Shen J, Meng Q, Yan J, Zhang
C, Chen Y, Wang H and Xu M: ANLN functions as a key candidate gene
in cervical cancer as determined by integrated bioinformatic
analysis. Cancer Manag Res. 10:663–670. 2018. View Article : Google Scholar : PubMed/NCBI
|
|
39
|
Xia P and Xu XY: Prognostic significance
of CD44 in human colon cancer and gastric cancer: Evidence from
bioinformatic analyses. Oncotarget. 7:45538–45546. 2016. View Article : Google Scholar : PubMed/NCBI
|
|
40
|
Mendoza-Naranjo A, El-Naggar A, Wai DH,
Mistry P, Lazic N, Ayala FR, da Cunha IW, Rodriguez-Viciana P,
Cheng H, Tavares Guerreiro Fregnani JH, et al: ERBB4 confers
metastatic capacity in Ewing sarcoma. EMBO Mol Med. 5:1087–1102.
2013. View Article : Google Scholar : PubMed/NCBI
|
|
41
|
Qin H and Liu W: MicroRNA-99a-5p
suppresses breast cancer progression and cell-cycle pathway through
downregulating CDC25A. J Cell Physiol. 234:3526–3537. 2019.
View Article : Google Scholar : PubMed/NCBI
|
|
42
|
Wang J, Jia N, Lyv T, Wang C, Tao X, Wong
K, Li Q and Feng W: Paired box 2 promotes progression of
endometrial cancer via regulating cell cycle pathway. J Cancer.
9:3743–3754. 2018. View Article : Google Scholar : PubMed/NCBI
|
|
43
|
Zhao F, Zhou LH, Ge YZ, Ping WW, Wu X, Xu
ZL, Wang M, Sha ZL and Jia RP: MicroRNA-133b suppresses bladder
cancer malignancy by targeting TAGLN2-mediated cell cycle. J Cell
Physiol. 234:4910–4923. 2019. View Article : Google Scholar : PubMed/NCBI
|
|
44
|
Zhang L, Kang W, Lu X, Ma S, Dong L and
Zou B: LncRNA CASC11 promoted gastric cancer cell proliferation,
migration and invasion in vitro by regulating cell cycle pathway.
Cell Cycle. 17:1886–1900. 2018. View Article : Google Scholar : PubMed/NCBI
|
|
45
|
Guenther LM, Dharia NV, Ross L, Conway A,
Robichaud AL, Catlett JL II, Wechsler CS, Frank ES, Goodale A,
Church AJ, et al: A combination CDK4/6 and IGF1R inhibitor strategy
for Ewing sarcoma. Clin Cancer Res. 25:1343–1357. 2019. View Article : Google Scholar : PubMed/NCBI
|
|
46
|
Lorin S, Borges A, Ribeiro Dos Santos L,
Souquère S, Pierron G, Ryan KM, Codogno P and Djavaheri-Mergny M:
c-Jun NH2-terminal kinase activation is essential for
DRAM-dependent induction of autophagy and apoptosis in
2-methoxyestradiol-treated Ewing sarcoma cells. Cancer Res.
69:6924–6931. 2009. View Article : Google Scholar : PubMed/NCBI
|
|
47
|
Wilky BA, Kim C, McCarty G, Montgomery EA,
Kammers K, DeVine LR, Cole RN, Raman V and Loeb DM: RNA helicase
DDX3: A novel therapeutic target in Ewing sarcoma. Oncogene.
35:2574–2583. 2016. View Article : Google Scholar : PubMed/NCBI
|
|
48
|
Tong DL, Boocock DJ, Dhondalay GK, Lemetre
C and Ball GR: Artificial neural network inference (ANNI): A study
on gene-gene interaction for biomarkers in childhood sarcomas. PLoS
One. 9:e1024832014. View Article : Google Scholar : PubMed/NCBI
|
|
49
|
Cheung IY, Feng Y, Danis K, Shukla N,
Meyers P, Ladanyi M and Cheung NK: Novel markers of subclinical
disease for Ewing family tumors from gene expression profiling.
Clin Cancer Res. 13:6978–6983. 2007. View Article : Google Scholar : PubMed/NCBI
|
|
50
|
Ohali A, Avigad S, Zaizov R, Ophir R,
Horn-Saban S, Cohen IJ, Meller I, Kollender Y, Issakov J and Yaniv
I: Prediction of high risk Ewing's sarcoma by gene expression
profiling. Oncogene. 23:8997–9006. 2004. View Article : Google Scholar : PubMed/NCBI
|
|
51
|
Kikuta K, Tochigi N, Shimoda T, Yabe H,
Morioka H, Toyama Y, Hosono A, Beppu Y, Kawai A, Hirohashi S and
Kondo T: Nucleophosmin as a candidate prognostic biomarker of
Ewing's sarcoma revealed by proteomics. Clin Cancer Res.
15:2885–2894. 2009. View Article : Google Scholar : PubMed/NCBI
|
|
52
|
Wei B and Jin JP: TNNT1, TNNT2, and TNNT3:
Isoform genes, regulation, and structure-function relationships.
Gene. 582:1–13. 2016. View Article : Google Scholar : PubMed/NCBI
|
|
53
|
Gupton SL, Anderson KL, Kole TP, Fischer
RS, Ponti A, Hitchcock-DeGregori SE, Danuser G, Fowler VM, Wirtz D,
Hanein D and Waterman-Storer CM: Cell migration without a
lamellipodium: Translation of actin dynamics into cell movement
mediated by tropomyosin. J Cell Biol. 168:619–631. 2005. View Article : Google Scholar : PubMed/NCBI
|
|
54
|
Lees JG, Bach CT and O'Neill GM: Interior
decoration: Tropomyosin in actin dynamics and cell migration. Cell
Adh Migr. 5:181–186. 2011. View Article : Google Scholar : PubMed/NCBI
|
|
55
|
Nguyen TH and Barr FG: Therapeutic
approaches targeting PAX3-FOXO1 and its regulatory and
transcriptional pathways in rhabdomyosarcoma. Molecules. 23(pii):
E27982018. View Article : Google Scholar : PubMed/NCBI
|
|
56
|
Kawabe S, Mizutani T, Ishikane S, Martinez
ME, Kiyono Y, Miura K, Hosoda H, Imamichi Y, Kangawa K, Miyamoto K
and Yoshida Y: Establishment and characterization of a novel
orthotopic mouse model for human uterine sarcoma with different
metastatic potentials. Cancer Lett. 366:182–190. 2015. View Article : Google Scholar : PubMed/NCBI
|
|
57
|
Davidson B, Abeler VM, Forsund M, Holth A,
Yang Y, Kobayashi Y, Chen L, Kristensen GB, Shih IeM and Wang TL:
Gene expression signatures of primary and metastatic uterine
leiomyosarcoma. Hum Pathol. 45:691–700. 2014. View Article : Google Scholar : PubMed/NCBI
|
|
58
|
Shi Y, Zhao Y, Zhang Y, AiErken N, Shao N,
Ye R, Lin Y and Wang S: TNNT1 facilitates proliferation of breast
cancer cells by promoting G1/S phase transition. Life
Sci. 208:161–166. 2018. View Article : Google Scholar : PubMed/NCBI
|
|
59
|
Lawrenson K, Pakzamir E, Liu B, Lee JM,
Delgado MK, Duncan K, Gayther SA, Liu S, Roman L and
Mhawech-Fauceglia P: Molecular analysis of mixed endometrioid and
serous adenocarcinoma of the endometrium. PLoS One.
10:e01309092015. View Article : Google Scholar : PubMed/NCBI
|
|
60
|
Kuroda T, Yasuda S, Nakashima H, Takada N,
Matsuyama S, Kusakawa S, Umezawa A, Matsuyama A, Kawamata S and
Sato Y: Identification of a gene encoding slow skeletal muscle
troponin t as a novel marker for immortalization of retinal pigment
epithelial cells. Sci Rep. 7:81632017. View Article : Google Scholar : PubMed/NCBI
|
|
61
|
Gu X, Li B, Jiang M, Fang M, Ji J, Wang A,
Wang M, Jiang X and Gao C: RNA sequencing reveals differentially
expressed genes as potential diagnostic and prognostic indicators
of gallbladder carcinoma. Oncotarget. 6:20661–20671. 2015.
View Article : Google Scholar : PubMed/NCBI
|
|
62
|
Watanabe H, Atsuta N, Hirakawa A, Nakamura
R, Nakatochi M, Ishigaki S, Iida A, Ikegawa S, Kubo M, Yokoi D, et
al: A rapid functional decline type of amyotrophic lateral
sclerosis is linked to low expression of TTN. J Neurol Neurosurg
Psychiatry. 87:851–858. 2016. View Article : Google Scholar : PubMed/NCBI
|
|
63
|
Herman DS, Lam L, Taylor MR, Wang L,
Teekakirikul P, Christodoulou D, Conner L, DePalma SR, McDonough B,
Sparks E, et al: Truncations of titin causing dilated
cardiomyopathy. N Engl J Med. 366:619–628. 2012. View Article : Google Scholar : PubMed/NCBI
|
|
64
|
Kim N, Hong Y, Kwon D and Yoon S: Somatic
mutaome profile in human cancer tissues. Genomics Inform.
11:239–244. 2013. View Article : Google Scholar : PubMed/NCBI
|
|
65
|
Wolff RK, Hoffman MD, Wolff EC, Herrick
JS, Sakoda LC, Samowitz WS and Slattery ML: Mutation analysis of
adenomas and carcinomas of the colon: Early and late drivers. Genes
Chromosomes Cancer. 57:366–376. 2018. View Article : Google Scholar : PubMed/NCBI
|
|
66
|
Bizama C, Benavente F, Salvatierra E,
Gutiérrez-Moraga A, Espinoza JA, Fernández EA, Roa I, Mazzolini G,
Sagredo EA, Gidekel M and Podhajcer OL: The low-abundance
transcriptome reveals novel biomarkers, specific intracellular
pathways and targetable genes associated with advanced gastric
cancer. Int J Cancer. 134:755–764. 2014. View Article : Google Scholar : PubMed/NCBI
|
|
67
|
Yang CK, Yu TD, Han CY, Qin W, Liao XW, Yu
L, Liu XG, Zhu GZ, Su H, Lu SC, et al: Genome-wide association
study of MKI67 expression and its clinical implications in
HBV-related hepatocellular carcinoma in Southern China. Cell
Physiol Biochem. 42:1342–1357. 2017. View Article : Google Scholar : PubMed/NCBI
|
|
68
|
Cheng X, Yin H, Fu J, Chen C, An J, Guan
J, Duan R, Li H and Shen H: Aggregate analysis based on TCGA: TTN
missense mutation correlates with favorable prognosis in lung
squamous cell carcinoma. J Cancer Res Clin Oncol. 145:1027–1035.
2019. View Article : Google Scholar : PubMed/NCBI
|
|
69
|
Caleshu C, Sakhuja R, Nussbaum RL,
Schiller NB, Ursell PC, Eng C, De Marco T, McGlothlin D, Burchard
EG and Rame JE: Furthering the link between the sarcomere and
primary cardiomyopathies: Restrictive cardiomyopathy associated
with multiple mutations in genes previously associated with
hypertrophic or dilated cardiomyopathy. Am J Med Genet A 155A.
2229–2235. 2011. View Article : Google Scholar
|
|
70
|
Kalia SS, Adelman K, Bale SJ, Chung WK,
Eng C, Evans JP, Herman GE, Hufnagel SB, Klein TE, Korf BR, et al:
Recommendations for reporting of secondary findings in clinical
exome and genome sequencing, 2016 update (ACMG SF v2.0): A policy
statement of the American college of medical genetics and genomics.
Genet Med. 19:249–255. 2017. View Article : Google Scholar : PubMed/NCBI
|
|
71
|
Grabarek Z: Structural basis for diversity
of the EF-hand calcium-binding proteins. J Mol Biol. 359:509–525.
2006. View Article : Google Scholar : PubMed/NCBI
|
|
72
|
Morano I: Tuning smooth muscle contraction
by molecular motors. J Mol Med (Berl). 81:481–487. 2003. View Article : Google Scholar : PubMed/NCBI
|
|
73
|
Meder B, Laufer C, Hassel D, Just S,
Marquart S, Vogel B, Hess A, Fishman MC, Katus HA and Rottbauer W:
A single serine in the carboxyl terminus of cardiac essential
myosin light chain-1 controls cardiomyocyte contractility in vivo.
Circ Res. 104:650–659. 2009. View Article : Google Scholar : PubMed/NCBI
|
|
74
|
Gharahkhani P, Fitzgerald RC, Vaughan TL,
Palles C, Gockel I, Tomlinson I, Buas MF, May A, Gerges C, Anders
M, et al: Genome-wide association studies in oesophageal
adenocarcinoma and Barrett's oesophagus: A large-scale
meta-analysis. Lancet Oncol. 17:1363–1373. 2016. View Article : Google Scholar : PubMed/NCBI
|
|
75
|
Dalan AB, Gulluoglu S, Tuysuz EC, Kuskucu
A, Yaltirik CK, Ozturk O, Ture U and Bayrak OF: Simultaneous
analysis of miRNA-mRNA in human meningiomas by integrating
transcriptome: A relationship between PTX3 and miR-29c. BMC Cancer.
17:2072017. View Article : Google Scholar : PubMed/NCBI
|
|
76
|
Ito-Kureha T, Koshikawa N, Yamamoto M,
Semba K, Yamaguchi N, Yamamoto T, Seiki M and Inoue J: Tropomodulin
1 expression driven by NF-κB enhances breast cancer growth. Cancer
Res. 75:62–72. 2015. View Article : Google Scholar : PubMed/NCBI
|
|
77
|
Núñez-Enríquez JC, Bárcenas-López DA,
Hidalgo-Miranda A, Jiménez-Hernández E, Bekker-Méndez VC,
Flores-Lujano J, Solis-Labastida KA, Martínez-Morales GB,
Sánchez-Muñoz F, Espinoza-Hernández LE, et al: Gene expression
profiling of acute lymphoblastic leukemia in children with very
early relapse. Arch Med Res. 47:644–655. 2016. View Article : Google Scholar : PubMed/NCBI
|
|
78
|
Suzuki T, Kasamatsu A, Miyamoto I, Saito
T, Higo M, Endo-Sakamoto Y, Shiiba M, Tanzawa H and Uzawa K:
Overexpression of TMOD1 is associated with enhanced regional lymph
node metastasis in human oral cancer. Int J Oncol. 48:607–612.
2016. View Article : Google Scholar : PubMed/NCBI
|
|
79
|
Staaf J, Jönsson G, Ringnér M,
Vallon-Christersson J, Grabau D, Arason A, Gunnarsson H, Agnarsson
BA, Malmström PO, Johannsson OT, et al: High-resolution genomic and
expression analyses of copy number alterations in HER2-amplified
breast cancer. Breast Cancer Res. 12:R252010. View Article : Google Scholar : PubMed/NCBI
|
|
80
|
Pan X, Hu X, Zhang YH, Chen L, Zhu L, Wan
S, Huang T and Cai YD: Identification of the copy number variant
biomarkers for breast cancer subtypes. Mol Genet Genomics.
294:95–110. 2019. View Article : Google Scholar : PubMed/NCBI
|
|
81
|
Sawaki K, Kanda M, Miwa T, Umeda S, Tanaka
H, Tanaka C, Kobayashi D, Suenaga M, Hattori N, Hayashi M, et al:
Troponin I2 as a specific biomarker for prediction of peritoneal
metastasis in gastric cancer. Ann Surg Oncol. 25:2083–2090. 2018.
View Article : Google Scholar : PubMed/NCBI
|
|
82
|
Postel-Vinay S, Véron AS, Tirode F,
Pierron G, Reynaud S, Kovar H, Oberlin O, Lapouble E, Ballet S,
Lucchesi C, et al: Common variants near TARDBP and EGR2 are
associated with susceptibility to Ewing sarcoma. Nat Genet.
44:323–327. 2012. View Article : Google Scholar : PubMed/NCBI
|
|
83
|
Schmiedel BJ, Hutter C, Hesse M and Staege
MS: Expression of multiple membrane-associated phospholipase A1
beta transcript variants and lysophosphatidic acid receptors in
Ewing tumor cells. Mol Biol Rep. 38:4619–4628. 2011. View Article : Google Scholar : PubMed/NCBI
|
|
84
|
Foell JL, Hesse M, Volkmer I, Schmiedel
BJ, Neumann I and Staege MS: Membrane-associated phospholipase A1
beta (LIPI) Is an Ewing tumour-associated cancer/testis antigen.
Pediatr Blood Cancer. 51:228–234. 2008. View Article : Google Scholar : PubMed/NCBI
|
|
85
|
Kedage V, Selvaraj N, Nicholas TR, Budka
JA, Plotnik JP, Jerde TJ and Hollenhorst PC: An interaction with
Ewing's Sarcoma breakpoint protein EWS defines a specific oncogenic
mechanism of ETS factors rearranged in prostate cancer. Cell
Reports. 17:1289–1301. 2016. View Article : Google Scholar : PubMed/NCBI
|