Introduction
Tumor development is frequently associated with its
microenvironment and activation of abnormal signaling pathways in
the tumor, such as Hedgehog, Wnt, Notch, transforming growth
factor-β and AKT (1). For example,
poor oxygenation or hypoxia is commonly found in solid tumors and
affects tumor angiogenesis, heterogeneity, tumor progression and
sensitivity to radiotherapy or chemotherapy (1,2). This
phenomenon is frequent in head and neck squamous cell carcinomas,
in particular in oral squamous cell carcinomas (OSCCs) (3,4),
including that of the mouth floor, buccal mucosa, alveolar ridge,
posterior molar triangle and hard palate, where the degree of tumor
hypoxia has a crucial influence on chemoradiotherapy resistance,
prognosis and patients' overall survival (OS) (5–8).
Although early diagnosis and treatment methods have been developed
in the past few years, local recurrence and lymph node metastasis
remain the major factors influencing the prognosis of patients with
OSCC (9), and the 5-year survival
rate has not significantly improved over the past several decades
(60%) (10). Furthermore, advanced
clinical manifestations, subtle symptomatology and rapid disease
progression also contribute to OSCC poor prognosis (11,12). It
is therefore crucial to identify novel biomarkers that could
provide a deeper understanding of the molecular mechanisms involved
in oral carcinogenesis and OSCC progression, in order to identify
better diagnostic methods and more effective prognostic
indicators.
Under hypoxic conditions, cancer cells exhibit
reduced oxidative metabolism and initiate the protection of ATP by
limiting certain energy-consuming processes, including protein
synthesis of hypoxia-inducible factor (HIF) and mTOR (13). The effect of hypoxia on protein
synthesis is partly mediated by the inhibition of mammalian target
of rapamycin complex 1 (mTORC1) kinase (14), which is a central regulator of cell
proliferation and protein translation (15,16). The
hypoxia-inducible gene named regulated in development and DNA
damage response 1 (REDD1, also known as DDIT4/RTP801/Dig1), which
was first discovered in 2002, is induced by hypoxia and other
cellular stress as an upstream inhibitor of mTORC1 signaling and as
an essential regulatory factor contributing to multiple DNA damage,
which are widely expressed in many human tissues (17,18).
REDD1, which encodes a serine-rice 232-amino acid cytoplasmic
protein with an unknown functional domain, is localized to the
human chromosome 10q24.33 and has one open reading frame and
acid-coded prediction (18).
REDD1-mediated mTOR inhibition occurs in cells exposed to hypoxia
and cells responding to energy stress, and depends on the presence
of the functional tuberous sclerosis (TSC)1/TSC2 inhibitory complex
(19,20).
To the best of our knowledge, the role of REDD1 in
human oral cancer remains unclear. The present study aimed
therefore to determine REDD1 expression in OSCC tissues, to
evaluate whether REDD1 expression could be considered as a novel
therapeutic target and a key regulatory checkpoint in OSCC and to
explore its association with patients' clinicopathological
characteristics and survival rate. In addition, since hypoxia is
common in OSCC (7), the present
study evaluated the association between REDD1 expression and
microvessel density (MVD) in order to further understand the
underlying mechanism of REDD1 in OSCC.
Materials and methods
Patients and tissue specimens
A total of 23 pairs of fresh-frozen (stored in
liquid nitrogen) OSCC tissues and matched peritumoral mucosal
tissues (distance from tumor edge, >2 cm) obtained from 23
patients with OSCC between January 2017 and December 2018, and 93
formalin-fixed paraffin-embedded tissue samples (74 primary OSCC
and 19 peritumoral mucosa) obtained from 74 patients with OSCC
between January 2007 and December 2012, were collected from the
Affiliated Hospital of Qingdao University. Histopathological
evaluation was performed independently by two pathologists. All
diagnoses were made according to the pathology criteria of head and
neck tumors of the 4th edition of the World Health Organization
classification of tumors in 2017 (21). Clinical, demographic and pathological
data from all patients are listed in Tables I and II. The study was approved and supervised
by the Institutional Medical Ethics Committee of the Affiliated
Hospital of Qingdao University, and written informed consent was
obtained from each patient. Tumors were staged and graded according
to clinical TNM stage and histologic grade of the National
Comprehensive Cancer Network (NCCN) guidelines (22). There were 34 stage I/II tumors and 40
stage III/IV tumors. The 74 patients were followed up by interview
at the clinic or by telephone for 5 years. The last follow-up
time-point was in December 2017, where 26 patients had died and 48
patients were alive. Among the 74 patients, 18 had tumor
recurrence. The median age of the patients was 57.8 years (age
range, 36–79 years).
 | Table I.Clinicopathological characteristics
of the 23 patients with oral squamous cell carcinoma. |
Table I.
Clinicopathological characteristics
of the 23 patients with oral squamous cell carcinoma.
| Clinicopathological
characteristics | n (%) |
|---|
| Age, years |
|
≤57.8 | 11 (47.83) |
|
>57.8 | 12 (52.17) |
| Sex |
|
Male | 16 (69.57) |
|
Female | 7
(30.43) |
| Tumor size, cm |
| ≤4 | 13 (56.52) |
|
>4 | 10 (43.48) |
| TNM stage |
| I,
II | 10 (43.48) |
| III,
IV | 13 (56.52) |
| Histological
grade |
| G1 | 12 (52.17) |
| G2 | 9
(39.13) |
| G3 | 2
(8.70) |
| Lymphatic
metastasis |
|
Negative | 9
(39.13) |
|
Positive | 14 (60.87) |
| Table II.Association between REDD1, MVD
expression and clinicopathological characteristics of 74 patients
with OSCC. |
Table II.
Association between REDD1, MVD
expression and clinicopathological characteristics of 74 patients
with OSCC.
|
|
| REDD1
expression |
| MVD |
|
|---|
|
|
|
|
|
|
|
|---|
| Clinicopathological
characteristics | Cases (%) | Negative/weak
(0–3) | Moderate/strong
(4–7) | P-value | ≤35 | >35 | P-value |
|---|
| Age, years |
|
≤57.8 | 36 (48.65) | 22 | 14 | 0.610 | 20 | 16 | 0.481 |
|
>57.8 | 38 (51.35) | 21 | 17 |
| 18 | 20 |
|
| Sex |
|
Male | 50 (67.57) | 29 | 21 | 0.978 | 27 | 23 | 0.511 |
|
Female | 24 (32.43) | 14 | 10 |
| 11 | 13 |
|
| Tumor size, cm |
| ≤4 | 42 (56.76) | 25 | 17 | 0.777 | 22 | 20 | 0.839 |
|
>4 | 32 (43.24) | 18 | 14 |
| 16 | 16 |
|
| TNM stage |
| I,
II | 34 (45.95) | 28 | 6 | <0.001 | 22 | 12 | 0.034 |
| III,
IV | 40 (54.05) | 15 | 25 |
| 16 | 24 |
|
| Histological
grade |
| G1 | 39 (52.70) | 29 | 10 | 0.003 | 25 | 14 | 0.011 |
| G2 | 28 (37.84) | 13 | 15 |
| 12 | 17 |
|
| G3 | 7 (9.46) | 1 | 6 |
| 1 | 5 |
|
| Lymphatic
metastasis |
|
Negative | 40 (54.05) | 29 | 11 | 0.006 | 27 | 13 | 0.003 |
|
Positive | 34 (45.95) | 14 | 20 |
| 11 | 23 |
|
| Tumor
recurrence |
|
Yes | 18 (24.32) | 0 | 18 | <0.001 | 3 | 15 | 0.002 |
| No | 56 (75.68) | 43 | 13 |
| 35 | 21 |
|
| OSCC tissues | 74 | 43 (58.1%) | 31 (41.9%) | <0.001 | 38 | 36 |
|
| Peritumoral
mucosa | 19 | 19 (100%) | 0 (0%) |
|
|
|
|
Total RNA isolation and reverse
transcription-quantitative polymerase chain reaction (RT-qPCR)
RNA isolation and RT-qPCR were performed as
described previously (23,24). Total RNA was extracted from 23
fresh-frozen OSCC and matched peritumoral mucosal tissues using an
RNAprep pure tissue kit (Tiangen Biotech Co., Ltd.) according to
the manufacturer's instructions. Each sample was performed in
triplicate. The concentration and integrity of RNA preparations
were assessed with an EON analyzer (BioTek Instruments, Inc.) using
Gene5 software (version 5; BioTek Instruments, Inc.). The sequences
of the primers used were as follows: REDD1 forward,
5′-GAGCCTGGAGAGCTCGGACT-3′ and reverse, 5′-CTGCATCAGGTTGGCACACA-3′;
and β-actin forward, 5′-CCCTGGAGAAGAGCTACGAG-3′ and reverse,
5′-GGAAGGAAGGCTGGAAGAGT-3′ (Genomics). RT-qPCR amplification
reactions were performed using a PCR Real-Time system (Bio-Rad
CFX96; Bio-Rad Laboratories, Inc.) as follows: Denaturation at 95°C
for 15 min, followed by 39 cycles of 95°C for 10 sec, 53°C for 30
sec and 72°C for 30 sec, with a final extension at 72°C for 10 min.
The relative expression levels of REDD1 were normalized to the
endogenous control β-actin and were expressed as 2−ΔΔCq
(25). Each run included a standard
curve and a buffer blank control without template to test for
contamination of analytical reagent. PCR products were also
visualized using an AlpaImagerHP System (ProteinSimple) following
electrophoresis on 1% agarose gels with ethidium bromide dye.
Western blotting
Tissue proteins from 23 fresh-frozen OSCC and
matched peritumoral mucosal tissues were extracted as previously
described (26). The tissue of each
sample (20 mg) was rapidly lysed in an ice-cold RIPA lysis
containing protease and phosphatase inhibitor (Beyotime Institute
of Biotechnology) for 30 min. The lysates were centrifuged at
12,000 × g for 25 min at 4°C. The protein concentration was
measured using the Micro BCA Protein Assay kit (Beyotime Institute
of Biotechnology). Protein was denatured by boiling for 10 min
before electrophoresis. The protein sample (20 µg) was separated by
10% SDS-PAGE and transferred onto nitrocellulose membranes.
Membranes were blocked with TBS containing 0.1% Tween-20 and 5%
skimmed milk powder on a shaker for 2 h at room temperature, and
incubated overnight at 4°C with the following primary antibodies:
Polyclonal rabbit anti-REDD1 (1:1,000; cat. no. 10638-1-AP;
ProteinTech Group, Inc.) and monoclonal mouse anti-β-actin
(1:5,000; cat. no. 66009-1; ProteinTech Group, Inc.). Membranes
were then incubated with horseradish peroxidase-conjugated
secondary antibody (1:5,000; cat. no. SA00001-1; ProteinTech Group,
Inc.). Clarity™ Western enhanced chemiluminescence substrate and
imaging system (Bio-Rad Laboratories, Inc.) were used to detect the
signal on the membrane. The data were analyzed via densitometry
using ImageJ software V1.6.0 (National Institutes of Health) and
normalized to expression of the internal control β-actin. Each
experiment was repeated three times and the data represent the
means of the three experiments.
Tissue microarray construction and
immunohistochemistry (IHC)
After interpreting the known pathological results of
each paraffin-embedded tissue block, tissue microarrays (TMAs) were
constructed by selecting one representative block from each case
specimen and taking two core tissue regions from morphologically
representative areas of the block (26). Several different TMA blocks were
constructed with 1-mm-diameter cylinders in new wax (97.5% paraffin
and 2.5% beeswax mixed at 55°C for 10 min), each containing 42
cylinders. The blocks then were sectioned at a thickness of 4 µm
and placed on slides coated with 3-aminopropyltriethoxysilane for
immunohistochemistry (IHC).
IHC was performed on TMA sections as previously
described (24). The primary
antibodies used for IHC were as follows: Monoclonal rabbit
anti-CD34 (1:200; cat. no. ab81289; Abcam) and polyclonal rabbit
anti-REDD1 (1:100; cat. no. 10638-1-AP; ProteinTech Group, Inc.).
Following deparaffination and rehydration, slides were heated for 5
min at 95°C for antigen retrieval in a microwave oven in EDTA
buffer. The sections were then washed with phosphate buffer saline
(PBS), and the endogenous peroxidase activity was blocked with 3%
H2O2 for 10 min at room temperature.
Following PBS washes, slides were blocked with 0.5% BSA at room
temperature for 20 min, respective primary antibodies were
incubated with anti-REDD1 or anti-CD34 antibodies overnight at 4°C
in a humidity chamber, followed by the addition of the secondary
antibody (1:1,000; cat. no. SA00001-1; ProteinTech Group, Inc.) at
37°C for 30 min. Following PBS washes for 3 min, the reaction
product was visualized using 3′-diaminobenzidine substrate kit
(Dako; Agilent Technologies, Inc.) for 5 min at room temperature.
Subsequently, the sections were counterstained with hematoxylin for
2 min at room temperature. Negative control sections were incubated
with PBS instead of primary antibody. The slides were covered,
sealed and examined under a light microscope (Olympus Corporation).
Five fields of view (magnification, ×100) were randomly selected
and photographed. IHC staining for REDD1 and CD34 was independently
analyzed by two pathologists, without knowledge of the patients'
clinical information. The IHC scoring criteria for REDD1 used in
the present study was the same as previously described (26). The scaled scores were based on the
estimated proportion of positive tumor cells and analyzed by Image
Pro Plus 6.0 (Media Cybernetics, Inc.). The scores were classified
as 0, 1, 2, 3 or 4 for 0, <10, 10–33, 33–66 or >66% of
positively stained cells proportion, respectively. The score
intensity indicated the average intensity of the positive tumor
cells and was defined as negative, weak, intermediate or strong,
for scores of 0, 1, 2 or 3, respectively. The proportion of
positively stained cells and intensity scores were then added to
obtain a total score ranging between 0 and 7. All specimens were
divided into three groups for further statistical analyses
according to the following criteria: i) Negative/weak expression,
0–3 points; ii) moderate expression, 4–5 points; and iii) strong
expression, 6–7 points.
MVD was calculated according to the positive
staining of CD34 marker on vascular endothelial cells (VECs)
according to the method described by Weidner et al (27). The number of highest density area of
CD34-positive expressing cells was designated as hot spots at low
magnification, and VEC cluster that was clearly distinguished from
the surrounding tumor cells and connective tissue was counted as a
microvessel in high power fields. The microvessel numbers in five
high power fields of each hot spot and in five hot spots of each
section were recorded as the MVD value. In the present study, the
median MVD value of all specimens was used to distinguish between
tissues with high and low levels of vascular expression.
Statistical analysis
All data were statistically analyzed using SPSS
statistical software version 17.0 (SPSS, Inc.). The results are
expressed as the mean ± standard deviation. Unpaired Student's
t-tests were used for comparisons of two groups of data. Multiple
comparisons were evaluated by one-way ANOVA followed by
Student-Newman-Keuls test. Pearson's χ2 test was used to
examine the association between REDD1 expression and the patients'
clinicopathological characteristics, and to examine the association
between MVD and the patients' clinicopathological characteristics,
and was also used to compare REDD1 expression between OSCC and
peritumoral mucosal tissues. Spearman's correlation analysis and
linear regression were used to examine the correlation between MVD
counts and REDD1 expression. Survival analysis according to the
different REDD1 expression groups was performed using the
Kaplan-Meier method and compared by the log-rank (Mantel-Cox) test.
P<0.05 was considered to indicate a statistically significant
difference.
Results
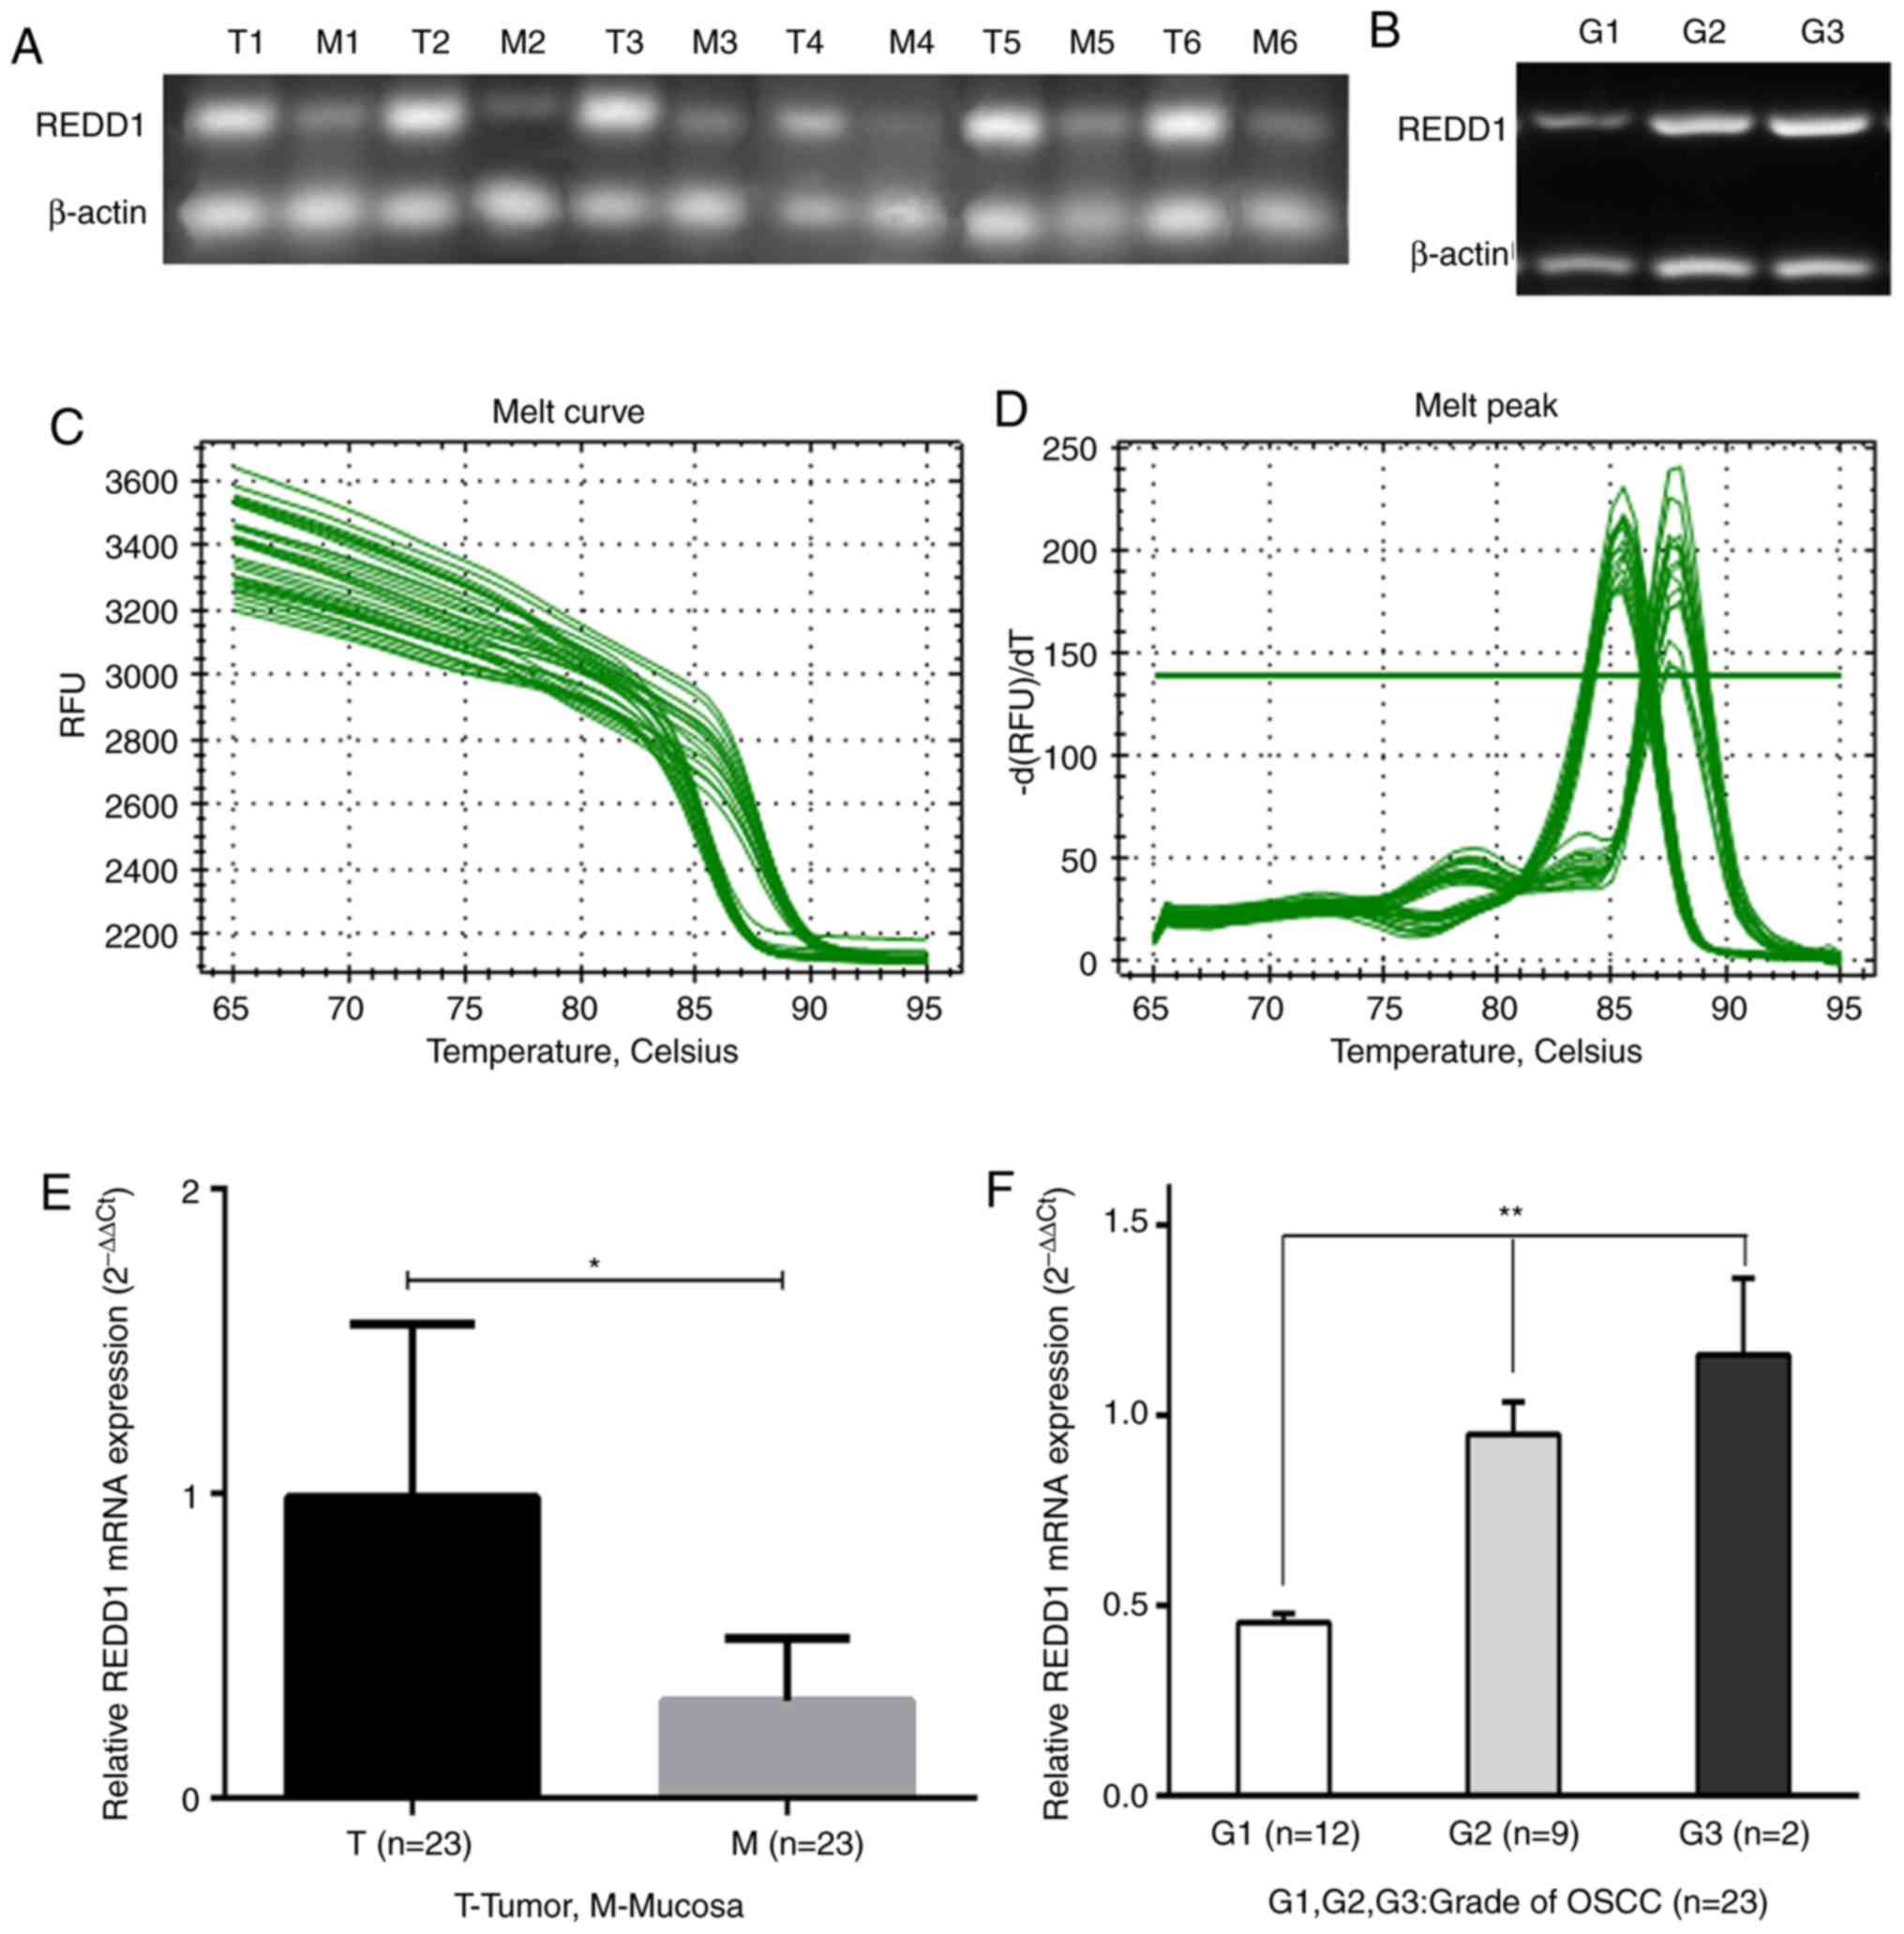
REDD1 mRNA expression in 23
fresh-frozen OSCC and matched peritumoral mucosal tissues
The mRNA expression level of REDD1 in OSCC tissues
and matched peritumoral mucosa was detected by RT-qPCR. The results
demonstrated that REDD1 mRNA level was significantly higher in the
23 OSCC tissues compared with matched peritumoral mucosa (Figs. 1A and E and S1; P<0.05). Furthermore, the mRNA
expression level of REDD1 was associated with histopathological
grade. In particular, the difference in REDD1 expression in highly,
moderately and poorly differentiated (G1, G2 and G3) OSCCs was
statistically significant (Fig. 1B and
F; P<0.01). The melting curves for REDD1 expression are
presented in Fig. 1C and D to show
that it had no non-specific amplification.
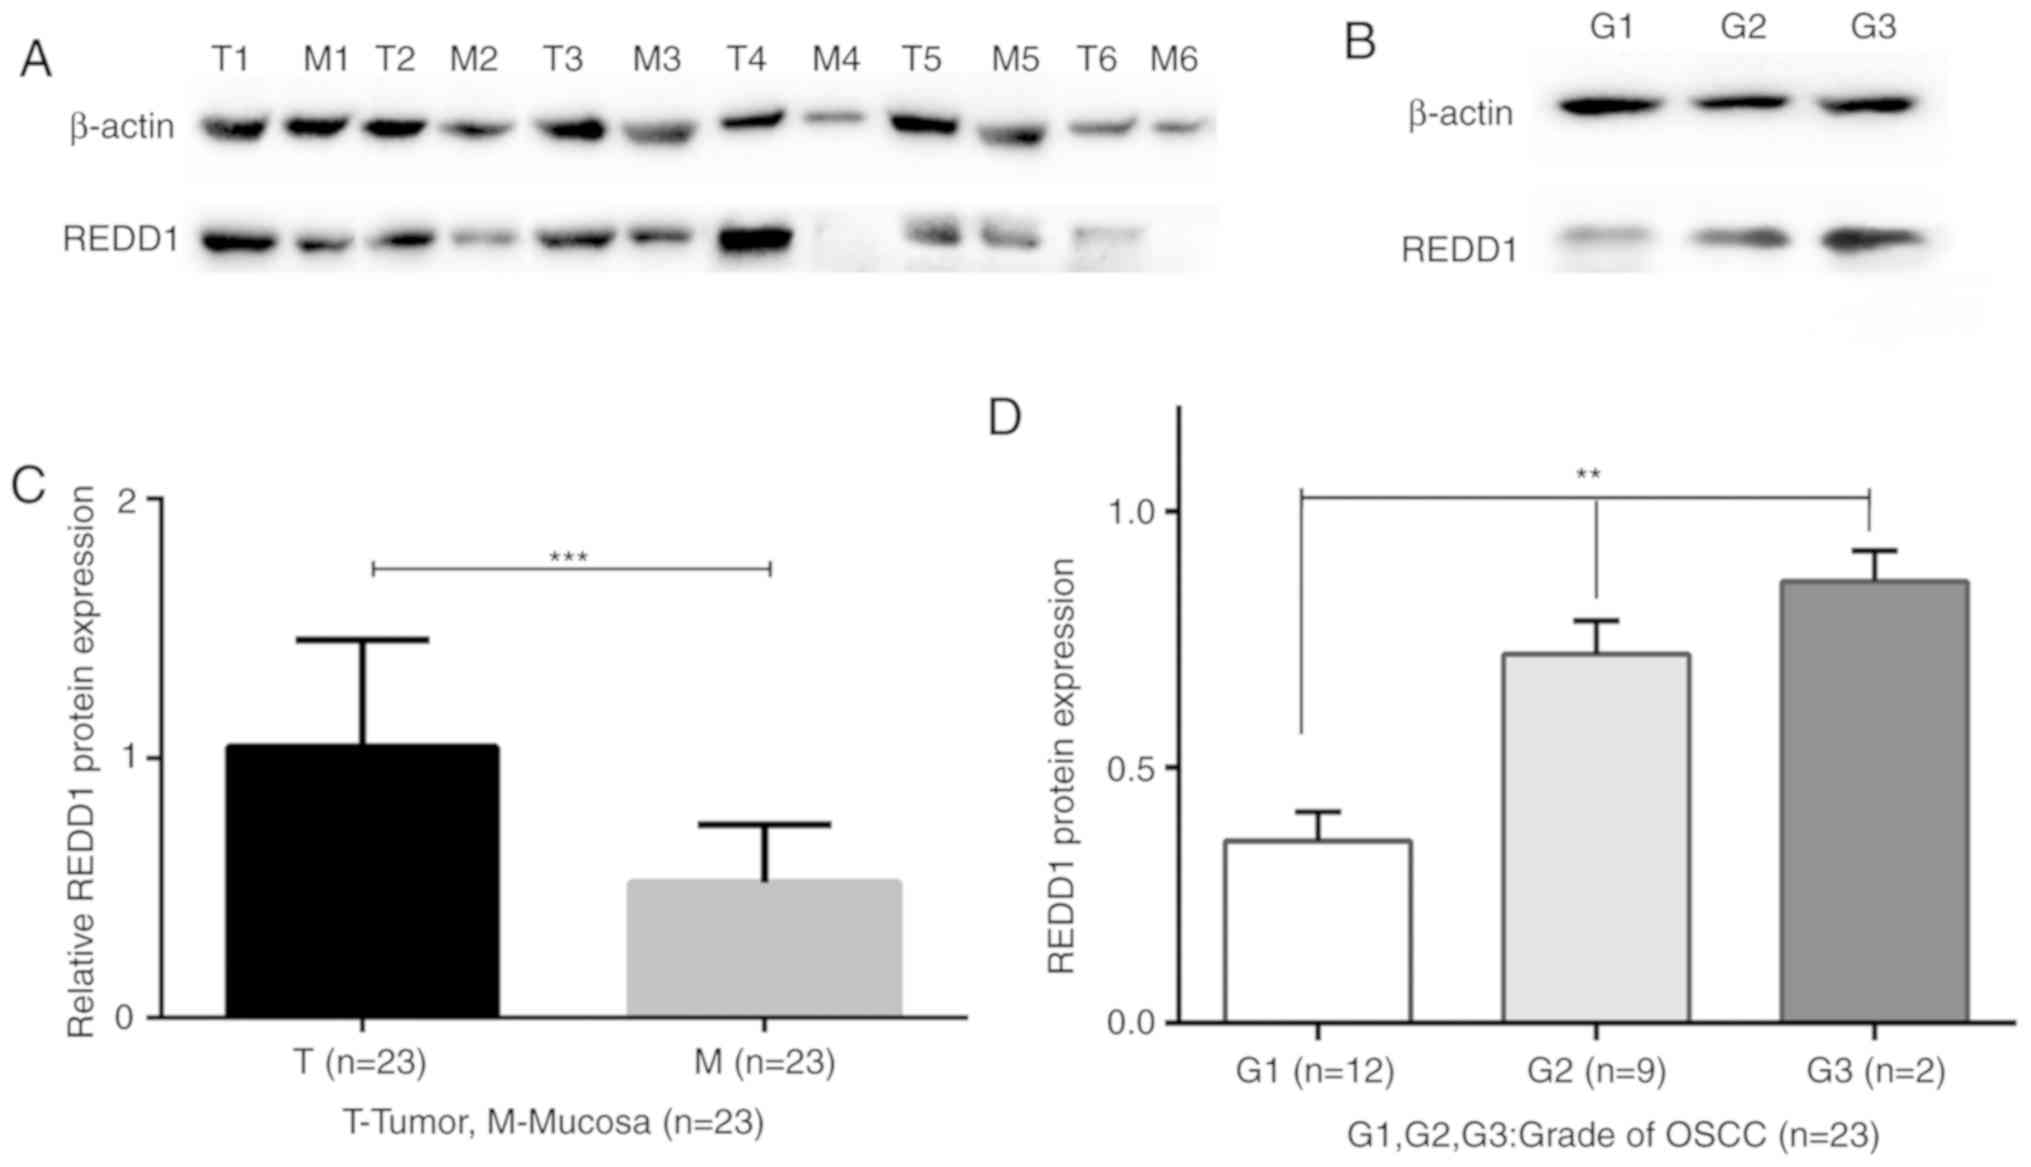
Western blotting analysis of REDD1
expression in primary OSCC and matched mucosal tissues
The protein expression of REDD1 varied greatly among
the 23 fresh-frozen OSCC tissues. Compared with matched peritumoral
mucosa tissues, the protein expression of REDD1 was significantly
increased in the 23 fresh-frozen OSCC tissues (Figs. 2A and 2C and S2;
P<0.001). In addition, there were statistically significant
differences of REDD1 expression in highly, moderately and poorly
differentiated (G1, G2 and G3) OSCCs (Fig. 2B and D; P<0.01).
REDD1 and CD34 IHC in OSCC and
peritumoral mucosal tissues
REDD1 and CD34 IHC staining was performed on 74
primary OSCC and 19 peritumoral mucosal specimens. The results
demonstrated that REDD1 was mainly expressed in tumor cells from
OSCC tissues, whereas CD34 was mainly expressed in VECs of blood
vessels (Figs. 3A-D and 4A-F). The expression of REDD1 protein was
different in tumors and peritumoral tissues, and exhibited
heterogeneity in tumor tissues. The percentage of OSCC tissues with
negative/weak and moderate/strong REDD1 expression was 58.1%
(43/74; Fig. 3B; Table II) and 41.9% (31/74; Fig. 3C and D; Table II), respectively; however, REDD1
expression was weak or negative in all peritumoral mucosal tissues
(0/19; Fig. 3A; P<0.001; Table II). In addition, REDD1 expression
was significantly increased in G2 and G3 OSCC tissues compared with
G1 tissues in a grade-dependent manner (P<0.01 and P<0.001,
respectively; Fig. 3E and F).
Furthermore, the median MVD count was 35 among all OSCC tissues,
and the numbers of samples with low and high MVD were 38 (of 74;
MVD ≤35) and 36 (of 74; MVD >35), respectively.
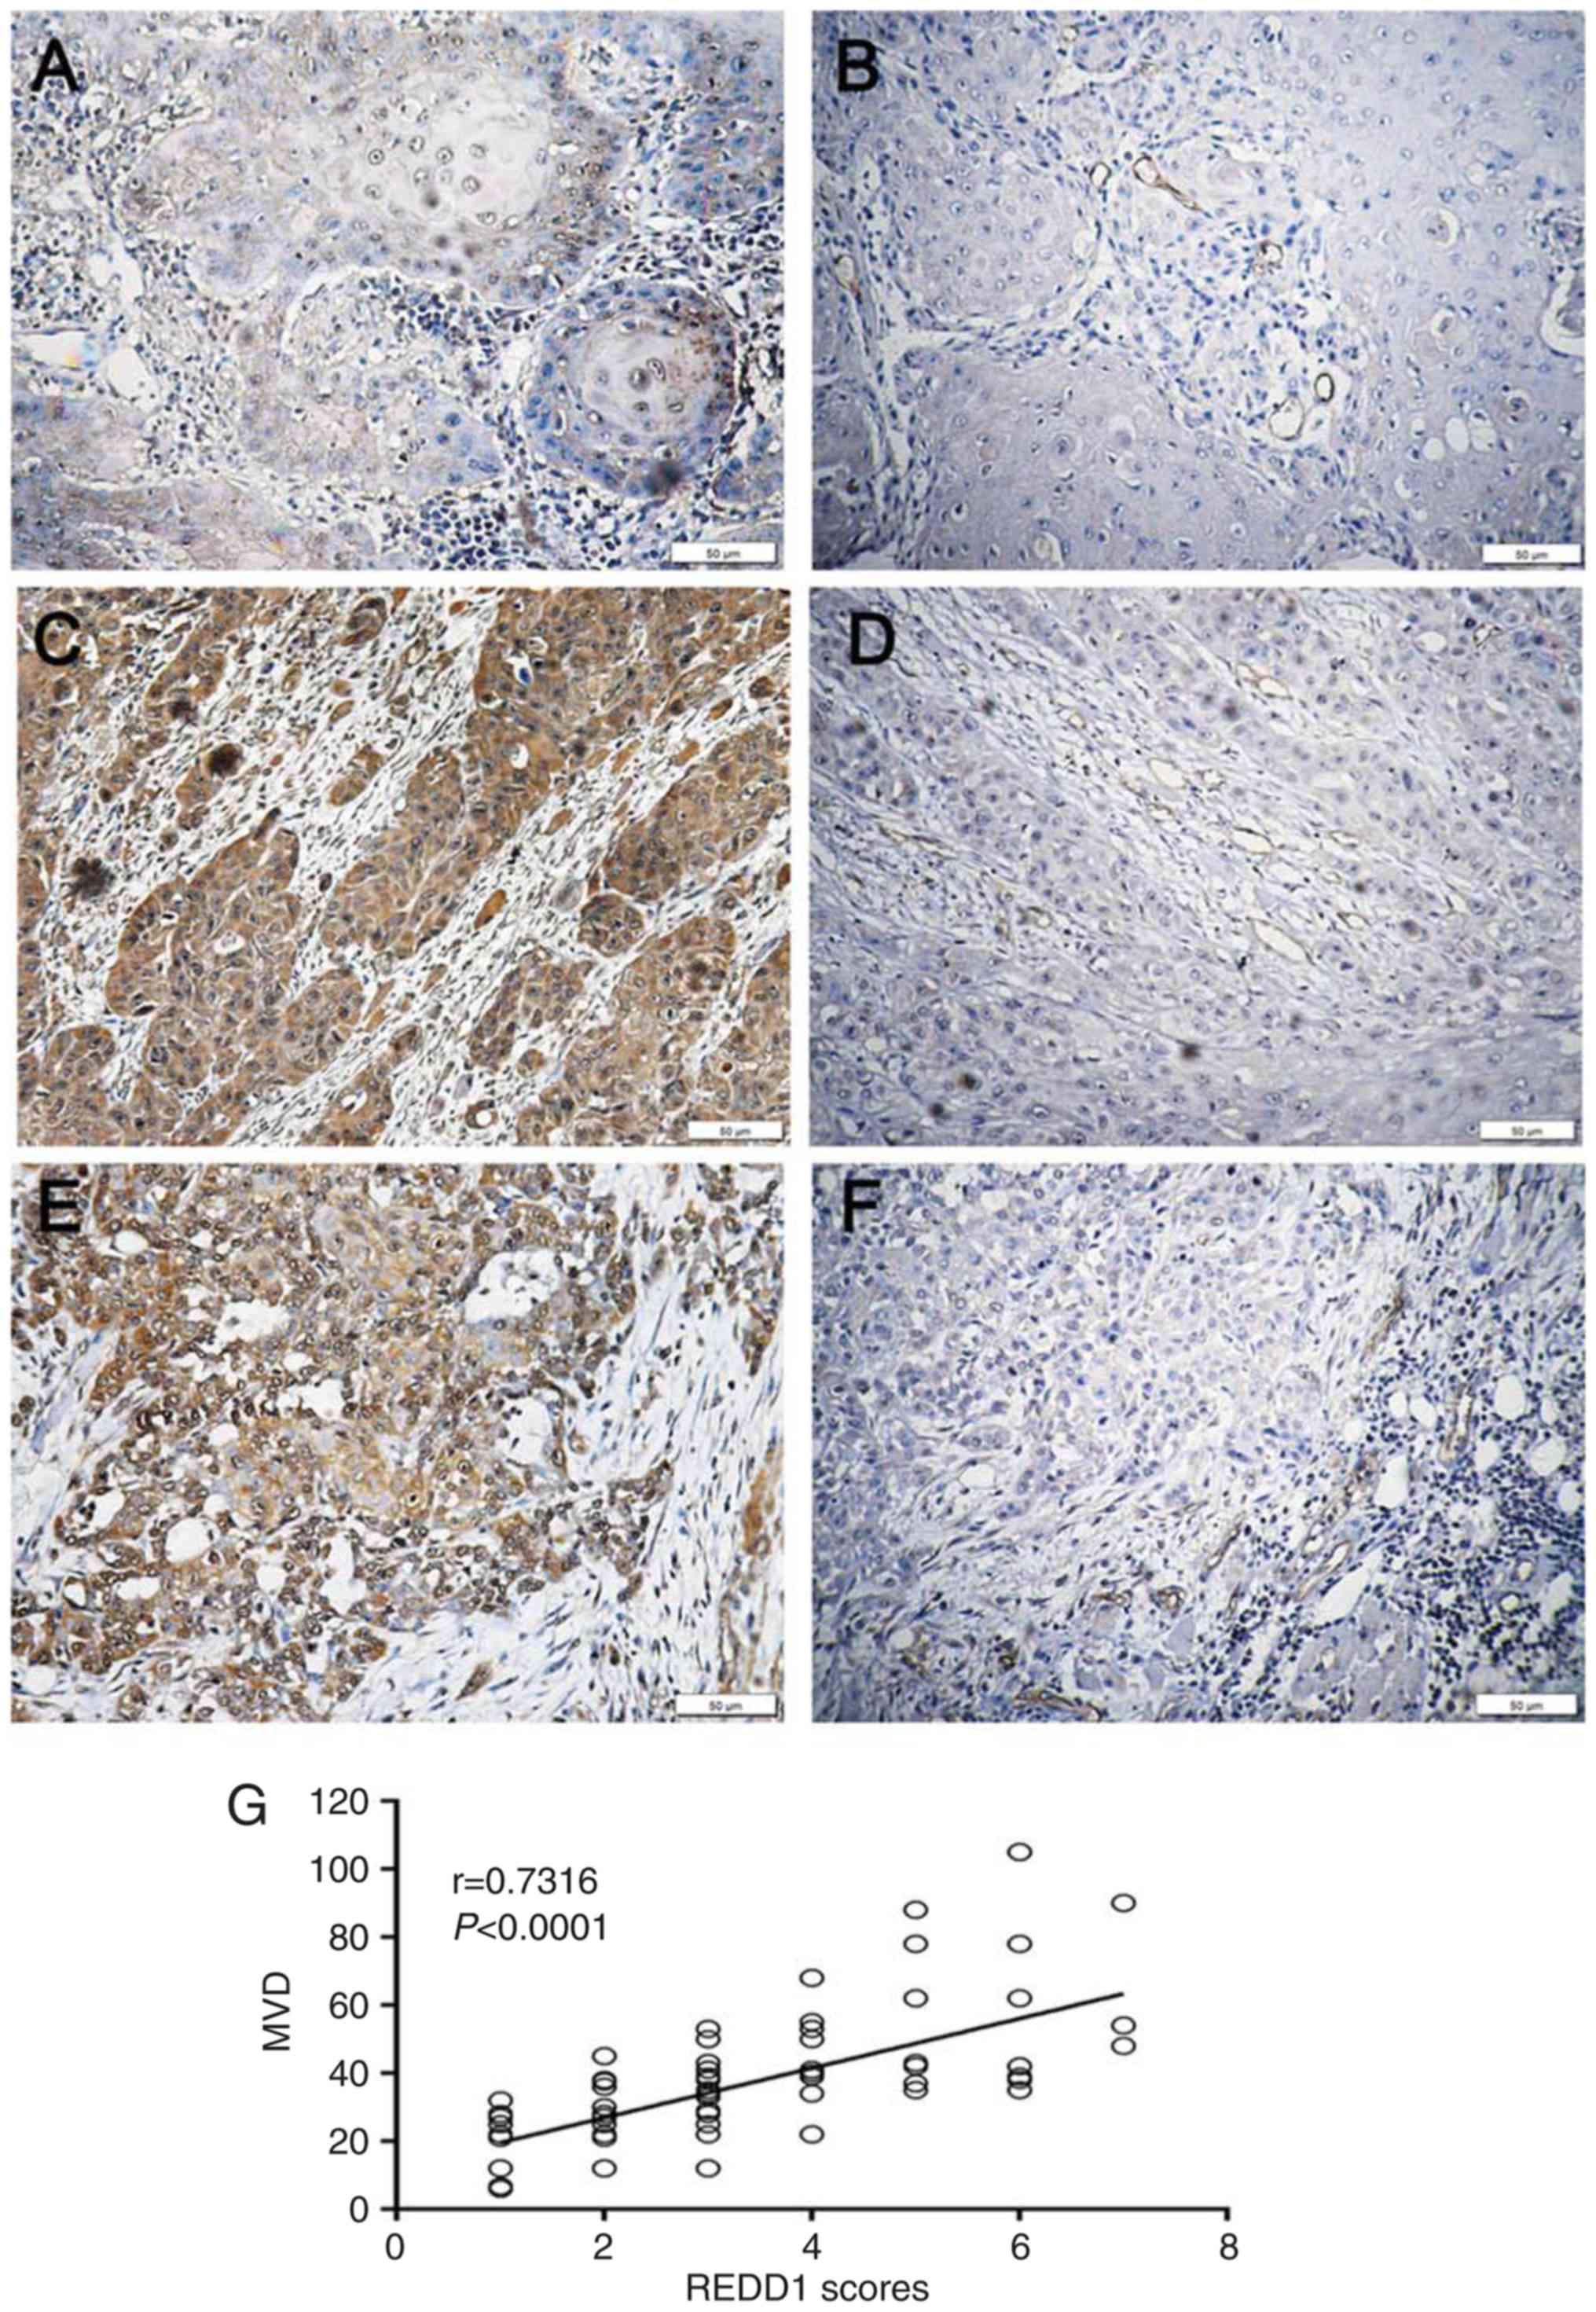
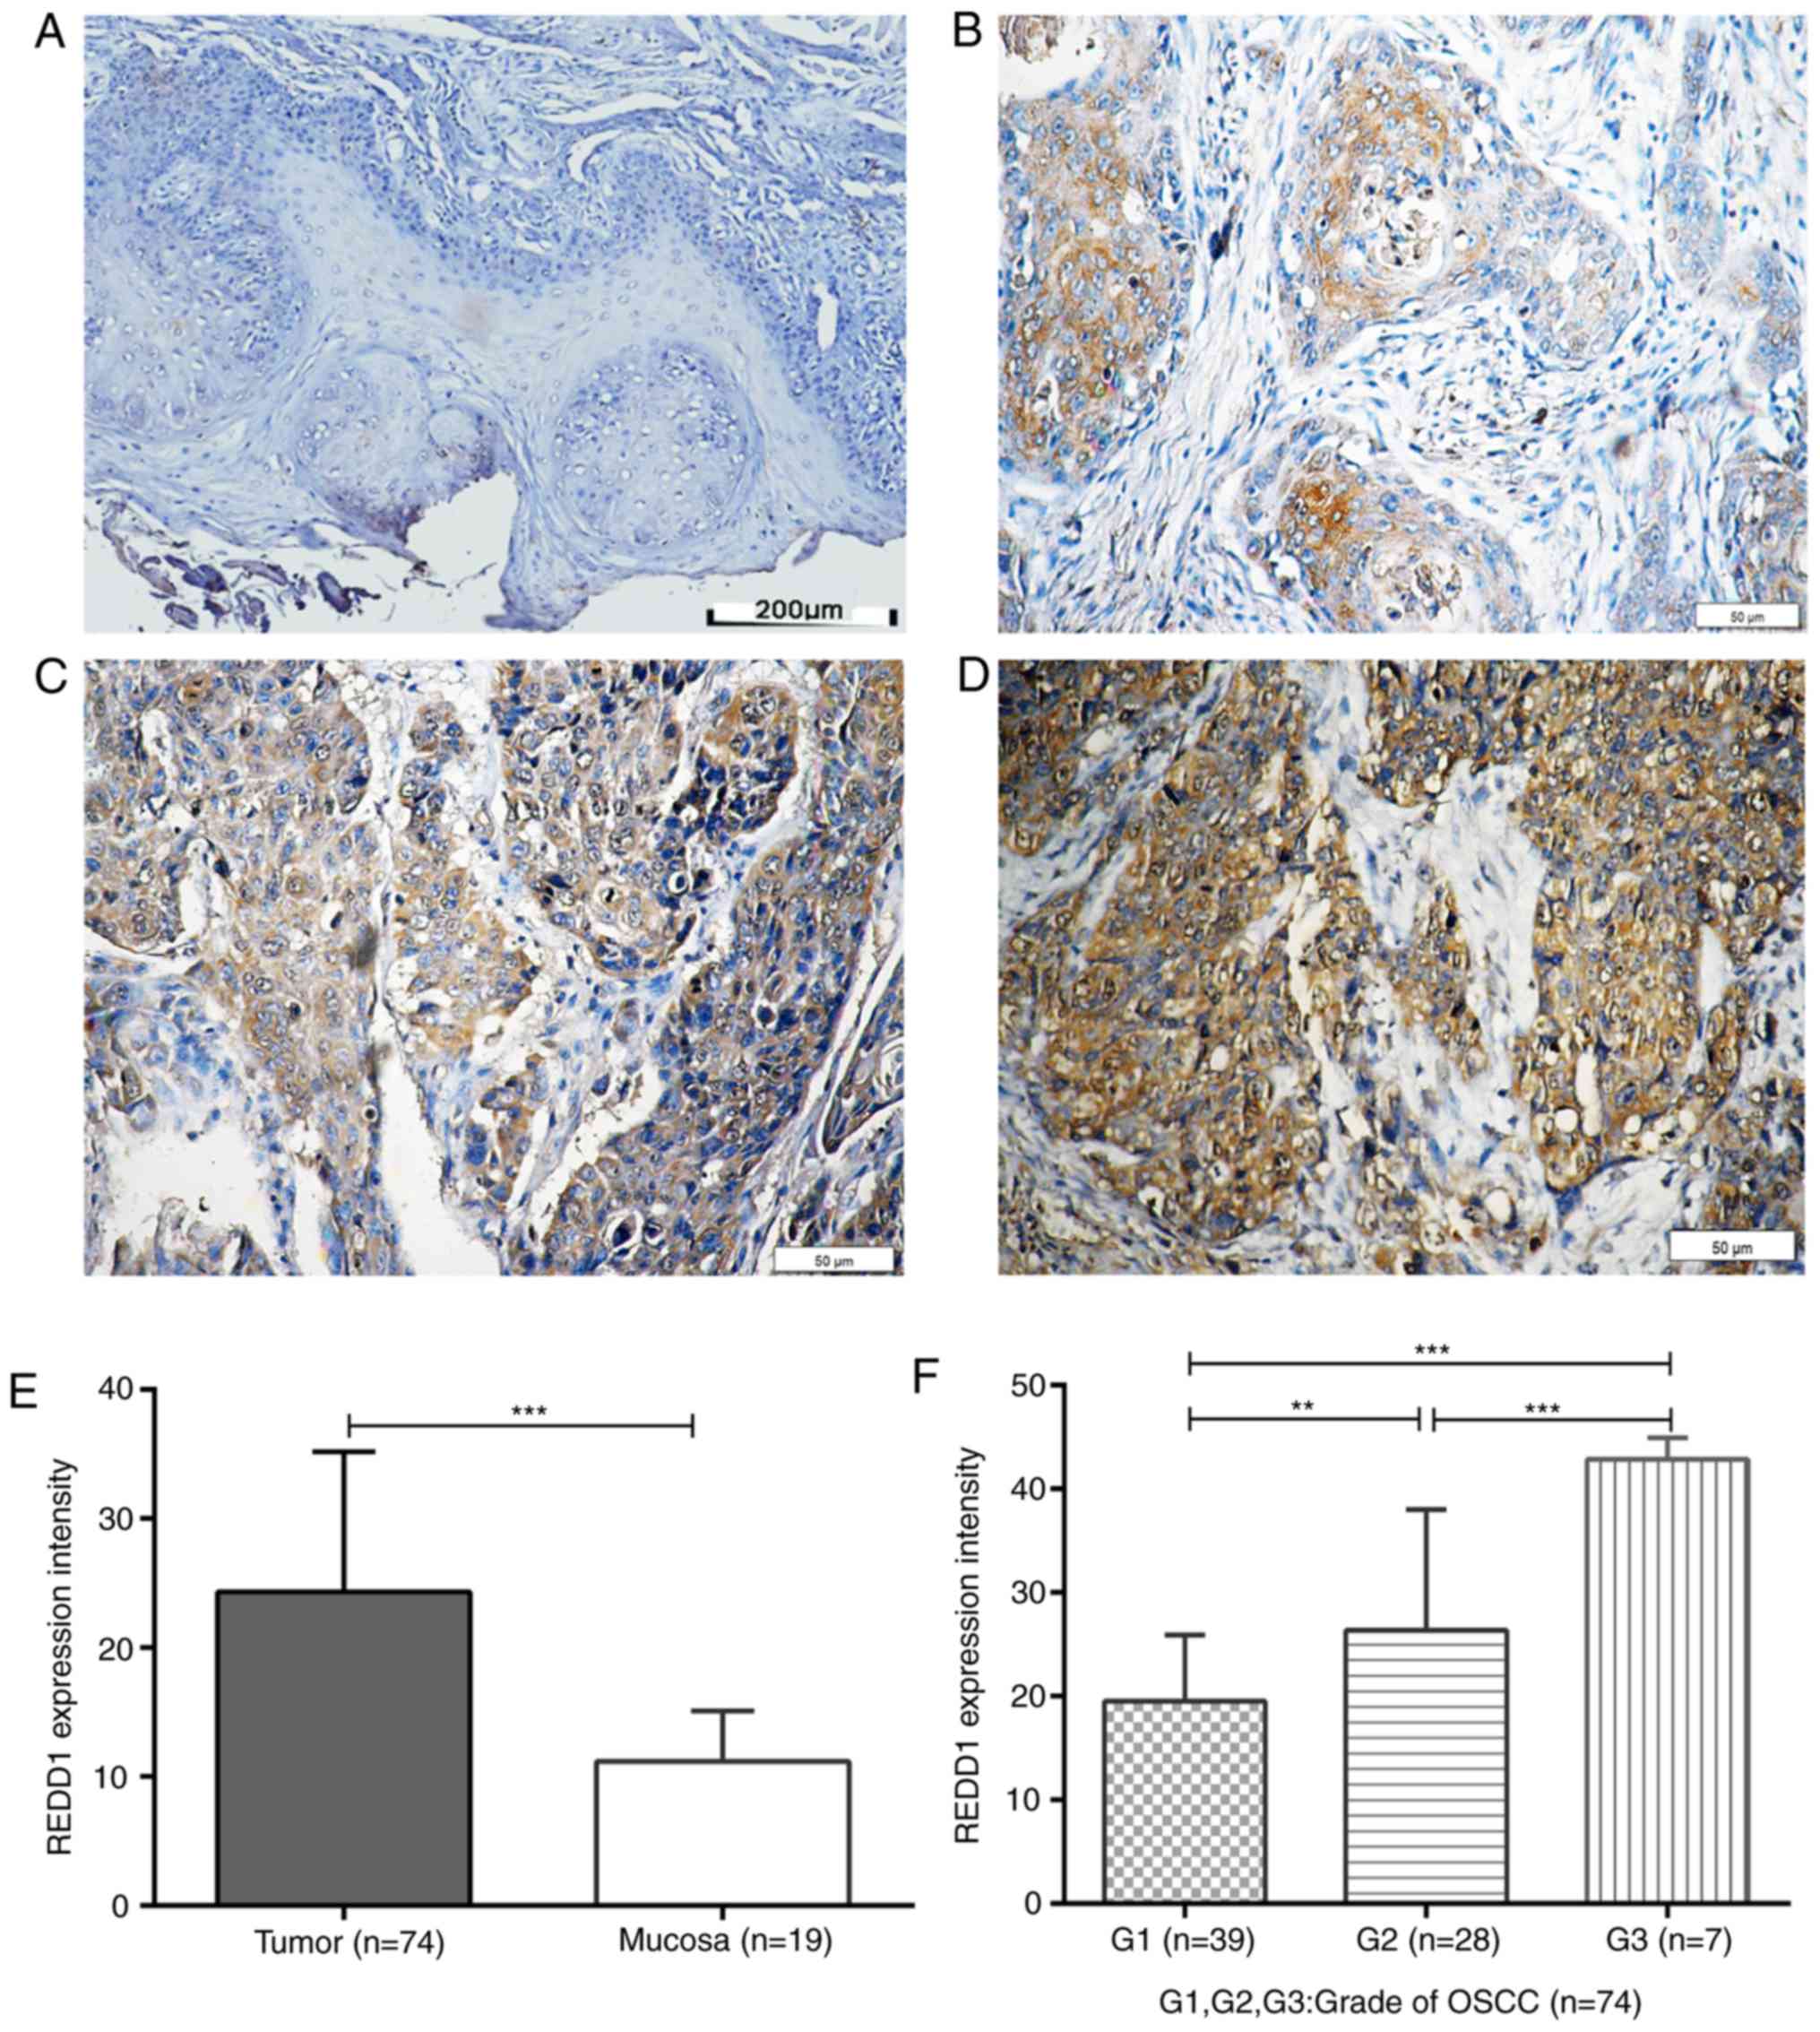 | Figure 3.IHC staining for REDD1 in OSCC and
peritumoral mucosal tissues. Paraffin-embedded sections of OSCC and
adjacent tissues were stained using an anti-REDD1 polyclonal
antibody. (A) Representative REDD1 IHC staining of negative/weak
expression in peritumoral mucosal specimen. Scale bar, 200 µm. (B)
Representative REDD1 IHC staining of weak expression in
highly-differentiated OSCC tissue (G1). Scale bar, 50 µm. (C)
Representative REDD1 IHC staining of moderate expression in
moderately-differentiated OSCC tissue (G2). Scale bar, 50 µm. (D)
Representative REDD1 IHC staining of moderate/strong-expression in
poorly differentiated OSCC tissue. Scale bar, 50 µm. (E) REDD1
expression intensity in 74 primary OSCC and 19 peritumoral mucosal
specimens. (F) REDD1 expression intensity in
differently-differentiated OSCC tissue (G1, n=39; G2, n=28; G3,
n=7). **P<0.01, ***P<0.001. IHC, immunohistochemistry; OSCC,
oral squamous cell carcinoma; REDD1, regulated in development and
DNA damage responses 1. |
Associations between REDD1 expression
or MVD and patients' clinicopathological characteristics
VECs staining for CD34 in areas of
neovascularization was used to detect the MVD in OSCC specimens.
The association between REDD1 expression or MVD count and patients'
clinicopathological characteristics was analyzed in 74 OSCC
tissues. The results demonstrated that both REDD1 expression and
MVD counts were significantly associated with clinical TNM stage
(P<0.001 and P=0.034, respectively), histological grade (P=0.003
and P=0.011, respectively), lymphatic metastasis (P=0.006 and
P=0.003, respectively) and tumor recurrence (P<0.001 and
P=0.002, respectively; Table II).
However, REDD1 expression and MVD counts were not associated with
age, sex and tumor size (P>0.05; Table II).
Correlation between REDD1 expression
and MVD in OSCC tissues
To investigate the correlation between REDD1
expression and MVD in OSCC tissues, Spearman's correlation analysis
and linear regression were used. Among the 43 cases of OSCC with
negative/weak REDD1 expression, 33 presented with low MVD and the
other 10 cases exhibited high MVD (Table III, Fig.
4A and B). Conversely, in the 31 samples with moderate/strong
expression, 26 had low MVD, whereas the other five cases presented
with a low MVD count (Table III,
Fig. 4C-F). The results demonstrated
that REDD1 expression and MVD count were positively correlated in
OSCC samples (P<0.0001; r=0.7316; Fig. 4G). Furthermore, moderate or strong
REDD1 expression in tumors was significantly correlated with higher
MVD, compared with weak or negative REDD1 expression in tumors
(P<0.0001; Table III). These
results suggested that REDD1, as an upstream gene of MVD, may be
considered as a key regulatory checkpoint that could coordinate
vascular growth signaling inputs.
| Table III.Correlation between REDD1 expression
and MVD in 74 oral squamous cell carcinoma tissues. |
Table III.
Correlation between REDD1 expression
and MVD in 74 oral squamous cell carcinoma tissues.
|
|
| MVD |
|
|
|---|
|
|
|
|
|
|
|---|
| REDD1
expression | Groups (%) | ≤35 | >35 | r | P-value |
|---|
| Negative/weak
(0–3) | 43 (58.11) | 33 | 10 |
|
|
| Moderate/strong
(4–7) | 31 (41.89) | 5 | 26 | 0.7316 | <0.0001 |
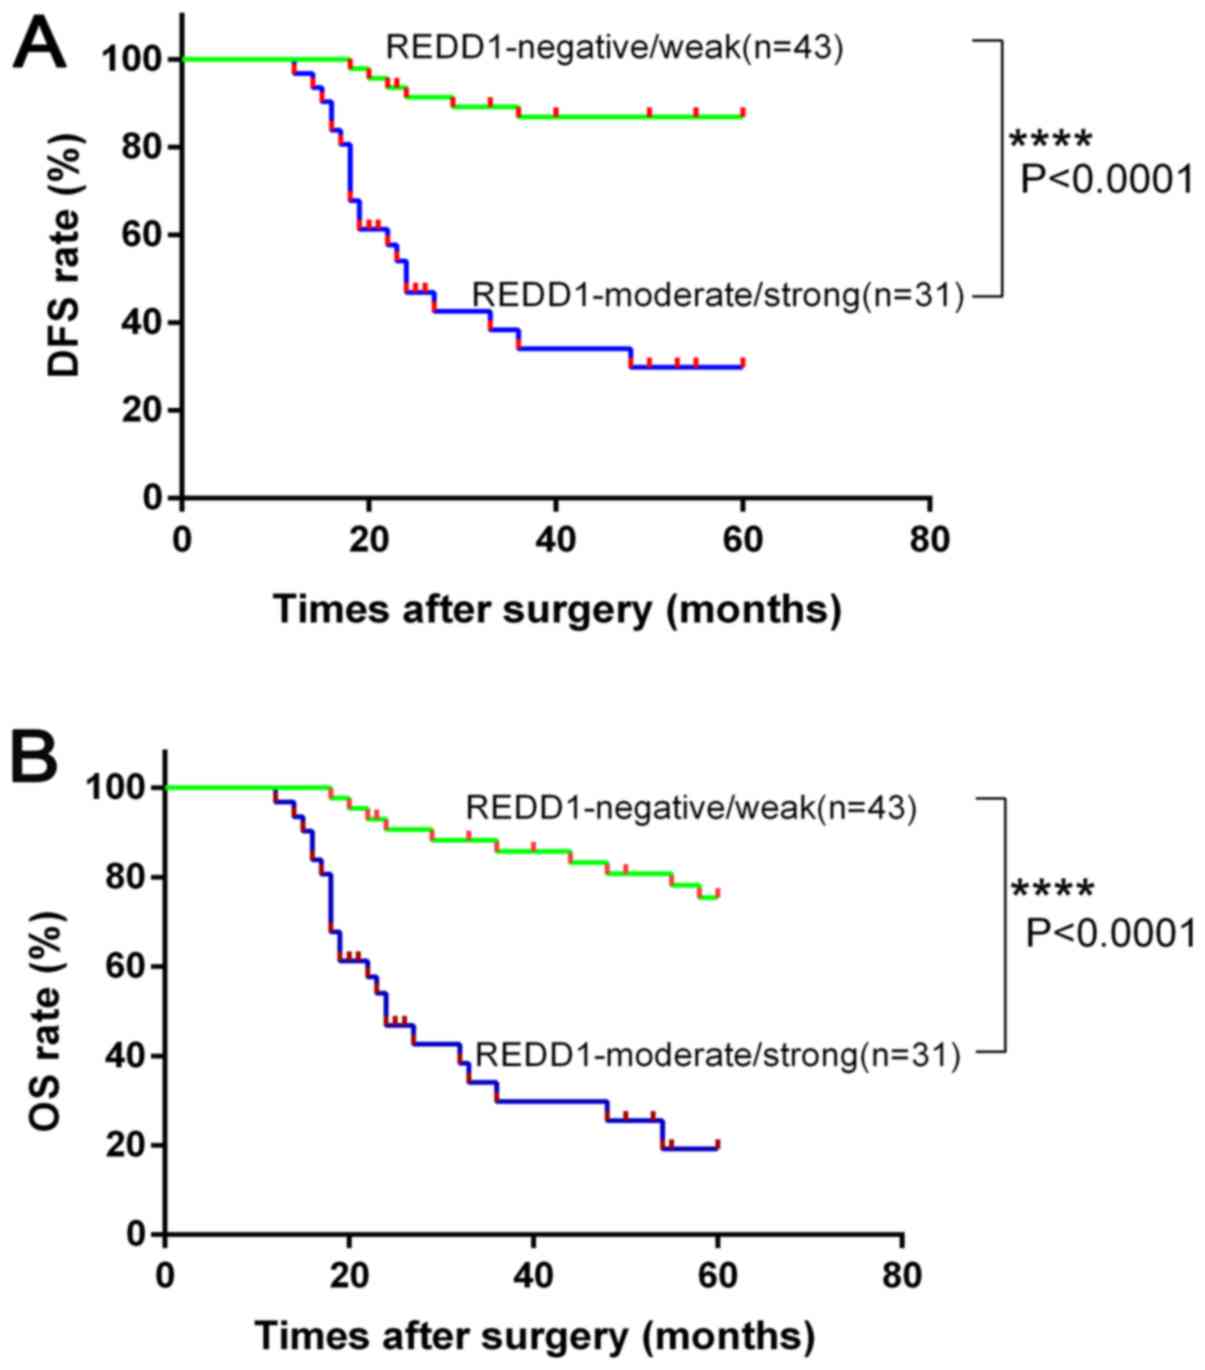
Kaplan-Meier analysis of disease-free
survival (DFS) and OS in patients with OSCC according to REDD1
expression
The results demonstrated that patients with
negative/weak REDD1 expression presented significantly increased
DFS and OS rates compared with patients with moderate/strong REDD1
expression (P<0.0001, respectively; Fig. 5A and B). REDD1 overexpression may
therefore serve as a biomarker for prognosis of patients with
OSCC.
Discussion
REDD1 protein is present at low level in most mature
tissues (18). Previous studies
reported that REDD1 could be a transforming oncogene in solid
cancer types, such as pancreatic, ovarian and breast cancer
(28–30). The results from the present study
demonstrated that REDD1 expression was significantly higher in OSCC
tissues compared with peritumoral mucosa. In addition, poorly
differentiated OSCC was associated with higher REDD1 expression,
whereas it was not the case for highly differentiated OSCC.
Furthermore, patients with high REDD1 expression had a more
advanced clinical stage, higher rate of lymphatic metastasis and
recurrence, and shorter DFS and OS. These results suggested that
REDD1 may function as an oncogene in OSCC, and that changes in
REDD1 expression may serve a role in oral carcinogenesis and OSCC
progression, which is consistent with findings from previous
studies in prostate cancer (31),
breast cancer (32) and ovarian
carcinoma (33). In addition, the
present study demonstrated that REDD1 expression in low grade OSCC
(G1) was lower than that in high grades (G2 and G3) OSCC, which was
consistent with previous studies reporting (32,33) that
REDD1 expression is reduced in certain slow-growing tumors,
including certain low-grade ovarian cancers (34).
Hypoxia is known to be present during tumor growth,
such as ovarian, colorectal, brain cancer and small cell lung
cancer (13,35), which is also the case in OSCC. Since
hypoxia and increased oxidative stress can induce REDD1
overexpression (18), REDD1 gene was
initially identified as a stress response gene. However, REDD1 was
subsequently confirmed to also be induced in response to
glucocorticoid treatment (36),
nutrient deprivation (37) and other
stress conditions (19,38,39).
Because one reason is that tumor growth occurs at a faster rate
than angiogenesis, hypoxia and nutrient deficiencies are known to
persist in the cancer microenvironment (35). Under continuous hypoxia, cancer cells
exhibit reduced oxidative metabolism and self-limiting energy
expenditure (13), which stimulates
REDD1 protein synthesis. In the present study, the results from IHC
demonstrated that high REDD1 expression was significantly
associated with increased MVD. This may be due to the fact that
angiogenesis occurs at a much slower rate than tumor growth, which
inevitably diminishes the blood supply to the tumor, resulting in
hypoxia and poor tumor nutrition, and increased REDD1 expression.
Conversely, hypoxia also leads to angiogenesis in tumors (35). Despite active angiogenesis, tumor
novel vessels are highly irregular and leaky and function poorly
(35). Even in the case of
vascular-rich tumors, these defective vascular properties induce
tumor ischemia, resulting in continued hypoxia that leads to stable
REDD1 expression (35), which is
another reason that hypoxia leads to REDD1 overexpression. This
phenomenon was also observed in the study, although MVD expression
was higher in the moderately and poorly differentiated OSCC tissues
and REDD1 expression was increased accordingly.
REDD1 is expressed in response to numerous stress
conditions and is also an important regulator of the response to a
number of transcription factors, including p53, p63, activating
transcription factor 4, Sp1 and HIF-1 (18,40,41).
Previous studies reported that REDD1 expression is upregulated in
numerous types of cancer, including ovarian cancer (33,34),
breast cancer (32), pancreatic
ductal adenocarcinoma (42) and
bladder urothelial carcinoma (43).
REDD1-mediated signaling abnormalities may also disrupt energy
homeostasis and regulation of tumorigenesis through multiple
pathways (31). Hypoxia-induced mTOR
regulation has been reported to be essential for the regulation of
HIF activity and the regulation of HIF-induced REDD1 (20). The HIF pathway is therefore
considered a master regulator of angiogenesis (35). However, to the best of our knowledge,
correlation between high REDD1 expression and angiogenesis has not
yet been investigated in OSCC. REDD1 activation can inhibit mTORC1
via TSC1/2, which acts as a negative regulator of mTORC1 activity
(31,43). Simultaneously, REDD1 can also inhibit
mTORC1 activity via the TSC1/2 complex in the H1299 lung cancer
cell line (44). Similarly, the
present study demonstrated that REDD1 expression was significantly
higher in OSCC samples compared with normal tissue and that MVD was
increased, indicating that HIF-inducible REDD1 may have a
regulatory role in hypoxic signaling in OSCC. These findings
suggested that mTORC1 inhibition may occur via the stable
expression of REDD1, which may promote angiogenesis by modulating
HIF transcription. Hypoxia and HIF activation have profound effects
on tumor biology, and HIF-1α and HIF-2α are associated with
numerous cancers, including cancers of the brain, breast, colon,
head and neck, liver, lung, skin and pancreas (5,45,46), for
which poor prognosis is associated with metastasis. The present
study highlighted the importance of REDD1 in the hypoxia-dependent
regulation of MVD. Further investigation on the association between
REDD1, mTOR and HIF-1α is therefore required. The results form this
study also indicated that, like hypoxia, REDD1 induction may
stimulate angiogenesis.
Defective angiogenesis and decrease in blood supply
cause increased tumor glycolysis (22,47).
Subsequently, cancer cells have a reduced oxidative metabolism and
initiate ATP protection by limiting protein synthesis, which is an
energy-consuming process (47,48).
These cells can therefore exhibit chemoresistance and
radioresistance, affecting the chemoradiosensitivity of the entire
tumor and further reducing the 5-year survival rate of patients
with cancer (49,50). Most patients with advanced OSCC need
chemoradiotherapy following surgery; however, REDD1 overexpression
may affect radiotherapy and chemotherapy efficacy. The findings
from the present study suggested that patients with OSCC and high
REDD1 expression may have a poor prognosis, be prone to recurrence,
would exhibit reduced sensitivity to postoperative
radiochemotherapy, as previously described (43,51,52).
This hypothesis will be further investigated in a future study.
Although the present study revealed that REDD1 overexpression
increases MVD in OSCC tissues, highly irregular, leaky and
dysfunctional blood vessels might not increase sensitivity to
chemotherapy and radiotherapy (35).
The present study demonstrated that patients with OSCC and high
REDD1 expression had poorer prognosis and shorter DFS and OS
compared with patients with low REDD1 expression, suggesting that
REDD1 expression may affect the 5-year survival of patients with
OSCC. Thus, it can be concluded that the upregulation of this
marker might predict poor survival in OSCC.
In conclusion, the present study demonstrated that
the expression of the mTORC1 inhibitor REDD1 was positively
correlated with tumor MVD. REDD1 may therefore be considered as a
key regulatory checkpoint that could coordinate vascular growth
signaling inputs. In addition, REDD1 overexpression may serve as a
biomarker of adverse prognosis in OSCC progression. REDD1, which is
a part of a network of signaling molecules comprising the mTOR
pathway, may also represent a novel therapeutic target that could
be used alone or in combination with other therapies targeting MVD,
in order to stop the development and progression of OSCC.
Supplementary Material
Supporting Data
Acknowledgements
The authors would like to thank Professor Qingjie
Wang (Institute of Basic Medical Sciences, Qilu Hospital, Shandong
University, Shandong, China) for his technical support during this
study.
Funding
This study was supported by the National Nature
Science Foundation of China (grant nos. 81702677, 81672606 and
81502340), the Natural Science Foundation of Shandong Province
(grant nos. ZR2016HM39 and ZR2014HQ012) and the Youth Foundation of
the Affiliated Hospital of Qingdao University (grant no.
201836).
Availability of data and material
The datasets used and analyzed during the current
study are available from the corresponding author on reasonable
request.
Authors' contributions
YF, KS and NW performed the experiments and wrote
the manuscript. WS, LC and BP participated in the design of the
study and collected data. CW and NW performed the analysis of the
patients' clinicopathological characteristics. All authors
contributed to the writing of the manuscript and approved the final
version.
Ethics approval and consent to
participate
All patients provided their full consent to
participate in the present study. This study was approved by the
Institutional Medical Ethics Committee of the Affiliated Hospital
of Qingdao University, and all procedures were performed in
accordance with the 1964 Helsinki declaration and its later
amendments or comparable ethical standards.
Patient consent for publication
Not applicable.
Competing interests
The authors declare that they have no competing
interests.
References
|
1
|
Pouysségur J, Dayan F and Mazure NM:
Hypoxia signalling in cancer and approaches to enforce tumour
regression. Nature. 441:437–443. 2006. View Article : Google Scholar : PubMed/NCBI
|
|
2
|
Gatenby RA and Gillies RJ: Why do cancers
have high aerobic glycolysis? Nat Rev Cancer. 4:891–899. 2004.
View Article : Google Scholar : PubMed/NCBI
|
|
3
|
Isa AY, Ward TH, West CM, Slevin NJ and
Homer JJ: Hypoxia in head and neck cancer. Br J Radiol. 79:791–798.
2006. View Article : Google Scholar : PubMed/NCBI
|
|
4
|
Janssen HL, Haustermans KM, Balm AJ and
Begg AC: Hypoxia in head and neck cancer: How much, how important?
Head Neck. 27:622–638. 2005. View Article : Google Scholar : PubMed/NCBI
|
|
5
|
Göttgens EL, Ostheimer C, Span PN, Bussink
J and Hammond EM: HPV, hypoxia and radiation response in head and
neck cancer. Br J Radiol. 14:201800472018.
|
|
6
|
Bredell MG, Ernst J, El-Kochairi I, Dahlem
Y, Ikenberg K and Schumann DM: Current relevance of hypoxia in head
and neck cancer. Oncotarget. 7:50781–50804. 2016. View Article : Google Scholar : PubMed/NCBI
|
|
7
|
Kishimoto K, Yoshida S, Ibaragi S,
Yoshioka N, Okui T, Hu GF and Sasaki A: Hypoxia-induced
up-regulation of angiogenin, besides VEGF, is related to
progression of oral cancer. Oral Oncol. 48:1120–1127. 2012.
View Article : Google Scholar : PubMed/NCBI
|
|
8
|
Brennan PA, Mackenzie N and Quintero M:
Hypoxia-inducible factor 1alpha in oral cancer. J Oral Pathol Med.
34:385–389. 2005. View Article : Google Scholar : PubMed/NCBI
|
|
9
|
Sano D and Myers JN: Metastasis of
squamous cell carcinoma of the oral tongue. Cancer Metastasis Rev.
26:645–662. 2007. View Article : Google Scholar : PubMed/NCBI
|
|
10
|
Siegel RL, Miller KD and Jemal A: Cancer
statistics, 2018. CA Cancer J Clin. 68:7–30. 2018. View Article : Google Scholar : PubMed/NCBI
|
|
11
|
Ghani WMN, Ramanathan A, Prime SS, Yang
YH, Razak IA, Abdul Rahman ZA, Abraham MT, Mustafa WMW, Tay KK,
Kallarakkal TG, et al: Survival of oral cancer patients in
different ethnicities. Cancer Invest. 37:275–287. 2019. View Article : Google Scholar : PubMed/NCBI
|
|
12
|
Muñoz-Guerra MF, Fernández-Contreras ME,
Moreno AL, Martin ID, Herráez B and Gamallo C: Polymorphisms in the
hypoxia inducible factor 1-alpha and the impact on the prognosis of
early stages of oral cancer. Ann Surg Oncol. 16:2351–2358. 2009.
View Article : Google Scholar : PubMed/NCBI
|
|
13
|
Liu L, Cash TP, Jones RG, Keith B,
Thompson CB and Simon MC: Hypoxia-induced energy stress regulates
mRNA translation and cell growth. Mol Cell. 21:521–531. 2006.
View Article : Google Scholar : PubMed/NCBI
|
|
14
|
Arsham AM, Howell JJ and Simon MC: A novel
hypoxia-inducible factor-independent hypoxic response regulating
mammalian target of rapamycin and its targets. J Biol Chem.
278:29655–29660. 2003. View Article : Google Scholar : PubMed/NCBI
|
|
15
|
Foster KG and Fingar DC: Mammalian target
of rapamycin (mTOR): Conducting the cellular signaling symphony. J
Biol Chem. 285:14071–14077. 2010. View Article : Google Scholar : PubMed/NCBI
|
|
16
|
Ma XM and Blenis J: Molecular mechanisms
of mTOR-mediated translational control. Nat Rev Mol Cell Biol.
10:307–318. 2009. View
Article : Google Scholar : PubMed/NCBI
|
|
17
|
Corradetti MN, Inoki K and Guan KL: The
stress-inducted proteins RTP801 and RTP801L are negative regulators
of the mammalian target of rapamycin pathway. J Biol Chem.
280:9769–9772. 2005. View Article : Google Scholar : PubMed/NCBI
|
|
18
|
Ellisen LW, Ramsayer KD, Johannessen CM,
Yang A, Beppu H, Minda K, Oliner JD, McKeon F and Haber DA: REDD1,
a developmentally regulated transcriptional target of p63 and p53,
links p63 to regulation of reactive oxygen species. Mol Cell.
10:995–1005. 2002. View Article : Google Scholar : PubMed/NCBI
|
|
19
|
Sofer A, Lei K, Johannessen CM and Ellisen
LW: Regulation of mTOR and cell growth in response to energy stress
by REDD1. Mol Cell Biol. 25:5834–5845. 2005. View Article : Google Scholar : PubMed/NCBI
|
|
20
|
Brugarolas J, Lei K, Hurley RL, Manning
BD, Reiling JH, Hafen E, Witters LA, Ellisen LW and Kaelin WG Jr:
Regulation of mTOR function in response to hypoxia by REDD1 and the
TSC1/TSC2 tumor suppressor complex. Genes Dev. 18:2893–2904. 2004.
View Article : Google Scholar : PubMed/NCBI
|
|
21
|
Adel E, John C, Jennifert G, Takashi T and
Pieter S: WHO classification of head and neck tumoursIARC Press;
Lyon: pp. 105–131. 2017, PubMed/NCBI
|
|
22
|
National Comprehensive Cancer Network
(NCCN), . NCCN clinical practice guidelines in oncology-Head and
Neck cancers. NCCN Org. Version 2. 2018.
|
|
23
|
Wang N, Wang Q, Chi J, Xiang F, Lin M,
Wang W, Wei F and Feng Y: Carcinoembryonic antigen cell adhesion
molecule 1 inhibits the antitumor effect of neutrophils in tongue
squamous cell carcinoma. Cancer Sci. 110:519–529. 2019. View Article : Google Scholar : PubMed/NCBI
|
|
24
|
Wang N, Wang QJ, Feng YY, Shang W and Cai
M: Overexpression of chemerin was associated with tumor
angiogenesis and poor clinical outcome in squamous cell carcinoma
of the oral tongue. Clin Oral Investig. 18:997–1004. 2014.
View Article : Google Scholar : PubMed/NCBI
|
|
25
|
Livak KJ and Schmittgen TD: Analysis of
relative gene expression data using real-time quantitative PCR and
the 2(-Delta Delta C(T)) method. Methods. 25:402–408. 2001.
View Article : Google Scholar : PubMed/NCBI
|
|
26
|
Wang N, Feng Y, Wang Q, Liu S, Xiang L,
Sun M, Zhang X, Liu G, Qu X and Wei F: Neutrophils infiltration in
the tongue squamous cell carcinoma and its correlation with CEACAM1
expression on tumor cells. PLoS One. 9:e899912014. View Article : Google Scholar : PubMed/NCBI
|
|
27
|
Weidner N, Semple JP, Welch WR and Folkman
J: Tumor angiogenesis and metastasis-correlation in invasive breast
carcinoma. N Engl J Med. 324:1–8. 1991. View Article : Google Scholar : PubMed/NCBI
|
|
28
|
Hu MY, Huang PL, Ma Y, Ling SK, Li Y, Chen
BA and Xu YS: Effect of Redd1 loss on proliferation and metastasis
of pancreatic cancer cells with KrasG12D-LOH by inhibiting
glycolysis. J Clin Oncol (suppl). 35:2017.DOI:
10.1200/JCO.2017.35.15_suppl.e1574.
|
|
29
|
Dennis MD, McGhee NK, Jefferson LS and
Kimball SR: Regulated in DNA damage and development 1 (REDD1)
promotes cell survival during serum deprivation by sustaining
repression of signaling through the mechanistic target of rapamycin
in complex 1 (mTORC1). Cell Signal. 25:2709–2716. 2013. View Article : Google Scholar : PubMed/NCBI
|
|
30
|
Chang B, Liu GZ, Yang G, Mercado-Uribe I,
Huang M and Liu J: REDD1 is required for RAS-mediated
transformation of human ovarian epithelial cells. Cell Cycle.
8:780–786. 2009. View Article : Google Scholar : PubMed/NCBI
|
|
31
|
DeYoung MP, Horak P, Sofer A, Sgroi D and
Ellisen LW: Hypoxia regulates TSC1/2-mTOR signaling and tumor
suppression through REDD1-mediated 14-3-3 shuttling. Gene Dev.
22:239–251. 2008. View Article : Google Scholar : PubMed/NCBI
|
|
32
|
Yun SM, Woo SH, Oh ST, Hong SE, Choe TB,
Ye SK, Kim EK, Seong MK, Kim HA, Noh WC, et al: Melatonin enhances
arsenic trioxide-induced cell death via sustained upregulation of
Redd1 expression in breast cancer cells. Mol Cell Endocrinol.
422:64–73. 2016. View Article : Google Scholar : PubMed/NCBI
|
|
33
|
Chang B, Meng J, Zhu H, Du X, Sun L, Wang
L, Li S and Yang G: Overexpression of the recently identified
oncogene REDD1 correlates with tumor progression and is an
independent unfavorable prognostic factor for ovarian carcinoma.
Diagn Pathol. 13:872018. View Article : Google Scholar : PubMed/NCBI
|
|
34
|
Jia W, Chang B, Sun L, Zhu H, Pang L, Tao
L, Zou H, Du J, Dong Y, Qi Y, et al: REDD1 and p-AKT
over-expression may predict poor prognosis in ovarian cancer. Int J
Clin Exp Pathol. 7:5940–5949. 2014.PubMed/NCBI
|
|
35
|
Krock BL, Skuli N and Simon MC:
Hypoxia-induced angiogenesis: Good and evil. Genes Cancer.
2:1117–1133. 2011. View Article : Google Scholar : PubMed/NCBI
|
|
36
|
Wang H, Kubica N, Ellisen LW, Jefferson LS
and Kimball SR: Dexamethasone represses signaling through the
mammalian target of rapamycin in muscle cells by enhancing
expression of REDD1. J Biol Chem. 281:39128–39134. 2006. View Article : Google Scholar : PubMed/NCBI
|
|
37
|
McGhee NK, Jefferson LS and Kimball SR:
Elevated corticosterone associated with food deprivation
upregulates expression in rat skeletal muscle of the mTORC1
repressor, REDD1. J Nutr. 139:828–834. 2009. View Article : Google Scholar : PubMed/NCBI
|
|
38
|
Li XH, Ha CT, Fu D and Xiao M: REDD1
protects osteoblast cells from gamma radiation-induced premature
senescence. PLoS One. 7:e366042012. View Article : Google Scholar : PubMed/NCBI
|
|
39
|
Shoshani T, Faerman A, Mett I, Zelin E,
Tenne T, Gorodin S, Moshel Y, Elbaz S, Budanov A, Chajut A, et al:
Identification of a novel hypoxia-inducible factor 1-responsive
gene, RTP801, involved in apoptosis. Mol Cell Biol. 22:2283–2293.
2002. View Article : Google Scholar : PubMed/NCBI
|
|
40
|
Whitney ML, Jefferson LS and Kimball SR:
ATF4 is necessary and sufficient for ER stress-induced upregulation
of REDD1 expression. Biochem Biophys Res Commun. 379:451–455. 2009.
View Article : Google Scholar : PubMed/NCBI
|
|
41
|
Lee M, Bikram M, Oh S, Bull DA and Kim SW:
Sp1-dependent regulation of the RTP801 promoter and its application
to hypoxia-inducible VEGF plasmid for ischemic disease. Pharm Res.
21:736–741. 2004. View Article : Google Scholar : PubMed/NCBI
|
|
42
|
Shen X, Chang LG, Hu MY, Yan D, Zhou LN,
Ma Y, Ling SK, Fu YQ, Zhang SY, Kong B and Huang PL: KrasG12D-LOH
promotes malignant biological behavior and energy metabolism of
pancreatic ductal adenocarcinoma cells through the mTOR signaling
pathway. Neoplasma. 65:81–88. 2018. View Article : Google Scholar : PubMed/NCBI
|
|
43
|
Zeng Q, Liu J, Cao P, Li J, Liu X, Fan X,
Liu L, Cheng Y, Xiong W, Li J, et al: Inhibition of REDD1
sensitizes bladder urothelial carcinoma to paclitaxel by inhibiting
autophagy. Clin Cancer Res. 24:445–459. 2018. View Article : Google Scholar : PubMed/NCBI
|
|
44
|
Jin HO, Hong SE, Kim JH, Choi HN, Kim K,
An S, Choe TB, Hwang CS, Lee JH, Kim JI, et al: Sustained
overexpression of Redd1 leads to Akt activation involved in cell
survival. Cancer Lett. 336:319–324. 2013. View Article : Google Scholar : PubMed/NCBI
|
|
45
|
Gong J, Zhou S and Yang S: Vanillic acid
suppresses HIF-1α expression via inhibition of mTOR/p70S6K/4E-BP1
and Raf/MEK/ERK pathways in human colon cancer HCT116 cells. Int J
Mol Sci. 20(pii): E4652019. View Article : Google Scholar : PubMed/NCBI
|
|
46
|
Tong WW, Tong GH and Liu Y: Cancer stem
cells and hypoxia-inducible factors (Review). Int J Oncol.
53:469–476. 2018.PubMed/NCBI
|
|
47
|
Ostergaard L, Tietze A, Nielsen T, Drasbek
KR, Mouridsen K, Jespersen SN and Horsman MR: The relationship
between tumor blood flow, angiogenesis, tumor hypoxia and aerobic
glycolysis. Cancer Res. 73:5618–5624. 2013. View Article : Google Scholar : PubMed/NCBI
|
|
48
|
Ma T, Patel H, Babapoor-Farrokhran S,
Franklin R, Semenza GL, Sodhi A and Montaner S: KSHV induces
aerobic glycolysis and angiogenesis through HIF-1-dependent
upregulation of pyruvate kinase 2 in Kaposi's sarcoma.
Angiogenesis. 18:477–488. 2015. View Article : Google Scholar : PubMed/NCBI
|
|
49
|
Steinbichler TB, Alshaimaa A, Maria MV,
Daniel D, Herbert R, Jozsef D and Ira-Ida S: Epithelial-mesenchymal
crosstalk induces radioresistance in HNSCC cells. Oncotarget.
9:3641–3652. 2017.PubMed/NCBI
|
|
50
|
Chan N, Koritzinsky M, Zhao H, Bindra R,
Glazer PM, Powell S, Belmaaza A, Wouters B and Bristow RG: Chronic
hypoxia decreases synthesis of homologous recombination proteins to
offset chemoresistance and radioresistance. Cancer Res. 68:605–614.
2008. View Article : Google Scholar : PubMed/NCBI
|
|
51
|
Clavo B, Robaina F, Fiuza D, Ruiz A,
Lloret M, Rey-Baltar D, Llontop P, Riveros A, Rivero J, Castañeda
F, et al: Predictive value of hypoxia in advanced head and neck
cancer after treatment with hyperfractionated radio-chemotherapy
and hypoxia modification. Clin Transl Oncol. 19:419–424. 2017.
View Article : Google Scholar : PubMed/NCBI
|
|
52
|
Carden CP, Stewart A, Thavasu P, Kipps E,
Pope L, Crespo M, Miranda S, Attard G, Garrett MD, Clarke PA, et
al: The association of PI3 kinase signaling and chemoresistance in
advanced ovarian cancer. Mol Cancer Ther. 11:1609–1617. 2012.
View Article : Google Scholar : PubMed/NCBI
|