Introduction
Hepatocellular carcinoma (HCC) is a major type of
primary liver cancer (1). The
mortality rate is increasing, and patients with the tumor present
with a poor prognosis (2). An
increasing number of studies have demonstrated that vascular
invasion is an adverse prognostic factor in HCC (3–5).
Furthermore, vascular invasion is an independent predictive factor
of long-term survival in patients with early-stage HCC, and is
significantly associated with intrahepatic metastasis (6). Hence, it is extremely necessary to
differentiate patients with HCC that present with vascular invasion
from those patients with HCC that do not present with vascular
invasion, so as to improve survival time.
A risk classification model of micro-vascular
invasion based on histopathological features has been introduced
for predicting the prognosis of patients with HCC (7). Differentially expressed genes (DEGs) in
HCC tissue samples in the presence or absence of vascular invasion
have been studied in order to extract multi-gene signatures for
detecting vascular invasion (8,9).
High-throughput technologies allow for the development of a
classification model, wherein vascular invasion information can be
derived from molecular features. The Cancer Genome Atlas (TCGA)
provides comprehensive maps of genomic alterations in various types
of cancer (https://portal.gdc.cancer.gov/). A recent study
derived a 16-miRNA-based classifier from the analysis of micro
(mi)RNA and mRNA expression data derived from TCGA, which could
effectively identify vascular invasion and predict overall survival
(OS) (10). These studies indicated
the feasibility of these multi-gene signatures for prediction of
cancer prognosis. Nevertheless, more efforts should be made in
order to generate more reliable and accurate prognostic models
based on feature genes of vascular invasion.
The present study analyzed HCC RNA-sequencing data
from TCGA in order to identify feature genes using a recursive
feature elimination (RFE) method (11), thus constructing a support vector
machine (SVM) classifier for separating patients with vascular
invasion from patients without vascular invasion. Furthermore, L1
penalized (LASSO) Cox proportional hazards (PH) regression model
was used to determine prognostic genes from the identified feature
genes of vascular invasion so as to develop a prognostic scoring
model. The performance of the classifier and the prognostic model
was tested on an independent set. In addition, a function analysis
was performed in order to provide further insights into the
molecular mechanisms underlying HCC.
Materials and methods
Data resource
The present study obtained the RNA- sequencing data
of 373 HCC samples from TCGA portal based on Illumina HiSeq 2000
RNA Sequencing platform (Download date: 18th, October, 2018). Among
these samples, 292 had clinical information of vascular invasion
and survival information, including survival time and survival
status, and were therefore selected as the training set (TCGA set).
Furthermore, the GSE10141 (12)
dataset was downloaded from Gene Expression Omnibus (GEO;
http://www.ncbi.nlm.nih.gov/geo/) at the
National Center for Biotechnology Information (NCBI; http://www.ncbi.nlm.nih.gov/) based on the GPL5474
Human 6k Transcriptionally Informative Gene Panel platform,
including the microarray gene expression data of 80 HCC tissue
samples with survival information. Only 62 HCC samples had vascular
invasion, and these were selected as the validation set.
The present study performed uni- and multivariate
Cox regression analyses in order to analyze the associations
between clinical factors and OS in the training set using survival
package v2.44-1.1 (13) of R
language (http://bioconductor.org/packages/survivalr/). The
significant clinical factors (log-rank P<0.05) were selected as
the cut-off to classify the training set.
Differential expression analysis
Data from the TCGA and GEO databases were normalized
using R software (version 3.4.1; http://www.r-project.org/). Following data
normalization, the present study performed a differential gene
expression analysis using HCC samples with and without vascular
invasion in the training set using the limma (14) package (version 3.34.7; http://bioconductor.org/packages/release/bioc/html/limma.html)
of R software. The genes with false discovery rate (FDR) <0.05
and |log2 FC|>0.263 were selected and subsequently underwent a
two-way hierarchical clustering analysis based on centered pearson
correlation (15) algorithm using
pheatmap package (16) (version
1.0.8) of R language (version 3.34.7). The results were presented
in a heatmap.
Development of an SVM classifier
The present study initially performed a Cox
regression analysis to investigate the associations between the
identified DEGs and OS. From the significant DEGs with log-rank
P<0.05, the present study then identified the optimal
combination of feature genes using an RFE (17) algorithm in the caret (18) package (version 6.0–79; https://cran.r-project.org/web/packages/caret) of R
language, which was then used to develop an SVM classifier using
the SVM (19) function with a
sigmoid kernel.
In both the training set and the validation set, the
robustness of the established SVM classifier was evaluated using
concordance index (C-index) (20),
Brier score (21), log-rank P-value
of cox-PH regression, sensitivity, specificity, positive predictive
value (PPV), negative predictive value (NPV) and area under
receiver operating characteristic curve (AUROC). C-index and Brier
score was calculated using the survcomp version 3.9 (22) package (http://www.bioconductor.org/packages/release/bioc/html/survcomp.html)
of R language (version 3.4.1), which are two metrics for assessing
accuracy. Kaplan-Meier estimate was applied to depict survival time
using the survival package in R language. The Log-rank P-value for
the difference in OS time between the two groups was calculated.
AUROC ranged from 0.5 to 1, with a higher value implying better
performance. Sensitivity, specificity, PPV and NPV of ROC curves
were computed using pROC v1.15.3 (23) package of R language (https://cran.r-project.org/web/packages/pROC/index.html).
Development and validation of a
prognostic scoring model
The present study further utilized the feature genes
to fit a LASSO Cox-PH regression model (24) in order to determine the optimal panel
of genes for prognosis using the penalized package (v0.9-51) of R
language. Based on Cox-PH regression coefficients and expression
levels of the identified optimal genes, a prognostic scoring model
was built using the following formula:
Riskscore=∑coefDEGsxExpDEGs
CoefDEGs represents Cox-PH regression
coefficients of DEGs; ExpDEGs represents expression
levels of DEGs.
Risk score was calculated for each sample in the
training set. Samples in the training set were then split into a
high-risk group and a low-risk group according to median risk score
(0.0663803). Kaplan-Meier survival curves were plotted for both
risk groups using survival package (version 2.41-1) of R language,
and OS of the two groups was compared by log-rank test. Similarly,
samples in the validation set were divided into a high-risk group
and a low-risk group using the median risk score of the validation
set (0.132434) so as to test the prognostic ability of the
prognostic scoring model in this set. The present study further
validated the results by using SurvExpress, which is an online
biomarker validation tool for cancer gene expression data (25). A total of four datasets, including
GSE10143 (12), GSE10186 (26), TCGA-Liver-cancer and LIHC-TCGA-Liver
HCC were included into SurvExpress.
Stratified analysis
In both the high and low-risk groups of the training
set, the present study investigated the associations between
clinical factors and OS by performing a Cox regression analysis
with the survival package in R language (version 2.41-1).
Functional analysis
The cases in the training set were divided into
high- and low-risk groups according to the risk score of the gene
signature. The present study then screened for DEGs in the two risk
groups using a strict cut-off at FDR<0.05 and
|log2FC|>0.263. The signficant DEGs were selected for
the pathway enrichment analysis using Gene Set Enrichment Analysis
(27) (GSEA, version 3.0; http://software.broadinstitute.org/gsea/index.jsp).
P<0.05 was considered to indicate a statistically significant
result.
Results
Vascular invasion is an independent
predictor of prognosis
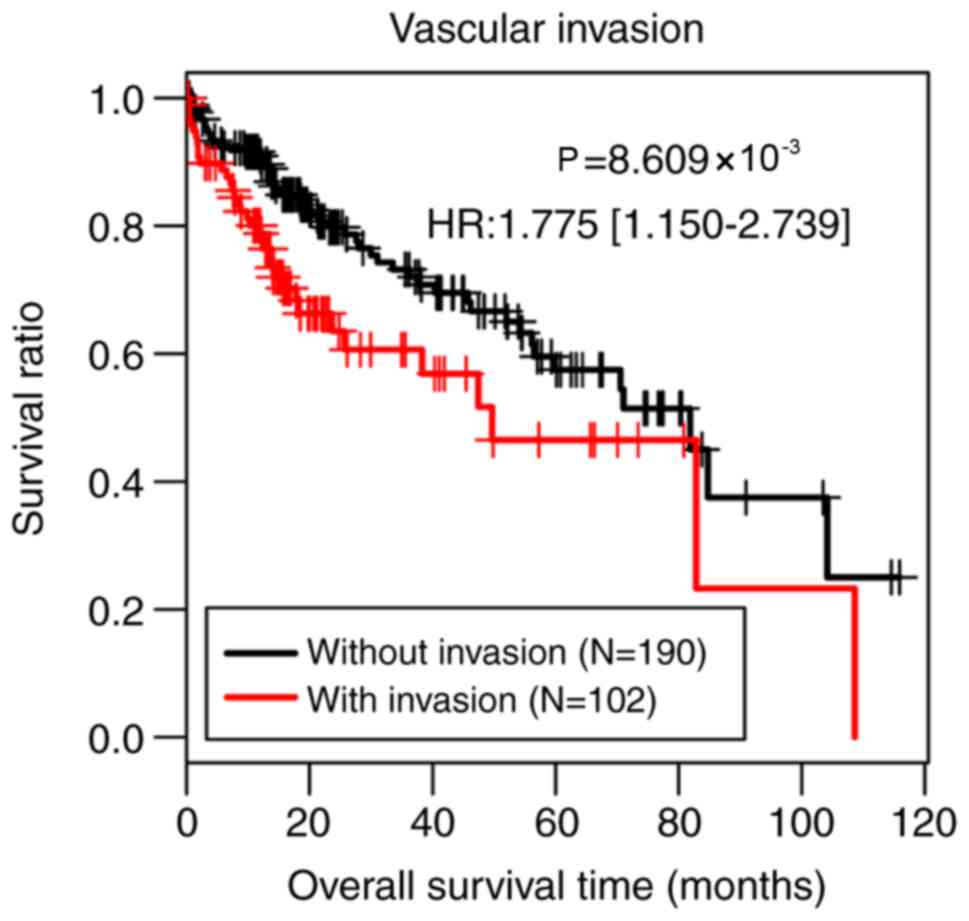
The present study performed uni- and multivariate
Cox regression analyses in order to analyze the associations
between clinical factors and OS in the training set using the
survival package in R language. As presented in Table I, vascular invasion and pathological
M stage (28) were identified as
independent predictors of prognosis in the univariate and
multivariate analysis (P<0.05). However, there were only three
samples at pathological M1 stage, which was an insufficient amount
for accurately assessing prognostic value of pathological M stage.
Therefore, the present study classified all samples of the training
set into two groups according to vascular invasion. Patients
without vascular invasion (n=190) had significantly better survival
time compared with patients with vascular invasion (n=102;
P=8.609×10⁻³; Fig.
1).
 | Table I.Uni-and multivariate Cox regression
analysis of the training set. |
Table I.
Uni-and multivariate Cox regression
analysis of the training set.
|
|
| Uni-variable
cox | Multi-variable
cox |
|---|
|
|
|
|
|
|---|
| Clinical
characteristics | TCGA (n=292) | HR (95% CI) | P-value | HR (95% CI) | P-value |
|---|
| Age, years, mean ±
SD | 59.85±12.92 | 1.017
(0.999–1.035) | 0.051 | – | – |
| sex
(male/female) | 194/98 | 0.731
(0.474–1.127) | 0.154 | – | – |
| Pathological M
(M0/M1/-) (28) | 220/3/69 | 4.91
(1.523–15.84) | 0.003 | 3.848
(1.089–13.588) | 0.036 |
| Pathological N
(N0/N1/-) | 210/2/80 | 1.602
(0.221–2.610) | 0.638 | – | – |
| Pathological T
(T1/T2/T3/T4/-) | 160/75/48/8/1 | 1.538
(1.23–1.923) | <0.001 | 0.607
(0.217–1.699) | 0.342 |
| Pathological stage
(I/II/III/IV/-) | 150/72/48/4/18 | 1.473
(1.153–1.881) | 0.003 | 2.177
(0.797–5.944) | 0.129 |
| Histological grade
(G1/G2/G3/G4/-) |
36/141/101/12/2 | 1.19
(0.889–1.593) | 0.243 | – | – |
| Virus infection
(HBV/HCV/Mixed/-) | 50/10/35/197 | 1.167
(0.801–1.702) | 0.420 | – | – |
| Vascular invasion
(yes/no) | 102/190 | 1.353
(1.087–2.098) | 0.009 | 1.678
(1.195–2.962) | 0.037 |
| Recurrence
(yes/no/-) | 119/156/17 | 1.343
(0.843–2.141) | 0.213 | – | – |
| Status
(dead/alive) | 87/205 | – | – | – | – |
| Overall survival
time, months, mean ± SD | 26.52±24.43 | – | – | – | – |
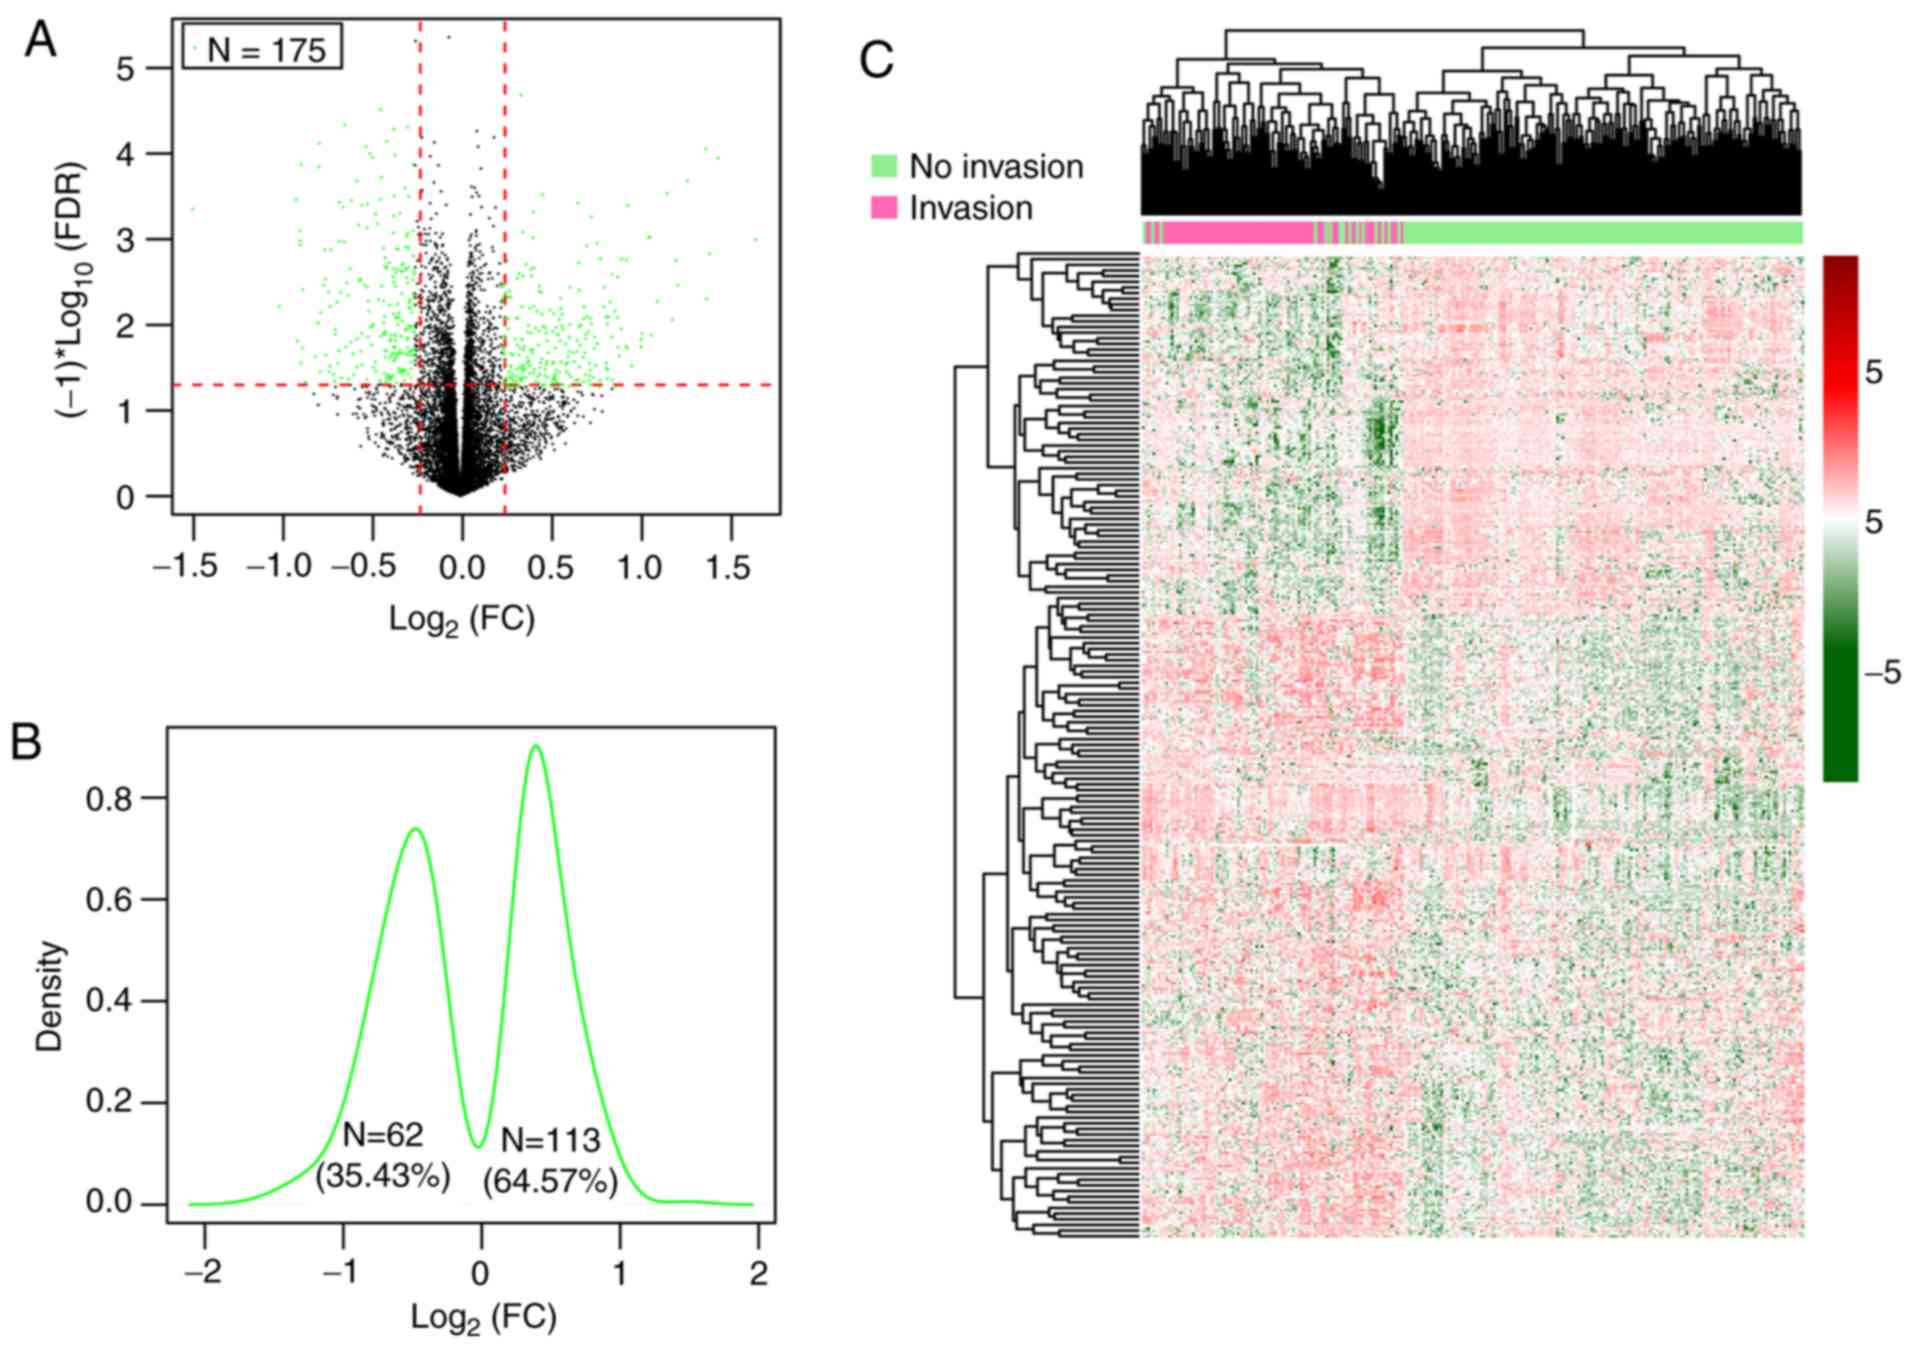
DEGs were screened between patients
with and without vascular invasion
Following the removal of genes with a median
expression level of 0, a total of 13,812 genes were inputted into
the Limma package and among them, 175 significant DEGs in patients
both with and without vascular invasion in the training set that
satisfied the cut-off threshold (FDR<0.05 and |log2FC|>0.263)
were identified (Table SI),
consisting of 62 (35.43%) downregulated genes and 113 (64.57%)
upregulated genes in the HCC samples with vascular invasion
(Fig. 2A-C).
SVM analysis
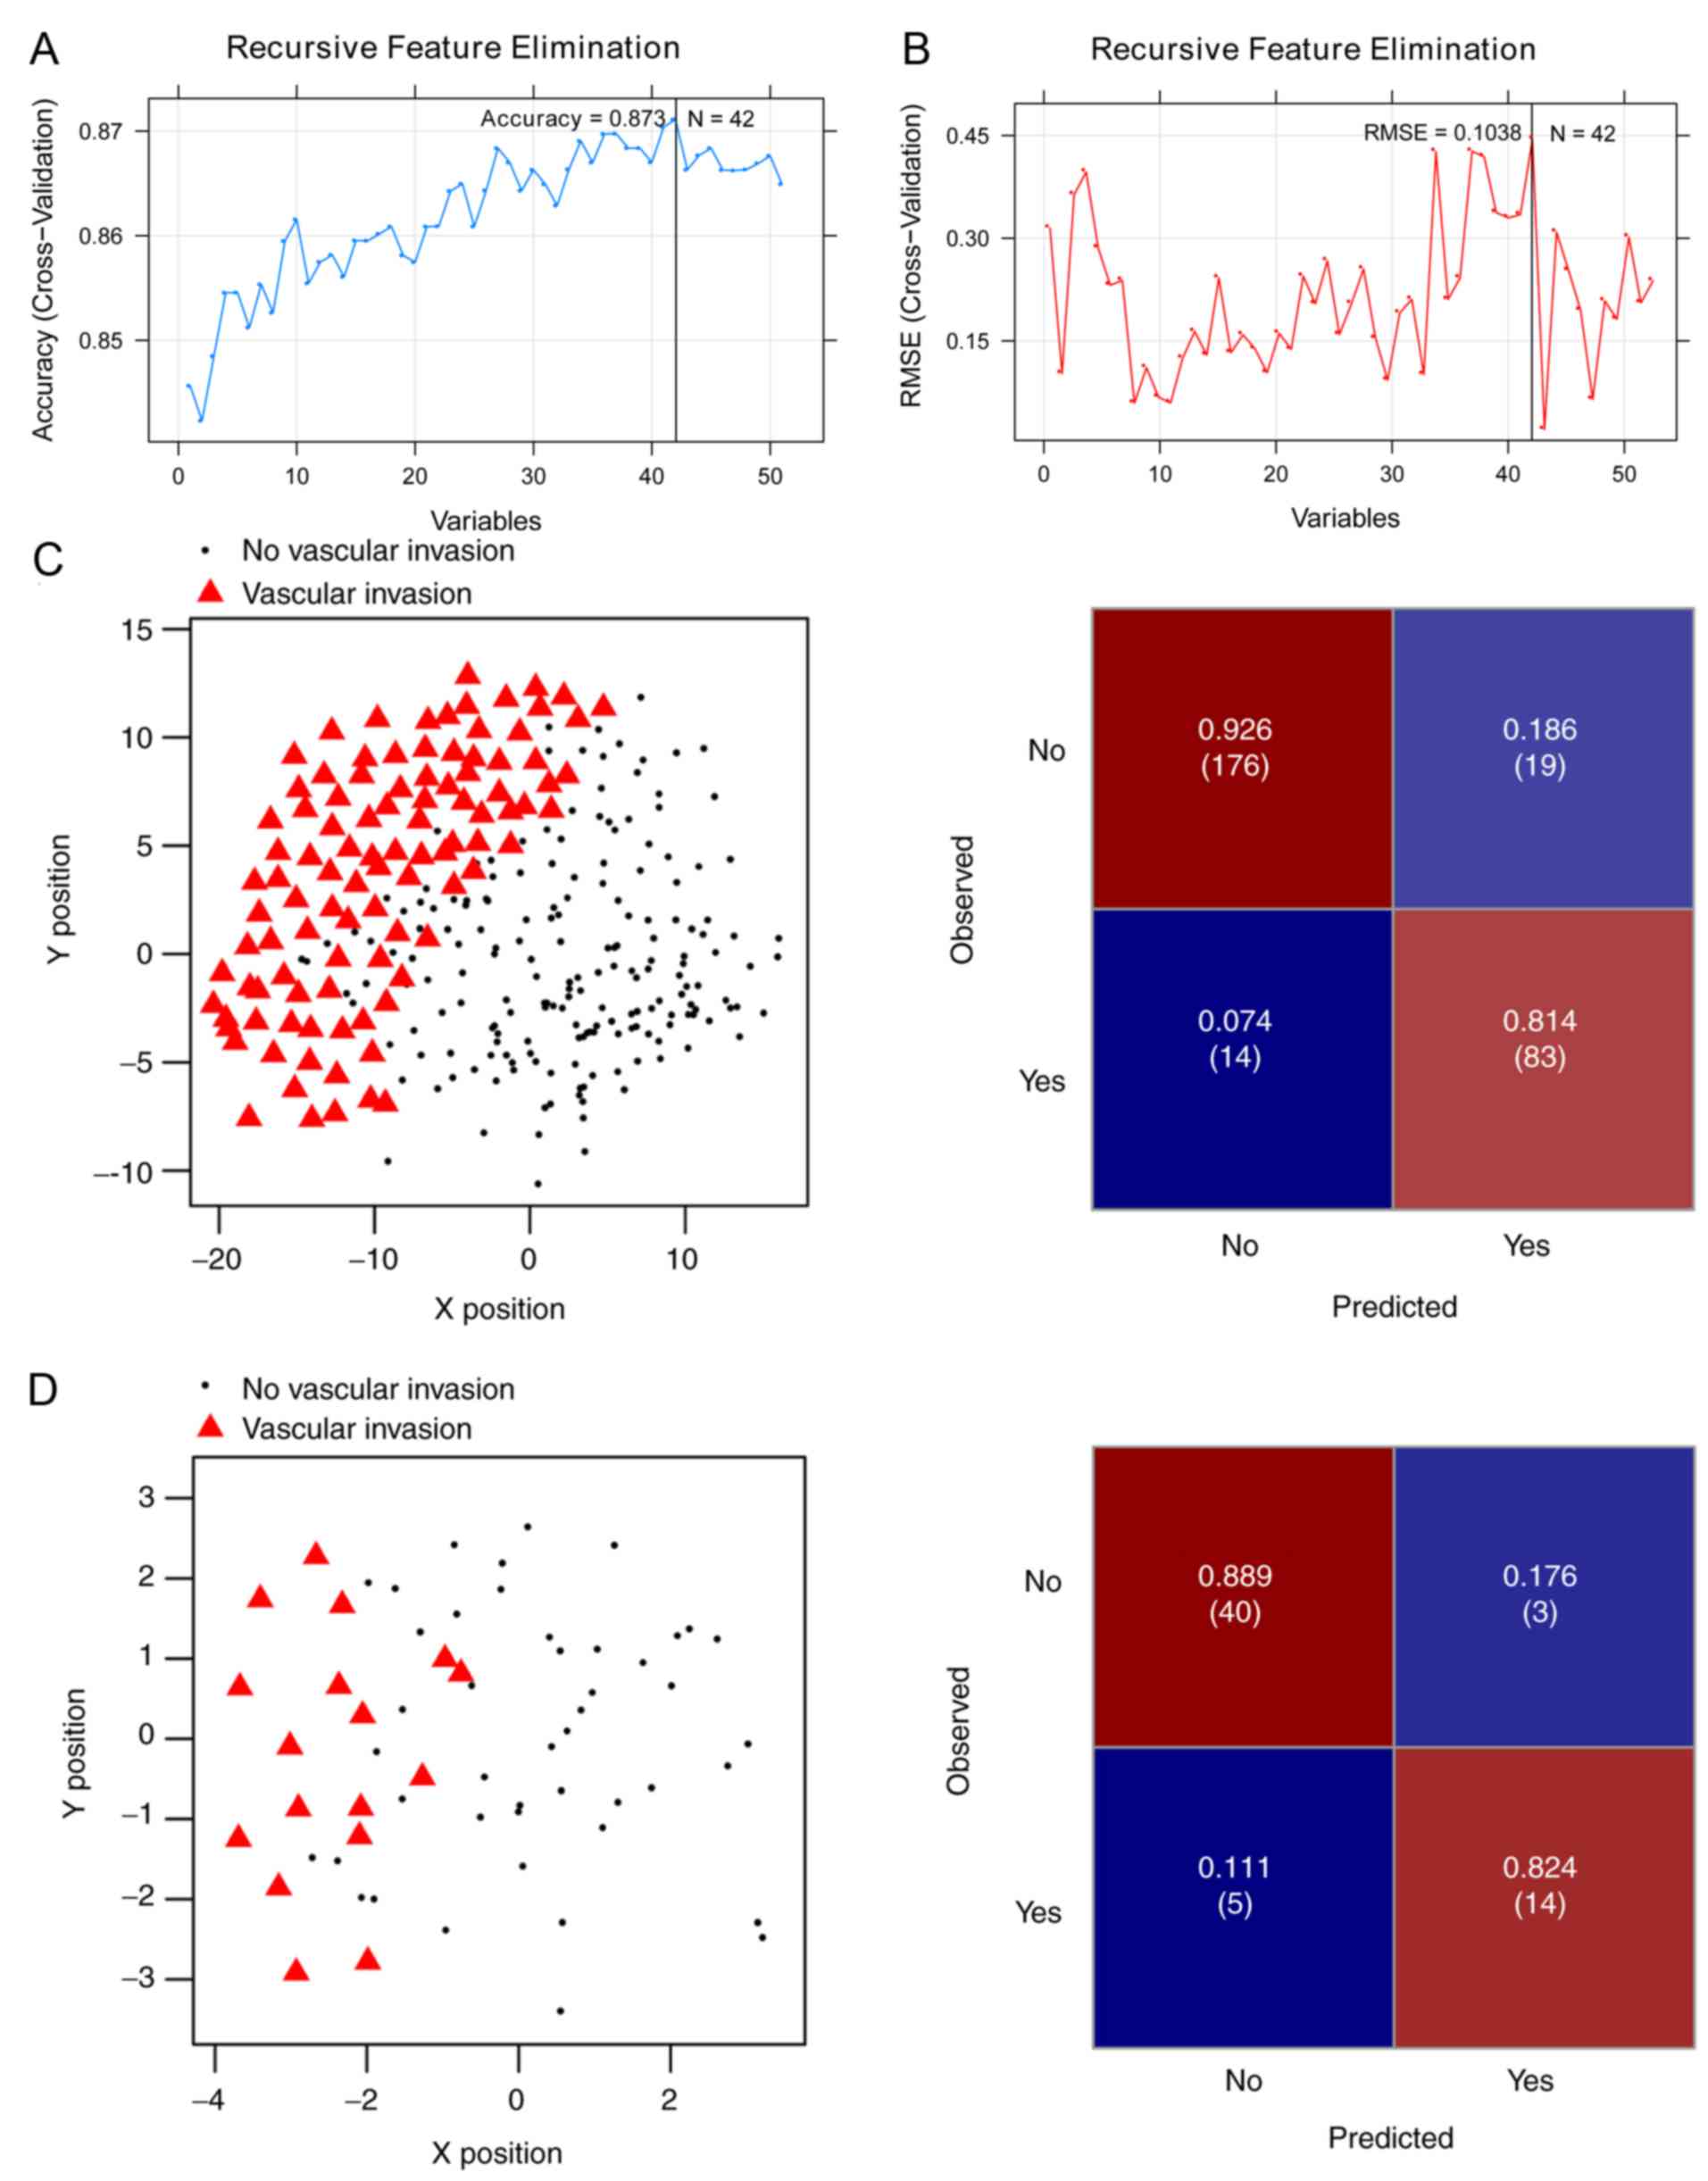
Of the aforementioned 175 DEGs, 51 were
significantly associated with OS (log-rank P<0.05) in the Cox
regression analysis (Table SII).
For the purpose of obtaining the optimal feature genes for
predicting vascular invasion in HCC, the present study utilized an
SVM-RFE algorithm based on the 51 prognosis-associated genes.
Maximal prediction accuracy (0.873) (Fig. 3A) and minimal root-mean-square error
(0.1038) (Fig. 3B) were reached when
using a 42-gene combination (Table
II).
| Table II.Combination of 42-genes. |
Table II.
Combination of 42-genes.
| Gene | logFC | P-value | FDR |
|---|
| DNMT3L | −0.457857972 |
4.250×10−05 | 0.000344393 |
| WNT1 | −0.440653373 | 0.00229823 | 0.018624233 |
| AVPR2 | −0.337010196 | 0.000130506 | 0.001057586 |
| CRYAA | −0.327349605 |
5.220×10−05 | 0.000423239 |
| ADRA1A | −0.323457976 | 0.000132 | 0.001069691 |
| RERGL | −0.307031974 | 0.00027205 | 0.002204622 |
|
HSD17B13 | −0.303883897 |
4.350×10−05 | 0.00035246 |
| CRHBP | −0.282544406 | 0.000378787 | 0.003069588 |
| GPR17 | −0.27487125 | 0.001557011 | 0.012617592 |
| AP1M2 | 0.265012128 | 0.002298097 | 0.018623151 |
| CCDC74B | 0.26607111 | 0.005538491 | 0.04488242 |
| EPHX4 | 0.273106635 | 0.001616394 | 0.013098814 |
| MYLK2 | 0.277944797 | 0.001898397 | 0.015384094 |
| S100P | 0.280211942 | 0.000796024 | 0.006450761 |
| SCIN | 0.286745667 | 0.001401359 | 0.011356228 |
| GULP1 | 0.293405465 | 0.002064432 | 0.016729591 |
| TMC5 | 0.304348871 | 0.001717824 | 0.013920779 |
| HOXD9 | 0.327961519 |
4.660×10−05 | 0.000377344 |
| DHDH | 0.331147822 | 0.001303337 | 0.01056189 |
| RUNDC3A | 0.344356975 | 0.001049184 | 0.0085023 |
| FXYD3 | 0.347111205 | 0.002610568 | 0.021155333 |
| FAM90A1 | 0.349492054 | 0.001789546 | 0.014501995 |
| POF1B | 0.353413663 | 0.00098377 | 0.007972208 |
| FAM163A | 0.357671188 | 0.001474436 | 0.01194843 |
| KCNN1 | 0.365217375 | 0.001202203 | 0.009742322 |
| TFAP2A | 0.365567331 |
6.750×10−05 | 0.000547399 |
| COL24A1 | 0.382367663 | 0.002049211 | 0.016606245 |
| DIRAS2 | 0.405965625 | 0.000995196 | 0.0080648 |
| FRMD1 | 0.411164402 | 0.004146525 | 0.033602313 |
| EPO | 0.413544952 | 0.000992878 | 0.008046009 |
| USH1C | 0.417142972 | 0.000668281 | 0.005415564 |
| CA9 | 0.422098465 | 0.001719337 | 0.013933041 |
| ART5 | 0.423955728 | 0.005437747 | 0.044066018 |
| MMP12 | 0.43064025 | 0.000852896 | 0.006911633 |
| TRIM54 | 0.438512907 | 0.001013864 | 0.008216081 |
| PPFIA4 | 0.467076549 |
5.000×10−05 | 0.000405366 |
| SLC35F3 | 0.503285506 | 0.002228769 | 0.018061337 |
| ELOVL3 | 0.524990121 | 0.000117912 | 0.00095553 |
| NPTX1 | 0.532157704 | 0.001637864 | 0.013272803 |
| ZNF695 | 0.601449278 | 0.000219446 | 0.001778327 |
| HOXD10 | 0.633083055 |
2.580×10−05 | 0.000209174 |
| PPP2R2C | 0.685073697 |
1.090×10−05 |
8.810×10−05 |
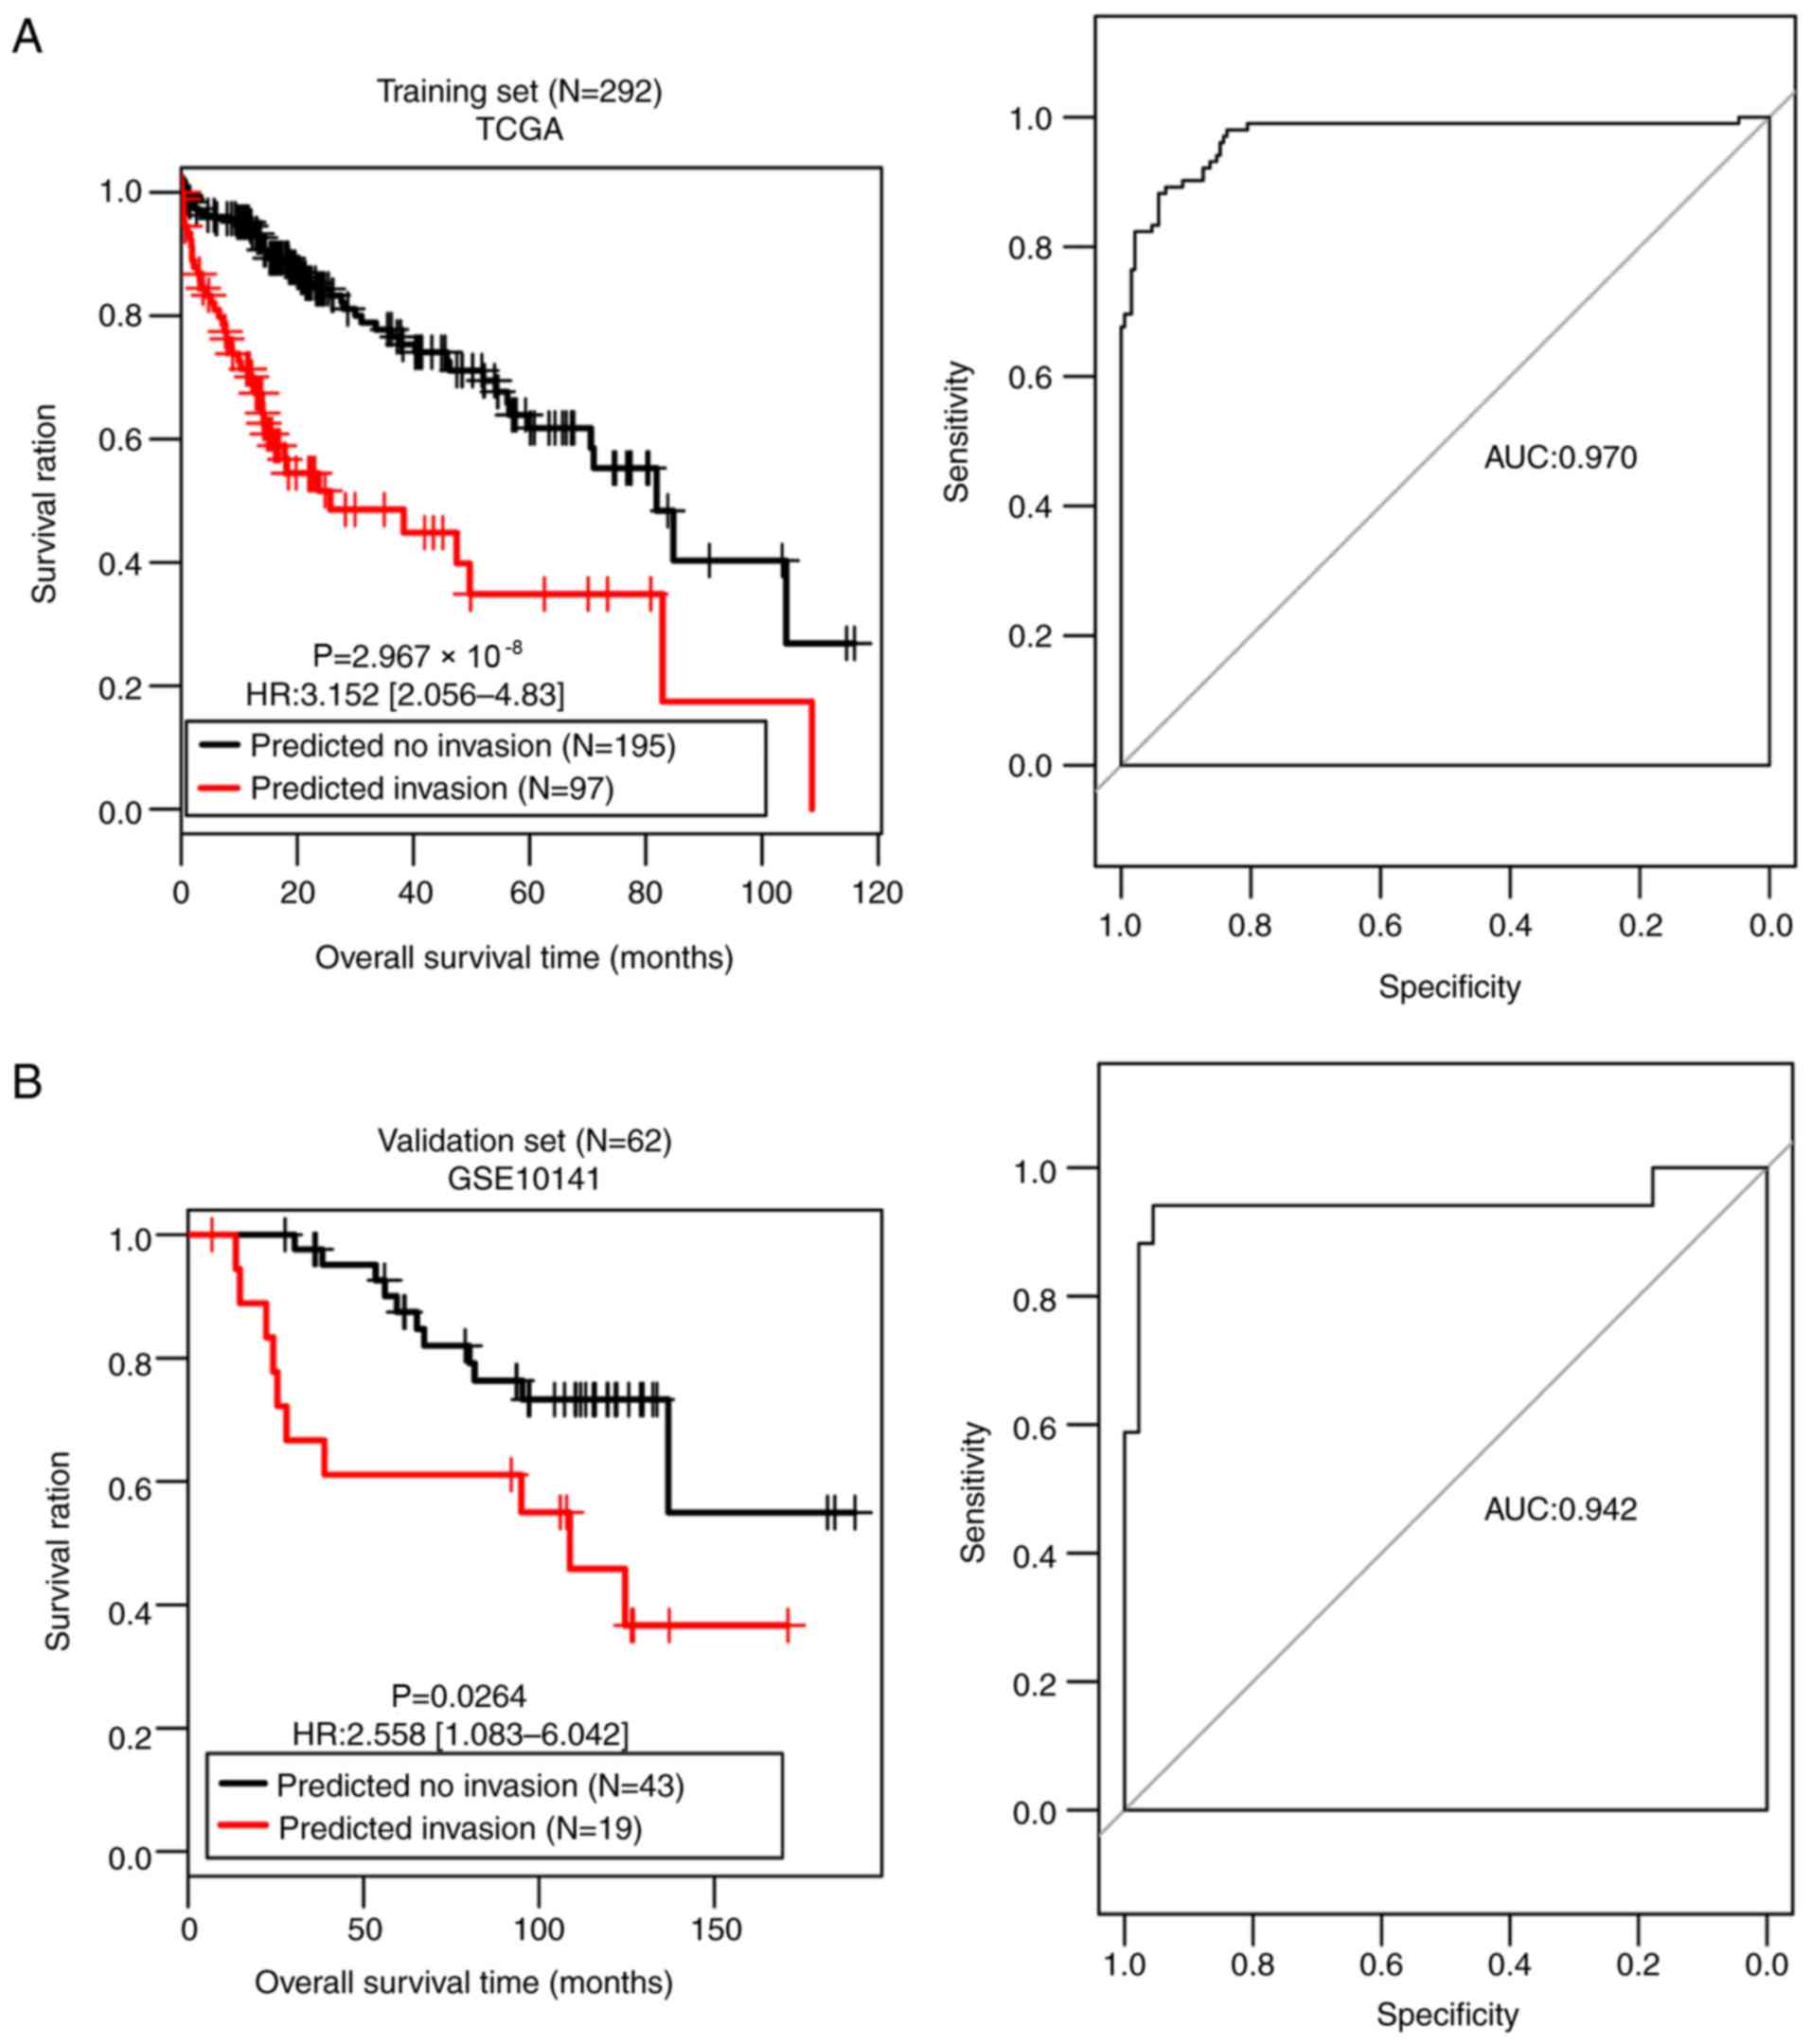
The SVM classifier was built with the 42-gene
combination and its performance was assessed in both the training
set and the validation set. A scatter plot and confusion matrix for
the training set or the validation set classified by the classifier
are presented in Fig. 3C and D.
Table III demonstrates that both
sets generated high C-index scores (>0.75), low Brier scores
(<0.1) and significant average log-rank P-values
(2.97×10−08; 0.0264) in OS difference between the
patients with and without vascular invasion (Fig. 4). AUROC of the two sets were 0.970
and 0.942, respectively (Table
III; Fig. 4). The sensitivity,
specificity, PPV and NPV values are presented in Table III. These results suggest that the
SVM classifier was able to classify the samples effectively.
| Table III.Performances of the SVM classifier on
the training and validation sets. |
Table III.
Performances of the SVM classifier on
the training and validation sets.
|
| Overall
survival | ROC curve |
|---|
|
|
|
|
|---|
| Datasets | C-index | Brier score | Log-rank
P-value | AUROC | Sensitivity | Specificity | PPV | NPV |
|---|
| Training set (TCGA,
N=292) | 0.814 | 0.0394 | <0.0001 | 0.970 | 0.814 | 0.926 | 0.856 | 0.903 |
| Validation set
(GSE10141, N=62) | 0.757 | 0.0884 | 0.0264 | 0.942 | 0.824 | 0.889 | 0.737 | 0.930 |
Prognostic model based on a 14-gene
signature
The present study also used the 42 feature genes to
create a LASSO Cox-PH regression model. When the maximal value of
cross-validation likelihood (−498.517) was achieved, the optimal
lambda value was 13.049, and the optimal panel of 14 genes was
obtained (Table IV), including
Wnt family member 1 (WNT1), crystallin α
A (CRYAA), RAS like estrogen regulated growth
inhibitor like (RERGL), hydroxysteroid 17-Beta
dehydrogenase 13 (HSD17B13), scinderin
(SCIN), premature ovarian failure (POF)1B,
erythropoietin (EPO), USH1 protein network component
harmonin (USH1C), ADP-ribosyltransferase 5
(ART5), matrix metalloproteinase (MMP)12,
tripartite motif containing 54 (TRIM54), solute
carrier family 35 member F3 (SLC35F3), homeobox D
(HOXD)10 and protein phosphatase 2 regulatory
subunit Bgamma (PPP2R2C). The following results were
obtained using the risk score formula:
| Table IV.Prognostic signature with 14
genes. |
Table IV.
Prognostic signature with 14
genes.
| Gene | Coefficient | Hazard ratio
(95%CI) | P-value |
|---|
| WNT1 | −0.2500 | 0.602
(0.459–0.789) |
2.400×10−04 |
| CRYAA | −0.0002 | 0.108
(0.0092–0.493) |
4.963×10−02 |
| RERGL | −0.0263 | 0.463
(0.244–0.854) |
4.533×10−02 |
|
HSD17B13 | −0.0153 | 0.586
(0.176–0.906) |
4.688×10−02 |
| SCIN | 0.0852 | 1.115
(1.086–1.267) |
4.939×10−02 |
| POF1B | 0.0756 | 1.085
(1.001–1.178) |
1.513×10−02 |
| EPO | 0.0616 | 1.068
(1.013–1.152) |
4.897×10−02 |
| USH1C | 0.0106 | 1.043
(1.001–1.071) |
4.897×10−02 |
| ART5 | 0.0134 | 1.047
(1.035–1.171) |
4.231×10−02 |
| MMP12 | 0.0236 | 1.051
(1.048–1.165) |
3.410×10−02 |
| TRIM54 | 0.0454 | 1.059
(1.028–1.164) |
2.392×10−02 |
| SLC35F3 | 0.0124 | 1.057
(1.029–1.203) |
3.974×10−02 |
| HOXD10 | 0.1010 | 1.448
(1.127–1.924) |
3.069×10−03 |
| PPP2R2C | 0.0047 | 1.004
(1.002–1.085) |
4.926×10−01 |
Risk score=(−0.2500) × ExpWNT1 +
(−0.0002) × ExpCRYAA + (−0.0263) × ExpRERGL +
(−0.0153) × ExpHSD17B13 + (0.0852) × ExpSCIN
+ (0.0756) × ExpPOF1B + (0.0616) × ExpEPO +
(0.0106) × ExpUSH1C + (0.0134) × ExpART5 +
(0.0236) × ExpMMP12 + (0.0454) × ExpTRIM54+
(0.0124) × ExpSLC35F3 + (0.1010) × ExpHOXD10
+ (0.0047) × ExpPPP2R2C.
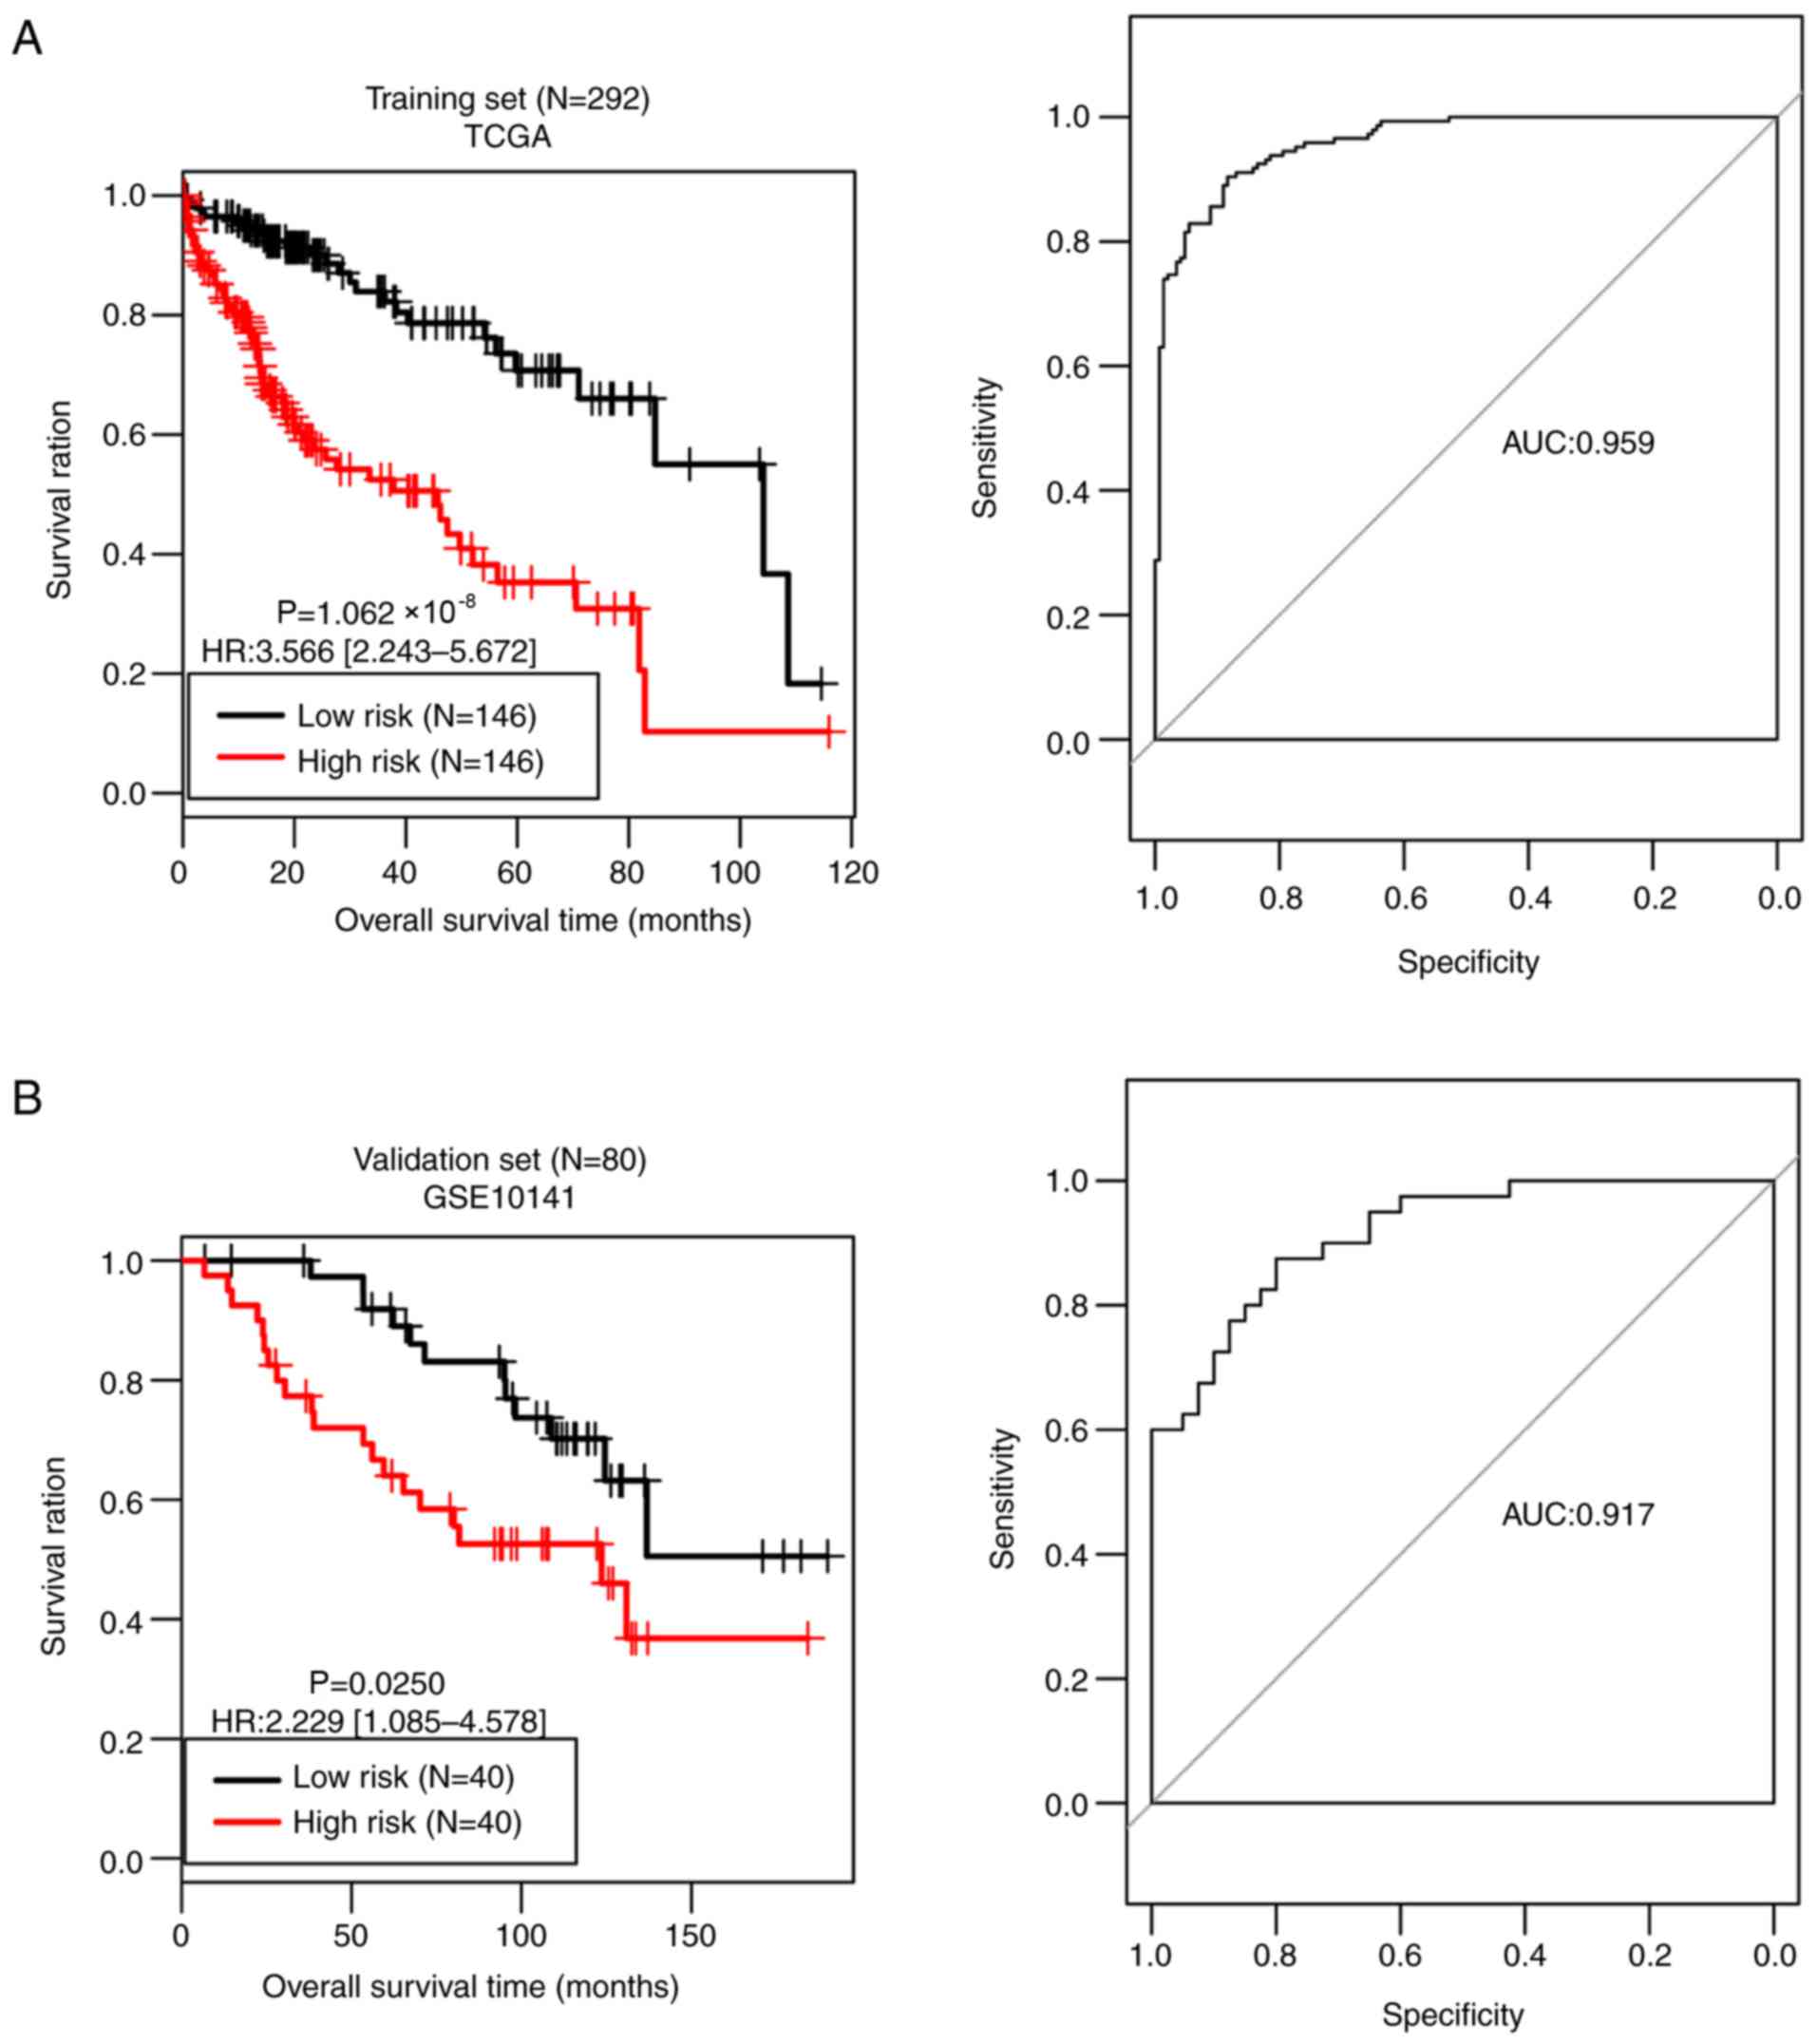
Based on the median risk score, all samples of the
training set were divided into a high-risk group (n=146) and a
low-risk group (n=146). As presented in Fig. 5A, the OS time was significantly
different between the two risk groups (P=1.062×10−08),
with an AUC value of 0.959. OS time was significantly different
between the high-risk group (n=40) and the low-risk group (n=40) in
the validation set (P=0.0250), with an AUC value of 0.917 (Fig. 5B). These observations prove the
predictive robustness of the 14-gene signature.
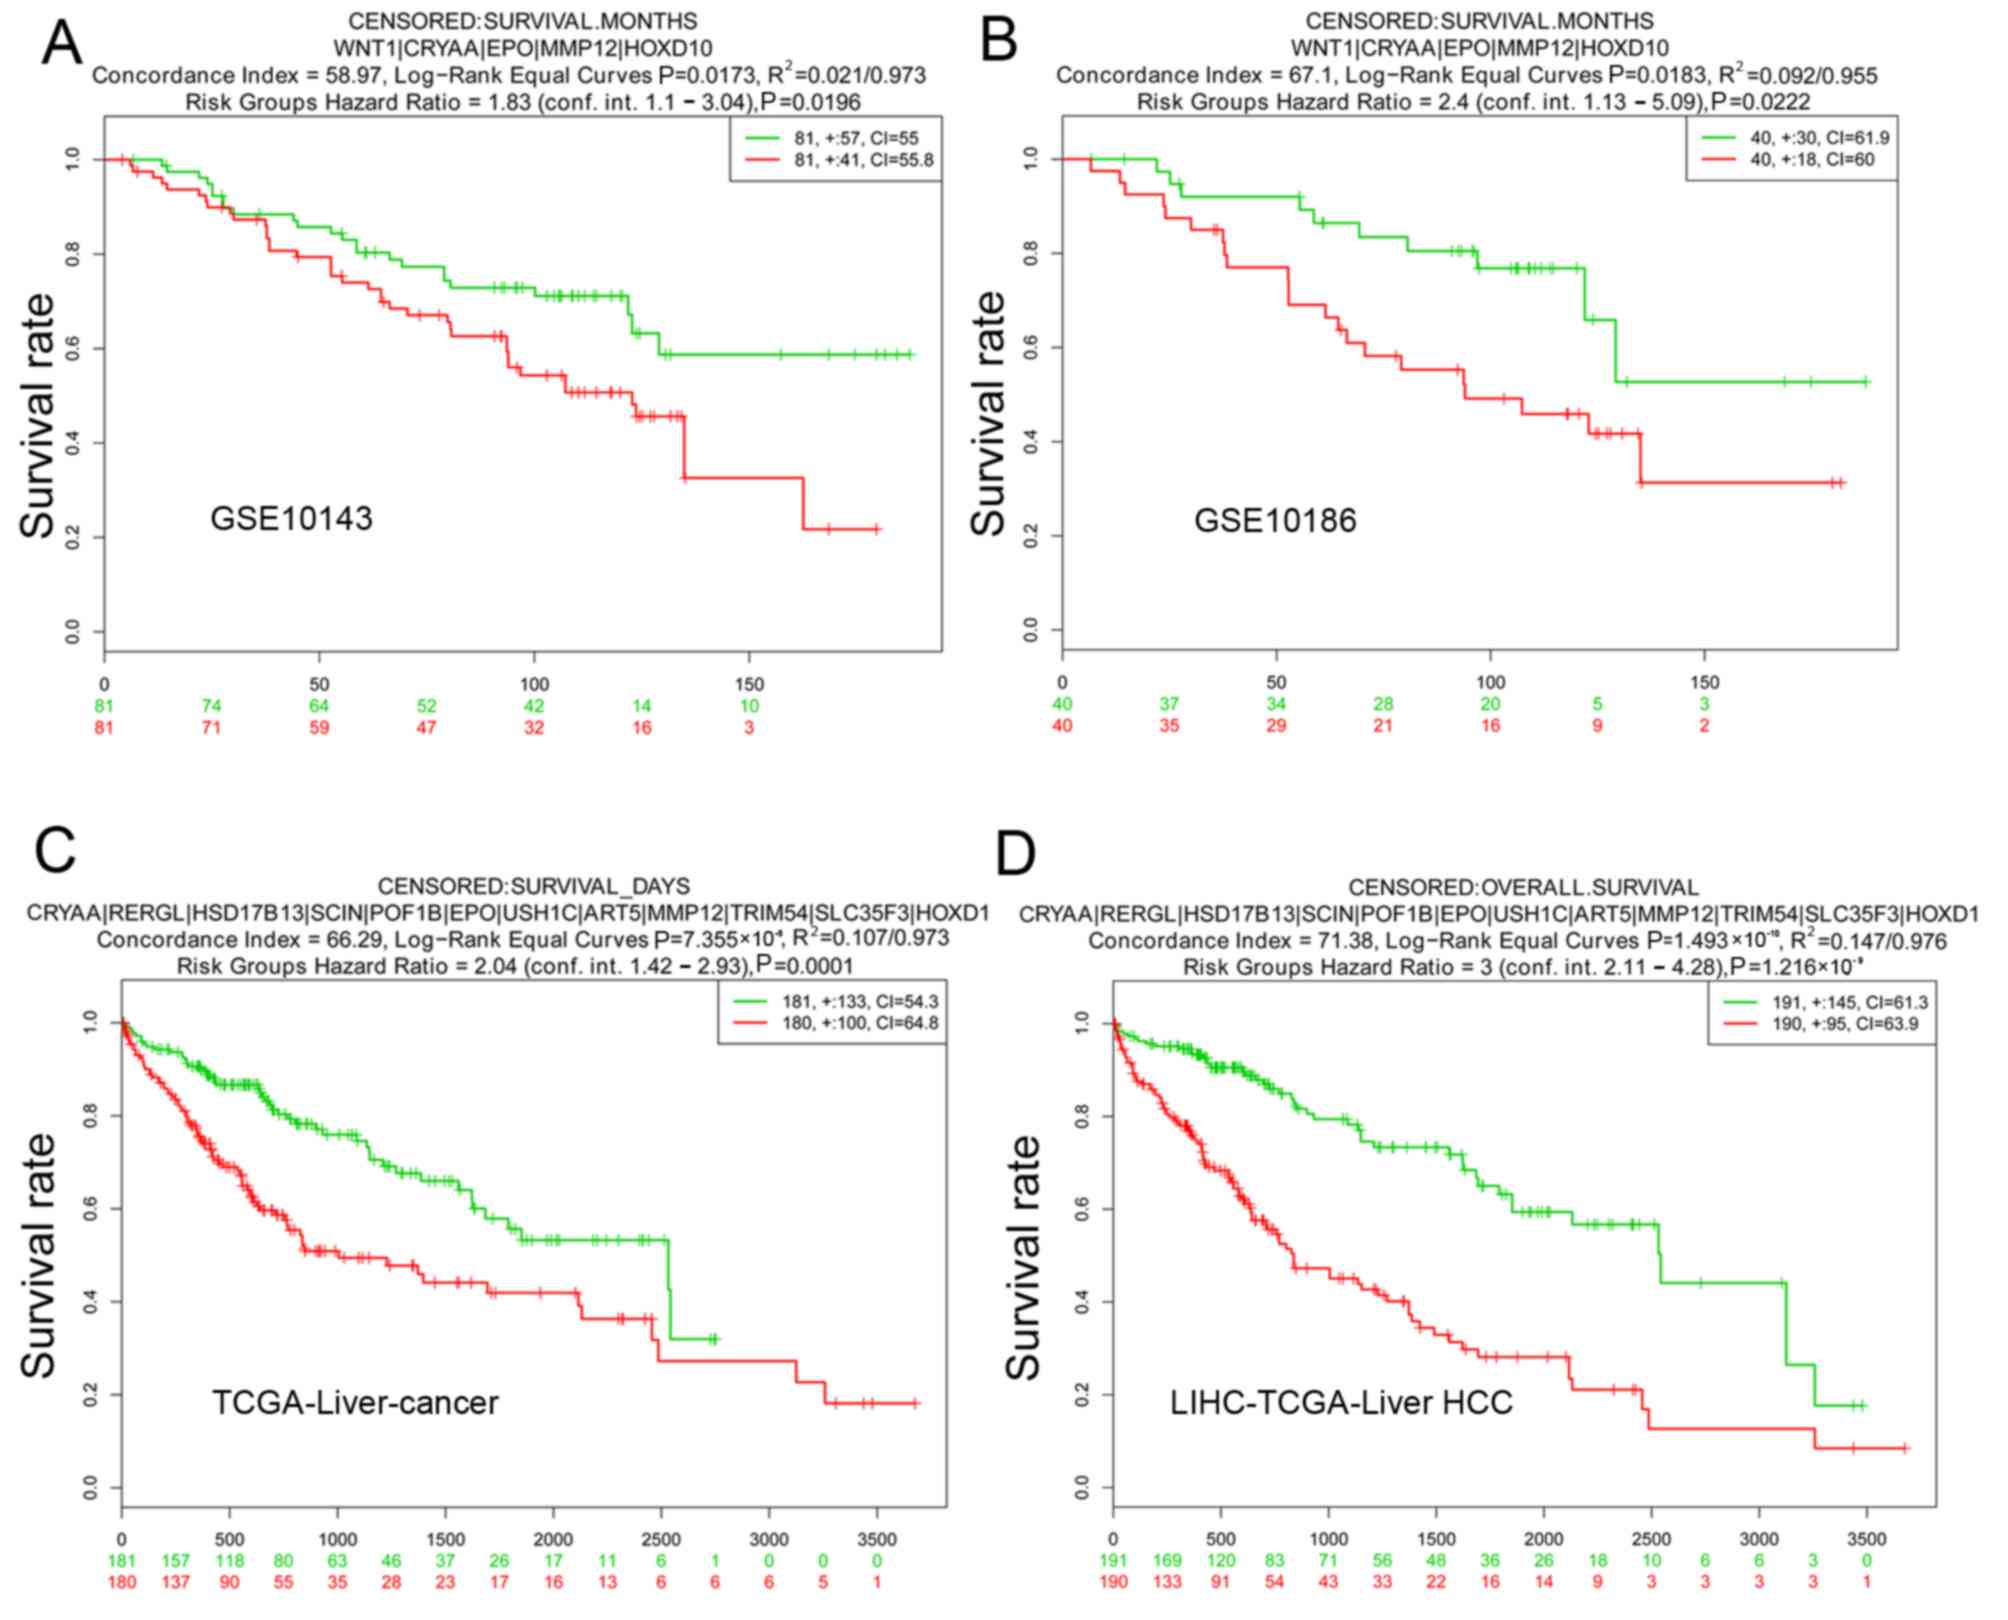
For validation of SurvExpress, five datasets,
including GSE10143, GSE17856, GSE10186, TCGA-Liver-Cancer, and
LIHC-TCGA-Liver HCC associated with HCC were included for
validation in SurvExpress. The 51 screened candidate genes were
inputted and the results revealed that the OS times were all
significantly different between the high-risk group and the
low-risk group in GSE10143, GSE10186, TCGA-Liver-cancer and
LIHC-TCGA-Liver HCC (Fig. 6). This
result supported the reliability of the gene signature.
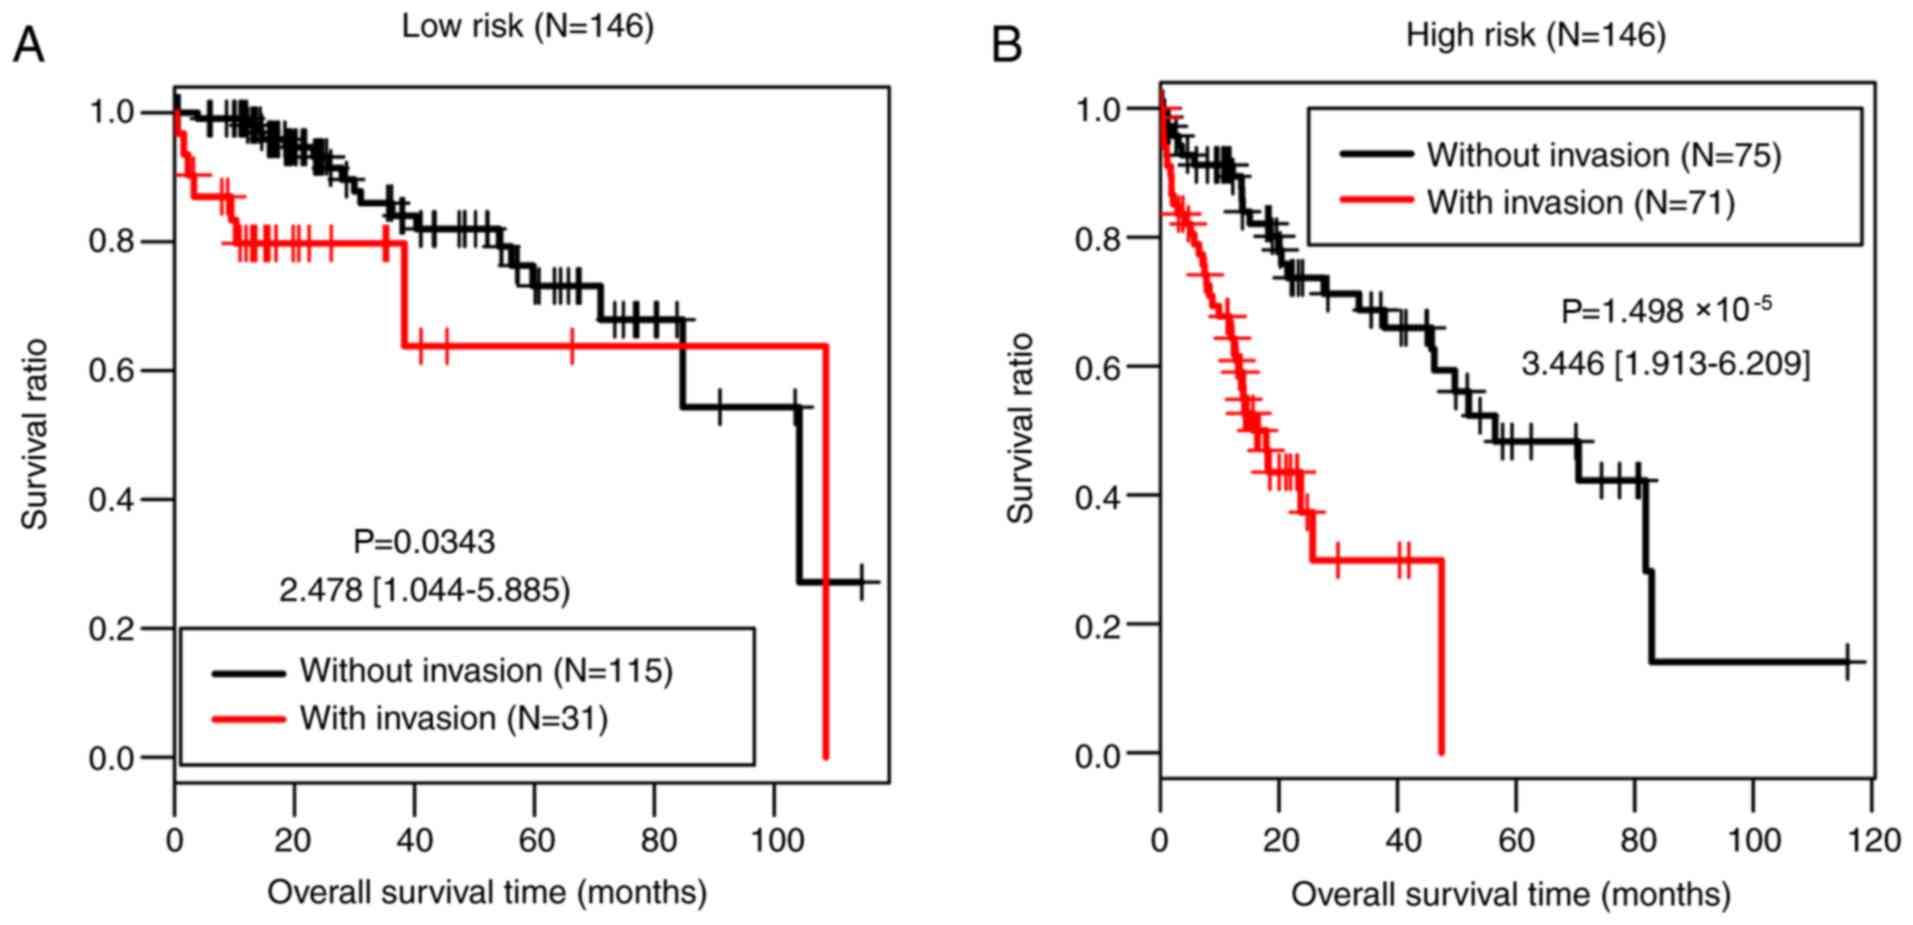
Stratified analysis
The present study further investigated the
associations between the clinical factors and OS in the low-risk
group and the high-risk group of the training set by performing Cox
regression analyses. Vascular invasion was significantly associated
with OS time in both risk groups (P=0.034 and
P=1.50×10−05, respectively; Table V; Fig.
7).
| Table V.Results of Cox regression analysis
for the high- and low-risk groups of The Cancer Genome Atlas
set. |
Table V.
Results of Cox regression analysis
for the high- and low-risk groups of The Cancer Genome Atlas
set.
|
| Low risk group | High risk
group |
|---|
|
|
|
|
|---|
| Clinical
characteristics | HR (95% CI) | P-value | HR (95% CI) | P-value |
|---|
| Age, years, mean ±
SD | 1.018
(0.986–1.052) | 0.273 | 1.012
(0.992–1.032) | 0.257 |
| Sex
(male/female) | 0.568
(0.246–1.308) | 0.178 | 1.129
(0.676–1.886) | 0.643 |
| Pathological M
(M0/M1/-) (28) | 8.721
(1.090–69.77) | 0.138 | 3.227
(0.770–13.520) | 0.090 |
| Pathological N
(N0/N1/-) | 3.01
(1.052–33.22) | 0.763 | 1.429
(0.195–10.490) | 0.724 |
| Pathological T
(T1/T2/T3/T4/-) | 1.527
(0.955–2.443) | 0.072 | 1.240
(0.914–1.681) | 0.165 |
| Pathological stage
(I/II/III/IV/-) | 1.346
(0.805–2.252) | 0.254 | 1.215
(0.885–1.668) | 0.228 |
| Histological grade
(G1/G2/G3/G4/-) | 1.115
(0.630–1.971) | 0.709 | 0.916
(0.642–1.307) | 0.629 |
| Virus infection
(HBV/HCV/Mixed/-) | 2.333
(1.962–5.655) | 0.038 | 0.932
(0.613–1.416) | 0.741 |
| Vascular invasion
(yes/no) | 2.478
(1.044–5.885) | 0.034 | 3.446
(1.913–6.209) | <0.001 |
| Recurrence
(yes/no/-) | 1.569
(0.670–3.672) | 0.296 | 0.924
(0.526–1.623) | 0.783 |
Identification and pathway analysis of
DEGs between the two risk groups in the training set
In the training set, 599 upregulated genes and 163
downregulated genes were identified in the high-risk group compared
with the low-risk group. These genes were significantly involved in
pathways of ‘retinol metabolism’, ‘drug metabolism other enzymes’,
‘drug metabolism cytochrome P450’, ‘peroxisome
proliferator-activated receptor (PPAR) signaling pathway’, ‘primary
bile acid biosynthesis’, ‘steroid hormone biosynthesis’ and
‘histidine metabolism pathways’ (Table
VI).
| Table VI.Significant signaling pathways. |
Table VI.
Significant signaling pathways.
| Pathway | ES | NES | Normal P-value | FDR | Count | Gene |
|---|
| Retinol
metabolism | −0.7987 | −2.3043 | 0 | 0 | 6 | CYP4A22, CYP26A1,
CYP3A43, CYP2A7, CYP2A6, CYP2A13 |
| Drug metabolism
other enzymes | −0.9022 | −2.2834 | 0 | 0 | 4 | CYP3A43, CYP2A7,
CYP2A6, CYP2A13 |
| Drug metabolism
cytochrome P450 | −0.9011 | −2.0480 | 0 | 0.0047 | 4 | CYP3A43, CYP2A7,
CYP2A6, CYP2A13 |
| PPAR signaling
pathway | −0.7106 | −1.9354 | 0.0026 | 0.0121 | 3 | CYP4A22, CYP8B1,
ACADL |
| Primary bile acid
biosynthesis | −0.9631 | −1.9038 | 0 | 0.0124 | 3 | CYP8B1, AKR1D1,
CYP7A1 |
| Steroid hormone
biosynthesis | −0.5989 | −1.8162 | 0.0084 | 0.0188 | 6 | AKR1D1, CYP7A1,
HSD3B2, HSD3B1, CYP11A1, CYP3A43 |
| Histidine
metabolism | −0.8709 | −1.6875 | 0.01 | 0.0468 | 3 | HDC, CNDP1,
UROC1 |
Discussion
HCC is an aggressive malignancy characterized by
high incidence rates of recurrence and metastasis (29). Vascular invasion is an unfavorable
prognostic factor for patients with HCC (30). Therefore, unraveling the underlying
molecular landscape of vascular invasion is of significance for the
prognosis of HCC. In the present study, a total of 175 DEGs were
identified between patients with the presence and absence of
vascular invasion. An SVM classifier was built that consisted of 42
feature genes by implementing an RFE-SVM algorithm. In both the
training and validation sets, the classifier had high C-index
values, low Brier scores and significant log-rank P-values,
indicating good performances in separating patients with vascular
invasion from patients without vascular invasion. Furthermore,
through using a LASSO Cox-PH model, a 14-gene prognostic signature
was obtained and consequently, a prognostic scoring model was
established. The 14-gene signature was able to predict those
patients with HCC that would have a shorter survival time, as
evidenced by the result that OS time was significantly different
between the predicted high-risk patients and the predicted low-risk
patients. T prognostic performance of the 14-gene signature was
successfully confirmed in the validation set.
The 14-gene prognostic combination included WNT1,
CRYAA, RERGL, HSD17B13, SCIN, POF1B, EPO, USH1C, ART5, MMP12,
TRIM54, SLC35F3, HOXD10 and PPP2R2C. Proto-oncogene
protein Wnt-1 encoded by the WNT1 gene has been demonstrated
as upregulated in HCC, acting as a direct target of miR-122
(31). RERGL is a member of the RAS
superfamily of GTPases that participates in regulating several
biological processes, such as cell proliferation, differentiation
and apoptosis (32). There was one
HSD17B13 protein, namely 17β-HSD type 13, that was downregulated in
HCC (33). There is evidence to
suggest that HSD17B13 suppresses HCC progression by delaying the
G1/S phase transition of HCC cells (34). Furthermore, HSD17B13 is a novel
liver-specific protein associated with lipid droplet, and may be a
promising biomarker of liver cancer (35). SCIN encodes scinderin, which
is an actin-severing protein of the gelsolin superfamily. It acts
as a regulator of HCC cell apoptosis and growth, and has been
identified as a transcriptional target of tumor suppressor factor
breast cancer metastasis-suppressor 1 (36). It has long been established that the
EPO/EPO-receptor plays an important role in angiogenesis and
progression of HCC (37). EPO
protein expression is positively correlated with vasculogenic
mimicry in HCC, and has been identified as an independent predictor
of prognosis in patients with HCC (38). Furthermore, EPO is upregulated
in HCC and could promote HCC cell proliferation through
translocation of its specific receptor induced by hypoxia (39). MMP12 belongs to the MMP family
implicated in the degradation of the extracellular matrix. It is
upregulated in HCC and is an independent predictive factor for OS
in patients with HCC (40,41). TRIM54 is a member of the TRIM protein
family. Several members in the TRIM family have been reported to be
involved in biological processes, such as cell proliferation,
differentiation and apoptosis, and may play a role in cancer
initiation and progression (42).
However, to the best of our knowledge TRIM54 has not been reported
previously. HOXD10, a member of the Abd-B homeobox family,
exhibits decreased expression levels in HCC and serves as a
tumor-suppressor gene through prohibiting extracellular
signal-regulated kinase signaling (43). PPP2R2C encodes
serine/threonine-protein phosphatase 2A 55 kDa regulatory subunit B
γ isoform, and has been identified as upregulated in HCC (44). To the best of our knowledge, there
are little studies that focus on the function of CRYAA, RERGL,
POF1B, POF1B, USH1C, TRIM54 and SLC35F3 in HCC. The results of the
present study indicate that the 14 vascular invasion-associated
genes may be prognostic biomarkers of HCC.
Another aim of the present study was identifying the
potential roles of DEGs between the high- and low-risk groups of
the training set. There were 762 DEGs between the two risk groups,
which were significantly involved in a number of signaling
pathways, such as ‘retinol metabolism’, ‘drug metabolism cytochrome
P450’, and ‘PPAR signaling pathway’. The association between
retinol metabolism and HCC has been demonstrated previously and a
synthetic retinoid has been indicated to prevent HCC recurrence
(45). Drug-metabolizing cytochrome
P450 enzyme activities are severely disrupted in HCC (46). The PPAR signaling pathway plays a
part in tumorigenesis and tumor progression via different metabolic
pathways: Glycolysis/gluconeogenesis, lipid, glycerolipid and
glycerophospholipid metabolism, protein synthesis and degradation
and purine metabolism (47). These
findings reveal the critical roles of these pathways in HCC.
There are some limitations in the present study;
though the 14-gene prognostic signature has been validated by an
independent dataset, the expression levels of these 14 genes have
not been confirmed by individual gene expression experiments.
In summary, using TCGA data, the present study
defined a classifier of 42 feature genes for classification of
patients with HCC with and without vascular invasion, and
identified a vascular invasion-associated 14-gene prognostic
signature for HCC. Several genes and pathways have been revealed to
be critical for HCC. These results further the current knowledge on
the molecular mechanisms underlying HCC and may aid in the
development of personalized treatment for patients with HCC.
Large-scale studies are required in order to further validate the
results of the present study.
Supplementary Material
Supporting Data
Acknowledgements
Not applicable.
Funding
No funding was received.
Availability of data and materials
The datasets used and/or analyzed during the current
study are available from the corresponding author on reasonable
request.
Authors' contributions
BY performed the data analyses and wrote the
manuscript. CT and YT contributed significantly towards the data
analyses and revised the manuscript. ZZ conceived and designed the
study. All authors read and approved the final published version of
the manuscript.
Ethics approval and consent to
participate
In the original article of the datasets, the trials
were approved by the local institutional review boards of all
participating centers, and informed consent was obtained from all
patients.
Patient consent for publication
Not applicable.
Competing interests
The authors declare that they have no competing
interests.
References
|
1
|
Balogh J, Victor D III, Asham EH,
Burroughs SG, Boktour M, Saharia A, Li X, Ghobrial RM and Monsour
HP Jr: Hepatocellular carcinoma: A review. J Hepatocell Carcinoma.
3:41–53. 2016. View Article : Google Scholar : PubMed/NCBI
|
|
2
|
Bertuccio P, Turati F, Carioli G,
Rodriguez T, La Vecchia C, Malvezzi M and Negri E: Global trends
and predictions in hepatocellular carcinoma mortality. J Hepatol.
67:302–309. 2017. View Article : Google Scholar : PubMed/NCBI
|
|
3
|
Lo YC, Hsu FC, Hung SK, Tseng KC, Hsieh
YH, Lee MS, Tseng CW, Lin HY, Chen LC and Chiou WY: Prognosticators
of hepatocellular carcinoma with intrahepatic vascular invasion. Ci
Ji Yi Xue Za Zhi. 31:40–46. 2019.PubMed/NCBI
|
|
4
|
Pawlik TM, Poon RT, Abdalla EK, Zorzi D,
Ikai I, Curley SA, Nagorney DM, Belghiti J, Ng IO, Yamaoka Y, et
al: Critical appraisal of the clinical and pathologic predictors of
survival after resection of large hepatocellular carcinoma. Arch
Surg. 140:450–458. 2005. View Article : Google Scholar : PubMed/NCBI
|
|
5
|
Sakata J, Shirai Y, Wakai T, Kaneko K,
Nagahashi M and Hatakeyama K: Preoperative predictors of vascular
invasion in hepatocellular carcinoma. Eur J Surg Oncol. 34:900–905.
2008. View Article : Google Scholar : PubMed/NCBI
|
|
6
|
Hsieh CH, Wei CK, Yin WY, Chang CM, Tsai
SJ, Wang LY, Chiou WY, Lee MS, Lin HY and Hung SK: Vascular
invasion affects survival in early hepatocellular carcinoma. Mol
Clin Oncol. 3:252–256. 2015. View Article : Google Scholar : PubMed/NCBI
|
|
7
|
Hui Z, Chen C, Xu F, Yan X, Jia W, Mao L,
Jin H and Qiu Y: Prognostic value of a novel risk classification of
microvascular invasion in patients with hepatocellular carcinoma
after resection. Oncotarget. 8:5474–5486. 2016.
|
|
8
|
Ho MC, Lin JJ, Chen CN, Chen CC, Lee H,
Yang CY, Ni YH, Chang KJ, Hsu HC, Hsieh FJ and Lee PH: A gene
expression profile for vascular invasion can predict the recurrence
after resection of hepatocellular carcinoma: A microarray approach.
Ann Surg Oncol. 13:1474–1484. 2006. View Article : Google Scholar : PubMed/NCBI
|
|
9
|
Mínguez B, Hoshida Y, Villanueva A,
Toffanin S, Cabellos L, Thung S, Mandeli J, Sia D, April C, Fan JB,
et al: Gene-expression signature of vascular invasion in
hepatocellular carcinoma. J Hepatol. 55:1325–1331. 2011. View Article : Google Scholar : PubMed/NCBI
|
|
10
|
Lin Z, Cai YJ, Chen RC, Chen BC, Zhao L,
Xu SH, Wang XD, Song M, Wu JM, Wang YQ, et al: A microRNA
expression profile for vascular invasion can predict overall
survival in hepatocellular carcinoma. Clin Chim Acta. 469:171–179.
2017. View Article : Google Scholar : PubMed/NCBI
|
|
11
|
Ravishankar H, Madhavan R, Mullick R,
Shetty T, Marinelli L and Joel SE: Recursive feature elimination
for biomarker discovery in resting-state functional connectivity.
Conf Proc IEEE Eng Med Biol Soc. 2016:4071–4074. 2016.PubMed/NCBI
|
|
12
|
Hoshida Y, Villanueva A, Kobayashi M, Peix
J, Chiang DY, Camargo A, Gupta S, Moore J, Wrobel MJ, Lerner J, et
al: Gene expression in fixed tissues and outcome in hepatocellular
carcinoma. N Engl J Med. 359:1995–2004. 2008. View Article : Google Scholar : PubMed/NCBI
|
|
13
|
Wang P, Wang Y, Hang B, Zou X and Mao JH:
A novel gene expression-based prognostic scoring system to predict
survival in gastric cancer. Oncotarget. 7:55343–55351.
2016.PubMed/NCBI
|
|
14
|
Ritchie ME, Phipson B, Wu D, Hu Y, Law CW,
Shi W and Smyth GK: Limma powers differential expression analyses
for RNA-sequencing and microarray studies. Nucleic Acids Res.
43:e472015. View Article : Google Scholar : PubMed/NCBI
|
|
15
|
Eisen MB, Spellman PT, Brown PO and
Botstein D: Cluster analysis and display of genome-wide expression
patterns. Proc Natl Acad Sci USA. 95:14863–14868. 1998. View Article : Google Scholar : PubMed/NCBI
|
|
16
|
Wang L, Cao C, Ma Q, Zeng Q, Wang H, Cheng
Z, Zhu G, Qi J, Ma H, Nian H and Wang Y: RNA-seq analyses of
multiple meristems of soybean: Novel and alternative transcripts,
evolutionary and functional implications. BMC Plant Biol.
14:1692014. View Article : Google Scholar : PubMed/NCBI
|
|
17
|
Lu X, Yang Y, Wu F, Gao M, Xu Y, Zhang Y,
Yao Y, Du X, Li C, Wu L, et al: Discriminative analysis of
schizophrenia using support vector machine and recursive feature
elimination on structural MRI images. Medicine (Baltimore).
95:e39732016. View Article : Google Scholar : PubMed/NCBI
|
|
18
|
Deist TM, Dankers FJMM, Valdes G, Wijsman
R, Hsu IC, Oberije C, Lustberg T, van Soest J, Hoebers F, Jochems
A, et al: Machine learning algorithms for outcome prediction in
(chemo)radiotherapy: An empirical comparison of classifiers. Med
Phys. 45:3449–3459. 2018. View
Article : Google Scholar : PubMed/NCBI
|
|
19
|
Wang Q and Liu X: Screening of feature
genes in distinguishing different types of breast cancer using
support vector machine. Onco Targets Ther. 8:2311–2317.
2015.PubMed/NCBI
|
|
20
|
Mayr A and Schmid M: Boosting the
concordance index for survival data-a unified framework to derive
and evaluate biomarker combinations. PLoS One. 9:e844832014.
View Article : Google Scholar : PubMed/NCBI
|
|
21
|
Zhang X, Li Y, Akinyemiju T, Ojesina AI,
Buckhaults P, Liu N, Xu B and Yi N: Pathway-structured predictive
model for cancer survival prediction: A two-stage approach.
Genetics. 205:89–100. 2017. View Article : Google Scholar : PubMed/NCBI
|
|
22
|
Schroder MS, Culhane AC, Quackenbush J and
Haibe-Kains B: Survcomp: An R/Bioconductor package for performance
assessment and comparison of survival models. Bioinformatics.
27:3206–3208. 2011. View Article : Google Scholar : PubMed/NCBI
|
|
23
|
Robin X, Turck N, Hainard A, Tiberti N,
Lisacek F, Sanchez JC and Müller M: pROC: An open-source package
for R and S+ to analyze and compare ROC curves. BMC Bioinformatics.
12:772011. View Article : Google Scholar : PubMed/NCBI
|
|
24
|
Tibshirani R: The lasso method for
variable selection in the Cox model. Stat Med. 16:385–395. 1997.
View Article : Google Scholar : PubMed/NCBI
|
|
25
|
Aguirre-Gamboa R, Gomez-Rueda H,
Martinez-Ledesma E, Martínez-Torteya A, Chacolla-Huaringa R,
Rodriguez- Barrientos A, Tamez-Peña JG and Treviño V: SurvExpress:
An online biomarker validation tool and database for cancer gene
expression data using survival analysis. PLoS One. 8:e742502013.
View Article : Google Scholar : PubMed/NCBI
|
|
26
|
Hoshida Y, Nijman SM, Kobayashi M, Chan
JA, Brunet JP, Chiang DY, Villanueva A, Newell P, Ikeda K,
Hashimoto M, et al: Integrative transcriptome analysis reveals
common molecular subclasses of human hepatocellular carcinoma.
Cancer Res. 69:7385–7392. 2009. View Article : Google Scholar : PubMed/NCBI
|
|
27
|
Subramanian A, Tamayo P, Mootha VK,
Mukherjee S, Ebert BL, Gillette MA, Paulovich A, Pomeroy SL, Golub
TR, Lander ES and Mesirov JP: Gene set enrichment analysis: A
knowledge-based approach for interpreting genome-wide expression
profiles. Proc Natl Acad Sci USA. 102:15545–15550. 2005. View Article : Google Scholar : PubMed/NCBI
|
|
28
|
Varotti G, Ramacciato G, Ercolani G, Grazi
GL, Vetrone G, Cescon M, Del Gaudio M, Ravaioli M, Ziparo V, Lauro
A and Pinna A: Comparison between the fifth and sixth editions of
the AJCC/UICC TNM staging systems for hepatocellular carcinoma:
Multicentric study on 393 cirrhotic resected patients. Eur J Surg
Oncol. 31:760–767. 2005. View Article : Google Scholar : PubMed/NCBI
|
|
29
|
Singal AG and El-Serag HB: Hepatocellular
carcinoma from epidemiology to prevention: Translating knowledge
into practice. Clin Gastroenterol Hepatol. 13:2140–2151. 2015.
View Article : Google Scholar : PubMed/NCBI
|
|
30
|
Kasai Y, Hatano E, Seo S, Taura K,
Yasuchika K and Uemoto S: Hepatocellular carcinoma with bile duct
tumor thrombus: Surgical outcomes and the prognostic impact of
concomitant major vascular invasion. World J Surg. 39:1485–1493.
2015. View Article : Google Scholar : PubMed/NCBI
|
|
31
|
Ahsani Z, Mohammadi-Yeganeh S, Kia V,
Karimkhanloo H, Zarghami N and Paryan M: WNT1 Gene from WNT
signaling pathway is a direct target of miR-122 in hepatocellular
carcinoma. Appl Biochem Biotechnol. 181:884–897. 2017. View Article : Google Scholar : PubMed/NCBI
|
|
32
|
Goitre L, Trapani E, Trabalzini L and
Retta SF: The Ras superfamily of small GTPases: The unlocked
secrets. Methods Mol Biol. 1120:1–18. 2014. View Article : Google Scholar : PubMed/NCBI
|
|
33
|
Xing X, Huang Y, Wang S, Chi M, Zeng Y,
Chen L, Li L, Zeng J, Lin M, Han X, et al: Dataset for the
quantitative proteomics analysis of the primary hepatocellular
carcinoma with single and multiple lesions. Data Brief. 5:226–240.
2015. View Article : Google Scholar : PubMed/NCBI
|
|
34
|
Chen J, Zhuo JY, Yang F, Liu ZK, Zhou L,
Xie HY, Xu X and Zheng SS: 17-beta-hydroxysteroid dehydrogenase 13
inhibits the progression and recurrence of hepatocellular
carcinoma. Hepatobiliary Pancreat Dis Int. 17:220–226. 2018.
View Article : Google Scholar : PubMed/NCBI
|
|
35
|
Su W, Mao Z, Liu Y, Zhang X, Zhang W,
Gustafsson JA and Guan Y: Role of HSD17B13 in the liver physiology
and pathophysiology. Mol Cell Endocrinol. 489:119–125. 2019.
View Article : Google Scholar : PubMed/NCBI
|
|
36
|
Qiao X, Zhou Y, Xie W, Wang Y, Zhang Y,
Tian T, Dou J, Yang X, Shen S, Hu J, et al: Scinderin is a novel
transcriptional target of BRMS1 involved in regulation of
hepatocellular carcinoma cell apoptosis. Am J Cancer Res.
8:1008–1018. 2018.PubMed/NCBI
|
|
37
|
Ribatti D, Marzullo A, Gentile A, Longo V,
Nico B, Vacca A and Dammacco F:
Erythropoietin/erythropoietin-receptor system is involved in
angiogenesis in human hepatocellular carcinoma. Histopathology.
50:591–596. 2007. View Article : Google Scholar : PubMed/NCBI
|
|
38
|
Yang Z, Sun B, Zhao X, Shao B, An J, Gu Q,
Wang Y, Dong X, Zhang Y and Qiu Z: Erythropoietin and
erythropoietin receptor in hepatocellular carcinoma: Correlation
with vasculogenic mimicry and poor prognosis. Int J Clin Exp
Pathol. 8:4033–4043. 2015.PubMed/NCBI
|
|
39
|
Miao S, Wang SM, Cheng X, Li YF, Zhang QS,
Li G, He SQ, Chen XP and Wu P: Erythropoietin promoted the
proliferation of hepatocellular carcinoma through hypoxia induced
translocation of its specific receptor. Cancer Cell Int.
17:1192017. View Article : Google Scholar : PubMed/NCBI
|
|
40
|
Ng KT, Qi X, Kong KL, Cheung BY, Lo CM,
Poon RT, Fan ST and Man K: Overexpression of matrix
metalloproteinase-12 (MMP-12) correlates with poor prognosis of
hepatocellular carcinoma. Eur J Cancer. 47:2299–2305. 2011.
View Article : Google Scholar : PubMed/NCBI
|
|
41
|
He MK, Le Y, Zhang YF, Ouyang HY, Jian PE,
Yu ZS, Wang LJ and Shi M: Matrix metalloproteinase 12 expression is
associated with tumor FOXP3+ regulatory T cell
infiltration and poor prognosis in hepatocellular carcinoma. Oncol
Lett. 16:475–482. 2018.PubMed/NCBI
|
|
42
|
Cambiaghi V, Giuliani V, Lombardi S,
Marinelli C, Toffalorio F and Pelicci PG: TRIM proteins in cancer.
Adv Exp Med Biol. 770:77–91. 2012. View Article : Google Scholar : PubMed/NCBI
|
|
43
|
Guo Y, Peng Y, Gao D, Zhang M, Yang W,
Linghu E, Herman JG, Fuks F, Dong G and Guo M: Silencing HOXD10 by
promoter region hypermethylation activates ERK signaling in
hepatocellular carcinoma. Clin Epigenetics. 9:1162017. View Article : Google Scholar : PubMed/NCBI
|
|
44
|
Ho DW, Kai AK and Ng IO: TCGA
whole-transcriptome sequencing data reveals significantly
dysregulated genes and signaling pathways in hepatocellular
carcinoma. Front Med. 9:322–330. 2015. View Article : Google Scholar : PubMed/NCBI
|
|
45
|
Shirakami Y, Sakai H and Shimizu M:
Retinoid roles in blocking hepatocellular carcinoma. Hepatobiliary
Surg Nutr. 4:222–228. 2015.PubMed/NCBI
|
|
46
|
Yan T, Lu L, Xie C, Chen J, Peng X, Zhu L,
Wang Y, Li Q, Shi J, Zhou F, et al: Severely impaired and
dysregulated cytochrome P450 expression and activities in
hepatocellular carcinoma: Implications for personalized treatment
in patients. Mol Cancer Ther. 14:2874–2886. 2015. View Article : Google Scholar : PubMed/NCBI
|
|
47
|
Fanale D, Amodeo V and Caruso S: The
interplay between metabolism, PPAR signaling pathway, and cancer.
PPAR Res. 2017:18306262017. View Article : Google Scholar : PubMed/NCBI
|