Introduction
Cholangiocarcinoma (CCA), a malignancy that arises
from cholangiocytes, is highly endemic in Southeast Asia,
particularly in northeastern Thailand (1). Chronic biliary tract inflammation due
to liver fluke [Opisthorchis viverrini (OV)] infection
together with exposure to carcinogens associated with poor hygiene
is the most common risk factor for CCA in the endemic areas
(1). At present, the prognosis of
patients with CCA is generally poor due to lack of early detection
(2). Accurate surveillance
guidelines (used to detect the presence of CCA) for healthy
individuals or patients with benign biliary diseases are yet to be
determined (2). Imaging techniques,
such as magnetic resonance imaging (MRI), magnetic resonance
cholangiopancreatography and ultrasonography, may aid the early
detection of CCA; however, these modalities are expensive and/or
invasive (3). Serum carbohydrate
antigen 19-9 (CA19-9) level is recommended as a diagnostic tumor
marker but is reported to be insufficient to diagnose CCA (3,4). Other
tumor biomarkers, including carcinoembryonic antigen (CEA), mucin
5AC (5) and matrix metalloproteinase
7 (6), have a limited diagnostic
sensitivity and/or specificity, in particular, due to upregulation
of these biomarkers in benign biliary disease (BBD) (7). Therefore, the identification and
establishment of a reliable biomarker for the differential
diagnosis of CCA is required to improve the prognosis of patients
with CCA.
Coiled-coil domain containing 25 (CCDC25) is widely
expressed in mammalian cells. The gene encoding CCDC25 is located
on chromosome 8p21.1, and the protein produced is 208 amino acids
in length (molecular weight, ~25 kDa) (8). CCDC25 is found in the cytoplasm of
numerous cells, including hepatocytes and muscle cells (8). CCDC25 has not been detected in healthy
bile duct epithelial cells, and its function under physiological
conditions remains unknown (9).
A recent study revealed that CCDC25 could be
detected in CCA tissues but not in adjacent normal tissues, and
that migration of CCA cells is activated by bile acids, especially
cholic acid, in association with upregulation of CCDC25 (10). However, whether CCDC25 is upregulated
and released in the sera of patients with CCA remains unknown. The
present study investigated CCDC25 expression in the sera of
patients with CCA and BBD as well as healthy controls (HC).
Subsequently, the diagnostic value of serum CCDC25 level was
compared with that of CEA and CA19-9. In addition, the correlation
between CCDC25 levels in serum and in CCA tissues was determined.
The associations between serum CCDC25 levels and the clinical
parameters of patients with CCA were also examined. The results
demonstrated that CCDC25 was upregulated in the sera of patients
with CCA, and serum CCDC25 level provided an improved resolution
between patients with BBD and CCA, compared with CEA and CA19-9
biomarkers. Furthermore, the applicability of serum CCDC25 level
for the differential diagnosis of CCA and its role in CCA are
discussed.
Materials and methods
Ethics statement
The present study was approved by the Human Ethics
Committee of Khon Kaen University (approval no. HE611410) and
written informed consent was obtained from each of the
participants.
Serum samples and sample size
calculation
In the preliminary study, 40 CCA, 20 BBD and 20 HC
sera were used to determine the median and quartile deviation of
CCDC25 relative intensity using a dot blot assay. The required
number of serum samples required to compare the mean/median between
two groups was calculated using the results obtained in the
preliminary study and the equation described by Suresh et al
(11) as follows: n=[(r+1)
σ2 (Zα/2 +
Zβ)2]/rd2, where n=the sample size
in each of the group; σ=the estimated variance of dot blot relative
intensity (standard deviation, SD); r=the ratio of sample size
required for two groups (generally this is 1);
d2=difference of dot blot relative intensity mean
between two groups=(µ1-µ2)2;
µ1=dot blot relative intensity mean in the CCA group;
µ2=dot blot relative intensity mean in the HC group or
BBD group; α=probability of type I error (2-sided)=0.05;
Z0.025=1.96; and β=probability of type II error=0.2,
Z0.2=0.84.
Bioinformatics software used for
secretory protein prediction
In the present study, three bioinformatics software
programs were used for the prediction of the secretory protein
nature of CCDC25: i) signalP software (version 5.0; Department of
Bio and Health Informatics, Technical University of Denmark) which
predicts signal peptide cleavage sites in amino acid sequences
using a D-score >0.45 (12); ii)
SecretomeP software (version 2.0; Department of Bio and Health
informatics, Technical University of Denmark), which predicts a
non-classical secretory protein, which is any protein with a Neural
Network (NN) score >0.5 (13);
and iii) the Plasma Proteome Database (PPD 2014; Human Proteome
Organization; http://plasmaproteomedatabase.org/index.html), which
is one of the largest resources on plasma proteins (14), analyzed on 29th August, 2018.
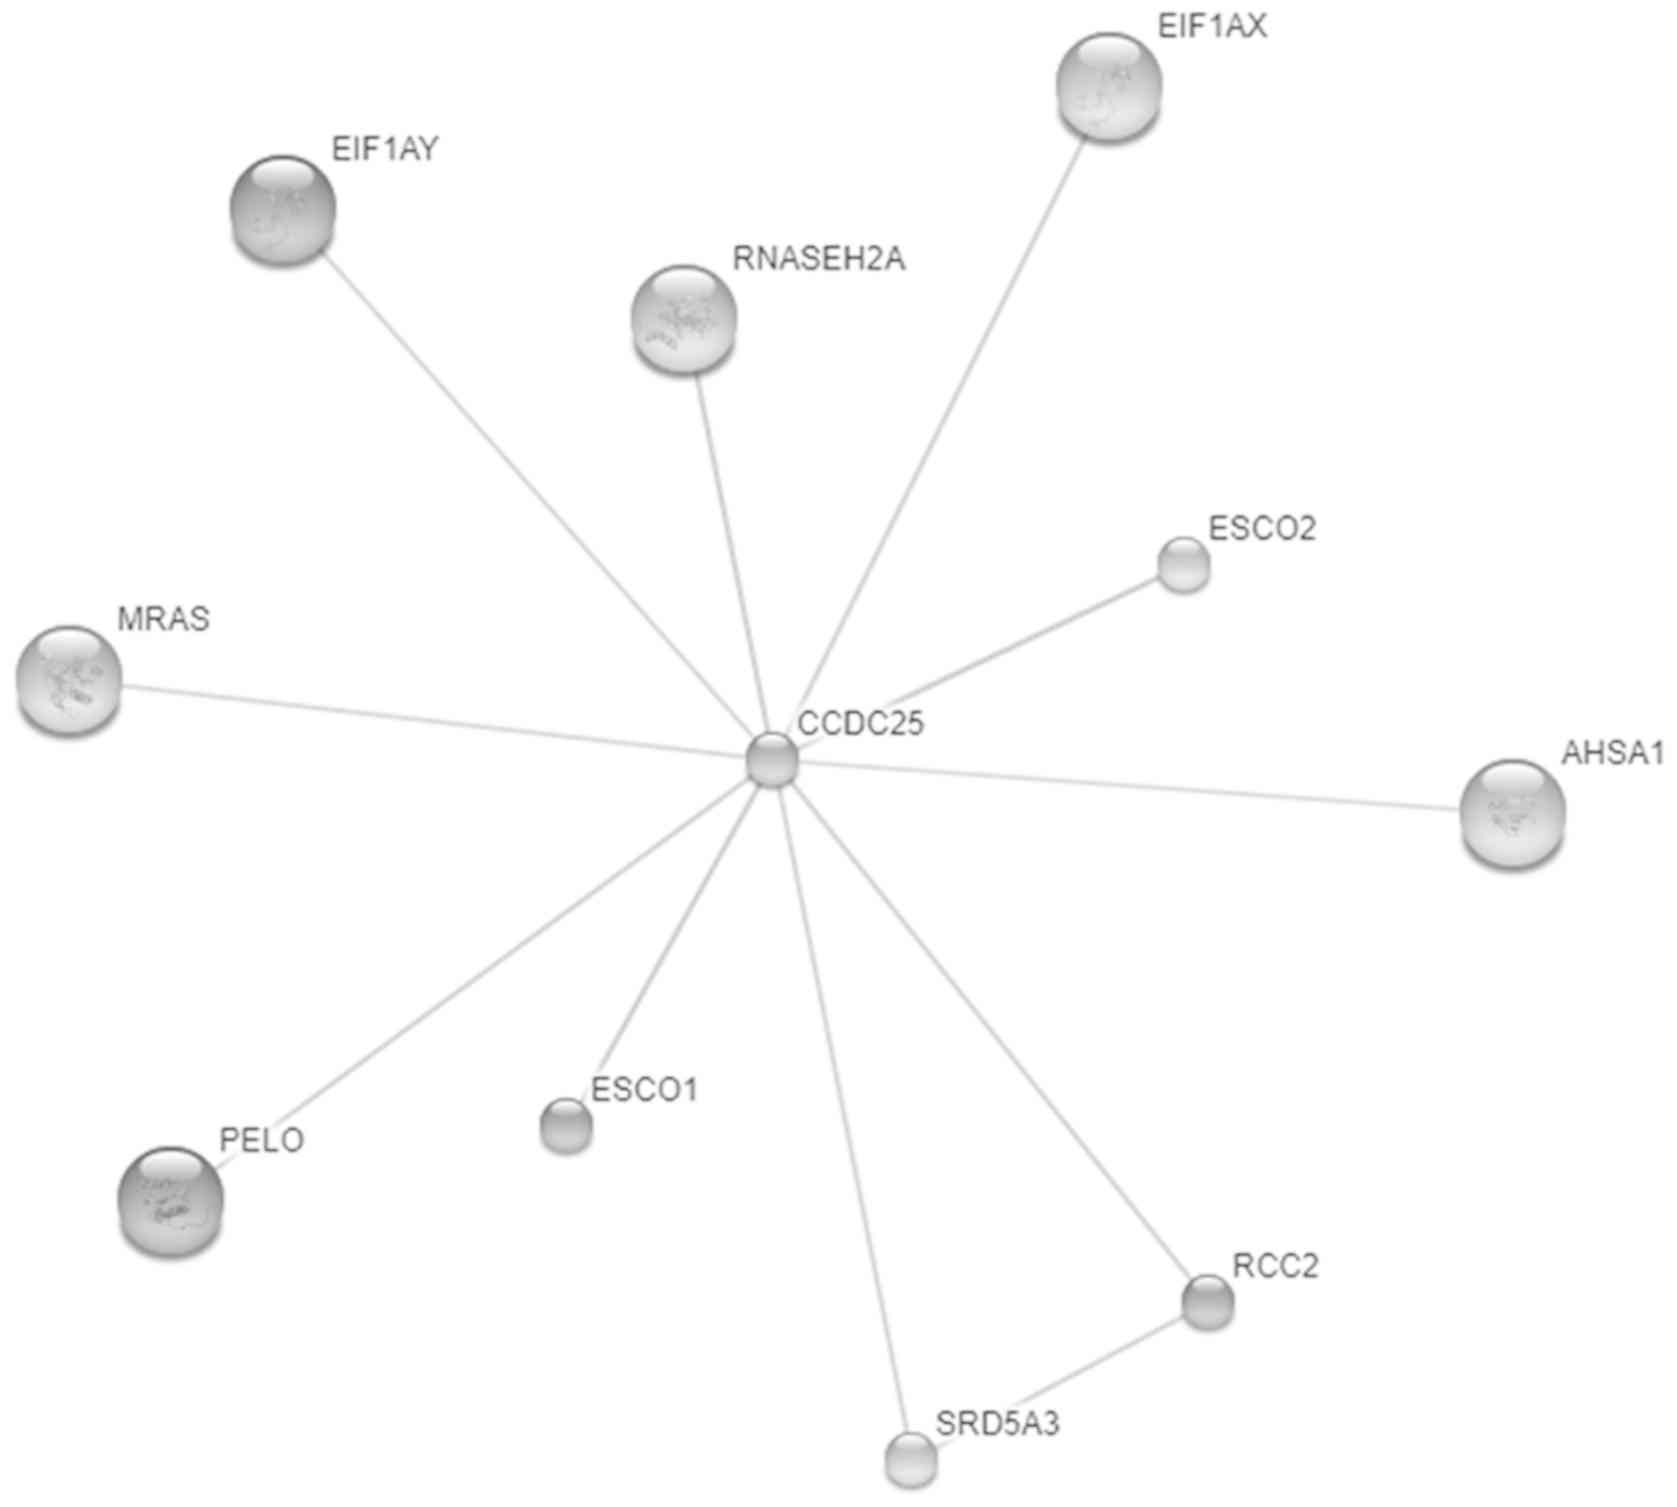
Moreover, Swiss Institute of Bioinformatics and NNF Center for
Protein Research (STITCH; v. 5.0; http://stitch.embl.de/) was used to analyze the
potential interactions of CCDC25 with other molecules. The output
page showed ‘list names’ followed by the confidence score and
proteins with a confidence score ≥0.4 were selected for further
analysis. Stronger associations were presented as thicker lines.
Protein-protein interactions were presented as solid lines,
chemical-protein interactions were presented as dashed lines and
chemical-chemical interactions as dotted lines. Interactions with a
protein interaction score >0.7 (according to STITCH) were
considered high confidence interactions (15).
Sera from patients with CCA, patients
with BBD and HC
The ratio of male: female patients in the HC, BBD
and CCA groups was 21:51, 40:13 and 96:45, respectively. The CCA,
BBD and HC serum samples were obtained from the Clinical Laboratory
of Srinagarind Hospital (Khon Kaen, Thailand). A total of 141 serum
samples from patients with CCA (median age ± quartile deviation,
60±6.5 years; range, 31–80 years) and 53 samples from patients with
BBD (median age ± quartile deviation, 60±8.5 years; range, 40–76
years), including 17 patients with chronic cholecystitis, 20
patients with chronic cholangitis and 16 patients with chronic
biliary inflammation who were diagnosed by biopsy, were collected
from the Cholangiocarcinoma Research Institute (CARI), Faculty of
Medicine, Khon Kaen University (Khon Kaen, Thailand) between
December 2014 and September 2017. Clinical laboratory data,
including serum CEA and CA19-9 levels, as well as clinical data
were obtained from the patient records database of the CARI. All
patients with CCA in the present study had stage 3–4 intrahepatic
Ov-associated CCA. Serum CA19-9 and CEA levels in the sera of
patients with CCA were determined by ELISA on a Roche cobas e 801
module (cat. no. Elecsys CEA Ass; cat. no. 04491777190 and Elecsys
CA19-9; cat. no. 11776193122; Roche diagnostics) in the clinical
diagnostic laboratory of Srinagarind Hospital, Khon Kaen
University, as previously described (16). In addition, 72 HC serum samples
(median age ± quartile deviation, 44±15 years; range, 19–85) were
recruited from the annual health check-up of individuals between 13
and 28th September 2018 at the Faculty of Associated Medical
Science AMS-KKU Excellence Laboratory), Khon Kaen University. Among
the HCs, those with abnormal liver function tests were excluded.
All serum samples were kept at −20°C until use.
Dot blot assay and data
acquisition
A nitrocellulose membrane (GE Healthcare) was soaked
in 1X Tris-buffer saline with 0.1% Tween-20 (1X TBST) for 10 min
(room temperature) prior to setting on the Bio-Dot Microfiltration
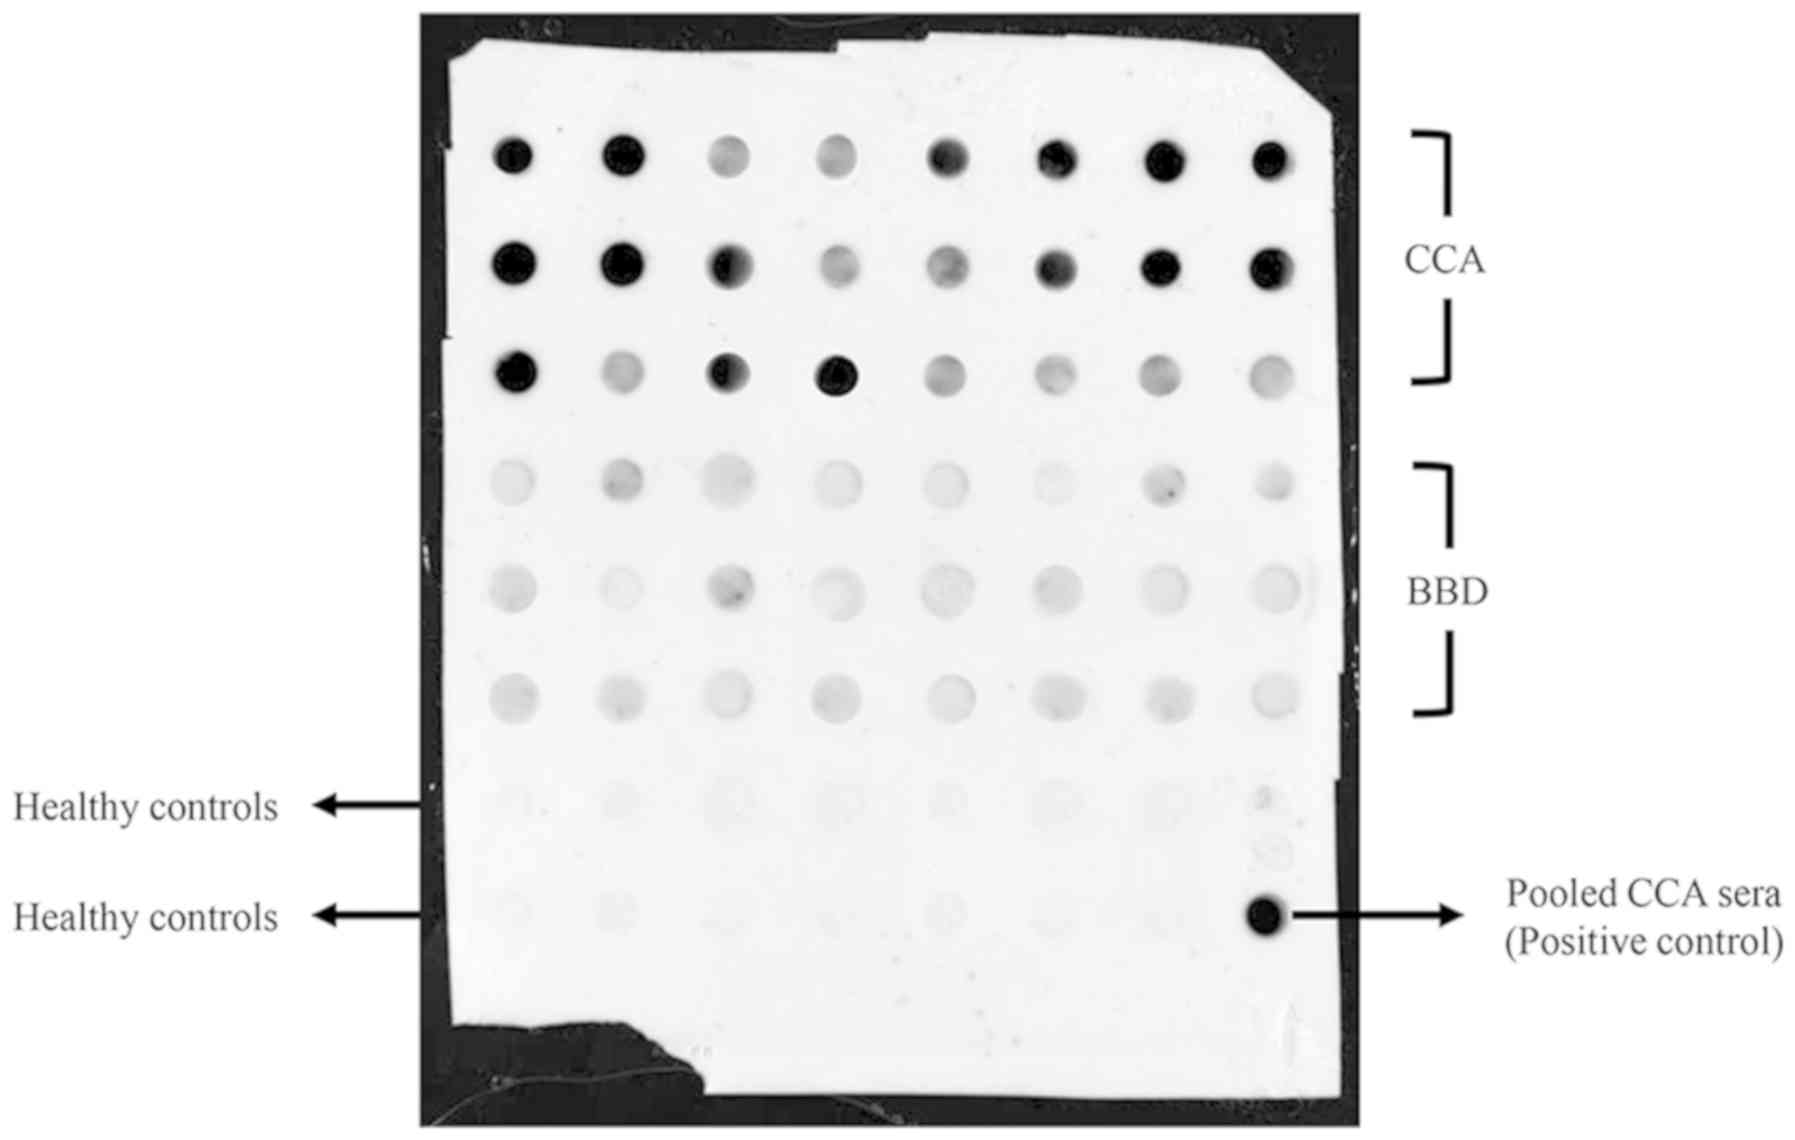
Apparatus (Bio-Rad Laboratories, Inc.). The pooled CCA sera were
used as a positive control for the normalization of the intensity
of CCA, BBD and HC serum samples. The relative intensity of each
sample spot was calculated by comparison with that of the positive
control as preivously described (17,18).
Each serum sample was diluted to 1:3 with normal saline and 2 µl of
each sample was spotted onto the membrane using a Bio-Dot
Microfiltration Apparatus (Bio-Rad Laboratories, Inc.). The
membrane was soaked in 5% skimmed milk in 1X TBST for 1 h at room
temperature to prevent non-specific binding. The membrane was then
incubated with a rabbit polyclonal primary antibody against human
CCDC25 (1:500; cat. no. orb2517; Biorbyt Ltd.) overnight at 4°C.
The membrane was washed with 1X TBST and then incubated with a
horseradish peroxidase-conjugated goat anti-rabbit IgG secondary
antibody (1:10,000; cat. no. 31460; Invitrogen; Thermo Fisher
Scientific, Inc.) for 1 h at room temperature, followed by washing
with 1X TBST. The chemiluminescent signal was detected using an
Enhanced Chemiluminescence plus reagent (GE Healthcare) and
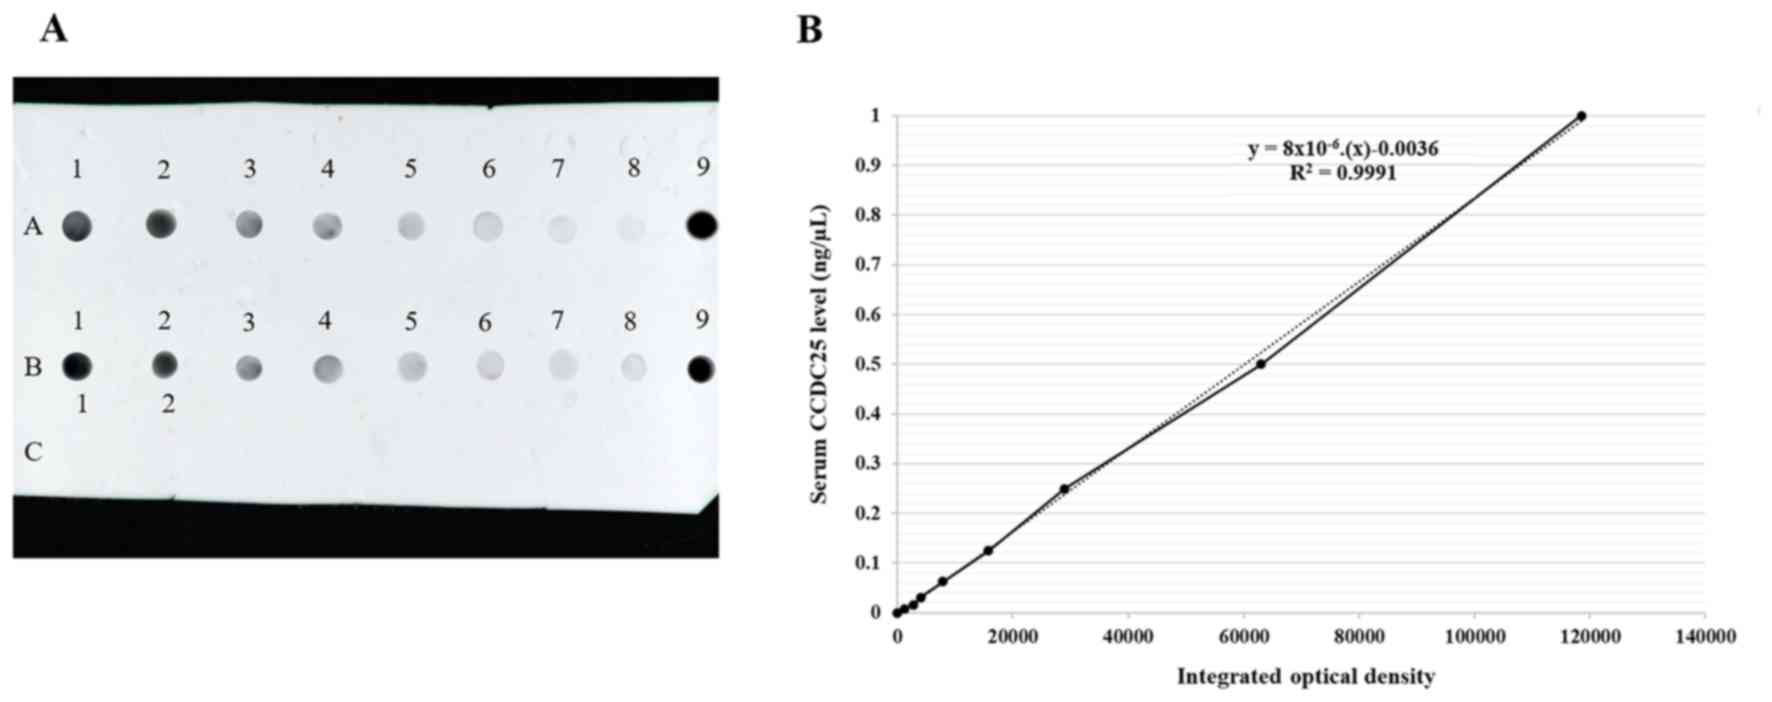
quantified on an Amersham imager 600 (GE Healthcare). The CCDC25
concentration in each serum sample was calculated based on the
standard curve prepared using the standard recombinant CCDC25
protein (cat. no. orb424527; Biorbyt Ltd.). The original stock of
known concentration (1 µg/µl) was diluted to 1 ng/µl, followed by
the preparation of serial dilutions of 1, 0.5, 0.25, 0.125, 0.0625,
0.0313, 0.0156 and 0.0078 ng/µl (Fig.
1). Dot blot results were normalized using positive controls
(pooled CCA serum samples) with ImageJ software (version 1.52d;
National Institutes of Health).
Paraffin-embedded CCA tissue
samples
A total of 23 pairs of adjacent non-cancerous and
cancerous tissue samples were obtained from 23 patients with CCA
that were diagnosed by a biopsy procedure at the Cholangiocarcinoma
Research Institute, Faculty of Medicine, Khon Kaen University
between June 2015 and March 2017. The 23 patients included seven
patients with non-metastatic CCA [high serum CCDC25 level (>0.2
ng/µl) and a long survival time (>377 days)] and 16 patients
with metastatic CCA [high serum CCDC25 level but lower than median
value of serum CCDC25 level in non-metastatic CCA and a short
survival time (<377 days)]. The CCA tissues were
paraffin-embedded and sectioned, placed on slides coated with
commercial acetone mixed with 3-Aminopropyl triethoxysilane and
deionized water, and stored at room temperature. The CCA sections
were used to validate CCDC25 expression in sera obtained from
patients with CCA. The present study used as many paraffin-embedded
CCA sections that could be included according to the following
inclusion criteria: i) CCA tissues had matched CCA serum samples
for IHC analysis; ii) The CCD25 concentration was higher than
cut-off value in serum; iii) The status of tissues from
non-metastatic patients with CCA was alive and patients with
metastatic CCA; and iv) Survival time was higher than median for
non-metastatic CCA, and lower than the median for metastatic CCA
(median, 377 days).
Immunohistochemistry
The 23 paraffin-embedded CCA tissue sections were
heat-fixed at 60°C in a hot air oven for 30 min. The sections were
then deparaffinized by soaking in xylene three times for 5 min
each, rehydrated by soaking in absolute ethanol and 95% ethanol
twice for 2 min each, followed by 70% ethanol for 2 min. Antigen
retrieval was performed by boiling the sections in 0.01 M citrate
buffer pH6.0 (Abcam) for 10 min, followed by incubation at room
temperature for 10 min and washing in 1X PBS for 5 min.
Subsequently, endogenous peroxidase activity was blocked with 3%
H2O2 in methanol for 1 h (room temperature)
in the dark and non-specific binding was blocked with 20% fetal
bovine serum (Gibco; Thermo Fisher Scientific, Inc.) for 2 h at
room temperature. The sections were then incubated with 200 µl
rabbit anti-CCDC25 polyclonal antibody (1:400; cat. no. orb2517;
Biorbyt Ltd.) overnight at 4°C. The sections were washed twice with
1X PBS-T for 10 min each then incubated with 200 µl anti-rabbit Ig
antibody (commercial Dako EnVision+ System- HRP Labelled Polymer
Anti-Rabbit; Code K4003; cat. no. LOT 10147964) (Dako; Agilent
Technologies, Inc.) for 1 h. The signal was then developed by
incubation with 3,3′-diaminobenzidine (Dako; Agilent Technologies,
Inc.) for 5 min in the dark at room temperature. The sections were
washed with running water for 5 min and counterstained with
hematoxylin for 5 min at room temperature. The sections were then
dehydrated by soaking for 2 min each in 70% ethanol, 95% ethanol,
absolute ethanol and for 5 min in xylene. Finally, the sections
were mounted with Permount™ (Thermo Fisher scientific, Inc.) and
sealed with a cover glass. A light microscope was used for staining
visualization.
The staining was assessed using the H-score method,
recording both the intensity of staining (0=no staining; 1+=weak
staining; 2+=moderate staining; and 3+=strong staining) and the
percentage of stained tumor cells, which results in an H-score
between 0 and 300 for each sample (19). Immunohistochemistry results were
obtained from ten fields per sample and averaged to decrease the
variation in detection (magnification, ×400). The H-score was
calculated as a sum of the intensity as follows (19): H-score=(% of positively stained tumor
cells at weak intensity ×1) + (% of positively stained tumor cells
at moderate intensity ×2) + (% of positively stained tumor cells at
strong intensity ×3).
Statistical analysis
The data are presented as the median ± quartile
deviation and the range (minimum to maximum). Comparisons among two
independent, two dependent and three groups were performed using a
Mann-Whitney U test, a paired Student's t-test and a Kruskal-Wallis
test (and Dunn-Bonferroni post-hoc anlaysis), respectively. The
associations and correlations between the clinical data of patients
and the serum CCDC25 level were analyzed using the χ2
test and Spearman's correlation test, respectively. The
Mann-Whitney U test was used to compare low and high serum CCDC25
levels. Kaplan-Meier analysis was used to estimate the overall
survival time, and the Log-rank test was used to compare
differences in the curves. In addition, a receiver operating
characteristic (ROC) curve was used to determine the cut-off values
to obtain the highest sensitivity and specificity values. GraphPad
Prism software (version 5; GraphPad Software Inc.) and SPSS
software (version 16; SPSS, Inc.) were used for statistical
analyses. P<0.05 was considered to indicate a statistically
significant difference.
Results
Bioinformatics analysis to predict the
secretory protein nature of CCDC25
SignalP software predicts that a protein is
secretory via a conventional pathway if the D-score is >0.45
(12). However, CCDC25 was found to
have a D-score of 0.18, suggesting that CCDC25 is not secreted via
a conventional endoplasmic reticulum (ER)-Golgi pathway. SecretomeP
software predicts that a protein is secreted via a non-conventional
route if the NN score is >0.5. CCDC25 was found to have an NN
score of 0.77. In addition, CCDC25 is listed as a plasma protein in
the PPD (20). Moreover, STITCH
software showed the interactions between CCDC25 and muscle RAS
oncogene homolog, eukaryotic translation initiation factor 1A,
Y-linked (EIF1AY), eukaryotic translation initiation factor 1A,
X-linked, ribonuclease H2, subunit A; catalytic subunit of RNase
HII, establishment of cohesion 1 homolog 1/2 (ESCO1/2),
establishment of cohesion 1 homolog 2 (ESCO2), activator of heat
shock 90 kDa protein ATPase homolog 1, regulator of chromosome
condensation 2 (RCC2), steroid 5 α-reductase 3 and pelota homolog
all had a confidence score >0.4 (Fig.
2).
Serum CCDC25 levels in the CCA, BBD
and HC groups
The preliminary results demonstrated that the median
and quartile deviation of CCDC25 relative intensity in CCA, BBD and
HC sera were 0.95±1.25, 0.48±1.03 and 0.03±0.07, respectively.
Thus, according to the aforementioned equation, the minimum sample
size necessary for comparison of the median between the CCA and HC
group was 8, and the minimum sample size necessary for the
comparison between the CCA and BBD groups was 92. A representative
dot blot image of CCDC25 levels in serum samples is presented in
Fig. 3. The demographic and clinical
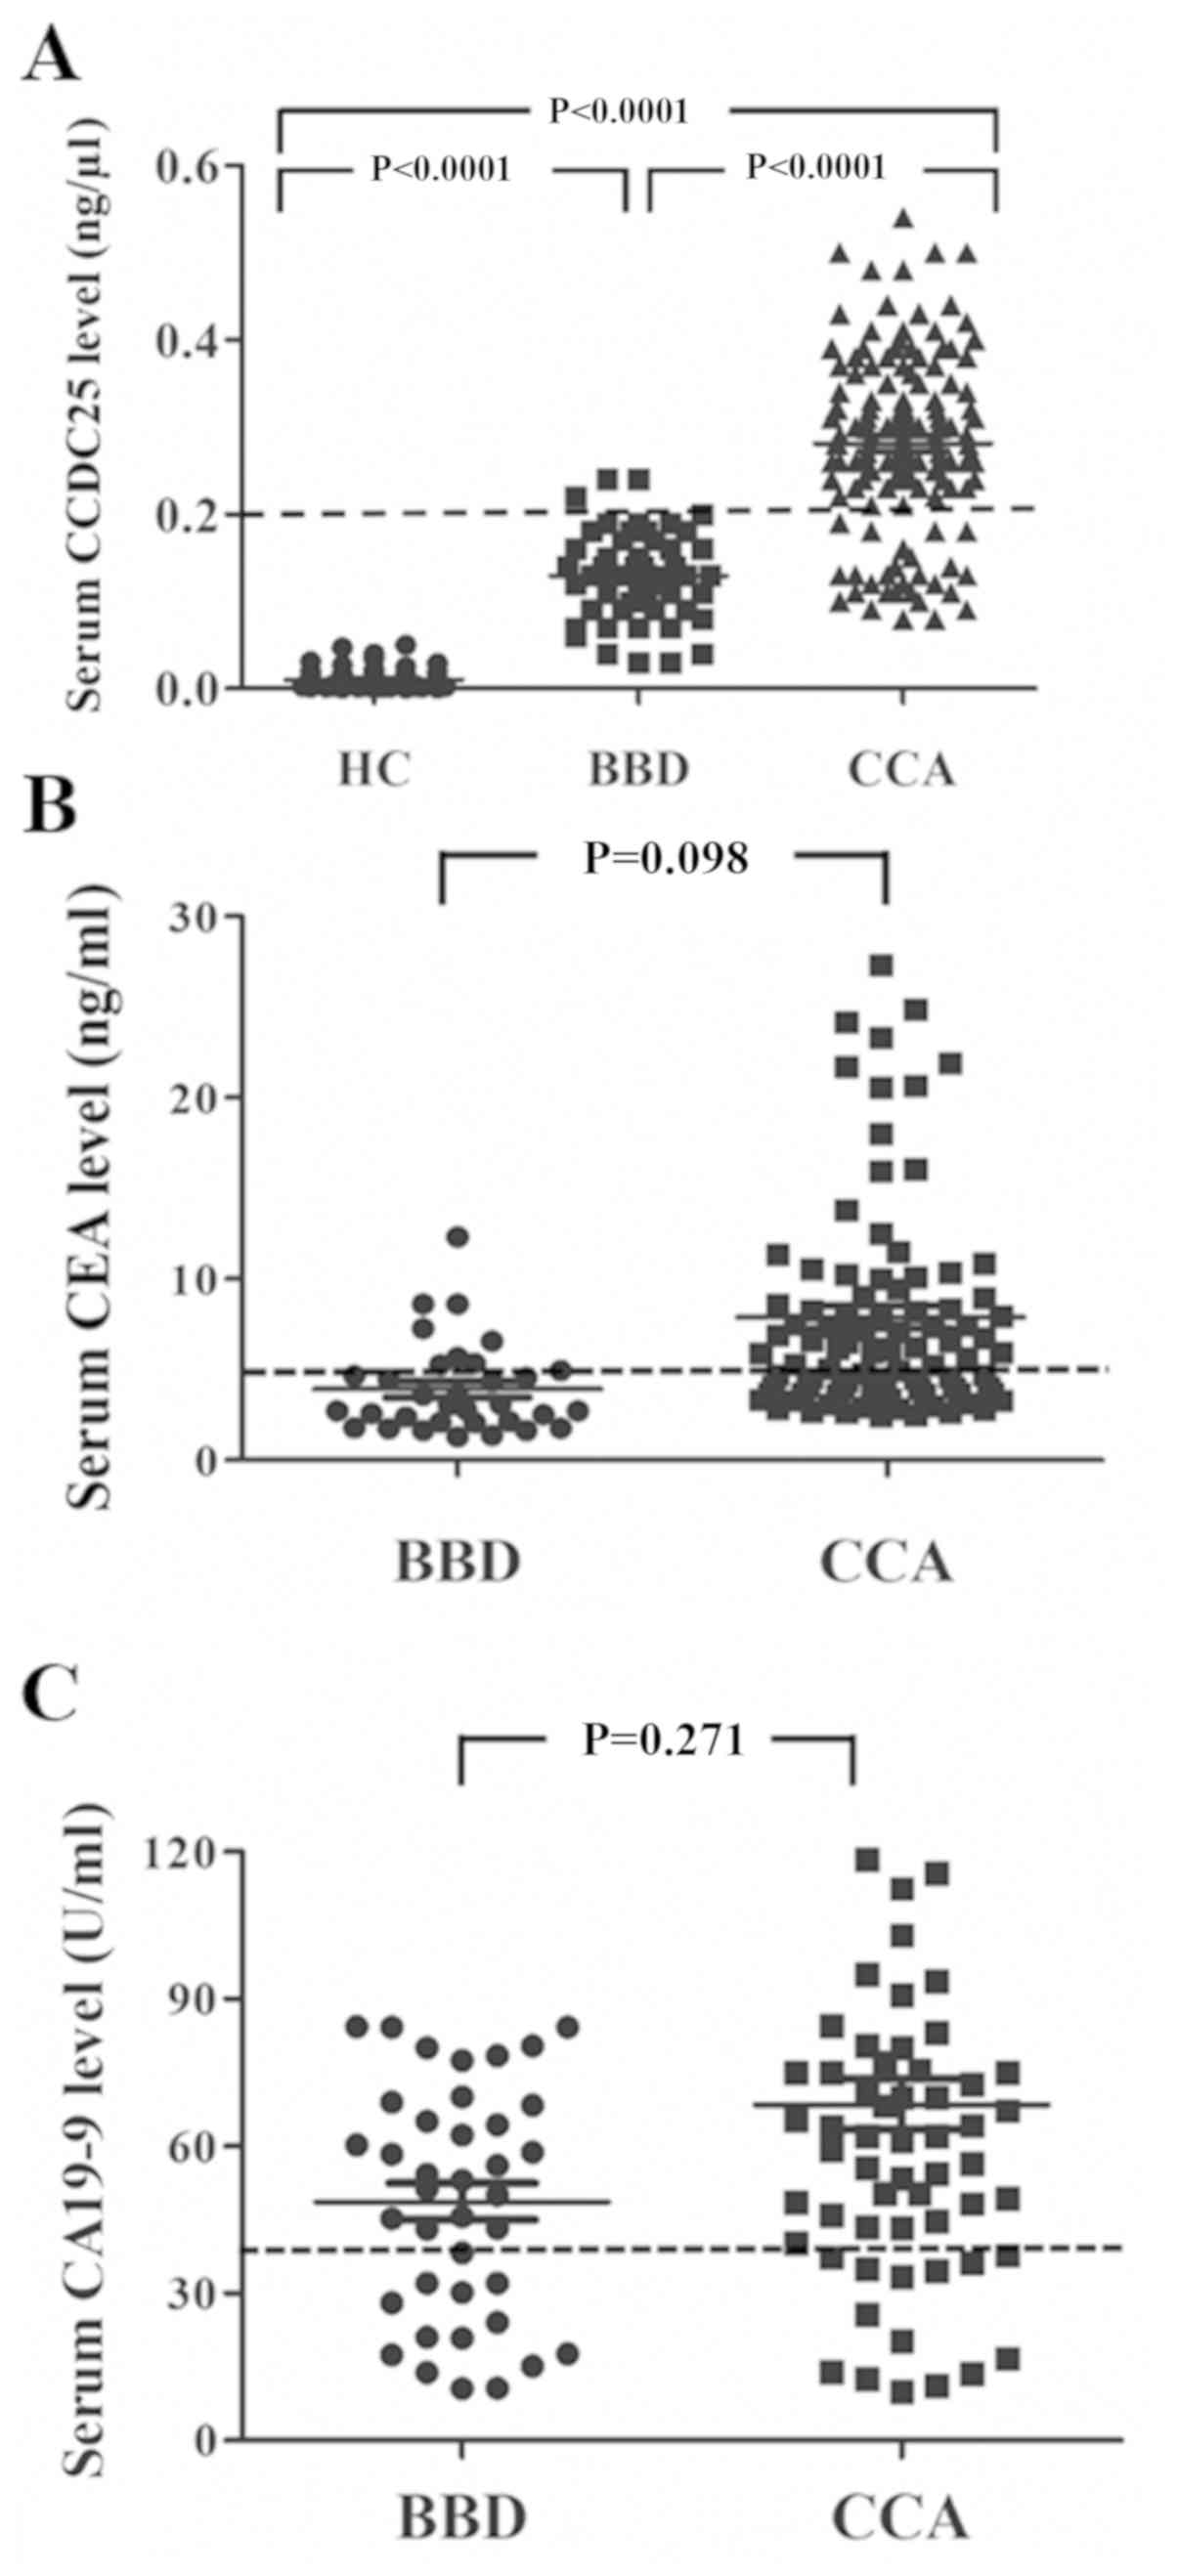
data of the participants are summarized in Table I. CCDC25 levels in the sera of 141
patients with CCA, 53 patients with BBD and 72 HC were measured
using dot blot analysis based on a CCDC25 standard curve (Fig. 1). As presented in Fig. 4A, the median CCDC25 level in the sera
of patients with CCA was significantly higher compared with that of
patients with BBD or HC. As presented in Fig. 4A, CCDC25 levels of patients with CCA
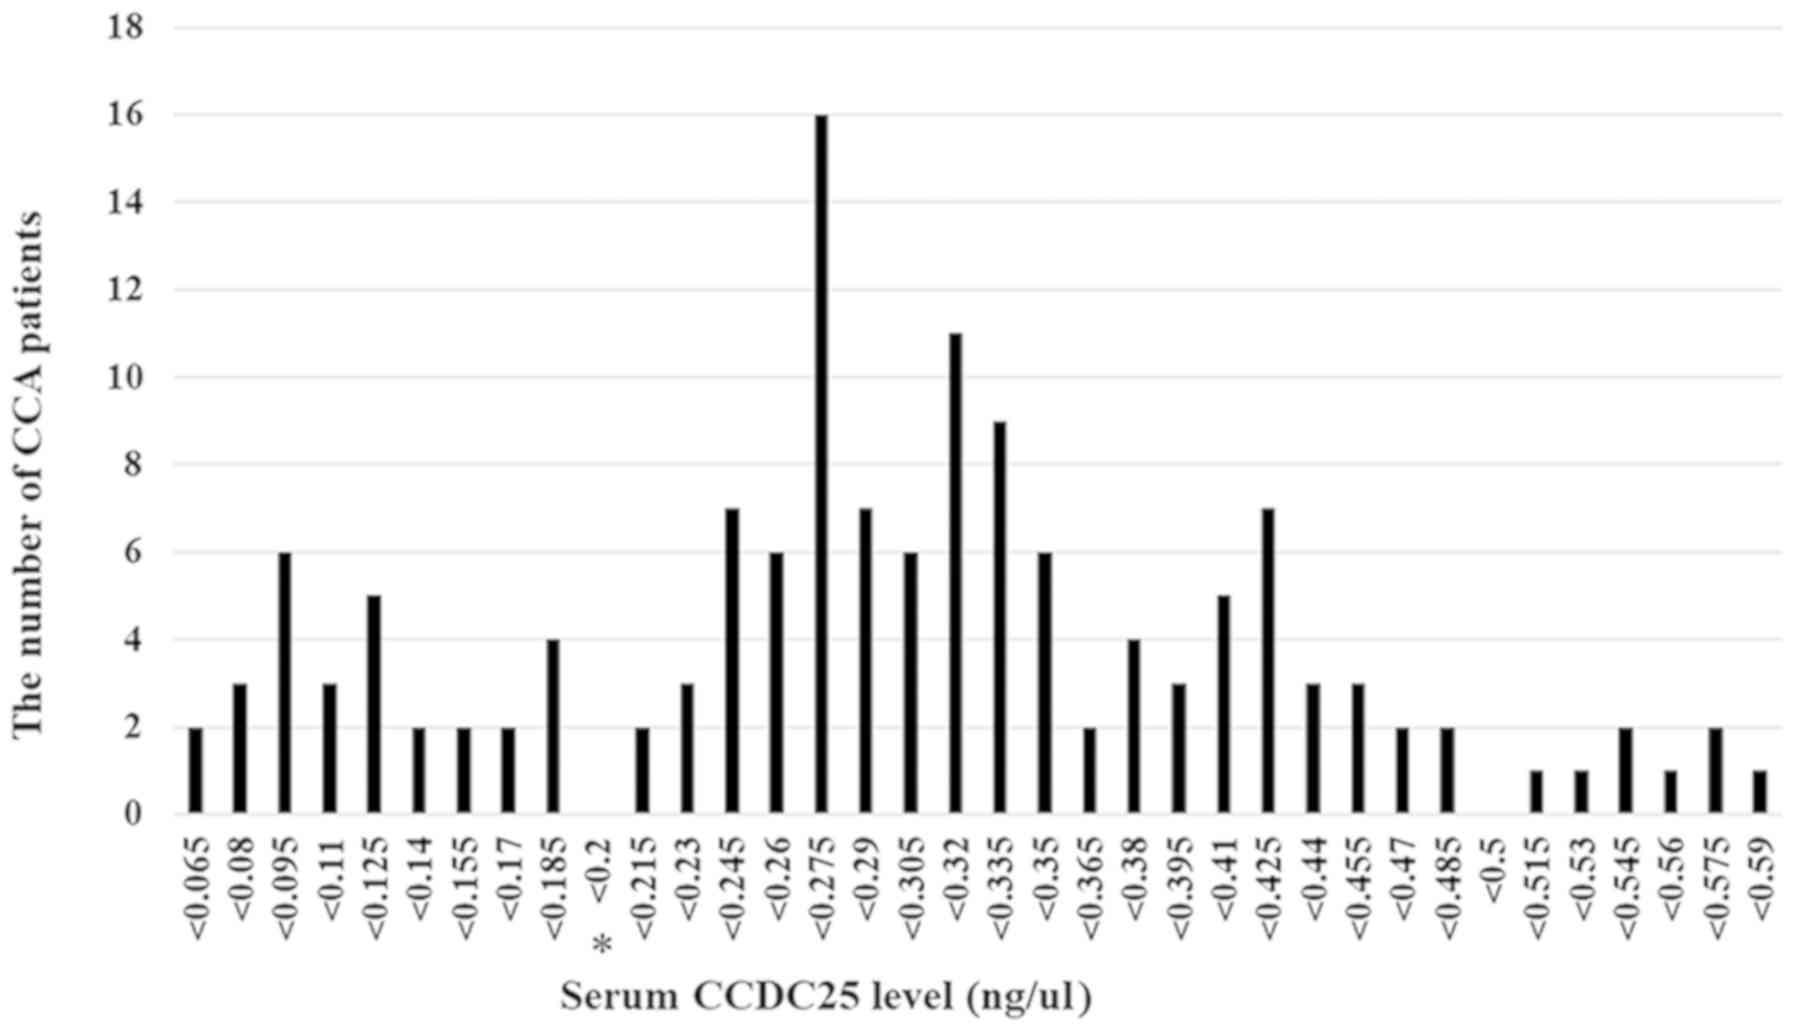
appeared to be divided into high and low groups. Therefore, the
distribution pattern of patients with CCA was investigated based on
their serum CCDC25 levels (Fig. 5).
From this distribution pattern, a difference was identified between
the low (n=29) and high (n=112) CCDC25 groups at concentrations of
0.185 and 0.215 ng/µl. Accordingly, a cut-off value of 0.2 ng/µl
was set to classify the low and high CCDC25 groups. The results
demonstrated that 112 of 141 CCA cases were in the high CCDC25
group, whereas only three of 53 BBD cases were in the high CCDC25
group (Fig. 4A).
 | Table I.Demographic and clinical
characteristics of the study cohort. |
Table I.
Demographic and clinical
characteristics of the study cohort.
| Parameter (normal
range) | HC, n=72 | BBD, n=53 | CCA, n=141 | P-value |
|---|
| Age | 44±15 (19–85) | 60±8.5a (40–76) | 60±6.5c (31–80) |
<0.001*** |
| Total protein
(6.5–8.8 g/dl) | NA |
7.3±0.4b
(5.9–8.7) |
7.45±0.5d (4.6–10.0) | 0.283 |
| Total bilirubin
(0.25–1.5 mg/dl) | NA |
0.8±1.2b
(0.2–31.7) |
0.6±0.8d
(0.2–24.9) | 0.219 |
| Direct bilirubin
(0–0.5 mg/dl) | NA |
0.4±1.1b
(0–24.3) |
0.3±0.6d
(0–13.7) | 0.073 |
| ALT (4–36 U/l) | 25±6 (7–85) |
44±24.5b
(1–795) | 38±21d (1–795) |
<0.001*,** |
| AST (12–32
U/l) | 21.5±5.4
(6–62) |
39±27.7b
(15–523) | 38±19d (4–1,112) |
<0.001*,** |
| ALP (42–121
U/l) | 50±8.2 (1–98) |
186±87.7b (75–719) |
165.5±78.5d (35–1,068) |
<0.001*,** |
| CA19-9 (0–37
U/ml) | NA |
53.4±26.3e (0.6–87.6) |
73.5±29.8f (1.6–119.7) | 0.271 |
| CEA (0–5
ng/ml) | NA |
3.9±2.6g
(0.6±13.8) |
5.7±5.1h
(0.9–28.9) | 0.098 |
| Survival time
(days) | NA | 1,871±140
(137–3,025) | 456±59d (139–2,277) | 0.02*** |
Evaluation of serum CCDC25 level for
the diagnosis of CCA
The data in Fig. 4A
revealed that serum CCDC25 level was a good biomarker to
discriminate between BBD and CCA. The diagnostic capability of
CCDC25 was further compared with that of CEA and CA19-9. As
presented in Fig. 4B and C, the
serum CEA and CA19-9 levels were not significantly different
between the BBD and CCA groups; however, both markers tended to be
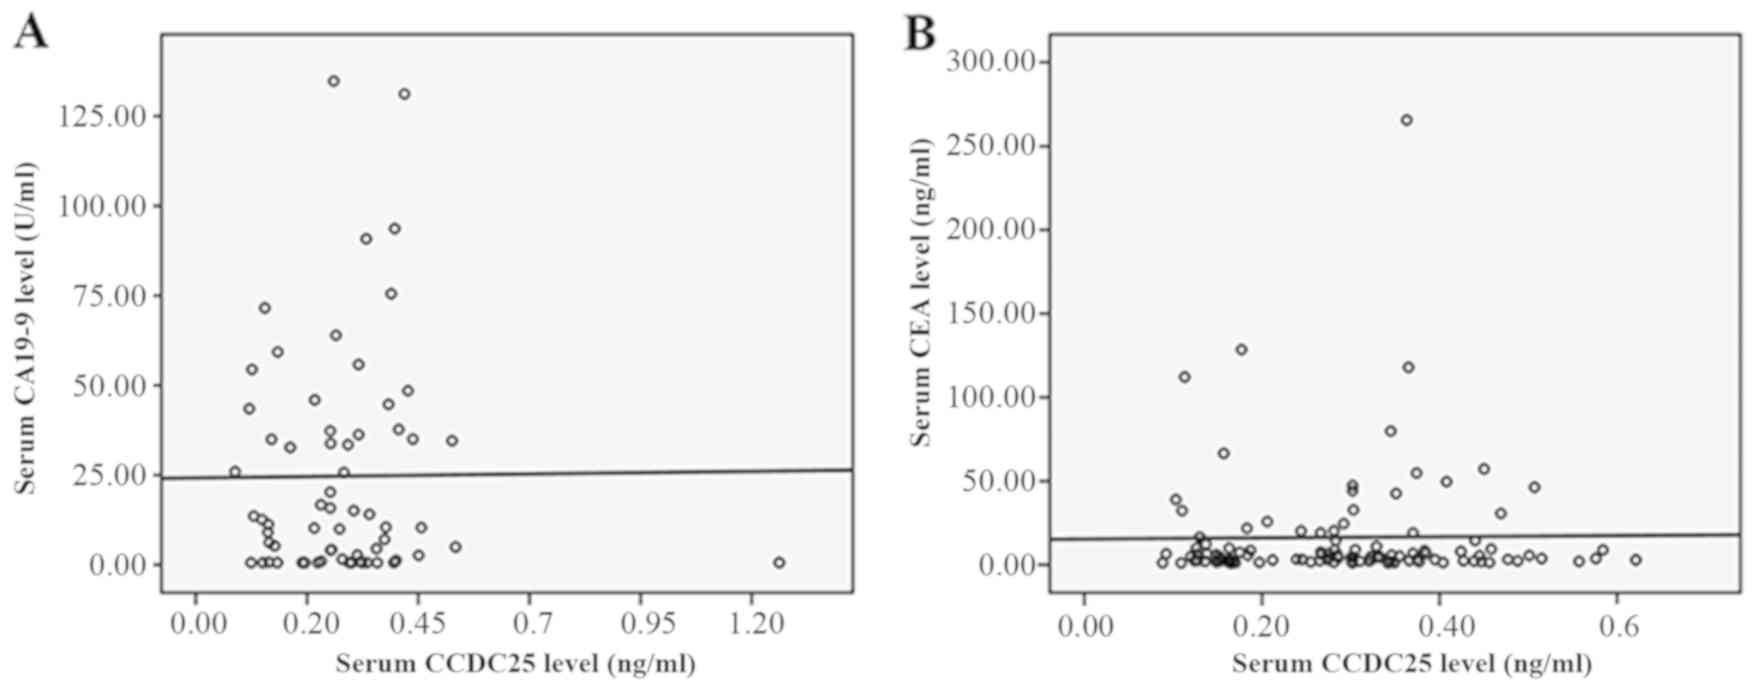
higher in the CCA group compared with the BBD group. When
correlation analyses were performed between serum CCDC25 level and
CEA or CA19-9 levels, no correlation was observed, as presented in
Fig. 6A and B. This suggested that
CCDC25 may serve as an independent biomarker in CCA.
To elucidate further whether serum CCDC25 level can
be used to diagnose CCA, ROC curve analysis was performed for the
CCA, BBD and HC groups (Figs. 7 and
8A; Table II) Between the CCA and HC groups,
the sensitivity and specificity of the serum CCDC25 levels were
93.0 and 100%, respectively, with a cut-off value of 0.11 ng/µl
(P<0.0001). Between the BBD and HC groups, the sensitivity and
specificity were 98.1 and 90.4%, respectively, with a cut-off value
of 0.045 ng/µl (P<0.0001). Between the BBD and CCA groups, the
sensitivity and specificity were 75.0 and 84.0%, respectively
(P<0.0001). In contrast to CCDC25, serum CA19-9 level between
the BBD and CCA groups provided a sensitivity and specificity of
52.4 and 46.5%, respectively, with an area under the curve of 0.483
at a cut-off value of 105.4 U/ml (P=0.072). Similarly, the CEA
level between the BBD and CCA groups provided a sensitivity and
specificity of 54.4 and 60%, respectively, with an area under the
curve of 0.558 at a cut-off value of 19.6 ng/ml (P=0.274; Fig. 8B and C).
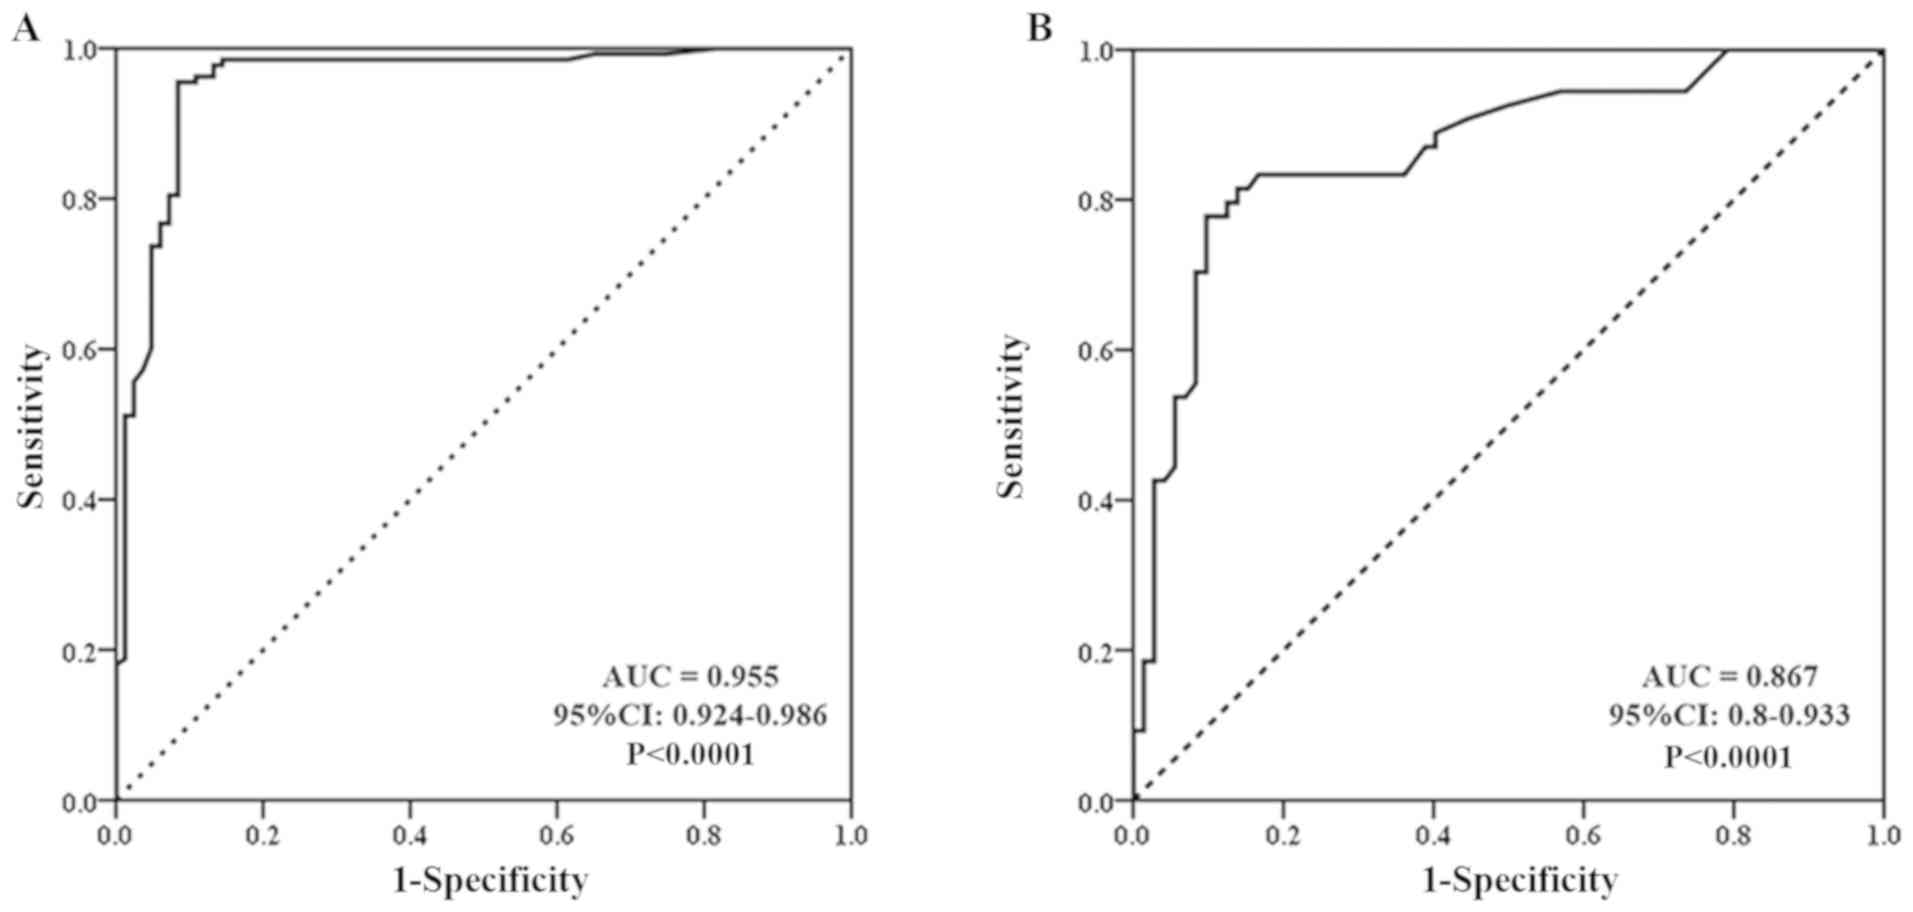
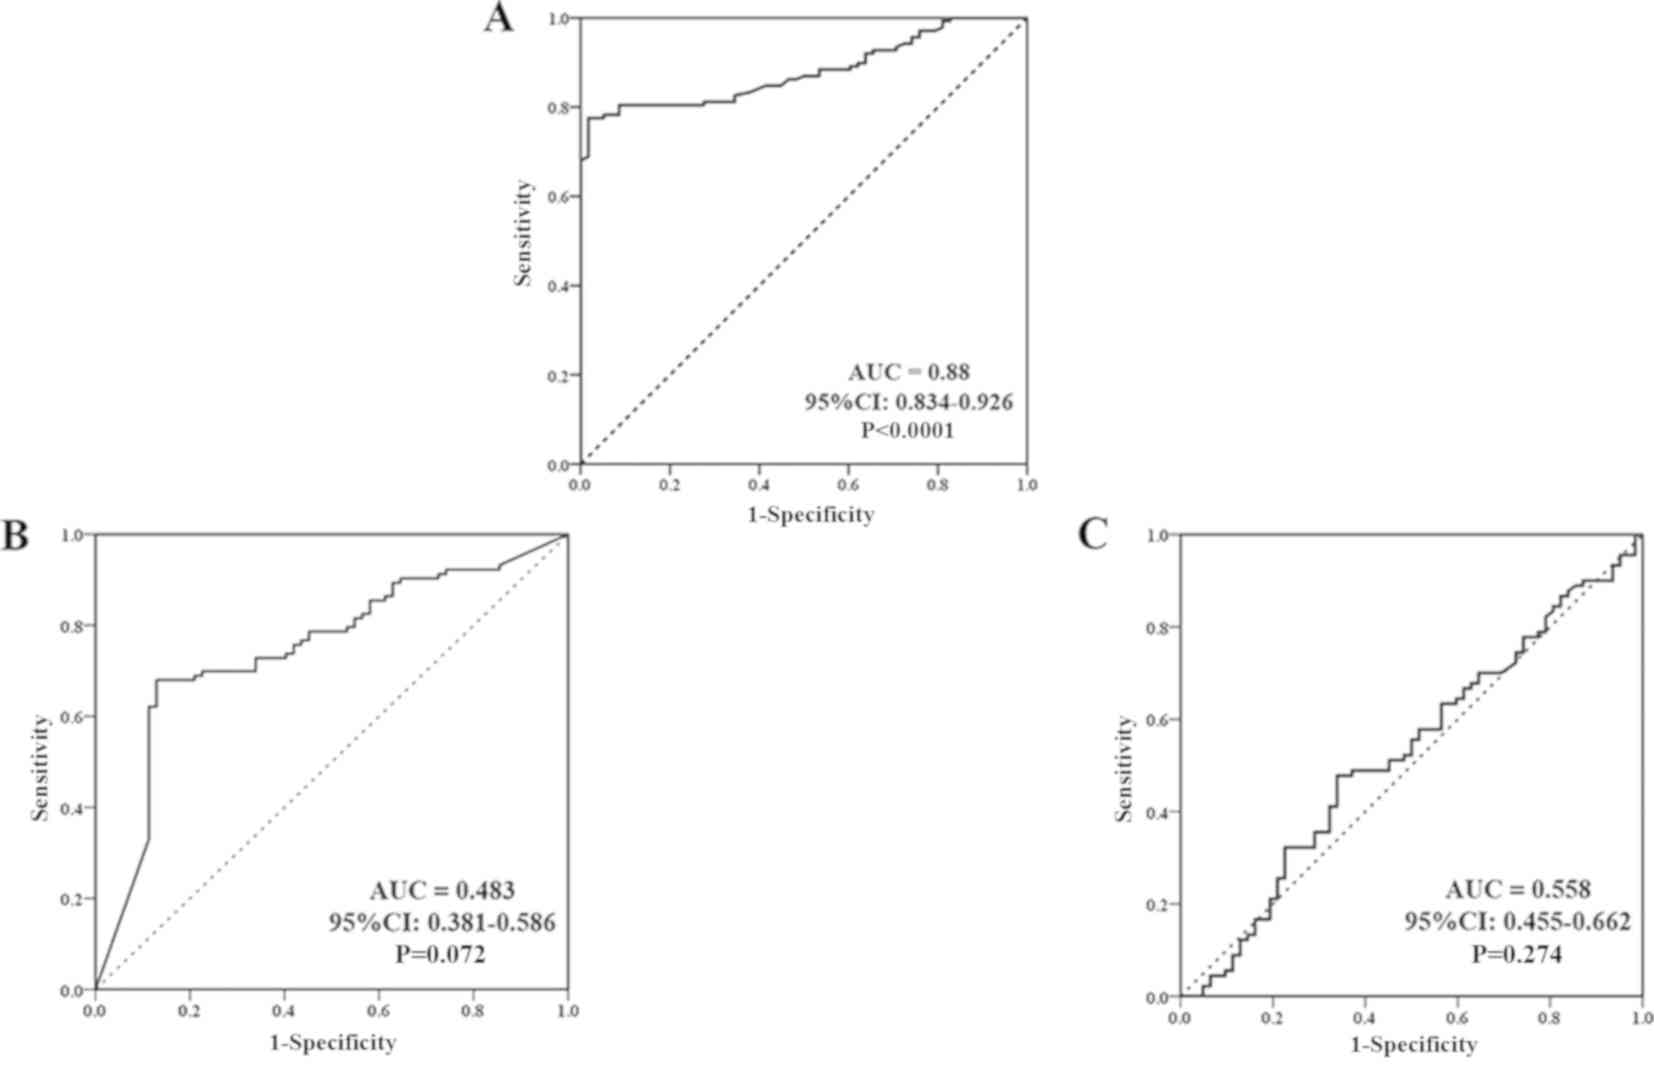 | Figure 8.ROC curve evaluation of CCDC25,
CA19-9 and CEA serum levels in the BBD and CCA groups. (A) ROC
curve of the CCDC25 level in the BBD and CCA groups represented 75%
sensitivity and 84% specificity, and a cut-off CCDC25 level of 0.18
ng/µl (B) ROC curve of serum CA19-9 level in the BBD and CCA groups
represented 52.4% sensitivity and 46.5% specificity, and a cut-off
CA19-9 level of 105.4 U/ml. (C) ROC curve of serum CEA level in the
BBD and CCA groups represented 54.4% sensitivity and 60%
specificity, and a cut-off CEA level of 19.6 ng/ml. ROC, receiver
operating characteristic; CCDC25, coiled-coil domain containing 25;
CA19-9, carbohydrate 19-9 antigen; CEA, carcinoembryonic
antigen; AUC, area under the curve; CI, confidence
interval. |
| Table II.Receiver operating charactersitic
curve analysis of the diagnostic value of CCDC25, CEA and CA19-9 in
CCA. |
Table II.
Receiver operating charactersitic
curve analysis of the diagnostic value of CCDC25, CEA and CA19-9 in
CCA.
| A, CCDC25 |
|---|
|
|---|
| Comparison | Sensitivity
(%) | Specificity
(%) | AUC | Cut-off value | P-value |
|---|
| CCA vs. HC | 93.0 | 100 | 0.955 | 0.110 ng/µl | <0.0001 |
| BBD vs. HC | 98.1 | 90.4 | 0.867 | 0.045 ng/µl | <0.0001 |
| CCA vs. BBD | 75.0 | 84.0 | 0.880 | 0.180 ng/µl | <0.0001 |
|
| B,
CA19-9 |
|
|
Comparison | Sensitivity
(%) | Specificity
(%) | AUC | Cut-off
value | P-value |
|
| CCA vs. BBD | 52.4 | 46.5 | 0.483 | 105.400 U/ml | 0.072 |
|
| C, CEA |
|
|
Comparison | Sensitivity
(%) | Specificity
(%) | AUC | Cut-off
value | P-value |
|
| CCA vs. BBD | 54.4 | 60.0 | 0.558 | 19.600 ng/ml | 0.274 |
Correlation between CCDC25 expression
in serum and CCA tissues
As presented in Fig.
4A, serum CCDC25 levels were notably low in the HC group and
were markedly high in patients with CCA. Thus, it was assumed that
serum CCDC25 is predominantly produced and released from CCA cells.
To test this hypothesis, 23 paraffin-embedded CCA tissues were
selected from the 141 patients with CCA whose sera were used to
evaluate the CCDC25 level. CCDC25 expression in CCA tissues was
demonstrated using immunohistochemical staining and the intensity
of CCDC25 expression in CCA tissues was determined using the
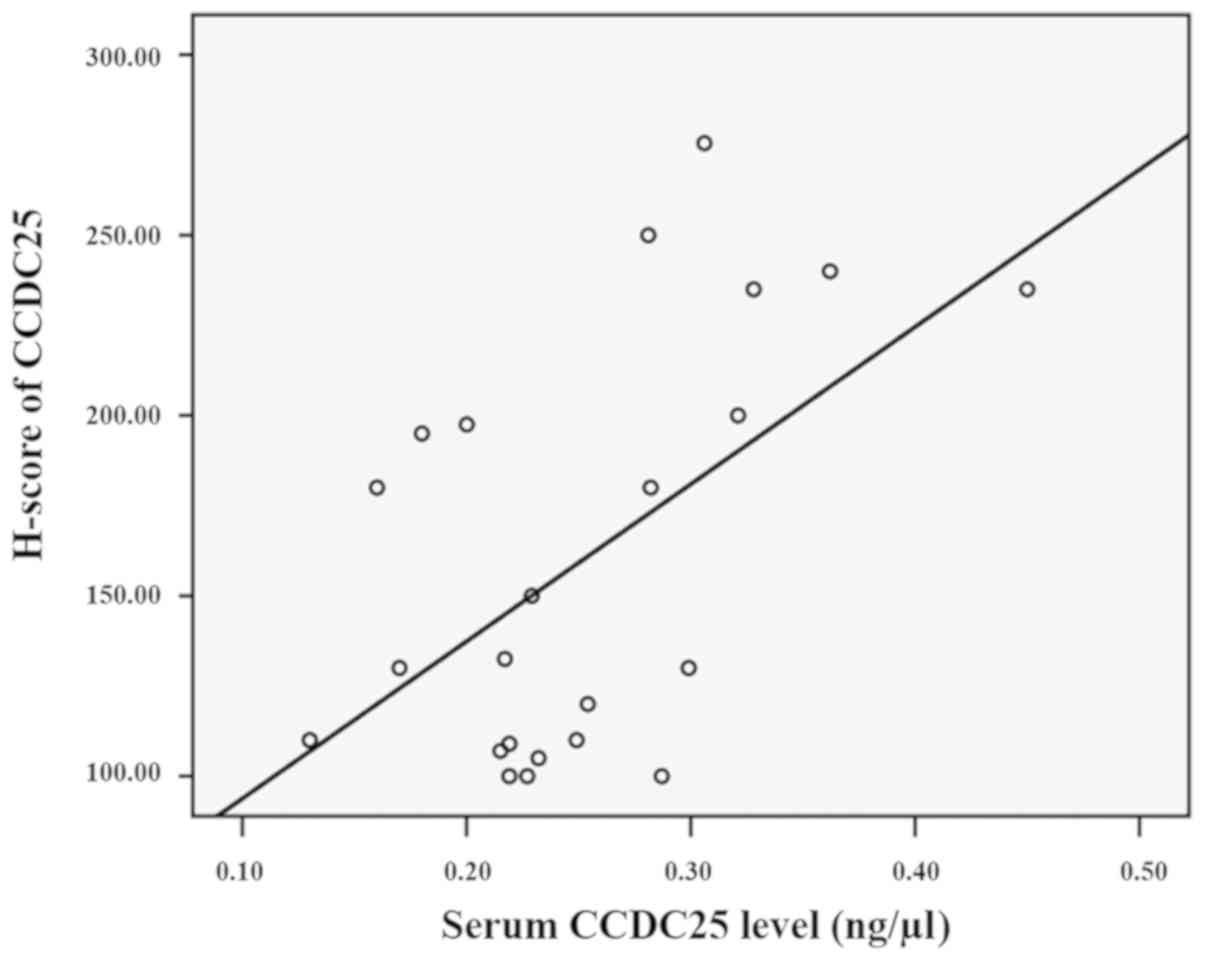
H-score system (19). Correlation
between the serum CCDC25 level and CCDC25 expression in the
corresponding CCA tissue was examined. The results revealed a
moderate correlation (21)
(r2=0.52, P=0.01) between serum and tissue CCDC25
expression levels, suggesting that serum CCDC25 is mainly derived
from CCA tissues (Fig. 9).
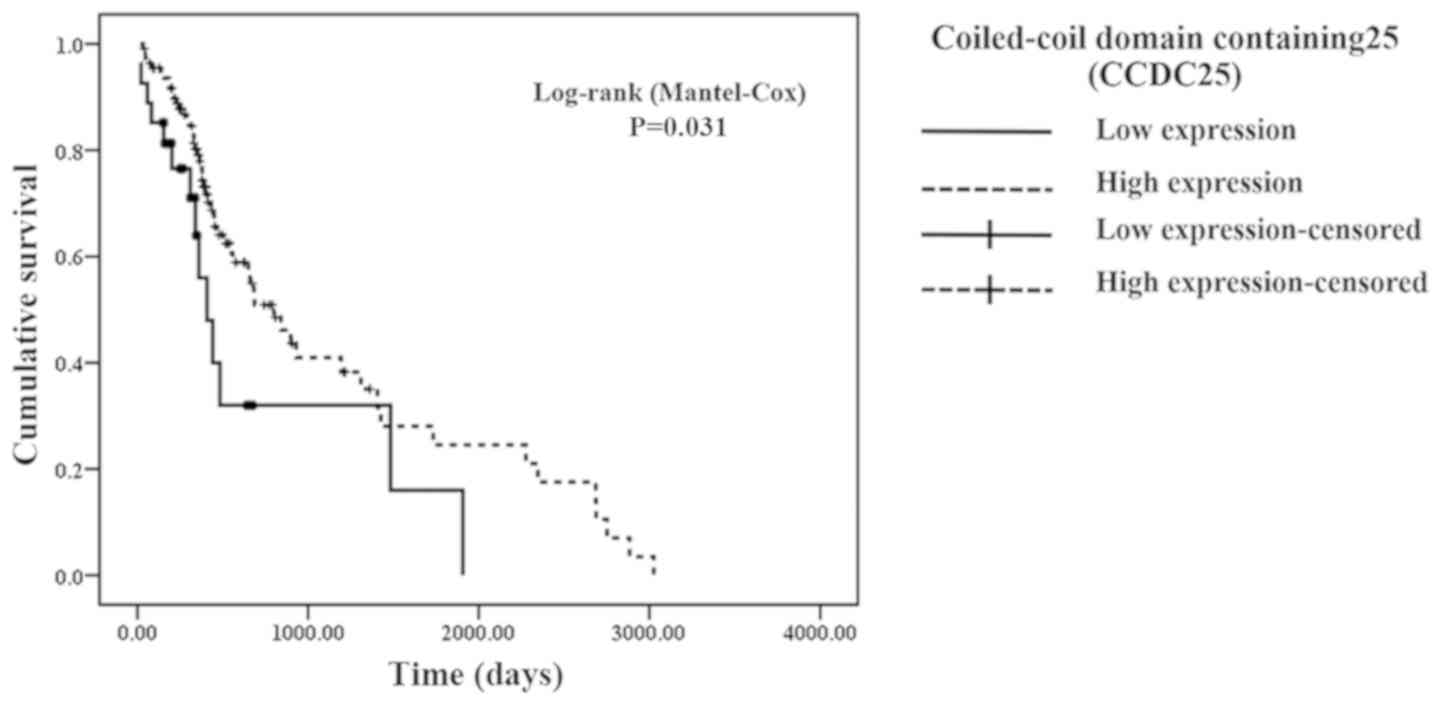
Associations of serum CCDC25 levels
with clinical parameters
To identify the possible clinical importance of
CCDC25, the associations between serum CCDC25 levels and clinical
parameters were examined. For this purpose, CCA patients were
divided into high serum CCDC25 and low serum CCDC25 groups, and the
distribution patterns of each clinical parameter in both groups
were analyzed (Table III). The
results demonstrated that a high serum CCDC25 level was associated
with patients with non-metastatic CCA. The median survival time was
longer for the high serum CCDC25 group compared with the low serum
CCDC25 group. Similarly, Kaplan-Meier analysis revealed that the
overall survival time of patients with CCA with high serum CCDC25
level was significantly longer compared with that of patients with
CCA with low CCDC25 level (365 vs. 242 days; P=0.031; Fig. 10).
| Table III.Association of patient clinical data
and low and high serum CCDC25 levels in patients with
cholangiocarcinoma. |
Table III.
Association of patient clinical data
and low and high serum CCDC25 levels in patients with
cholangiocarcinoma.
|
| Serum CCDC25 level
(ng/µl) |
|
|---|
|
|
|
|
|---|
| Clinicopathological
parameter | Low (<0.2)
(n=37) | High (>0.2)
(n=104) | P-value |
|---|
| Sex, n (%) |
|
Male | 24 (17.5) | 72 (51) |
|
|
Female | 13 (9.2) | 32 (22.3) | 0.30a |
| Lymph node
metastasis, n (%) |
| No | 6 (4.3) | 69 (50) |
|
|
Yes | 22 (15.9) | 41 (29.8) | 0.008*a |
|
Age | 60±6.2 (41,
76) | 60±6 (31, 80) | 0.978b |
| Liver function |
| Total
protein (6.5–8.8 g/dl) | 8.3±0.4 (5.6,
9.9) | 9.6±0.5 (4.6,
10) | 0.351b |
| Total
bilirubin (0.25–1.5 mg/dl) | 0.5±0.6 (0.3,
24.9) | 0.6±0.7 (0.2,
28.2) | 0.493b |
| Direct
bilirubin (0–0.5 mg/dl) | 0.2±0.5 (0.1,
13.7) | 0.3±0.6 (0,
22.9) | 0.763b |
| ALT
(4–36 U/l) | 30±13.2 (12,
339) | 41±19.7 (19,
795) | 0.213b |
| AST
(12–32 U/l) | 33±11.5 (14,
612) | 42±20 (4, 112) | 0.222b |
| ALP
(42–121 U/l) | 138±108.7 (63,
712) | 181±75.7 (35,
1,068) | 0.173b |
| Tumor marker |
|
|
|
| CEA
(0–5 ng/ml) | 3.9±5.9 (1.1,
28.9) | 5.3±4.1 (1.4,
31.5) | 0.623b |
| CA19-9
(0–37 U/ml) | 54.7±10.4 (1.1,
88.9) | 73.8±20.6 (1.2,
119.7) | 0.958b |
|
Survival time (days) | 242±108 (17,
1,907) | 365±199 (34,
3,025) | 0.03*b |
Discussion
In the present study, bioinformatics analyses using
SignalP, SecretomeP and PPD revealed that CCDC25 lacks a signal
peptide and therefore cannot be transported via a conventional
secretory pathway of the ER-Golgi system towards the plasma
membrane. However, a previous study used mass spectrometry to
reveal that CCDC25 was present in plasma obtained from healthy
individuals (20). The present study
demonstrated that, although the level was low, CCDC25 was detected
in the sera of HC, and a high expression level was detected in the
sera of the majority of patients with CCA. Thus, CCDC25 is
transported to the plasma membrane via an unconventional pathway.
Unconventional protein secretion is complex and comprises cargos
without a signal peptide or a transmembrane domain that can
translocate across the plasma membrane, and cargos that reach the
plasma membrane by bypassing the Golgi apparatus despite entering
the ER (22).
A previous study reported that CCDC25 was
upregulated in CCA tissues when compared with adjacent non-CCA
tissues (10). In the present study,
a quantitative dot blot assay based on the standard curve created
using standard CCDC25 protein was used to reveal that the serum
CCDC25 level of patients with CCA was significantly higher compared
with that of HCs and patients with BBD. Furthermore, the serum
CCDC25 level could be used to differentiate between BBD and CCA
groups or patients with metastatic and non-metastatic CCA. Dot blot
analysis has been widely used in immunodiagnostics, as it saves
times, is inexpensive and reduces the number of practical
laboratories steps (23,24). Moreover, a multiple dot blot assay is
considered to have a similar accuracy to enzyme-linked
immunosorbent assay (ELISA) (23,25,26).
ELISA kits are not always available for novel biomarkers or
uncommon proteins, and previous studies have reported the use of a
dot blot assay based on the standard curve to quantitate protein
level in serum (17,18,27).
Thus, the present study employed a dot blot assay with a standard
curve produced by the standard recombinant CCDC25 protein for the
quantitative measurement of CCDC25. However, ELISA techniques are
still recommended for the accurate measurement of the concentration
of CCDC25 in CCA sera; therefore, an ELISA system should be
developed for further studies.
In the present study, CCDC25 expression in cancerous
tissues, as determined by immunohistochemistry, was correlated with
serum CCDC25 level, suggesting that CCA cells are the major source
of CCDC25 in the sera. Certain studies have reported that protein
levels in serum samples may differ from protein expression levels
in tissue due to a modification process during protein
translocation (28,29). Therefore, to further validate that
serum CCDC25 is mainly derived from CCA tissue, the association of
serum and tissue CCDC25 expression levels should be verified using
a larger number of paired samples. Furthermore, the quantitative
production/release of CCDC25 from CCA cells should be investigated
using CCA cell lines to validate the secretory protein nature of
CCDC25.
In terms of the diagnostic value of CCDC25 for CCA,
ROC analysis revealed a sensitivity and specificity of 93.0 and
100%, respectively, with a cut-off value of 0.11 ng/µl. Imaging
techniques, including ultrasound or computed tomography/MRI in
combination with laboratory testing of CA19-9 and CEA, are
currently used for the diagnosis of CCA (30). However, in the present study, serum
CA19-9 and CEA levels were not as efficient CCA levels, as the
sensitivity and specificity of these biomarkers were lower compared
with the serum CCDC25 level, and did not differentiate between
patients with BBD and CCA. Moreover, the median serum levels of
CA19-9 and CEA in the CCA and BBD groups were not significantly
different. Additionally, the serum CA19-9 and CEA levels were not
significantly correlated with serum CCDC25 level. A low diagnostic
value of CA19-9 has also been reported in other studies (31,32). In
the current study, serum CCDC25 level could discriminate between
BBD and CCA patients more effectively compared with CEA or CA19-9.
Therefore, CCDC25 may serve as a biomarker for the differential
diagnosis of patients with CCA or BBD. The present study analyzed a
relatively homogenous population of patients with stage 3–4
intrahepatic Ov-associated CCA. Nevertheless, the serum CCDC25
level of patients with CCA showed considerable variation.
Therefore, it would be of interest to investigate potential
correlations between CCDC25 and anatomical tumor location,
histopathological type or tumor stage for further evaluation of the
diagnostic value of CCDC25 in CCA.
Numerous protein molecules have been reported to be
upregulated in CCA and identified as potential tumor markers
(7,33,34). In
addition, close associations have been identified between protein
molecules and poor prognosis in CCA (7). In the present study, however,
Kaplan-Meier analysis revealed that elevated CCDC25 levels in the
serum and tissue samples of patients with CCA were associated with
longer survival times. Upregulation of human kallikrein-11 is
associated with a longer survival time for patients with non-small
cell lung cancer (35). In addition,
a high BAG cochaperone 1 level is associated with increased
survival time for patients with stage I–II breast cancer (36). Furthermore, Caron et al
(37) reported that positive caudal
type homeobox 2 (CDX2) expression is associated with improved
survival times compared with negative CDX2 expression in pancreatic
ductal adenocarcinoma. Certain cancerous or immune cells
produce/release substances that promote apoptosis, which affects
the survival rates of patients with various cancer types, including
breast cancer, hepatocellular carcinoma and pancreatic cancer
(38). Related to this, CCDC25 has
been reported to be a hub gene of hepatocyte nuclear factor 4 a, a
transcription factor or orphan nuclear receptor, which decreases
cancer cell growth in hepatocellular carcinoma (39,40).
Furthermore, loss of several genes, including CCDC25 on chromosome
8p, reduces the survival time of patients with hepatocellular
carcinoma (41). In the present
study, according to bioinformatics analysis, CCDC25 was identified
to interact with a number of molecules that serve different roles,
including anticancer and cancer promoting roles. As an molecule
with anticancerous properties, muscle RAS oncogene homolog has been
identified to be upregulated in Emodin-treated hepatoma cells, and
Emodin can inhibit the growth of hepatoma cells (42). Moreover, EIF1AY is a Y chromosome
gene, and the loss of Y chromosome in peripheral blood is
significantly associated with short survival time and a high risk
of developing numerous cancer types, such as liver cancer, melanoma
and prostate cancer (43). However,
an increase in ESCO1 expression is associated with poor survival
time in patients with bladder cancer. Previous studies revealed
that lung cancer cell migration was induced by the overexpression
of RCC2 (44,45).
In summary, the present study demonstrated that
CCDC25 is upregulated in CCA cells and the CCDC25 level in serum
may serve as a potential tumor marker for the screening or
diagnosis of CCA. However, the role of CCDC25 in the development
and progression of CCA remains unclear. Furthermore, the mechanisms
regulating CCDC25 protein expression in CCA cells require further
investigation. As CCDC25 was identified as a potential functional
protein from the genome database (12–15) and
only recombinant protein and antibody against it were produced, the
biological and physiological functions of CCDC25 is almost unknown
(10). Overexpression by gene
transfection or depressed production by gene silencing using CCA
cells will elucidate the biological role of CCDC25 and possible
regulatory mechanisms of its expression. Moreover, in vivo
behavior of the gene-manipulated CCA cells will provide the
importance of CCDC25 in tumor progression and/or metastasis. All
those possibilities can be investigated further in the future.
Acknowledgements
The authors would like to thank Professor Yukifumi
Nawa (Tropical disease research center, Faculty of Medicine, Khon
Kaen University, Thailand) for editing the manuscript and Professor
Sopit Wongkham and Associate Professor Chaisiri Wongkham (both
Department of Biochemistry, Faculty of Medicine, Khon Kaen
University, Khon Kaen, Thailand) for their comments related to
study design.
Funding
The present study was supported by Khon Kean
University Grant (grant no. 6200020005). Moreover, this study was
supported by the Publication Clinic of the Research Affairs, Khon
Kaen University (grant no. PCO-295), the Research Fund for
Supporting Lecturer to Admit High Potential Student to Study and
Research on His Expert Program 2016, Graduate School, Khon Kaen
University.
Availability of data and materials
The datasets used and/or analyzed during the current
study are available from the corresponding author on reasonable
request.
Authors' contributions
Conceptualization of study design was performed by
TP, TL, SR, AJu and SP. Data analysis was performed by RC. SP and
SR performed the experiments; Methodology was completed by RC, DC,
AT, and AJa. RC drafted the original manuscript. SP and TP reviewed
and edited the final manuscript.
Ethics approval and consent to
participate
The present study was approved by the Human Ethics
Committee of Khon Kaen University, Thailand (approval no. HE611410)
and written informed consent was obtained from all
participants.
Patient consent for publication
Not applicable.
Competing interests
The authors declare that they have no competing
interests.
References
|
1
|
Sripa B and Pairojkul C:
Cholangiocarcinoma: Lessons from Thailand. Curr Opin Gastroenterol.
24:349–356. 2008. View Article : Google Scholar : PubMed/NCBI
|
|
2
|
Lozada ME, Chaiteerakij R and Roberts LR:
Screening for hepatocellular carcinoma and cholangiocarcinoma: Can
biomarkers replace imaging? Curr Hepatol Rep. 14:128–138. 2015.
View Article : Google Scholar : PubMed/NCBI
|
|
3
|
Razumilava N, Gores GJ and Lindor KD:
Cancer surveillance in patients with primary sclerosing
cholangitis. Hepatology. 54:1842–1852. 2011. View Article : Google Scholar : PubMed/NCBI
|
|
4
|
Ong S, Sachdeva A, Garcea G, Gravante G,
Metcalfe M, Lloyd D, Berry D and Dennison A: Elevation of
carbohydrate antigen 19.9 in benign hepatobiliary conditions and
its correlation with serum bilirubin concentration. Dig Dis Sci.
53:3213–3217. 2008. View Article : Google Scholar : PubMed/NCBI
|
|
5
|
Silsirivanit A, Araki N, Wongkham C,
Pairojkul C, Narimatsu Y, Kuwahara K, Narimatsu H, Wongkham S and
Sakaguchi N: A novel serum carbohydrate marker on mucin 5AC: Values
for diagnostic and prognostic indicators for cholangiocarcinoma.
Cancer. 117:3393–3403. 2011. View Article : Google Scholar : PubMed/NCBI
|
|
6
|
Leelawat K, Narong S, Wannaprasert J and
Ratanashu-ek T: Prospective study of MMP7 serum levels in the
diagnosis of cholangiocarcinoma. World J Gastroenterol.
16:4697–4703. 2010. View Article : Google Scholar : PubMed/NCBI
|
|
7
|
Wongkham S and Silsirivanit A: State of
serum markers for detection of cholangiocarcinoma. Asian Pac J
Cancer Prev. 13 (Suppl):S17–S27. 2012.
|
|
8
|
Apweiler R, Bairoch A, Wu CH, Barker WC,
Boeckmann B, Ferro S, Gasteiger E, Huang H, Lopez R, Magrane M, et
al: UniProt: The universal protein knowledgebase. Nucleic Acids
Res. 32((Database Issue)): D115–D119. 2004. View Article : Google Scholar : PubMed/NCBI
|
|
9
|
Uhlén M, Fagerberg L, Hallström BM,
Lindskog C, Oksvold P, Mardinoglu A, Sivertsson Å, Kampf C,
Sjöstedt E, Asplund A, et al: Proteomics: Tissue-based map of the
human proteome. Science. 347:12604192015. View Article : Google Scholar : PubMed/NCBI
|
|
10
|
Proungvitaya S, Klinthong W, Proungvitaya
T, Limpaiboon T, Jearanaikoon P, Roytrakul S, Wongkham C,
Nimboriboonporn A and Wongkhamand S: High expression of CCDC25 in
cholangiocarcinoma tissue samples. Oncol Lett. 14:2566–2572. 2017.
View Article : Google Scholar : PubMed/NCBI
|
|
11
|
Suresh K and Chandrashekara S: Sample size
estimation and power analysis for clinical research studies. J Hum
Reprod Sci. 5:7–13. 2012. View Article : Google Scholar : PubMed/NCBI
|
|
12
|
Almagro Armenteros JJ, Tsirigos KD,
Sønderby CK, Petersen TN, Winther O, Brunak S, von Heijne G and
Nielsen H: SignalP 5.0 improves signal peptide predictions using
deep neural networks. Nat Biotechnol. 37:420–423. 2019. View Article : Google Scholar : PubMed/NCBI
|
|
13
|
Bendtsen JD, Jensen LJ, Blom N, Von Heilne
G and Brunak S: Feature-based prediction of non-classical and
leaderless protein secretion. Protein Eng Des Sel. 17:349–356.
2004. View Article : Google Scholar : PubMed/NCBI
|
|
14
|
Nanjappa V, Thomas JK, Marimuthu A,
Muthusamy B, Radhakrishnan A, Sharma R, Ahmad Khan A, Balakrishnan
L, Sahasrabuddhe NA, Kumar S, et al: Plasma proteome database as a
resource for proteomics research: 2014 update. Nucleic acid Res.
42:D959–D965. 2014. View Article : Google Scholar : PubMed/NCBI
|
|
15
|
Kuhn M, Szklarczyk D, Pletscher-Frankild
S, Blicher TH, von Mering C, Jensen LJ and Bork P: STITCH 4:
Integration of protein-chemical interactions with user data.
Nucleic Acids Res. 42((Database Issue)): D401–D407. 2014.
View Article : Google Scholar : PubMed/NCBI
|
|
16
|
Wu L, Huang P, Wang F, Li D, Xie E, Zhang
Y and Pan S: Relationship between serum CA19-9 and CEA levels and
prognosis of pancreatic cancer. Ann Transl Med.
3:3282015.PubMed/NCBI
|
|
17
|
Taylor SC, Berkelman T, Yadav G and
Hammond M: A defined methodology for reliable quantification of
western blot data. Mol Biotechnol. 55:217–226. 2013. View Article : Google Scholar : PubMed/NCBI
|
|
18
|
Fang R, Wey A, Bobbili NK, Leke RFG,
Taylor DW and Chen JJ: An analytical approach to reduce
between-plate variation in multiplex assays that measure antibodies
to plasmodium falciparum antigens. Malar J. 16:2872017. View Article : Google Scholar : PubMed/NCBI
|
|
19
|
Ma HY, Lu YN, Marchbanks PA, Folger SG,
Strom BL, McDonald JA, Simon MS, Weiss LK, Malone KE, Burkman RT,
et al: Quantitative measures of estrogen receptor expression in
relation to breast cancer-specific mortality risk among white women
and black women. Breast Cancer Res. 15:R902013. View Article : Google Scholar : PubMed/NCBI
|
|
20
|
Farrah T, Deutsch EW, Omenn GS, Campbell
DS, Sun Z, Bletz JA, Mallick P, Katz JE, Malmström J, Ossola R, et
al: A high-confidence human plasma proteome reference set with
estimated concentrations in PeptideAtlas. Mol Cell Proteomics.
10:M110.006353. 2011. View Article : Google Scholar : PubMed/NCBI
|
|
21
|
Schober P, Boer C and Schwarte LA:
Correlation coefficients: Appropriate use and interpretation.
Anesth Analg. 126:1763–1768. 2018. View Article : Google Scholar : PubMed/NCBI
|
|
22
|
Rabouille C: Pathways of unconventional
protein secretion. Trends Cell Biol. 27:230–240. 2017. View Article : Google Scholar : PubMed/NCBI
|
|
23
|
Stone W, Grabias B, Lanke K, Zheng H,
Locke E, Diallo D, Birkett A, Morin M, Bousema T and Kumarand S: A
comparison of plasmodium falciparum circumsporozoite protein-based
slot blot and ELISA immuno-assays for oocyst detection in mosquito
homogenates. Malar J. 14:4512015. View Article : Google Scholar : PubMed/NCBI
|
|
24
|
Kamel HH, Saad GA and Sarhan RM: Dot-blot
immunoassay of Fasciola gigantica infection using 27 kDa and adult
worm regurge antigens in Egyptian patients. Korean J Parasitol.
51:177–182. 2013. View Article : Google Scholar : PubMed/NCBI
|
|
25
|
Falconar AK and Romero-Vivas CM: A simple,
inexpensive, robust and sensitive dot-blot assay for equal
detection of the nonstructural-1 glycoprotein of all dengue virus
serotypes. Virol J. 10:1262013. View Article : Google Scholar : PubMed/NCBI
|
|
26
|
Vera-Cabrera L, Rendon A, Diaz-Rodriguez
M, Handzel V and Laszlo A: Dot blot assay for detection of
antidiacyltrehalose antibodies in tuberculous patients. Clin Diagn
Lab Immunol. 6:686–689. 1999.PubMed/NCBI
|
|
27
|
Tian G, Tang F, Yang C, Zhang W, Bergquist
J, Wang B, Mi J and Zhang J: Quantitative dot blot analysis (QDB),
a versatile high throughput immunoblot method. Oncotarget.
8:58553–58562. 2017. View Article : Google Scholar : PubMed/NCBI
|
|
28
|
Abdullah MI, Lee CC, Junit SM, Ng KL and
Hashim OH: Tissue and serum samples of patients with papillary
thyroid cancer with and without benign background demonstrate
different altered expression of proteins. Peer J. 4:e24502016.
View Article : Google Scholar : PubMed/NCBI
|
|
29
|
Grzesiak K, Rył A, Baranowska-Bosiacka I,
Rotter I, Dołęgowska B, Słojewski M, Sipak-Szmigiel O, Ratajczak W,
Lubkowska A, Metryka E, et al: Comparison between selected hormone
and protein levels in serum and prostate tissue homogenates in men
with benign prostatic hyperplasia and metabolic disorders. Clin
Interv Aging. 13:1375–1382. 2018. View Article : Google Scholar : PubMed/NCBI
|
|
30
|
Edoo MIA, Chutturghoon VK, Wusu-Ansah GK,
Zhu H, Zhen TY, Xie HY and Zheng SS: Serum biomarkers AFP, CEA and
CA19-9 combined detection for early diagnosis of hepatocellular
carcinoma. Iran J Public Health. 48:314–322. 2019.PubMed/NCBI
|
|
31
|
Zeng X and Tao H: Diagnostic and
prognostic serum marker of cholangiocarcinoma (review). Oncol Lett.
9:3–8. 2015. View Article : Google Scholar : PubMed/NCBI
|
|
32
|
Loosen SH, Roderburg C, Kauertz KL, Koch
A, Vucur M, Schneider AT, Binnebösel M, Ulmer TF, Lurje G,
Schoening W, et al: CEA but not CA19-9 is an independent prognostic
factor in patients undergoing resection of cholangiocarcinoma. Sci
Rep. 7:169752017. View Article : Google Scholar : PubMed/NCBI
|
|
33
|
Tshering G, Dorji PW, Chaijaroenkul W and
Na-Bangchang K: Biomarkers for the diagnosis of cholangiocarcinoma:
A systematic review. Am J Trop Med Hyg. 98:1788–1797. 2018.
View Article : Google Scholar : PubMed/NCBI
|
|
34
|
Cuenco J, Wehnert N, Blyuss O, Kazarian A,
Whitwell HJ, Menon U, Dawnay A, Manns MP, Pereira SP and Timms JF:
Identification of a serum biomarker panel for the differential
diagnosis of cholangiocarcinoma and primary sclerosing cholangitis.
Oncotarget. 9:17430–17442. 2018. View Article : Google Scholar : PubMed/NCBI
|
|
35
|
Unal D, Eroglu C, Tasdemir A, Karaman H,
Kurtul N, Oguz A, Goksu S and Kaphen B: Is human kallikrein 11 in
non-small cell lung cancer treated chemoradiotherapy associated
with survival? Cancer Res Treat. 48:98–105. 2016. View Article : Google Scholar : PubMed/NCBI
|
|
36
|
Turner BC, Krajewski S, Krajewska M,
Takayama S, Gumbs AA, Carter D, Rebbeck RT, Haffty BG and Reed JC:
BAG-1: A novel biomarker predicting long-term survival in
early-stage breast cancer. J Clin Oncol. 19:992–1000. 2001.
View Article : Google Scholar : PubMed/NCBI
|
|
37
|
Caron B, Nair A, Averous G, Nguimpi-Tambou
M, Duluc I, Addeo P, Bachellier P, Barnard D, Freund JN and Reimund
JM: CDX2 is a biomarker of better prognosis in pancreatic ductal
adenocarcinoma (PDA). Gastroenterology. 152 (Suppl 1):S275–S276.
2017. View Article : Google Scholar
|
|
38
|
Lowitz BB and Casciata DA: Principles of
medical oncology and cancer biology [Internet]. Philadelphia, PA:
Lippincott Williams & Wilkins; 2000, [visited 2018 Sep 10].
http://www.justmed.eu/files/st/onPubMed/NCBI
|
|
39
|
Qu Z, Li D, Xu H, Zhang R, Li B, Sun C,
Dong W and Zhang Y: CUL4B, NEDD4, and UGT1As involve in the TGF-β
signaling in hepatocellular carcinoma. Ann Hepatol. 15:568–576.
2016.
|
|
40
|
Walesky C and Apte U: Role of hepatocyte
nuclear factor 4α (HNF4α) in cell proliferation and cancer. Gene
Expr. 16:101–108. 2015. View Article : Google Scholar : PubMed/NCBI
|
|
41
|
Roessler S, Long EL, Budhu A, Chen Y, Zhao
X, Ji J, Walker R, Jia HL, Ye QH, Qin LX, et al: Integrative
genomic identification of genes on 8p associated with
hepatocellular carcinoma progression and patient survival.
Gastroenterology. 142:957–966.e12. 2012. View Article : Google Scholar : PubMed/NCBI
|
|
42
|
Hsu CM, Hsu YA, Tsai Y, Shieh FK, Huang
SH, Wan L and Tsai FJ: Emodin inhibits the growth of hepatoma
cells: Finding the common anti-cancer pathway using Huh7, Hep3B,
and HepG2 cells. Biochem Biophys Res Commun. 392:473–478. 2010.
View Article : Google Scholar : PubMed/NCBI
|
|
43
|
Kido T and Lau YF: Roles of the Y
chromosome genes in human cancers. Asian J Androl. 17:373–380.
2015.PubMed/NCBI
|
|
44
|
Zhang S, Li J, Zhou G, Mu D, Yan J, Xing
J, Yao Z, Sheng H, Li D, Lv C, et al: Increased expression of ESCO1
is correlated with poor patient survival and its role in human
bladder cancer. Tumor Biol. 37:5165–5170. 2016. View Article : Google Scholar
|
|
45
|
Pang B, Wu N, Guan R, Pang L, Li X, Li S,
Tang L, Guo Y, Chen J, Sun D, et al: Overexpression of RCC2
enhances cell motility and promotes tumor metastasis in lung
adenocarcinoma by inducing epithelial–mesenchymal transition. Clin
Cancer Res. 23:5598–5610. 2017. View Article : Google Scholar : PubMed/NCBI
|