Introduction
There are numerous diagnostic methods for lung
cancer, such as sputum pathology, tumor markers, imaging, CT scan,
percutaneous lung puncture, and fiberoptic bronchoscopic and
surgical tissue biopsy. Sputum cytologic culture is a traditional
diagnostic method with high diagnostic specificity of >98%, but
the sensitivity is only 66% (1). A
trend toward lower sensitivity was noted for lesions that were
<2 cm in diameter. However, sensitivity is higher for central
lesions than for peripheral lesions. Therefore, for lesions <2
cm in diameter, CT is better than sputum cytology, especially in
peripheral lung cancer. Although its diagnostic sensitivity is
improved by cytologic smears, the arrangement mode of cancer cells
is often changed during the smear process, harming the pathological
diagnosis of lung cancer. There is a number of studies on the
abnormal expression of micro ribonucleic acid (miRNA) in lung
cancer tissues. However, the results are inconsistent or the
biological functions remain unclear (1–3). The
abnormal expression of miRNA is also related to environment and
genetics, which also have prognostic risks (4). Whether the expression of miRNAs is
inconsistent in lung cancer tissues and serum is unknown, and it
has been reported that the miR-133 expression is increased in both
lung cancer tissues and serum (5).
According to the MeDIP-chip microarray analysis, there is
methylation of miRNAs (miR-10b, miR-1179, miR-137, miR-572,
miR-3150b and miR-129-2) in primary lung tumor, and miR-1179 mimics
prevent cell growth through inhibiting the target gene CCNE1
(6).
miRNA is a kind of non-coding small-molecule RNA,
which can target a variety of genes. miRNA is involved in
regulating various biological processes, including the cell signal
expression, proliferation, differentiation and apoptosis. Each
miRNA can regulate hundreds of messenger RNAs (mRNAs) in a parallel
and targeted manner, and any change in its expression level may
produce significant influences on biological processes and lead to
pathophysiological changes (7).
Tumor cells are in a special hypoxic microenvironment, and hypoxia
will occur once the tumor diameter becomes more than several
hundred microns (8). The production
of hypoxic environment and the activation of its major effector,
hypoxia-inducible factor-1 (HIF-1), are common features of advanced
cancer (9). Currently, there are few
studies on whether the in vitro hypoxic state further
aggravates the hypoxia in the microenvironment of lung cancer
cells, and leads to abnormal expression of some miRNAs in lung
cancer cells, and whether it is involved in the process of
carcinogenesis, invasion and metastasis of lung cancer. A recent
study found a significant correlation between Tibetan EGLN1/PHD2
haplotypes (D4E and C127S) and lung cancer, corresponding to a
2-fold increase of lung cancer risk in high altitude, and a ≥2-fold
increased risk for rs117813469 and rs142764723 of the ten
EPAS1/HIF-2α variants (10),
although the expression of miRNA is regulated by multiple factors.
The tumor microenvironment, especially the effect of hypoxia on the
biological characteristics of the tumor is clear. In the present
study, lung cancer patients in middle-altitude area were enrolled
to observe the effect of environmental hypoxia and tumor on the
expression of miRNA. GeneChip scanning was performed on lung cancer
tissues of 4 patients with non-small cell lung cancer (NSCLC) and 5
patients of the control group in the middle-altitude area. The
differentially expressed miRNAs in cancer tissues were screened,
the target genes of differentially expressed miRNAs were predicted,
and the target gene-related signaling pathways and cell biological
functions regulated by them were analyzed.
Patients and methods
Study subjects
A total of 30 patients admitted to the Respiratory
and Critical Disease Department and Oncology Department of the
Qinghai Provincial People's Hospital (Xining, China) from October
2016 to October 2017, who were definitely diagnosed with NSCLC via
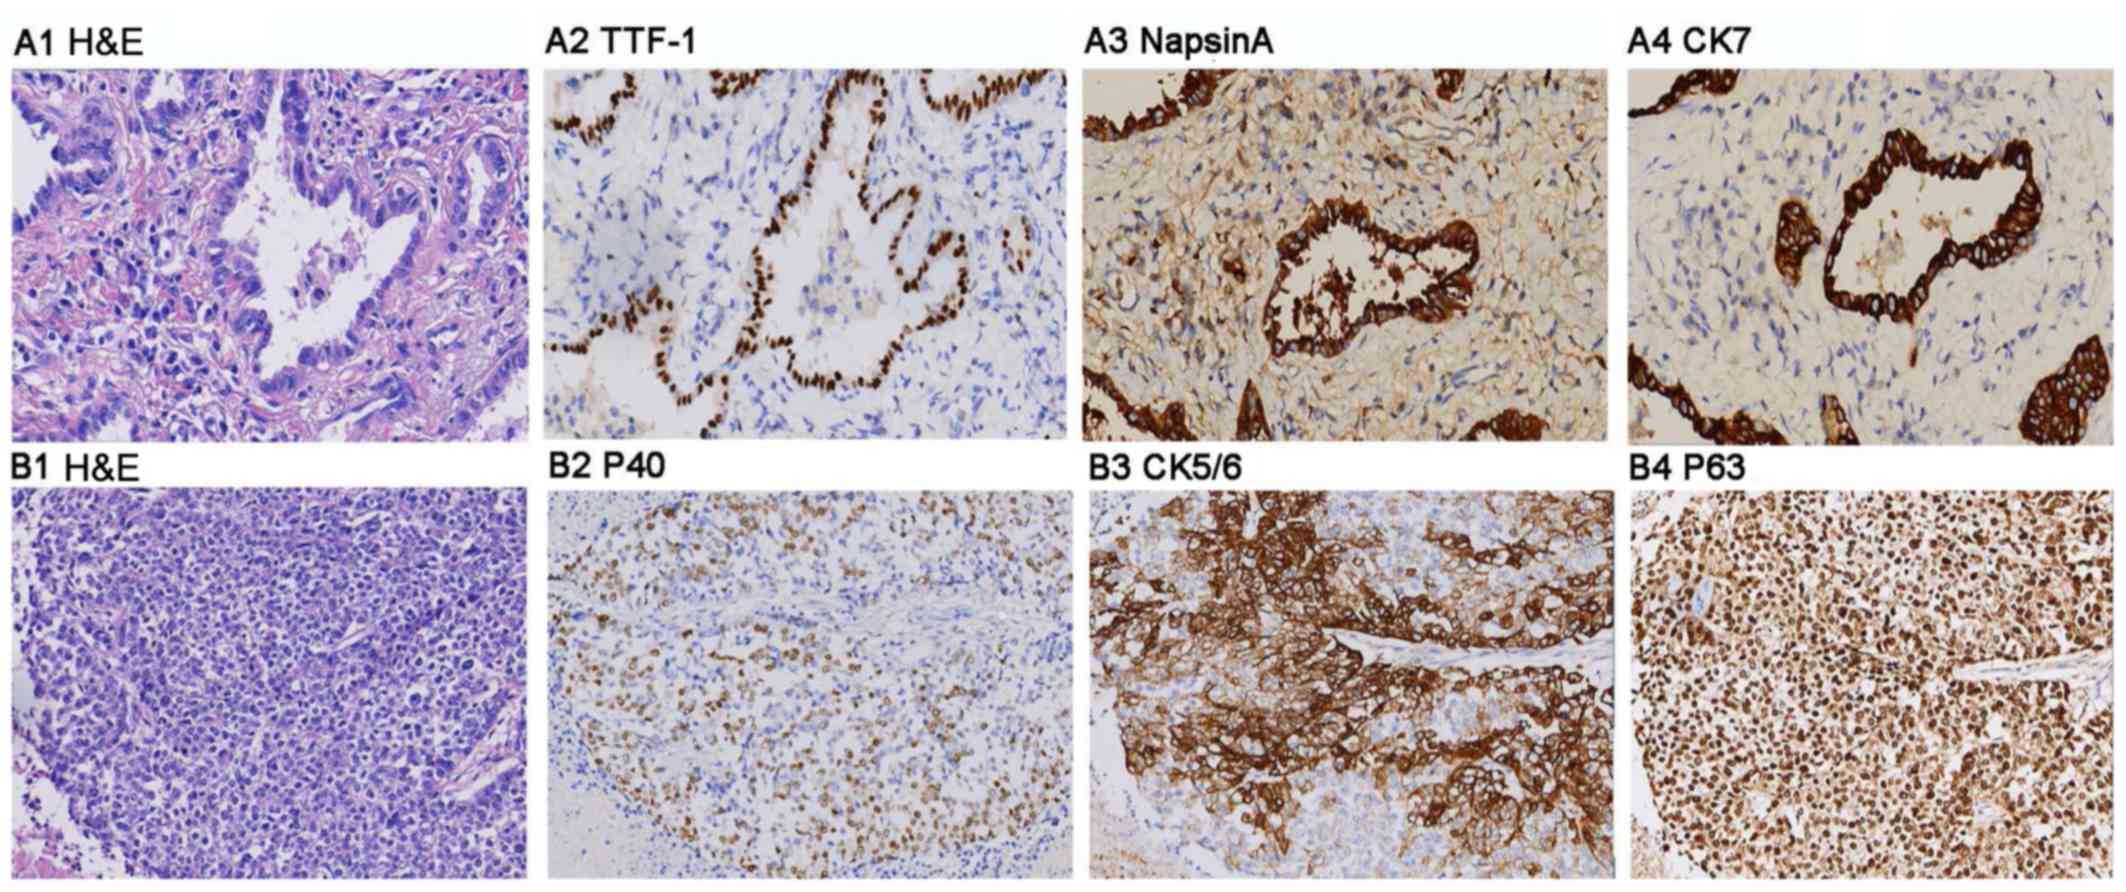
pathological biopsy of lung tissues (Fig. 1), were selected as the lung cancer
group. There were 22 males and 8 females enrolled, with an average
age of 64.58±12.56 years and age range of 41–77 years. The cancer
tissues of all lung cancer patients were obtained by surgical
resection or percutaneous lung puncture, and were confirmed by
immunohistochemistry. There were 17 cases of squamous cell
carcinoma and 13 cases of adenocarcinoma, according to pathological
classification. The clinical stage of the above NSCLC patients was
T1–2N0M0 for all the patients
according to the WHO classification (11). The patients of the lung cancer group
lived permanently in a middle-altitude area (altitude: 1,500–2,500
m), they were diagnosed initially with primary tumor and did not
receive any treatment (chemoradiotherapy, molecular targeted
therapy, or surgical resection), and had no malignant tumors in
other organs. Further 34 non-tumor patients, admitted to the
Qinghai Provincial People's Hospital during the same period and
living permanently in a middle-altitude area, were selected as the
control group, which included 24 males and 10 females with an
average age of 59.36±14.08 years and age range of 39–75 years.
Samples were collected from marginal normal lung tissue obtained
from non-tumor patients with pneumothorax by surgical resection.
There were no significant differences in sex (χ2=0.0594,
P=0.8074) and age (t=1.556, P=0.1247) between the two groups
(P>0.05), and thus, they were comparable. The patients of this
study and/or their guardians were informed and signed an informed
consent form. All study processes met the ethical requirements and
were reviewed and approved by the Ethics Committee of the Qinghai
Provincial People's Hospital (approval no. 2015-07).
RNA extraction, miRNA reverse
transcription and miRNA polymerase chain reaction (PCR)
Total RNA was extracted from cells using the TRIzol
reagent (Ambion; Thermo Fisher Scientific, Inc.). miRNA reverse
transcription was performed using the TaqMan® MicroRNA
Reverse Transcription kit (Applied Biosystems Life Technologies;
Thermo Fisher Scientific, Inc.), and PCR primers corresponding to
miRNAs were synthesized by Applied Biosystems (Thermo Fisher
Scientific, Inc.). miRNA-16 was used as an internal reference.
Sequences of miR-139-5p and miR-150-5p primers were: miRNA-139-5p
forward, GTCGTATCCAGTGCAGGGTCC GAGGTATTCGCACTGGATACGACactgga and
reverse, TCTACAGTGCACGTGTCTCC; miRNA-150-5p forward,
GTCGTATCCAGTGCAGGGTCCGAGGTATTCGCACTGGATACGACcactgg and reverse,
TCTCCCAACCCTTGTACC; miRNA-16 forward, GTCGTATCCAGTGCAGGGTCCGAG
GTATTCGCACTGGATACGACcgccaa and reverse, GCTTGTAGCAGCACGTAAATATTG;
miRNA-1 U6 forward, CTCGCTTCGGCAGCACA and reverse,
AACGCTTCACGAATTTGCG. PCR was performed with QuantStudio™ 7 Flex
Real-Time PCR system (Thermo Fisher Scientific, Inc.) by using the
2−ΔΔCq method (12).
Reaction system (15 µl): 7 µl Master Mix I (0.15 µl of 100 mM dNTPs
with dTTP, 1.00 µl of 50 U/µl MultiScribe™ Reverse Transcriptase,
1.5 µl 10X Reverse Transcriptase Buffer, 0.19 µl of 20 U/µl RNase
Inhibitor, and 4.16 µl nuclease-free water), 3 µl 5X RT primer and
5 µl RNA sample. Master Mix (MultiScribe™ Reverse Transcriptase,
Reverse Transcriptase Buffer, RNase Inhibitor, nuclease-free water)
was derived from TaqMan® MicroRNA Reverse Transcription
kit. The reverse transcription conditions were: 16°C for 30 min,
42°C for 30 min and 85°C for 5 min. RT-qPCR amplification system
(20 µl): 1.00 µl TaqMan Small Assay (20X; Applied Biosystems Life
Technologies; Thermo Fisher Scientific, Inc.), 1.33 µl product from
RT reaction, 10 µl TaqMan Universal PCR master mix II (2X; Applied
Biosystems Life Technologies; Thermo Fisher Scientific, Inc.) and
7.67 µl nuclease-free water. Amplification conditions were as
follows: Option AmpErase UNG activity at 50°C for 2 min, enzyme
activation at 95°C for 10 min, a total of 40 cycles, denaturation
at 95°C for 15 sec, and annealing/extension at 60°C for 60 sec.
Immunohistochemistry
EnVision system (Dako; Agilent Technologies, Inc.)
was used to detect the expression of TTF-1 (MAB-0599), NapsinA
(MAB-0704), CK7 (MAB-0166), P40 (MAB-0666), CK5/6 (MAB-0276), and
P63 (MAB-0365) proteins. All protein antibodies were purchased from
Fuzhou Maixin Biotechnology Development Co., Ltd. Tissues were
fixed in 4% neutral buffered formaldehyde for 24 h at room
temperature. The experimental procedure was as follows:
Paraffin-embedded tissues were cut into 3–4 µm and heated overnight
at 65°C. The tissue sections were deparaffinized and rehydrated.
Inactivation of endogenous peroxidase (3%
H2O2, 10 min) and washing with PBS for 3
times, every 2 min, were carried out. The antigen hot fix was EDTA,
pH 9.0, 20 min. The tissues were washed with PBS 3 times, every 2
min in distilled water prior to being blocked at room temperature
for 10 min (goat serum working solution; Beijing Zhongshan Golden
Bridge Biotechnology Co., Ltd.). Incubation with the primary
antibody was carried out for 1 h at room temperature (with TTF-1
1:50, NapsinA 1:50, CK7 1:100, P40 1:50, CK5/6 1:100, P63 1:50) and
then the tissues were washed with PBS 3 times, every 2 min.
Secondary antibody was added using MaxVision™ HRP-Polymer
anti-Mouse/Rabbit IHC kit (cat no. 5010; Fuzhou Maixin
Biotechnology Development Co., Ltd.) at room temperature for 25
min. Washing with PBS for 3 times, every 2 min followed. DAB
chromogenic reagent was used to detect the protein expression for
3–10 min (ready-to-use DAB color liquid, microscopic control). The
slides were subsequently stained with hematoxylin and bluing was
carried out. Sliced tissues were conducted with graded alcohol
dehydration and xylene following the manufacturer's instructions.
Leica DM2500 optical microscope (Leica Microsystems, Ltd.) was used
for observation. H&E staining in serial sections of each
paraffin block specimens was performed for immunohistochemistry and
expression analysis (Fig. 1).
GeneChip scanning of lung cancer
tissues
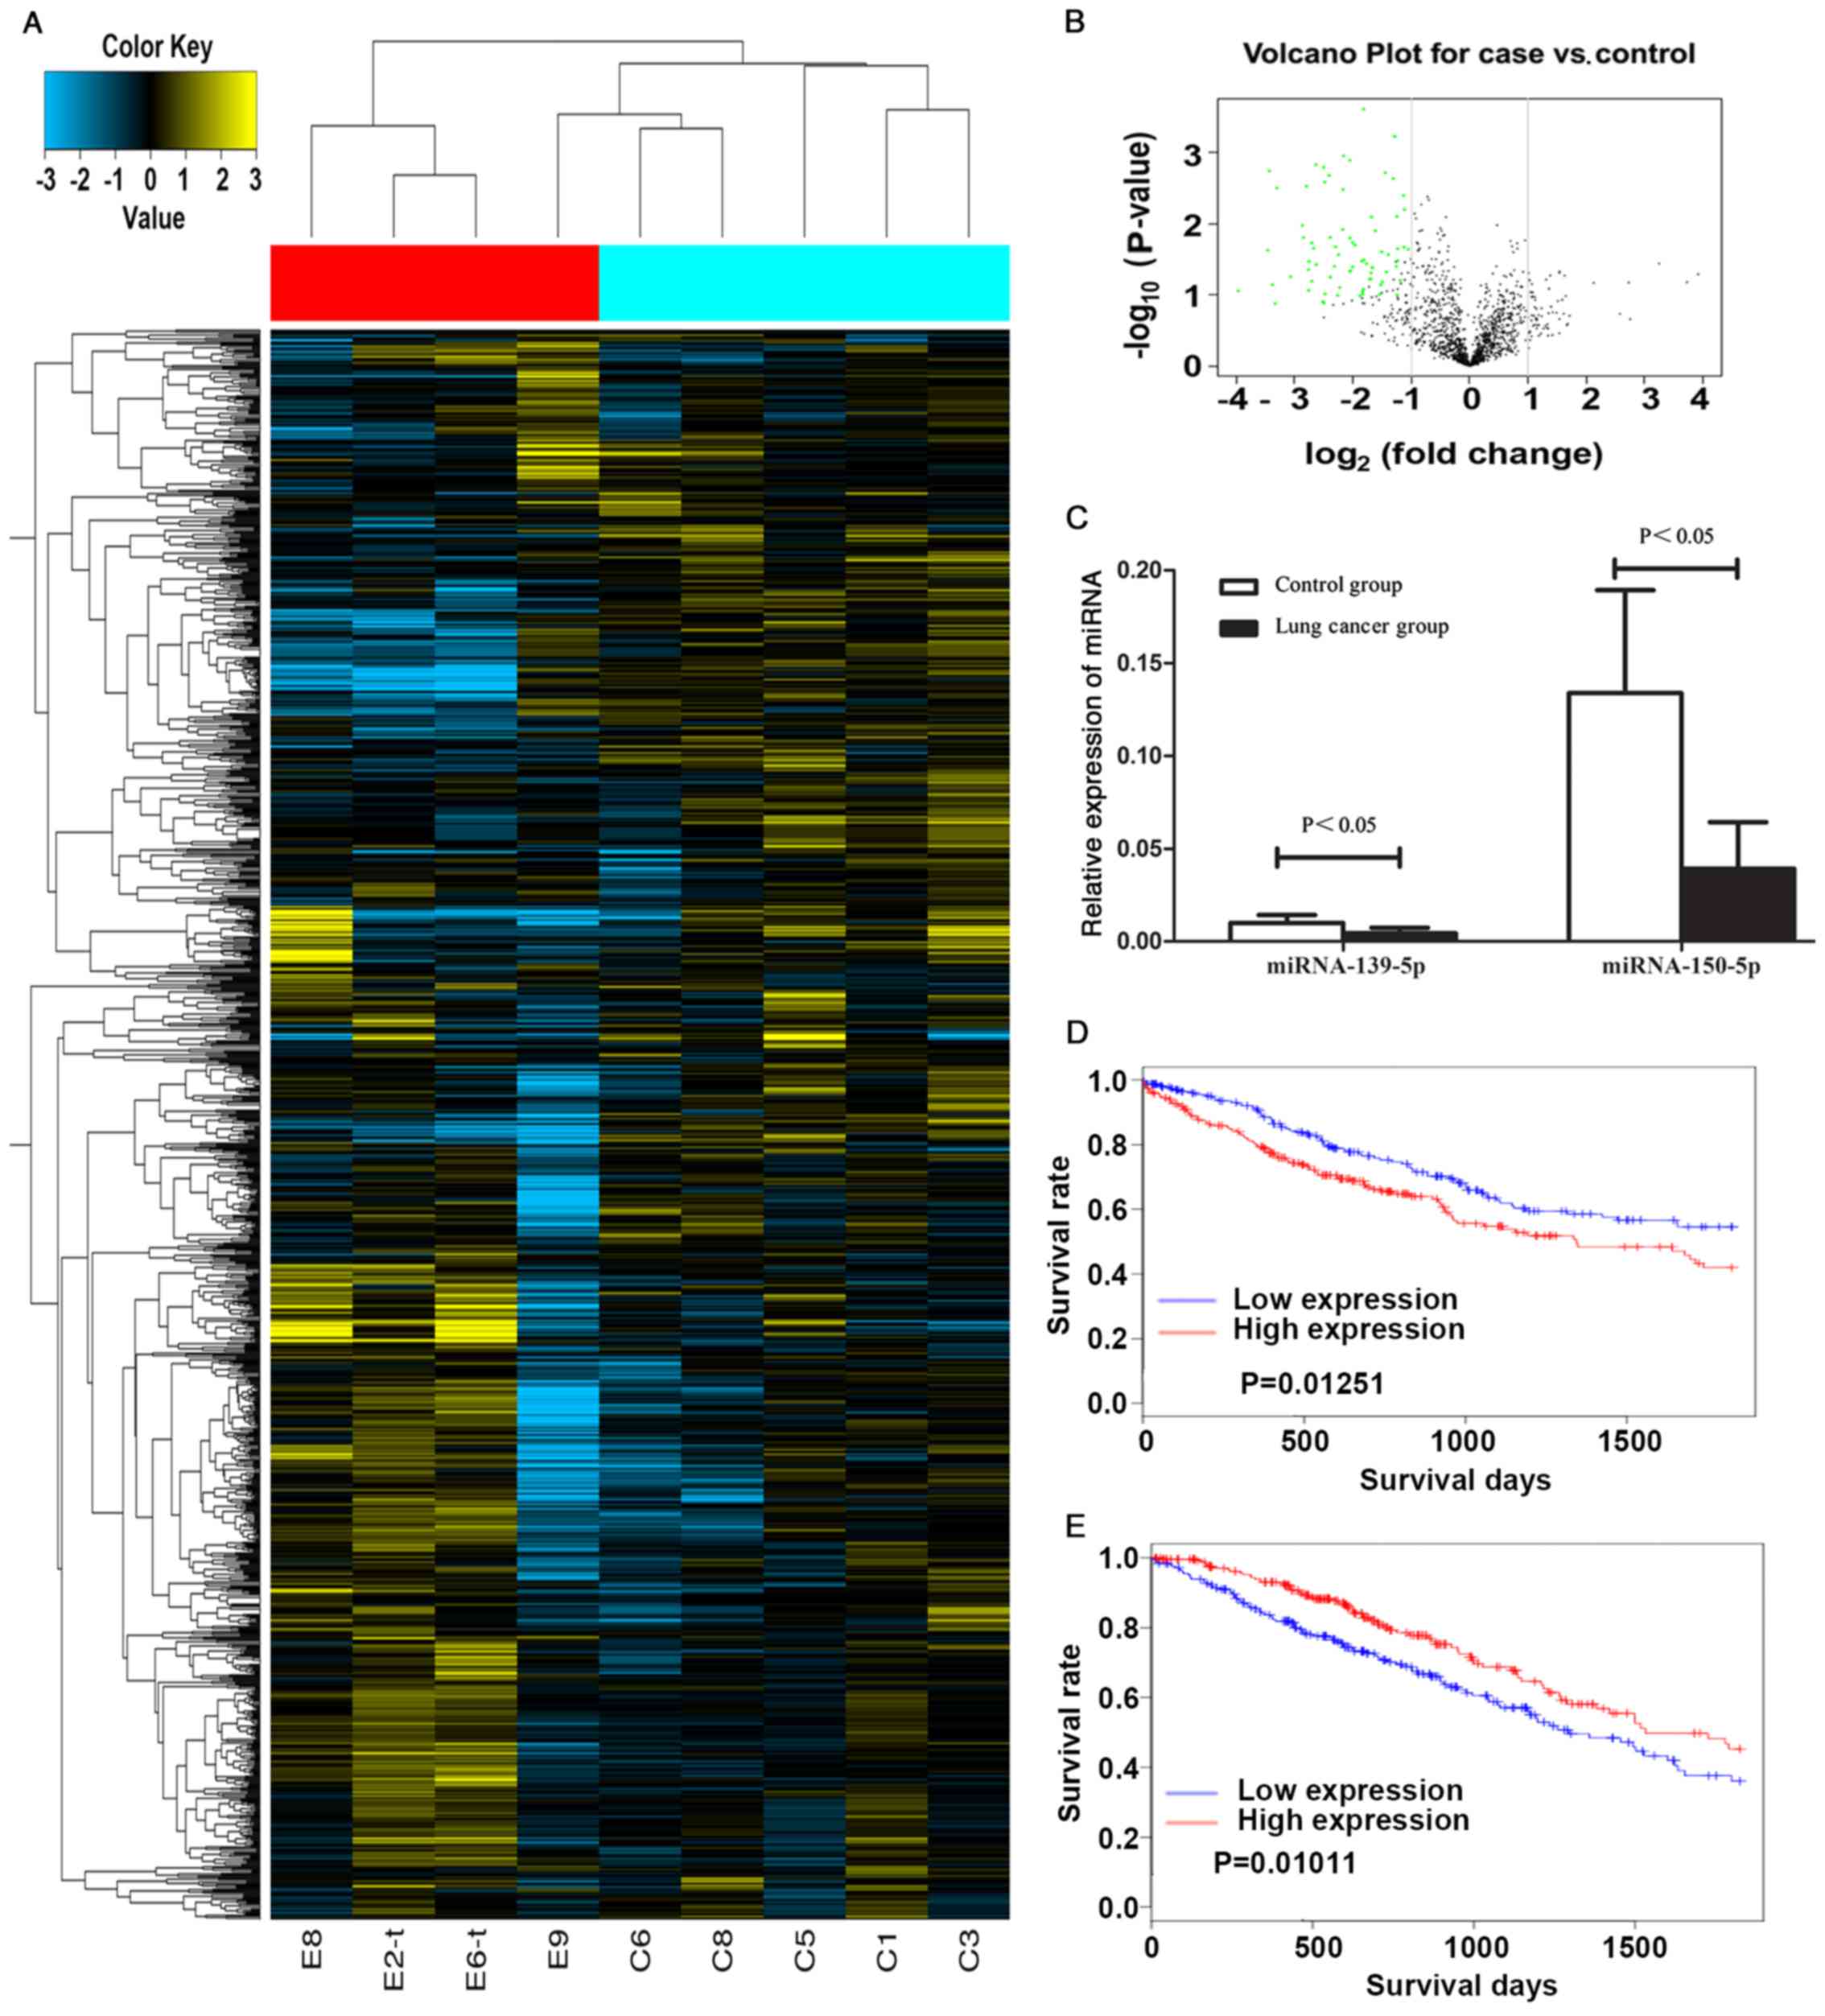
Four patients diagnosed with NSCLC via pathological
biopsy (E8, E2-t, E6-t and E9; Fig.
2A), and 5 non-tumor patients (C6, C8, C5, C1 and C3; Fig. 2A) were selected. The cancer and
non-tumor tissues were collected and stored at −80°C for Affymetrix
GeneChip scanning (Affymetrix: Thermo Fisher Scientific, Inc.).
Selection criteria for the lung cancer patients: i) Long-term
residence in the middle-altitude area; ii) initial diagnosis of
patients who did not receive any treatment (chemotherapy, molecular
targeted therapy, or surgical resection); iii) patients with
primary tumor; and iv) no other organ malignancy. Selection
criteria for control patients: i) Patients with pneumothorax; and
ii) no lung or other organ tumors. miRNAs were selected to expand
the sample for verification, according to the following conditions:
i) miRNAs consistently expressed according to the results of
microarray and the published literature; ii) miRNAs with
downregulated expression; and iii) miRNAs reported to be associated
with lung cancer. miR-139-5p and miR-150-5p with obvious
differential expression were verified by RT-qPCR with expanded
sample size.
Statistical analysis
Chip difference analysis
The chip image information was converted into
digital signal using the Affymetrix®
GeneChip® Console® software (Affymetrix:
Thermo Fisher Scientific, Inc.). The probe signal was integrated
into the probeset signal, and the inter-sample variation caused by
non-biological factors was removed via inter-chip normalization.
The data were preprocessed using Range Migration Algorithm (RMA)
(13). Differential genes were
analyzed by Significance Analysis of Microarrays (SAM) R software
package (https://www.r-project.org/), and the
significant difference of chip data was analyzed. Differential
genes were screened based on P<0.05 and fold change >2 or
<0.5.
Cluster analysis
Cluster analysis was performed for the
differentially expressed miRNAs in the lung cancer and control
groups using cluster software. Differentially expressed miRNAs were
screened based on P<0.05 and fold change >2 or <0.5.
Prediction and analysis of target
genes of differentially expressed miRNAs
The genes predicted by at least 6 out of 12 commonly
used prediction methods of miRNA target genes (miRWalk,
DIANA-microTv4.0, miRanda-rel2010, mirBridge, miRDB4.0, miRmap,
miRNAMap, PicTar2, PITA, RNA22v2, RNAhybrid2 and Targetscan6.2),
based on miRWalk2.0 (14), were
considered as target genes.
Functional enrichment analysis
Functional enrichment analysis was performed for the
target genes of differentially expressed miRNAs using DAVID
Bioinformatics Resources 6.7 (https://david.ncifcrf.gov/), including Gene Ontology
(GO) enrichment analysis and pathway enrichment analysis (15). GO enrichment includes biological
process, cell component and molecular function. The functional
regulation image was plotted using the CytoScape software
(https://cytoscape.org/) and Bingo plug-in,
followed by input of the target genes. Pathway enrichment analysis
mainly referred to Kyoto Encyclopedia of Genes and Genomes (KEGG)
enrichment analysis (16).
Data analysis
Experimental measurement data were expressed as the
mean ± SD. SPSS 17.0 software (SPSS, Inc.) was used for statistical
analysis. The log-rank P-values were obtained from a univariate Cox
analysis, whereby miRNA expression was evaluated in response to
patient survival time. Univariate Cox analysis also provided the
Z-scores, which weighed the importance of the miRNA in response to
these parameters. The t-test P-values were obtained from the
Student's t-test, based on the patient vital status.
Log2 mean expression of the miRNA in the two survival
cohorts was also obtained. The log-rank P-values were obtained from
a univariate Cox analysis and survival characteristics of miRNA
expression based on the Kaplan-Meier survival curves. The test
level was set as α=0.05. P<0.05 was considered to indicate a
statistically significant difference.
Results
Difference in miRNA expression profile
of cancer tissues
The heatmap of gene expression in each group,
obtained using the Cluster software, showed the difference in the
expression of each gene in the different groups. Cluster analysis
was performed for the miRNA expression in 4 cases in lung cancer
group and 5 cases in normal group using the Cluster chip technique,
and the differential genes were screened by the system according to
the parameter setting and grouping, thus obtaining the distribution
diagram (Fig. 2A) and list of
differential genes. In the diagram with abscissa of log2
(fold change) and ordinate of -log10 (P-value), the data
closer to the left and right bottom corresponded to the lower
P-value, larger fold change and more significant difference
(Fig. 2B). A total of 76
differentially expressed genes were screened, and no gene was
upregulated (Table I).
 | Table I.Differentially expressed miRNAs. |
Table I.
Differentially expressed miRNAs.
| Gene ID | Score(d) | P-value (%) | Fold change | Transcript ID
(array design) |
|---|
| 20503875 | −2.023293031 | 4.960182025 | 0.4813 |
hsa-miR-500a-5p |
| 20517816 | −2.640103593 | 2.254628193 | 0.4595 | hsa-miR-3609 |
| 20506867 | −2.236471814 | 3.600132115 | 0.4578 | hsa-miR-1270 |
| 20505746 | −2.693594792 | 2.254628193 | 0.4553 | hsa-miR-874-3p |
| 20534325 | −2.080624824 | 4.650170648 | 0.4378 | HBII-85-2 |
| 20534221 | −2.110884506 | 4.021769209 | 0.4247 | HBII-13 |
| 20515540 | −2.093015723 | 4.021769209 | 0.4245 |
hsa-miR-3136-5p |
| 20500735 | −2.000720498 | 4.960182025 | 0.4214 |
hsa-miR-130a-3p |
| 20500713 | −2.539879295 | 2.254628193 | 0.4207 | hsa-let-7g-5p |
| 20501201 | −2.201987788 | 3.600132115 | 0.4169 | hsa-miR-362-5p |
| 20538284 | −3.541567197 | 0 | 0.4097 | mgU12-22-U4-8 |
| 20538271 | −3.541567197 | 0 | 0.4097 | U91 |
| 20500152 | −4.070180503 | 0 | 0.4022 | hsa-miR-26a-5p |
| 20532691 | −2.339013412 | 2.861643476 | 0.3802 | ACA54 |
| 20501280 | −2.324838379 | 2.861643476 | 0.3718 | hsa-miR-342-3p |
| 20503908 | −3.378079284 | 0 | 0.3658 | hsa-miR-532-3p |
| 20500490 | −2.234977738 | 3.600132115 | 0.354 | hsa-miR-224-3p |
| 20500385 | −2.711696402 | 2.254628193 | 0.3511 | hsa-miR-192-5p |
| 20534237 | −2.165774907 | 4.021769209 | 0.347 | HBII-289 |
| 20500720 | −2.014983155 | 4.960182025 | 0.3424 | hsa-miR-23b-5p |
| 20502122 | −3.132721492 | 0 | 0.3257 | hsa-miR-422a |
| 20500400 | −2.507082441 | 2.254628193 | 0.3141 |
hsa-miR-199a-3p |
| 20500458 | −2.507082441 | 2.254628193 | 0.3141 |
hsa-miR-199b-3p |
| 20534233 | −3.222214722 | 0 | 0.311 | HBII-239 |
| 20500444 | −2.425279357 | 2.861643476 | 0.3092 |
hsa-miR-181a-5p |
| 20500755 | −2.570514383 | 2.254628193 | 0.3083 | hsa-miR-145-5p |
| 20500752 | −2.538495565 | 2.254628193 | 0.3037 | hsa-miR-143-3p |
| 20501299 | −2.759869484 | 2.254628193 | 0.2934 | hsa-miR-339-3p |
| 20511549 | −2.513431114 | 2.254628193 | 0.2843 | hsa-miR-2110 |
| 20504584 | −2.06130082 | 4.650170648 | 0.2833 | hsa-miR-378d |
| 20534249 | −4.614743071 | 0 | 0.2831 | HBII-436 |
| 20500149 | −2.092452784 | 4.021769209 | 0.2805 |
hsa-miR-24-2-5p |
| 20500746 | −2.266082512 | 3.600132115 | 0.2794 | hsa-miR-140-3p |
| 20500179 | −2.385781433 | 2.861643476 | 0.2772 | hsa-miR-98-5p |
| 20500399 | −2.157881528 | 4.021769209 | 0.2706 |
hsa-miR-199a-5p |
| 20500796 | −2.646379389 | 2.254628193 | 0.256 |
hsa-miR-193a-3p |
| 20500786 | −2.165642544 | 4.021769209 | 0.2491 | hsa-miR-184 |
| 20501183 | −2.681288323 | 2.254628193 | 0.2485 | hsa-miR-30e-3p |
| 20532631 | −2.389108936 | 2.861643476 | 0.2431 | ACA20 |
| 20534505 | −3.419080689 | 0 | 0.2411 | hsa-mir-139 |
| 20500724 | −4.572998345 | 0 | 0.2405 | hsa-miR-30b-5p |
| 20500470 | −1.995623568 | 4.960182025 | 0.2404 |
hsa-miR-181a-3p |
| 20501242 | −4.40904384 | 0 | 0.223 |
hsa-miR-378a-5p |
| 20500777 | −3.304790153 | 0 | 0.222 |
hsa-miR-138-1-3p |
| 20500457 | −2.798683433 | 0 | 0.2213 |
hsa-miR-199b-5p |
| 20500472 | −2.479406791 | 2.254628193 | 0.2133 | hsa-miR-214-3p |
| 20500725 | −3.281305219 | 0 | 0.2105 | hsa-miR-30b-3p |
| 20500798 | −2.266005058 | 3.600132115 | 0.2084 | hsa-miR-195-5p |
| 20500455 | −2.443075633 | 2.861643476 | 0.2025 | hsa-miR-187-3p |
| 20504378 | −2.961664196 | 0 | 0.1999 | hsa-miR-628-3p |
| 20500769 | −2.748124213 | 2.254628193 | 0.1907 | hsa-miR-126-3p |
| 20500421 | −3.140677949 | 0 | 0.1907 |
hsa-miR-148a-3p |
| 20500751 | −3.615143592 | 0 | 0.1878 | hsa-miR-143-5p |
| 20500181 | −2.252023278 | 3.600132115 | 0.1792 | hsa-miR-99a-5p |
| 20501159 | −3.522911239 | 0 | 0.1785 | hsa-miR-29c-5p |
| 20501160 | −2.004342033 | 4.960182025 | 0.1766 | hsa-miR-29c-3p |
| 20500433 | −4.0848626 | 0 | 0.1765 | hsa-miR-139-3p |
| 20503809 | −2.106652473 | 4.021769209 | 0.1749 | hsa-miR-497-5p |
| 20503793 | −2.877805839 | 0 | 0.1612 |
hsa-miR-146b-5p |
| 20500745 | −4.285173248 | 0 | 0.1605 | hsa-miR-140-5p |
| 20500448 | −3.262063359 | 0 | 0.1563 |
hsa-miR-181c-5p |
| 20501278 | −2.530236435 | 2.254628193 | 0.153 | hsa-miR-328-3p |
| 20532991 | −2.436811645 | 2.861643476 | 0.1529 |
ENSG00000207118 |
| 20518919 | −2.947617982 | 0 | 0.1481 | hsa-miR-4521 |
| 20500189 | −2.469462691 | 2.254628193 | 0.1474 |
hsa-miR-29b-2-5p |
| 20500767 | −3.049601189 | 0 | 0.147 |
hsa-miR-125b-2-3p |
| 20500471 | −4.243698759 | 0 | 0.1436 | hsa-miR-214-5p |
| 20501279 | −4.160054969 | 0 | 0.139 | hsa-miR-342-5p |
| 20503786 | −3.059282787 | 0 | 0.137 | hsa-miR-489-3p |
| 20500163 | −2.907652913 | 0 | 0.1189 | hsa-miR-30a-3p |
| 20500154 | −4.609102845 | 0 | 0.1011 | hsa-miR-26b-5p |
| 20501237 | −2.009850173 | 4.960182025 | 0.0991 | hsa-miR-375 |
| 20500743 | −2.406363169 | 2.861643476 | 0.096 | hsa-miR-138-5p |
| 20500423 | −6.212996193 | 0 | 0.0923 |
hsa-miR-30c-2-3p |
| 20500782 | −3.711337554 | 0 | 0.0907 | hsa-miR-150-5p |
| 20500432 | −2.542450843 | 2.254628193 | 0.0639 | hsa-miR-139-5p |
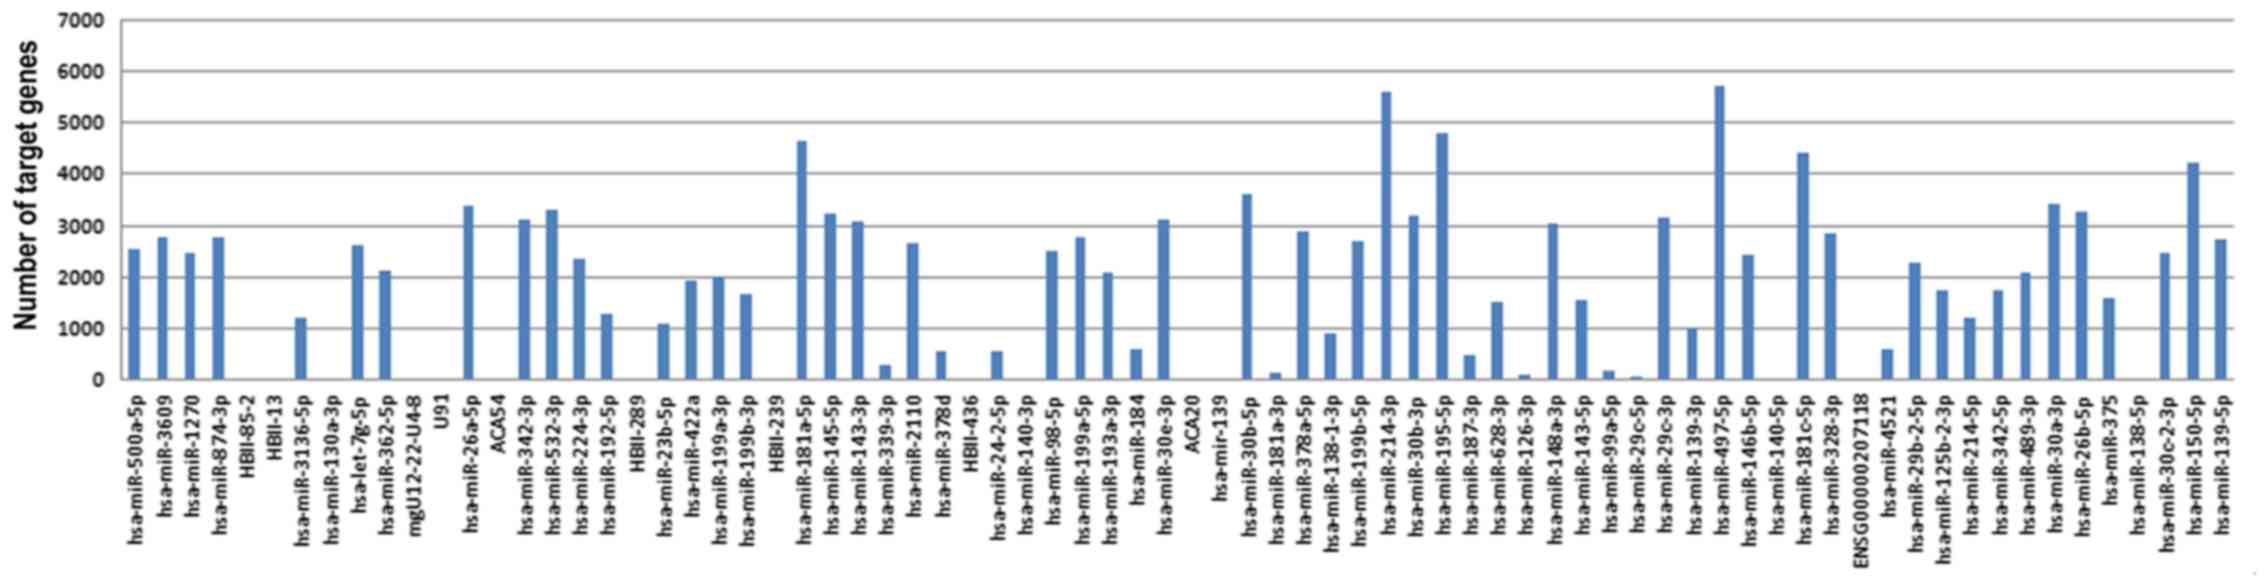
Prediction results of target genes of
differentially expressed miRNAs
There were 140,405 target genes predicted by at
least 6 out of 12 commonly used prediction methods of miRNA target
genes (miRWalk, DIANA-microTv4.0, miRanda-rel2010, mirBridge,
miRDB4.0, miRmap, miRNAMap, PicTar2, PITA, RNA22v2, RNAhybrid2 and
Targetscan6.2) based on miRWalk2.0 (Fig.
3).
Enrichment analysis of predicted
target genes of differentially expressed miRNAs
GO enrichment analysis and KEGG pathway enrichment
analysis were performed for the target genes obtained.
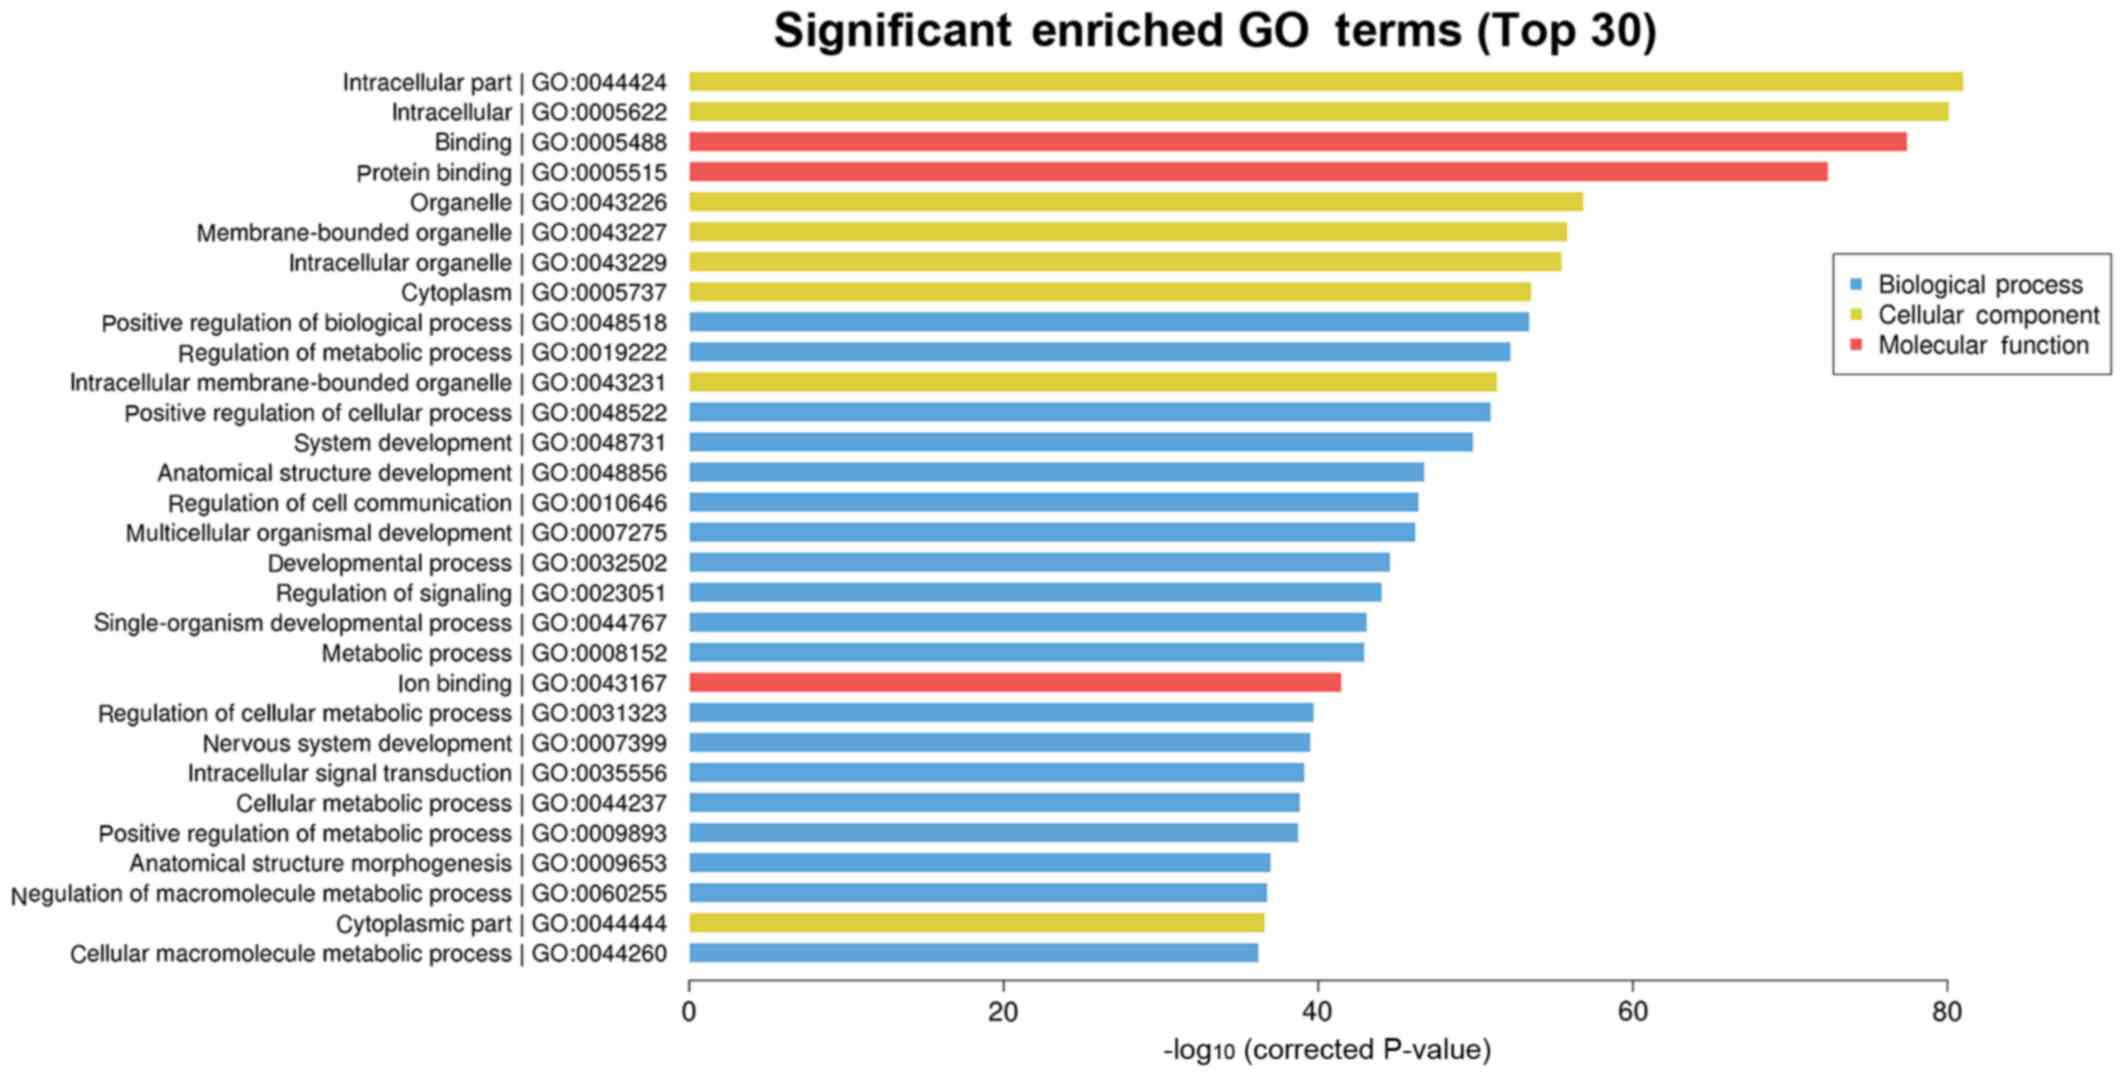
GO enrichment analysis
The analysis of the functions of target genes of
differentially expressed miRNAs via GO enrichment revealed that
they mainly influenced the binding process of intracellular
components to protein, the positive regulation of biological
process and the regulation of metabolic process (Table II and Fig. 4).
| Table II.Top 30 functions of target genes
predicted by Gene Ontology enrichment analysis. |
Table II.
Top 30 functions of target genes
predicted by Gene Ontology enrichment analysis.
| Term | ID | Input no. | P-value |
|---|
| Intracellular
part | GO:0044424 | 10,337 | 4.88E-86 |
| Intracellular | GO:0005622 | 10,575 | 8.05E-85 |
| Binding | GO:0005488 | 10,658 | 5.45E-82 |
| Protein
binding | GO:0005515 | 8,315 | 7.84E-77 |
| Organelle | GO:0043226 | 9,722 | 3.48E-61 |
| Membrane-bounded
organelle | GO:0043227 | 9,087 | 4.35E-60 |
| Intracellular
organelle | GO:0043229 | 9,017 | 1.16E-59 |
| Cytoplasm | GO:0005737 | 8,121 | 1.14E-57 |
| Positive regulation
of biological process | GO:0048518 | 4,488 | 1.7E-57 |
| Regulation of
metabolic process | GO:0019222 | 5,396 | 2.95E-56 |
| Intracellular
membrane-bounded organelle | GO:0043231 | 8,249 | 2.35E-55 |
| Positive regulation
of cellular process | GO:0048522 | 3,863 | 6.5E-55 |
| System
development | GO:0048731 | 3,452 | 9.28E-54 |
| Anatomical
structure development | GO:0048856 | 4,310 | 1.25E-50 |
| Regulation of cell
communication | GO:0010646 | 2,730 | 3.08E-50 |
| Multicellular
organismal development | GO:0007275 | 3,869 | 5.33E-50 |
| Developmental
process | GO:0032502 | 4,556 | 2.3E-48 |
| Regulation of
signaling | GO:0023051 | 2,705 | 8.05E-48 |
| Single-organism
developmental process | GO:0044767 | 4,484 | 7.71E-47 |
| Metabolic
process | GO:0008152 | 8,668 | 1.17E-46 |
| Ion binding | GO:0043167 | 4,768 | 3.55E-45 |
| Regulation of
cellular metabolic process | GO:0031323 | 4,694 | 2.12E-43 |
| Nervous system
development | GO:0007399 | 1,794 | 3.64E-43 |
| Intracellular
signal transduction | GO:0035556 | 2,336 | 9.01E-43 |
| Cellular metabolic
process | GO:0044237 | 7,818 | 1.84E-42 |
| Positive regulation
of metabolic process | GO:0009893 | 3,020 | 2.44E-42 |
| Anatomical
structure morphogenesis | GO:0009653 | 2,103 | 1.42E-40 |
| Regulation of
macromolecule metabolic process | GO:0060255 | 4,502 | 2.42E-40 |
| Cytoplasmic
part | GO:0044444 | 6,197 | 3.54E-40 |
| Cellular
macromolecule metabolic process | GO:0044260 | 6,384 | 9.37E-40 |
KEGG enrichment analysis
KEGG pathway enrichment analysis showed that these
target genes were mainly enriched in the immunity, gene expression,
metabolism and signal transduction, among which signal transduction
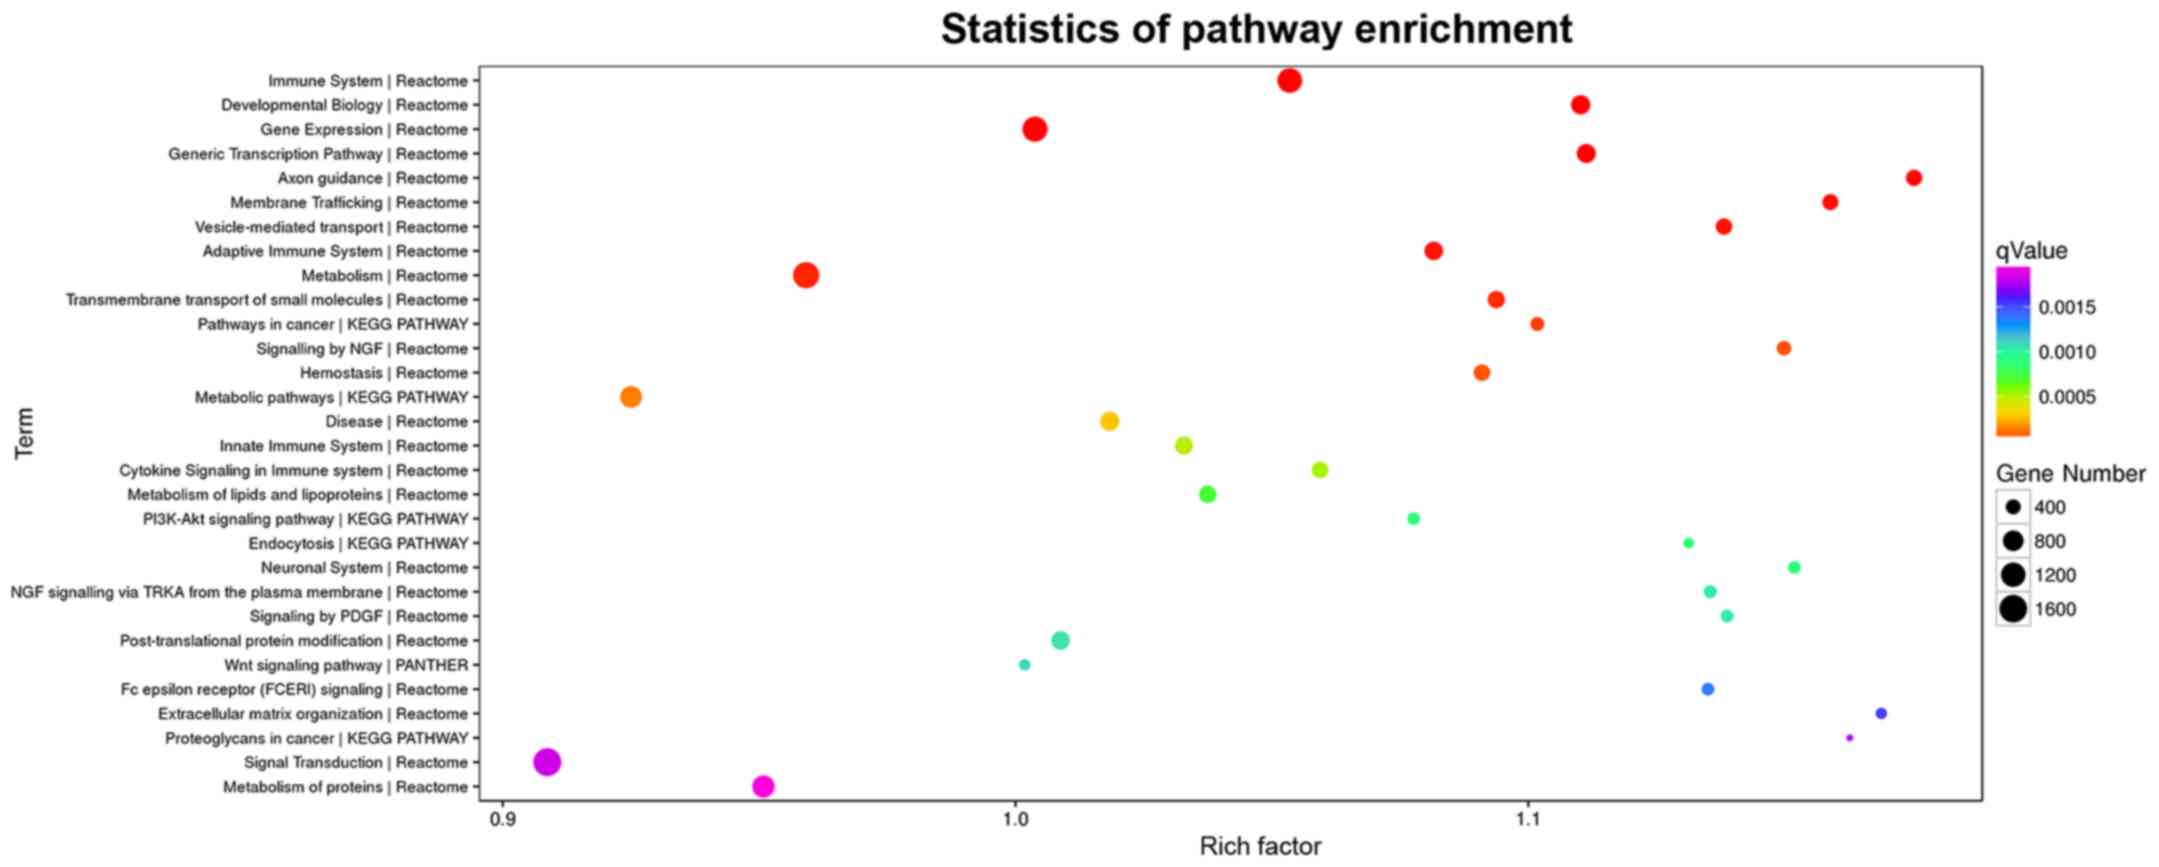
was enriched with the most genes (Table III and Fig. 5).
| Table III.Top 30 signaling pathways by Kyoto
Encyclopedia of Genes and Genomes pathway enrichment analysis. |
Table III.
Top 30 signaling pathways by Kyoto
Encyclopedia of Genes and Genomes pathway enrichment analysis.
| Term | ID | Input no. | P-value |
|---|
| Immune system | R-HSA-168256 | 1,223 | 1.86E-14 |
| Developmental
biology | R-HSA-1266738 | 687 | 3.37E-11 |
| Gene
expression | R-HSA-74160 | 1,266 | 5.31E-11 |
| Generic
transcription pathway | R-HSA-212436 | 668 | 5.66E-11 |
| Axon guidance | R-HSA-422475 | 475 | 2.44E-10 |
| Membrane
trafficking | R-HSA-199991 | 459 | 1.69E-09 |
| Vesicle-mediated
transport | R-HSA-5653656 | 481 | 3.53E-09 |
| Adaptive immune
system | R-HSA-1280218 | 623 | 4.57E-09 |
| Metabolism | R-HSA-1430728 | 1,388 | 1.7E-08 |
| Transmembrane
transport of small molecules | R-HSA-382551 | 530 | 2.38E-08 |
| Pathways in
cancer | hsa05200 | 345 | 5.64E-08 |
| Signaling by
NGF | R-HSA-166520 | 374 | 9.21E-08 |
| Hemostasis | R-HSA-109582 | 486 | 1.11E-07 |
| Metabolic
pathways | hsa01100 | 896 | 2.36E-07 |
| Disease | R-HSA-1643685 | 676 | 5.16E-07 |
| Innate immune
system | R-HSA-168249 | 582 | 9.72E-07 |
| Cytokine signaling
in immune system | R-HSA-1280215 | 486 | 1.14E-06 |
| Metabolism of
lipids and lipoproteins | R-HSA-556833 | 541 | 1.62E-06 |
| PI3K-Akt signaling
pathway | hsa04151 | 289 | 2.22E-06 |
| Endocytosis | hsa04144 | 232 | 2.25E-06 |
| Neuronal
system | R-HSA-112316 | 288 | 2.38E-06 |
| NGF signaling via
TRKA from the plasma membrane | R-HSA-187037 | 304 | 2.86E-06 |
| Signaling by
PDGF | R-HSA-186797 | 299 | 2.93E-06 |
| Post-translational
protein modification | R-HSA-597592 | 625 | 3.14E-06 |
| Wnt signaling
pathway | P00057 | 254 | 3.36E-06 |
| Fc epsilon receptor
signaling | R-HSA-2454202 | 293 | 4.37E-06 |
| Extracellular
matrix organization | R-HSA-1474244 | 250 | 5.24E-06 |
| Proteoglycans in
cancer | hsa05205 | 188 | 6.53E-06 |
| Signal
transduction | R-HSA-162582 | 1,634 | 6.87E-06 |
| Metabolism of
proteins | R-HSA-392499 | 965 | 7.64E-06 |
Disease enrichment analysis
The tenth disease enriched was cancer (Table IV and Fig. 6).
 | Figure 6.Top 30 related diseases by disease
enrichment analysis. The top 30 related diseases of the
differentially expressed miRNAs obtained by OMIM, KEGG, FunDO, GAD
and NHGRI GWAS Catalog enrichment analyses. The length of each bar
represents the P-value. The longer the bar, the smaller the
P-value. Among the top 30 related diseases mainly enriched by KEGG
and NHGRI GWAS, the 10th disease enriched was cancer. miRNA, micro
ribonucleic acid; OMIM, Online Mendelian Inheritance in Man; KEGG,
Kyoto Encyclopedia of Genes and Genomes; FunDO, Functional Disease
Ontology; GAD, Genetic Association Database; NHGRI, National Human
Genome Research Institute; GWAS, genome-wide association study. |
| Table IV.Top 30 related diseases by disease
enrichment analysis. |
Table IV.
Top 30 related diseases by disease
enrichment analysis.
| Term | Database ID | Input no. | P-value |
|---|
| Obesity-related
traits | NHGRI GWAS
Catalog | 553 | 9.65E-09 |
| Nervous system
diseases | KEGG DISEASE | 469 | 4.65E-08 |
| Other nervous and
sensory system diseases | KEGG DISEASE | 364 | 1.11E-06 |
| Other congenital
disorders | KEGG DISEASE | 370 | 4.66E-06 |
| Congenital
disorders of metabolism | KEGG DISEASE | 442 | 6.5E-06 |
| Height | NHGRI GWAS
Catalog | 381 | 7.71E-06 |
| Schizophrenia | NHGRI GWAS
Catalog | 341 | 2.43E-05 |
| Musculoskeletal
diseases | KEGG DISEASE | 226 | 3.18E-05 |
| Body mass
index | NHGRI GWAS
Catalog | 266 | 8.04E-05 |
| Cancers | KEGG DISEASE | 182 | 9.03E-05 |
| Congenital
disorders of development | KEGG DISEASE | 250 | 0.000146 |
| Inflammatory bowel
disease | NHGRI GWAS
Catalog | 221 | 0.00015 |
| Skeletal
diseases | KEGG DISEASE | 169 | 0.000159 |
| Others | KEGG DISEASE | 128 | 0.000344 |
| Skin diseases | KEGG DISEASE | 155 | 0.000494 |
| Skin and soft
tissue diseases | KEGG DISEASE | 155 | 0.000494 |
| Amyotrophic lateral
sclerosis (sporadic) | NHGRI GWAS
Catalog | 137 | 0.000534 |
| Cardiovascular
diseases | KEGG
DISEASE129 | 223 | 0.000678 |
| Menarche (age at
onset) | NHGRI GWAS
Catalog | 145 | 0.000978 |
| Crohn's
disease | NHGRI GWAS
Catalog | 200 | 0.00128 |
| Type 2
diabetes | NHGRI GWAS
Catalog | 150 | 0.001504 |
| Neurodegenerative
diseases | KEGG DISEASE | 132 | 0.002359 |
| Immune system
diseases | KEGG DISEASE | 186 | 0.003778 |
|
Diisocyanate-induced asthma | NHGRI GWAS
Catalog | 135 | 0.004021 |
| Congenital
disorders of amino acid metabolism | KEGG DISEASE | 102 | 0.004472 |
| Kidney
diseases | KEGG DISEASE | 72 | 0.004562 |
| Urinary system
diseases | KEGG DISEASE | 72 | 0.004562 |
| HDL
cholesterol | NHGRI GWAS
Catalog | 112 | 0.004949 |
| Rheumatoid
arthritis | NHGRI GWAS
Catalog | 114 | 0.005032 |
| Breast cancer | NHGRI GWAS
Catalog | 100 | 0.005145 |
Comparison of miRNA-139-5p and
miRNA-150-5p relative expression levels between the lung cancer and
control group and its influence on prognosis
According to RT-qPCR verification with an expanded
sample size, the expression levels of miRNA-139-5p and miRNA-150-5p
in lung cancer group were lower than those in control group, in
accordance to the GeneChip results, displaying statistically
significant differences (P<0.05) (Fig. 2C). The use of online resources
(http://www.oncomir.org/) predicted that
low-expression miRNA-139-5p in lung squamous cell carcinoma and
high-expression miRNA-150-5p in lung adenocarcinoma have a good
prognosis (Tables V and VI, Fig. 2D and
E).
| Table V.Cancer types where survival is
significantly associated with miR-139-5p and miR-150-5p. |
Table V.
Cancer types where survival is
significantly associated with miR-139-5p and miR-150-5p.
|
|
| Log-rank |
|
|
|
| t-test |
|---|
|
|
|
|
|
|
|
|
|
|---|
| miRNA | Cancer | P-value | FDR | Z-score | Upregulated in | Deceased
log2 mean expression | Living
log2 mean expression | P-value | FDR |
|---|
| miR-139-5p | LUSC | 1.55e-02 | 9.92e-01 | 2.452 | Deceased | 5.00 |
4.82 | 2.16e-01 | 7.43e-01 |
| miR-150-5p | LUAD | 7.52e-03 | 9.56e-02 | 2.693 | Living | 9.94 | 10.18 | 4.22e-02 | 4.85e-01 |
| Table VI.Value of miR-139-5p and miR-150-5p
for survival prognosis. |
Table VI.
Value of miR-139-5p and miR-150-5p
for survival prognosis.
| Cancer | Total no. of
patients | Living
patients | Deceased
patients | Low risk | High risk | Value of miRNA for
survival prognosis |
|---|
| LUSC | 472 | 272 | 200 | 236 | 236 | S = 2.452 ×
EmiR-139-5p + 0.173 × EmiR-150-5p |
| LUAD | 500 | 319 | 181 | 250 | 250 | S = 1.196 ×
EmiR-139-5p + 2.693 × EmiR-150-5p |
Discussion
NSCLC is a kind of solid tumor that is often
diagnosed in the late stage, due to the lack of specific early
symptoms, resulting in fewer opportunities for operation. Moreover,
most of the samples in clinical survey are obtained via
bronchoscopic small biopsy or cytology, so the number of tumor
cells available is small with poor quality. miRNAs, as a kind of
biomarkers, have expression dysregulation in the resected primary
NSCLC tissues (17), which plays
important roles in the classification of lung cancer subtypes,
prognosis of patient, and sensitivity to chemotherapy (18,19). In
the present study, a comprehensive miRNA expression profile was
identified, and abnormally expressed miRNAs in tumor tissues were
confirmed, providing references for the in-depth research on the
role of miRNAs in occurrence and development of tumors.
According to the systematic analysis of miRNA in
various human cancers and 217 types of mammals, the miRNA profile
has a surprising amount of information, reflecting the
developmental lineage and differentiation status of tumors. miRNAs
in tumors are generally downregulated, compared with those in
normal tissues, and the miRNA expression profile is valuable for
the classification of poorly differentiated tumors (20). The results of this study are
consistent with those in the above studies: All of the 76
differentially expressed miRNAs screened were downregulated, and no
differentially expressed miRNAs were upregulated. miRNAs are a kind
of non-coding regulatory RNAs involved in the occurrence of tumors
and they display significant tissue specificity, which can serve as
effective biomarkers for tracking the cancer of unknown origin
(21). Previous studies have
demonstrated that the miRNA expression profile is correlated with
the survival of lung adenocarcinoma. Univariate analysis has shown
that the high expression of hsa-mir-155 and low expression of
hsa-let-7a-2 are correlated with the low survival rate, while
multivariate analysis have revealed that hsa-mir-155 is still
related to the survival rate, and the miRNA expression profile is a
diagnostic and prognostic marker for lung cancer (22). The above results also suggest that
the expression of miRNA in NSCLC is different from that of mRNA
(23,24). The role of miRNA in the overall
survival of patients with NSCLC has been analyzed currently, which
may provide valuable information for the treatment of NSCLC
(25). However, its expression in
lung cancer tissues was less consistent in the previous studies.
Whether the lung cancer stage, case type and smoking status affect
the results is worthy of further exploration and analysis. The low
expression of cell adhesion molecule 1 (CADM1) is closely related
to the short survival of NSCLC (26), and it is essential to search for new
markers.
In the present study, five miRNAs were selected and
verified via RT-qPCR with an expanded sample size, and it was found
that both miR-139-5p and miRNA-150-5p were downregulated, which is
consistent with the GeneChip results. It is also reported that
miR-139-5p is significantly downregulated in primary NSCLC tissues
and cell lines. On the one hand, the ectopic expression of
miR-139-5p significantly inhibits cell growth through suppressing
the upregulation of cyclin D1 and p57 (Kip2), on the other hand,
miR-139-5p induces apoptosis through upregulating cleaved
caspase-3, a key apoptotic gene, and downregulating Bcl-2, an
anti-apoptotic gene. In addition, miR-139-5p inhibits cell
migration through inhibiting matrix metalloproteinase (MMP)-7 and
MMP-9, and it was also found that miR-139-5p inhibits cell
proliferation and metastasis promoting apoptosis through targeting
oncogenic c-Met, thus playing a key role in lung cancer (27). In primary NSCLC, the miR-139
silencing mediated by histone H3 lysine 27 trimethylation
(H3K27me3) enhances the distant lymph node metastasis and
histological invasion (lymphatic invasion and vascular invasion) of
NSCLC (28). Moreover, miR-139-5p
inhibits in vitro proliferation, migration and invasion of
lung cancer cells through targeting the insulin-like growth factor
1 receptor (IGF1R) (29).
miRNA-150-5p has not been reported in NSCLC in detail, however it
has been reported that miRNA-150-5p and miRNA-34c-3p are closely
related to skeletal muscle mitochondrial function in human body
(30), and the downregulation of
miR-150-5p, a new circulating biomarker for acute heart failure
(AHF), is correlated with the pathophysiology of AHF (31). In multiple myeloma, miR-150-5p
arouses the specific effect of glucocorticoid receptor (GR) to
increase the therapeutic response of glucocorticoids through
indirectly regulating the interaction of GR with transcription
factors and GR chaperones and motivating mRNA of various effectors,
protein stress and chemokines of GR (32). In future research, the role of
downregulation of miR-139-5p and miR-150-5p in NSCLC needs to be
further clarified, and their specific values in target genes and
functions should also be determined.
In the present study, the enrichment analysis of the
functions of target genes of differentially expressed miRNAs
revealed that they mainly influence the binding process of
intracellular components to protein, the positive regulation of
biological process and the regulation of the metabolic process.
Moreover, KEGG pathway enrichment analysis showed that these target
genes are mainly enriched in the immunity, gene expression,
metabolism and signal transduction, among which signal transduction
is enriched with the most genes. It was confirmed by previous
studies that inhibiting miR-192 and miR-662 reduces the clonality
and motility of early squamous cell carcinoma cells and increases
the sensitivity to etoposide (33).
Downregulation of miR-30a-5p and upregulation of miR-210-3p in
NSCLC have excellent sensitivity and acceptable specificity, which
can assist in distinguishing cancer and non-cancer tissues
(34). The chronic treatment of
NSCLC with gefitinib will alter the miRNA expression, including the
significant decline in miR-155 and miR-200c accompanied by
epidermal growth factor receptor (EGFR) mutation, and the decline
in miR-155 and miR-200c may be correlated with
epithelial-mesenchymal transition and histone modification, which
may reduce the sensitivity to gefitinib, independent of the
secondary EGFR mutation (35). miRNA
may play a role in immune escape, resistance to chemotherapeutic
drugs and biological functions of lung cancer cells. Research on
the roles of miR-139-5p and miR-150-5p in diagnosis, metabolism,
signal transduction, biological behaviors and drug resistance in
NSCLC will benefit the diagnosis and treatment of lung cancer
patients, and may even bring an unexpected breakthrough in
immunotherapy.
In conclusion, in the present investigation through
GeneChip, it was revealed that miRNAs are mainly downregulated in
the miRNA expression profile of lung cancer tissues in the
middle-altitude area, which is not completely consistent with the
miRNA expression difference in NSCLC tissues as reported by
previous studies, indicating the individual difference and
complexity of miRNA in pathogenesis. According to the verification
with an expanded sample size, both miR-139-5p and miR-150-5p are
downregulated, thus, deeply exploring their important roles in the
occurrence and development of disease and regulation of tumor cell
functions has great clinical value in the diagnosis, treatment and
evaluation of lung cancer.
Acknowledgements
Not applicable.
Funding
The study was funded by the Fundamental Research for
Application Project of the Qinghai Science and Technology
Department (project no. 2016-ZJ-778).
Availability of data and materials
The datasets used and/or analyzed during the current
study are available from the corresponding author on reasonable
request.
Authors' contributions
YG wrote the manuscript and was responsible for the
immunohistochemistry. YG and XS performed PCR. XW and XL were
responsible for GeneChip scanning of lung cancer tissues. YG and YX
assisted with statistical analysis. All authors read and approved
the final manuscript.
Ethics approval and consent to
participate
The study was approved by the Ethics Committee of
Qinghai Provincial People's Hospital (Xining, China) (approval no.
2015-07); and informed consents were signed by the patients and/or
their guardians.
Patient consent for publication
Not applicable.
Competing interests
The authors declare that they have no competing
interests.
References
|
1
|
Schreiber G and McCrory DC: Performance
characteristics of different modalities for diagnosis of suspected
lung cancer: Summary of published evidence. Chest. 123 (Suppl
1):115S–128S. 2003. View Article : Google Scholar : PubMed/NCBI
|
|
2
|
Markou A, Sourvinou I, Vorkas PA, Yousef
GM and Lianidou E: Clinical evaluation of microRNA expression
profiling in non small cell lung cancer. Lung Cancer. 81:388–396.
2013. View Article : Google Scholar : PubMed/NCBI
|
|
3
|
Solomides CC, Evans BJ, Navenot JM,
Vadigepalli R, Peiper SC and Wang ZX: MicroRNA profiling in lung
cancer reveals new molecular markers for diagnosis. Acta Cytol.
56:645–654. 2012. View Article : Google Scholar : PubMed/NCBI
|
|
4
|
Landi MT, Zhao Y, Rotunno M, Koshiol J,
Liu H, Bergen AW, Rubagotti M, Goldstein AM, Linnoila I, Marincola
FM, et al: MicroRNA expression differentiates histology and
predicts survival of lung cancer. Clin Cancer Res. 16:430–441.
2010. View Article : Google Scholar : PubMed/NCBI
|
|
5
|
Petriella D, De Summa S, Lacalamita R,
Galetta D, Catino A, Logroscino AF, Palumbo O, Carella M, Zito FA,
Simone G, et al: miRNA profiling in serum and tissue samples to
assess noninvasive biomarkers for NSCLC clinical outcome. Tumour
Biol. 37:5503–5513. 2016. View Article : Google Scholar : PubMed/NCBI
|
|
6
|
Heller G, Altenberger C, Steiner I,
Topakian T, Ziegler B, Tomasich E, Lang G, End-Pfützenreuter A,
Zehetmayer S, Döme B, et al: DNA methylation of microRNA-coding
genes in non-small-cell lung cancer patients. J Pathol.
245:387–398. 2018. View Article : Google Scholar : PubMed/NCBI
|
|
7
|
van Rooij E: The art of microRNA research.
Circ Res. 108:219–234. 2011. View Article : Google Scholar : PubMed/NCBI
|
|
8
|
Pedersen AK, Mendes Lopes de Melo J, Mørup
N, Tritsaris K and Pedersen SF: Tumor microenvironment conditions
alter Akt and Na+/H+ exchanger NHE1
expression in endothelial cells more than hypoxia alone:
Implications for endothelial cell function in cancer. BMC Cancer.
17:5422017. View Article : Google Scholar : PubMed/NCBI
|
|
9
|
Petrova V, Annicchiarico-Petruzzelli M,
Melino G and Amelio I: The hypoxic tumour microenvironment.
Oncogenesis. 7:102018. View Article : Google Scholar : PubMed/NCBI
|
|
10
|
Lanikova L, Reading NS, Hu H, Tashi T,
Burjanivova T, Shestakova A, Siwakoti B, Thakur BK, Pun CB, Sapkota
A, et al: Evolutionary selected Tibetan variants of HIF pathway and
risk of lung cancer. Oncotarget. 8:11739–11747. 2017. View Article : Google Scholar : PubMed/NCBI
|
|
11
|
Mirsadraee S, Oswal D, Alizadeh Y, Caulo A
and van Beek E Jr: The 7th lung cancer TNM classification and
staging system: Review of the changes and implications. World J
Radiol. 4:128–134. 2012. View Article : Google Scholar : PubMed/NCBI
|
|
12
|
Livak KJ and Schmittgen TD: Analysis of
relative gene expression data using real-time quantitative PCR and
the 2(-Delta Delta C(T)) method. Methods. 25:402–408. 2001.
View Article : Google Scholar : PubMed/NCBI
|
|
13
|
Irizarry RA, Hobbs B, Collin F,
Beazer-Barclay YD, Antonellis KJ, Scherf U and Speed TP:
Exploration, normalization, and summaries of high density
oligonucleotide array probe level data. Biostatistics. 4:249–264.
2003. View Article : Google Scholar : PubMed/NCBI
|
|
14
|
Dweep H and Gretz N: miRWalk2.0: A
comprehensive atlas of microRNA-target interactions. Nat Methods.
12:6972015. View Article : Google Scholar : PubMed/NCBI
|
|
15
|
Ashburner M, Ball CA, Blake JA, Botstein
D, Butler H, Cherry JM, Davis AP, Dolinski K, Dwight SS, Eppig JT,
et al: Gene ontology: Tool for the unification of biology. The Gene
Ontology Consortium. Nat Genet. 25:25–29. 2000. View Article : Google Scholar : PubMed/NCBI
|
|
16
|
Kanehisa M and Goto S: KEGG: kyoto
encyclopedia of genes and genomes. Nucleic Acids Res. 28:27–30.
2000. View Article : Google Scholar : PubMed/NCBI
|
|
17
|
Lin PY, Yu SL and Yang PC: MicroRNA in
lung cancer. Br J Cancer. 103:1144–1148. 2010. View Article : Google Scholar : PubMed/NCBI
|
|
18
|
Wang Q, Wang S, Wang H, Li P and Ma Z:
MicroRNAs: Novel biomarkers for lung cancer diagnosis, prediction
and treatment. Exp Biol Med (Maywood). 237:227–235. 2012.
View Article : Google Scholar : PubMed/NCBI
|
|
19
|
Vannini I, Fanini F and Fabbri M:
MicroRNAs as lung cancer biomarkers and key players in lung
carcinogenesis. Clin Biochem. 46:918–925. 2013. View Article : Google Scholar : PubMed/NCBI
|
|
20
|
Lu J, Getz G, Miska EA, Alvarez-Saavedra
E, Lamb J, Peck D, Sweet-Cordero A, Ebert BL, Mak RH, Ferrando AA,
et al: MicroRNA expression profiles classify human cancers. Nature.
435:834–838. 2005. View Article : Google Scholar : PubMed/NCBI
|
|
21
|
Rosenfeld N, Aharonov R, Meiri E,
Rosenwald S, Spector Y, Zepeniuk M, Benjamin H, Shabes N, Tabak S,
Levy A, et al: MicroRNAs accurately identify cancer tissue origin.
Nat Biotechnol. 26:462–469. 2008. View
Article : Google Scholar : PubMed/NCBI
|
|
22
|
Yanaihara N, Caplen N, Bowman E, Seike M,
Kumamoto K, Yi M, Stephens RM, Okamoto A, Yokota J, Tanaka T, et
al: Unique microRNA molecular profiles in lung cancer diagnosis and
prognosis. Cancer Cell. 9:189–198. 2006. View Article : Google Scholar : PubMed/NCBI
|
|
23
|
Boutros PC, Lau SK, Pintilie M, Liu N,
Shepherd FA, Der SD, Tsao MS, Penn LZ and Jurisica I: Prognostic
gene signatures for non-small-cell lung cancer. Proc Natl Acad Sci
USA. 106:2824–2828. 2009. View Article : Google Scholar : PubMed/NCBI
|
|
24
|
Hou J, Aerts J, den Hamer B, van Ijcken W,
den Bakker M, Riegman P, van der Leest C, van der Spek P, Foekens
JA, Hoogsteden HC, et al: Gene expression-based classification of
non-small cell lung carcinomas and survival prediction. PLoS One.
5:e103122010. View Article : Google Scholar : PubMed/NCBI
|
|
25
|
Yu N, Zhang Q, Liu Q, Yang J and Zhang S:
A meta-analysis: microRNAs' prognostic function in patients with
nonsmall cell lung cancer. Cancer Med. 6:2098–2105. 2017.
View Article : Google Scholar : PubMed/NCBI
|
|
26
|
Botling J, Edlund K, Lohr M, Hellwig B,
Holmberg L, Lambe M, Berglund A, Ekman S, Bergqvist M, Pontén F, et
al: Biomarker discovery in non-small cell lung cancer: Integrating
gene expression profiling, meta-analysis, and tissue microarray
validation. Clin Cancer Res. 19:194–204. 2013. View Article : Google Scholar : PubMed/NCBI
|
|
27
|
Sun C, Sang M, Li S, Sun X, Yang C, Xi Y,
Wang L, Zhang F, Bi Y, Fu Y, et al: Hsa-miR-139-5p inhibits
proliferation and causes apoptosis associated with downregulation
of c-Met. Oncotarget. 6:39756–39792. 2015. View Article : Google Scholar : PubMed/NCBI
|
|
28
|
Watanabe K, Amano Y, Ishikawa R, Sunohara
M, Kage H, Ichinose J, Sano A, Nakajima J, Fukayama M, Yatomi Y, et
al: Histone methylation-mediated silencing of miR-139 enhances
invasion of non-small-cell lung cancer. Cancer Med. 4:1573–1582.
2015. View
Article : Google Scholar : PubMed/NCBI
|
|
29
|
Xu W, Hang M, Yuan CY, Wu FL, Chen SB and
Xue K: MicroRNA-139-5p inhibits cell proliferation and invasion by
targeting insulin-like growth factor 1 receptor in human non-small
cell lung cancer. Int J Clin Exp Pathol. 8:3864–3870.
2015.PubMed/NCBI
|
|
30
|
Dahlmans D, Houzelle A, Andreux P,
Jörgensen JA, Wang X, de Windt LJ, Schrauwen P, Auwerx J and Hoeks
J: An unbiased silencing screen in muscle cells identifies
miR-320a, miR-150, miR-196b, and miR-34c as regulators of skeletal
muscle mitochondrial metabolism. Mol Metab. 6:1429–1442. 2017.
View Article : Google Scholar : PubMed/NCBI
|
|
31
|
Scrutinio D, Conserva F, Passantino A,
Iacoviello M, Lagioia R and Gesualdo L: Circulating microRNA-150-5p
as a novel biomarker for advanced heart failure: A genome-wide
prospective study. J Heart Lung Transplant. 36:616–624. 2017.
View Article : Google Scholar : PubMed/NCBI
|
|
32
|
Palagani A, Op de Beeck K, Naulaerts S,
Diddens J, Sekhar Chirumamilla C, Van Camp G, Laukens K, Heyninck
K, Gerlo S, Mestdagh P, et al: Ectopic microRNA-150-5p
transcription sensitizes glucocorticoid therapy response in MM1S
multiple myeloma cells but fails to overcome hormone therapy
resistance in MM1R cells. PLoS One. 9:e1138422014. View Article : Google Scholar : PubMed/NCBI
|
|
33
|
Filipska M, Skrzypski M, Czetyrbok K,
Stokowy T, Stasiłojć G, Supernat A, Jassem J, Żaczek AJ and Bigda
J: miR-192 and miR-662 enhance chemoresistance and invasiveness of
squamous cell lung carcinoma. Lung Cancer. 118:111–118. 2018.
View Article : Google Scholar : PubMed/NCBI
|
|
34
|
Świtlik W, Karbownik MS, Suwalski M, Kozak
J and Szemraj J: miR-30a-5p together with miR-210-3p as a promising
biomarker for non-small cell lung cancer: A preliminary study.
Cancer Biomark. 21:479–488. 2018. View Article : Google Scholar : PubMed/NCBI
|
|
35
|
Narita M, Shimura E, Nagasawa A, Aiuchi T,
Suda Y, Hamada Y, Ikegami D, Iwasawa C, Arakawa K, Igarashi K, et
al: Chronic treatment of non-small-cell lung cancer cells with
gefitinib leads to an epigenetic loss of epithelial properties
associated with reductions in microRNA-155 and −200c. PLoS One.
12:e01721152017. View Article : Google Scholar : PubMed/NCBI
|