Introduction
The tumor suppressor gene PTEN is frequently deleted
or mutated in human prostate cancer (1). Prostate-specific PTEN knockout in
transgenic mice was revealed to promote prostate cancer progression
and metastasis (2). PTEN encodes a
dual-specificity protein phosphatase and negatively regulates the
phosphatidylinositol 3-kinase (PI3K)/AKT signaling pathway. Loss of
PTEN leads to the activation of the PI3K/Akt signaling pathway and
tumorigenesis (3). Furthermore, PTEN
can interact directly with p53 and regulate p53 stability and
transcriptional activity in an Akt-independent manner (4,5). In
addition, PTEN loss can also lead to the activation of the c-Jun
NH2-terminal kinase (JNK) pathway independent of the
PI3K/Akt signaling pathway (6).
Therefore, PTEN loss changes several pathways to promote prostate
cancer development.
Different from well-differentiated tissue cells,
which mainly depend on the energy supplied by mitochondrial
oxidative phosphorylation to keep cellular activities, tumor cells
prefer aerobic glycolysis. This preference generates energy by
converting glucose to lactate in an aerobic environment as the main
way to supply ATP for their proliferation and other cellular
processes. This paradox phenomenon is named the Warburg effect
(7). Compared with other epithelial
cancers, there are more changes in lipid metabolism of prostate
cancers (8,9). PTEN loss can lead to the overexpression
of fatty acid synthase (FAS), which is associated closely with both
cholesterol and fatty acid biosynthesis in human tumors, especially
in prostate cancer (10). In
addition, the transgenic mouse model with global PTEN
overexpression resulted in reduced glucose and glutamine uptake,
increased mitochondrial oxidative phosphorylation, and was
resistant to oncogenic transformation (11). The inhibition of the metabolic
reprogramming induced by PTEN loss is possibly a potential target
for cancer prevention and therapy.
In the present study, the metabolic reprogramming in
siRNA-mediated PTEN knockdown prostate cancer cells DU-145 was
examined with a novel comprehensive metabolomics analysis method.
Comprehensive metabolic analysis is a breakthrough method capable
of clarifying the global profiles of abundant metabolites. The
glucose, glutamine and fatty acid metabolic pathways were focused
on, and the related metabolic changes induced by PTEN loss in
DU-145 cells were reported.
Materials and methods
Cell culture and treatment with
siRNAs
DU-145 and 22Rv1 cells were purchased from the
American Type Culture Collection (ATCC; Manassas, VA). DU-145 cells
were cultured in Gibco DMEM (Thermo Fisher Scientific, Inc.,
Waltham, MA, USA) and 22Rv1 cells were cultured in Gibco RPMI-1640
(Thermo Fisher Scientific, Inc.) containing 10% fetal calf serum,
100 U/ml penicillin and 100 µg/ml streptomycin in a humidified
atmosphere containing 5% CO2 set at 37°C. Every two
days, media were changed to provide cells with optimal growth
conditions.
All siRNA oligonucleotides were purchased from
GenePharma Co., Ltd. (Shanghai, China). The sequences of all
specific siRNAs targeted to human PTEN are displayed in Fig. 1A. The siRNAs were transfected into
cells with Lipofectamine 2000 (Invitrogen; Thermo Fisher
Scientific, Inc.). In the small interfering RNA (siRNA) data set,
prostate cancer cells were divided into 3 groups. The control group
was transfected with control siRNA at a dose of 40 nM. The
experimental group was transfected with either PTEN siRNA-1 or PTEN
siRNA-2 at a dose of 20 or 40 nM. The media of the different groups
were replaced by the fresh complete culture media after
transfection for 6 h. Recombinant lentiviral vectors were
constructed with an Invitrogen ViraPower™ Lentiviral System (Thermo
Fisher Scientific, Inc.) in our laboratory. The lentiviral vectors
pLKO-Scramble/PTEN shRNA-1/PTEN shRNA-2, PAX2 and PMD2G were
transfected into 293T cells using Lipofectamine 2000 (Invitrogen;
Thermo Fisher Scientific, Inc.) according to the manufacturer's
instructions. DU-145 and 22Rv1 cells were infected with the viral
medium from 293T cells 48 h after transfection.
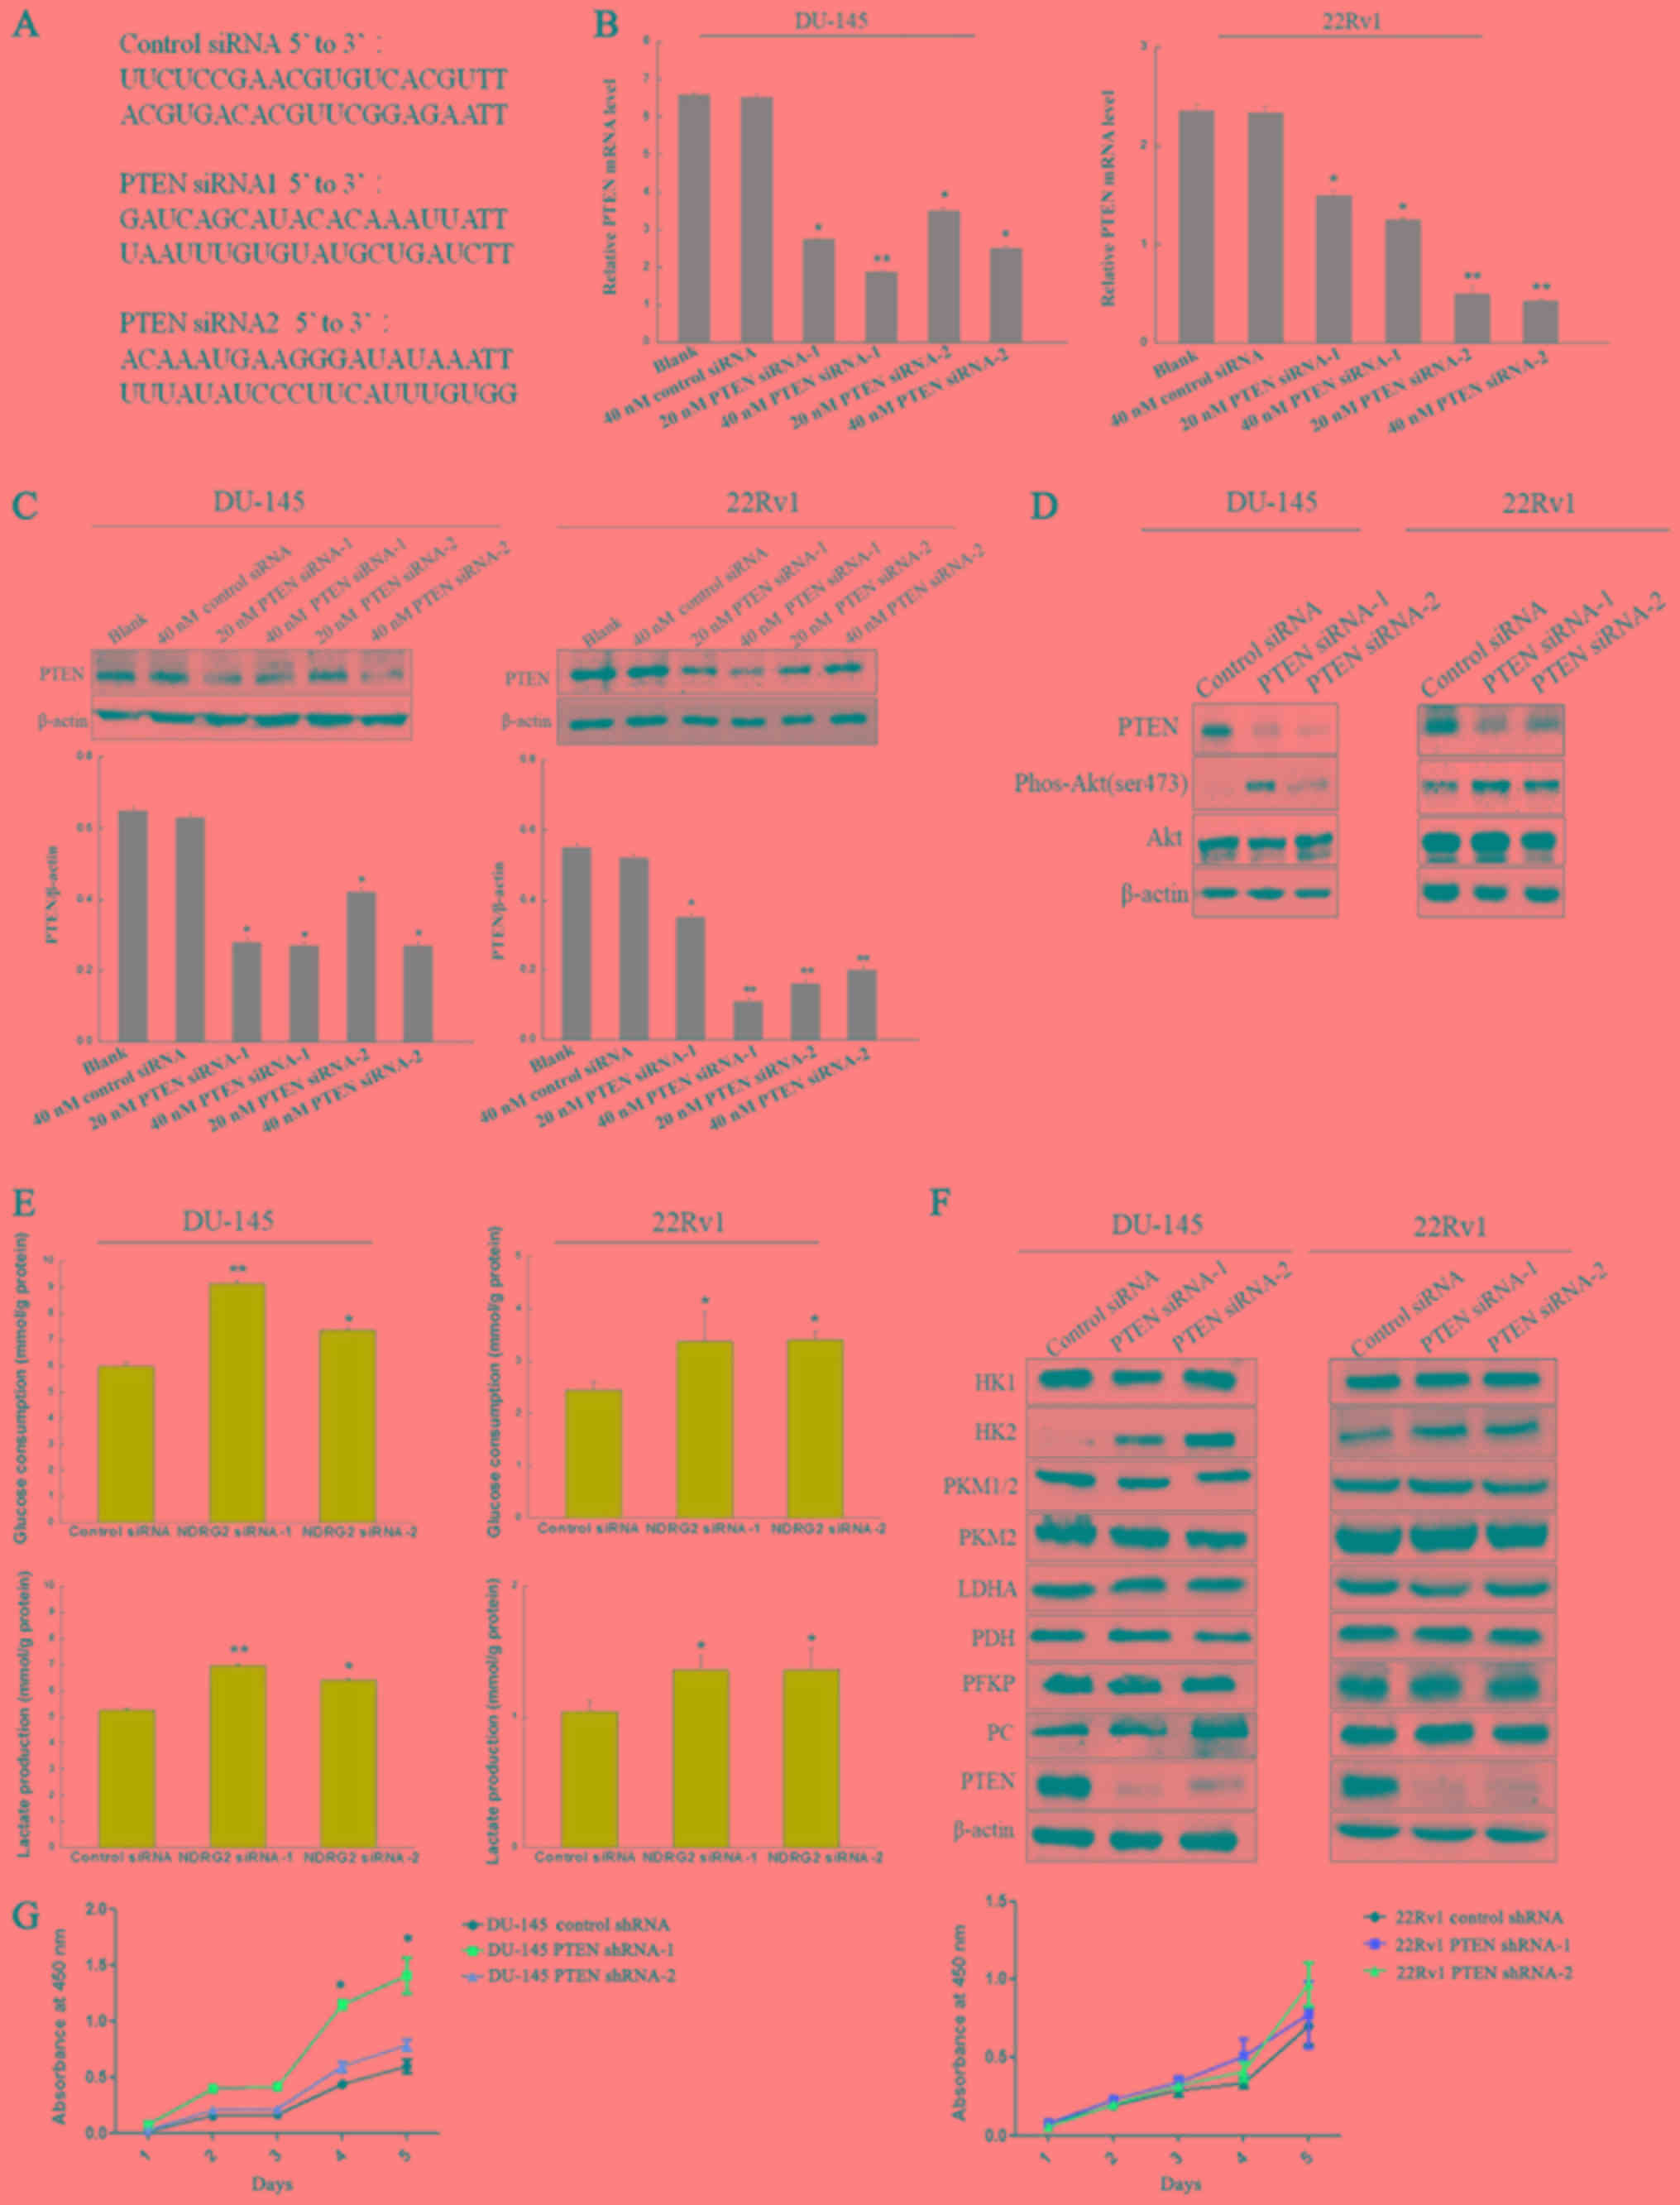 | Figure 1.PTEN knockdown by siRNAs promotes
glucose consumption and lactate production. (A) The siRNA sequences
used in this experiment. (B) DU-145 and 22Rv1 cells were
transfected with 40 nM control siRNA and indicated concentrations
of two different siRNAs targeting PTEN (PTEN siRNA-1 and PTEN
siRNA-2) for 48 h, after which samples were collected for
quantitative real-time PCR and (C) Western blotting with antibodies
against PTEN and β-actin. (D) DU-145 and 22Rv1 cells were
transfected with 40 nM control siRNA and PTEN siRNAs (PTEN siRNA-1
and PTEN siRNA-2) for 48 h, after which samples were collected for
Western blotting with antibodies against PTEN, phospho-Akt
(Ser473), Akt and β-actin. (E) Glucose consumption and lactate
production was assessed in DU-145 cells and 22Rv1 cells which were
transfected with 40 nM control siRNA and PTEN siRNAs (PTEN siRNA-1
and PTEN siRNA-2) for 48 h. (F) The expression of catalytic enzymes
in glycometabolism was detected by western blotting in DU-145 cells
and 22Rv1 cells which were transfected with 40 nM control siRNA and
PTEN siRNAs (PTEN siRNA-1 and PTEN siRNA-2) for 48 h. (G) DU-145
and 22Rv1 cells which were infected with lentivirus containing PTEN
shRNA or scramble shRNA, then cell viability was analyzed by MTT
assay. HK1, hexokinase 1; HK2, hexokinase 2; PKM1/2, pyruvate
kinase isozymes M1/M2; PKM2, pyruvate kinase isozyme M2; LDHA,
lactate dehydrogenase A; PDH, pyruvate dehydrogenase; PFKP,
phosphofructokinase platelet type; PC, pyruvate carboxylase; PTEN,
gene of phosphate and tension homology deleted on chromosome ten.
*P<0.05, **P<0.01 compared with the cells transfected with
control siRNA. |
Quantitative real-time PCR
After transfection with siRNAs for 48 h, total RNA
was isolated from cells using TRIzol Reagent (Invitrogen; Thermo
Fisher Scientific, Inc.), and then complementary DNA (cDNA) was
synthesized using AMV reverse transcriptase (Promega Corporation,
Madison, WI, USA) according to the manufacturer's instructions. The
cDNA was used as a template for quantitative real-time PCR using an
ABI Prism 7500 real-time PCR instrument (Applied Biosystems; Thermo
Fisher Scientific, Inc.). The primer sequences for PTEN and β-actin
were as follows: PTEN forward primer, 5′-CGACGGGAAGACAAGTTCAT-3′
and reverse, 5′-AGGTTTCCTCTGGTCCTGGT-3′; β-actin forward primer,
5′-CGCGAGAAGATGACCCAGAT-3′ and reverse, 5′-GTACGGCCAGAGGCGTACAG-3′.
The following thermocycling conditions were maintained: 95°C for 3
min; 95°C for 10 sec and 58°C for 30 sec for 39 cycles; and melting
curve analysis using an increase from 65.0 to 95.0°C in 0.5°C
increments for 5 sec. Independent experiments were repeated three
times. The relative expression levels of mRNA were analyzed using
Bio-Rad CFX Manager v3.1 software (Bio-Rad Laboratories, Inc.,
Hercules, CA, USA) with the 2−∆∆Cq method (12).
Immunoblot analysis
After transfection with siRNAs for 48 h, cells were
lysed in cell lysis buffer containing 20 mM Tris-HCl, 0.5 M NaCl,
0.25% Triton X-100, 1 mM EDTA, 1 mM EGTA, 10 mM β-glycophosphate,
300 µM Na3VO4, 10 mM NaF, 1 mM benzamidine, 2
µM PMSF and 1 mM DTT. Protein concentrations were determined by a
BCA protein assay (Thermo Fisher Scientific, Inc.). Proteins were
subjected to 10% SDS-PAGE, transferred on to nitrocellulose
membranes, blocked in 5% BSA, and followed by washing with TBS with
Tween-20. The blots were then incubated with primary antibodies for
12 h at 4°C followed by incubation with the secondary antibody for
2 h at room temperature. The following primary antibodies were
used: polyclonal rabbit anti-human phospho-Akt (Ser473) (dilution,
1:1,000; cat. no. 9271S), polyclonal rabbit anti-human Akt
(dilution, 1:1,000; cat. no. 9272S), polyclonal rabbit anti-human
PTEN (dilution, 1:1,000; cat. no. 9552S), polyclonal rabbit
anti-human HK1 (dilution, 1:1,000; cat. no. 2024S), polyclonal
rabbit anti-human HK2 (dilution, 1:1,000; cat. no. 2106S),
polyclonal rabbit anti-human PKM1/2 (dilution, 1:1,000; cat. no.
3186S), polyclonal rabbit anti-human PKM2 (dilution, 1:1,000; cat.
no. 3198S), polyclonal rabbit anti-human LDHA (dilution, 1:1,000;
cat. no. 2012S), polyclonal rabbit anti-human PDH (dilution,
1:1,000; cat. no. 3205S), polyclonal rabbit anti-human PFKP
(dilution, 1:1,000; cat. no. 5412S) all from Cell Signaling
Technology, Inc. (Danvers, MA, USA), and monoclonal rabbit
anti-human PCB (dilution, 1:2,000; cat. no. ab126707; Abcam,
Cambridge, UK), or polyclonal rabbit anti-human β-actin (dilution,
1:1,000; cat. no. 4970S; Cell Signaling Technology, Inc.).
Membranes were then incubated with horesradish
peroxidase-conjugated secondary antibody polyclonal goat
anti-rabbit IgG (dilution, 1:3,000; cat. no. ab97051; Abcam) for 1
h and visualized with SuperSignal™ West Femto Maximum Sensitivity
Substrate (Thermo Fisher Scientific, Inc.) according to the
manufacturer's recommended protocol. Quantification was performed
using Image J software version 1.45S (National institutes of
Health, Bethesda, MD, USA).
Glucose consumption and lactate
production
After 48 h of transfection, all culture media were
collected for glucose consumption and lactate production analysis.
The concentrations of glucose in culture media were assessed after
24 h using a Glucose Detection Kit (Invitrogen; Thermo Fisher
Scientific, Inc.). Briefly, the culture media was mixed with the
colorimetric substrate and horseradish peroxidase and the reaction
was initiated by the addition of glucose oxidase in a 96-well
plate. The reaction was incubated for 30 min at room temperature
and the product was assessed by a microplate reader at an
absorbance of 560 nm. Glucose consumption was the difference of the
glucose concentration between the spent medium and the unused
medium. The concentrations of lactate in the culture media were
assessed using a Lactate Assay Kit (Jiancheng Bioengineering,
Nanjing, China). Briefly, the culture media was mixed with lactate
assay buffer in a 96-well plate. Then reaction buffer was added to
every well and incubated for 30 min at room temperature. The
lactate production was assessed by a microplate reader at an
absorbance of 570 nm.
MTT assay
Cells infected with lentivirus containing PTEN shRNA
or control shRNA were seeded into 96-well plates in triplicate at a
starting density of 1×10⁴ cells/well. Treated cells were
washed and incubated with tetrazolium salt (MTT, 100 µg/ml;
Sigma-Aldrich; Merck KGaA, Darmstadt, Germany) at 37°C for 4 h. The
supernatant was removed, and 150 µl of dimethyl sulfoxide (DMSO)
was added to each well. The absorbance (OD) of the reaction
solution at 490 nm was recorded.
Metabolomics analysis of organic
acid
Sample preparation for metabolic
profiling
The siRNA-treated cells were washed twice with room
temperature D-Hank's solution, digested with trypsin for 5 min and
then collected in a culture tube. The collected solution was
centrifuged (4°C, 380 × g, 2 min), and the supernatant was
discarded. Next, 500 µl of methyl alcohol (4°C) was added to the
tube containing the cell pellet and was vortexed for 30 sec. After
three freeze-thaw cycles, the mixture was centrifuged (4°C, 15,000
× g, 10 min). The upper layer was used for organic acid and fatty
acid metabolomics analysis.
For organic acid analysis, the supernatant was
placed in a 1.5 ml polypropylene centrifuge tube, then 25 µl each
of margarate (MGA) and tetracosane (C24) and 40 mg of tropate (TA)
were added as internal standards. Subsequently, 50 µl of
hydroxylamine hydrochloride, sulfuric acid and saturated ammonium
chloride were added to the fouling reaction. The the mixed solution
was extracted twice by ether. After centrifugation for 5 min, the
supernatant was placed in a 1.5 ml vial. The aliquots were
evaporated to dryness in a vacuum concentrator. The final dry
residue, 110 µl of a mixture of BSTFA and TMCS (10:1, v:v) were
added and dissolved. The solution was then transferred to a 1-ml
screw top vial, tightly capped and trimethylsilyl (TMS)-derivatized
at 80°C for 30 min. The samples were then ready for GC-MS
analysis.
Mass spectrometry
Samples were analyzed using a Gas
Chromatography-Mass Spectrometer (GC-MS, 7890–5975; Agilent
Technologies, Inc., Santa Clara, CA, USA). The capillary column was
a fused-silica DB-5 column (30 m × 0.25 mm i.d.) with a 0.25-µm
film thickness of 5% phenylmethylsilicone. Mass spectra were
obtained by standard electron impact ionization scanning from m/z
50 to m/z 750 at a rate of 0.35 sec/cycle. The temperature program
started at 150°C with an initial hold for 1 min, and the
temperature was then increased at a rate of 10°C/min to 285°C with
a final hold for 8 min. The temperatures of the injection port and
transfer line were both 280°C. The flow rate of the helium carrier
was 1.5 ml/min, and the linear velocity was 38.5 m/sec. One ml of
the final derivatized aliquot was injected into the GC-MS and
analyzed in the split mode (10:1).
GC-MS data processing and
identification of the metabolites
The compounds were identified by automatically
comparing the MS spectra, in-source fragments, and ion features of
each peak in the experimental samples with those of reference
standards or those available in libraries, such as Mainlib and
Publib in the National Institute of Standards and Technology (NIST)
library 2.0 (2012) or Wiley 9 (Wiley-VCH Verlag GmbH & Co.
KGaA, Weinheim, Germany).
Metabolomics analysis of fatty acid
Sample preparation for metabolic
profiling
For fatty acid analysis, the supernatant was placed
in a polypropylene microtiter plate. Methanolic internal standard
solution (150 µl) was added manually. The microtiter plate was
gently shaken during the 30 min extraction of acyl-carnitine
markers. The methanol extract was then manually transferred to a
second polypropylene microtiter plate and dried by a Pressure
Blowing Concentrator at 50°C. Butanol-HCl (60 µl) was manually
placed in each sample well and the microtiter plate was covered
with a thin Teflon sheet under a heavy weight and placed at 70°C in
a forced air oven for 15 min. After the plate was removed from the
oven, the Pressure Blowing Concentrator removed the remaining
butanol-HCl. The butanol-derivatized samples were reconstituted
with 100 µl of acetonitrile and water (70:30 by volume), and each
plate was covered with aluminum foil. The samples were then ready
for LC-MS analysis.
Mass spectrometry
Samples were analyzed using liquid
chromatograph-tandem mass spectrum (LC20AD; Shimadzu, Kyoto, Japan;
API 4000+; AB-Sciex, Framingham, MA, USA).
LC
A mixture of acetonitrile and water (70:30, v/v) was
used as carrier solution at a flow rate of 0.14 ml/min. A step
gradient program was developed for the best separation of amino
acids: 0.14 ml/min, 0.2 min; 0.03 ml/min, 1 min; 0.3 ml/min, 0.2
min. An 18-µl sample was injected into the carrier solution. Then,
the stream was introduced to the ion source for MS/MS without
column separation.
Mass spectrometer
The mass spectrum (MS) parameters in positive ion
mode (ESI + MODE) were as follows: Heater Temp, 300°C; Capillary
Temp, 350°C; Sheath Gas Flow rate, 45 arb; Aux Gas Flow Rate, 15
arb; Sweep Gas Flow Rate, 1 arb; Spray voltage, 3.0 KV. Product Ion
Scan modes were defined to analyze fatty acid metabolism. All data
acquisition and processing were carried out using Analyst 1.5.2
software (AB-Sciex).
Statistical Analysis
Statistical analysis was performed using SPSS 17.0
software (SPSS, Inc., Chicago, IL, USA). The chi-square test was
used to evaluate the significance of the differences in the cell
line samples. Statistical significance was assumed at a threshold
of P<0.05. Metabolic pathway analysis and enrichment analysis
were performed by MBROLE 2.0 (http://csbg.cnb.csic.es/mbrole2/) and KEGGgraph
(http://www.bioconductor.org/packages/2.4/bioc/html/KEGGgraph.html).
The function of KEGGgraph suggested that > library (KEGG.db),
> tmp <- tempfile, > pName <- ‘Phe signaling pathway’,
> pId <- mget (pName, KEGGPATHNAME2ID), >
retrieveKGML(pId, organism=‘cel’, destfile=tmp, method=‘wget’,
quiet=TRUE).
Results
Enhanced glucose consumption and
lactate production
To investigate the metabolic changes in PTEN
knockdown prostate cancer, we synthesized two pairs of PTEN siRNAs
and a control siRNA (Fig. 1A). After
the prostate cancer cell line DU-145 was transfected with 20 or 40
nM siRNAs for 48 h, the endogenous PTEN expression level was
detected by quantitative real-time PCR and western blotting. The
results revealed that endogenous PTEN was significantly decreased
in 22Rv1 and DU-145 cells transfected with 40 nM PTEN siRNAs
compared with the control siRNAs (Fig. 1B
and C). Furthermore, the phosphorylation of Akt at Serine 473
was significantly increased in DU-145 and 22Rv1 cells that were
transfected with 40 nM PTEN siRNAs after 48 h (Fig. 1D). Accompanying the activation of Akt,
glucose consumption and lactate production was also significantly
increased in PTEN knockdown DU-145 and 22Rv1 cells (Fig. 1E). Therefore, aerobic glycolysis was
possibly increased in PTEN knockdown DU-145 and 22Rv1 cells.
Furthermore, the expression of metabolic molecules related to
glucose metabolism were detected and it was demonstrated that
hexokinase HK2, the first key enzyme involved in glycolysis, was
upregulated in PTEN knockdown DU-145 and 22Rv1 cells, especially in
DU-145 cells (Fig. 1F). Upregulation
of HK2 may be one of the contributors to the Warburg effect in PTEN
knockdown DU-145 and 22Rv1 cells. Tumor metabolic reprogramming
fuels the malignant growth and proliferation of cancer cells
(13–15). Therefore, cell viability was increased
in DU-145 cells that were infected with lentivirus containing PTEN
shRNA compared with control shRNA (Fig.
1G). However, cell viability was not significantly altered in
22Rv1 cells that were infected with lentivirus containing PTEN
shRNA. Although the PI3K/AKT/mTOR and RAF/MEK/ERK signaling
pathways play an important role in prostate cancer progression,
22Rv1 prostate cancer cells have been revealed to be more dependent
on the MEK/ERK pathway (16).
Collectively, cell metabolism and cell viability was significantly
altered in PTEN-loss DU-145 cells. Thus, metabolism reprogramming
occurred, induced by PTEN deficiency in prostate cancer cells.
Intracellular metabolism
reprogramming
High rates of loss of heterozygosity are observed at
the 10q23.3 region containing the human PTEN gene in prostate
cancer. The phenotypes of PTEN+/− DU-145 cells are
similar to prostate cancers with loss of heterozygosity in the PTEN
gene (17–19). In addition, the cell viability induced
by PTEN loss increased significantly in DU-145 cells. Therefore, we
assessed the changes of key metabolites in PTEN knockdown DU-145
cells by metabolomics analysis. There are several metabolic pathway
changes in tumor metabolism reprogramming, such as glycolysis,
glutaminolysis, fatty acid de novo synthesis and fatty acid
β-oxidation. Accordingly, the changes of key metabolites in these
metabolic pathways were assessed in prostate cancer cells DU-145
transfected with PTEN siRNAs.
Glycolysis and glutaminolysis
Since glucose and glutamine are the main energy
production and carbon sources for the malignant growth of tumor
cells, we assessed the levels of metabolites in glycolysis and
glutaminolysis. As revealed in Fig.
2, many organic acids involved in glycolysis and glutaminolysis
were significantly increased, such as lactate, pyruvic acid,
succinic acid, citric acid, fumaric acid, malic acid, and
2-ketoglutarate. In addition, the level of intracellular glutamine
was decreased in PTEN knockdown DU-145 cells. Therefore, PTEN
knockdown led to enhanced glycolysis and glutaminolysis in prostate
cancer DU-145 cells.
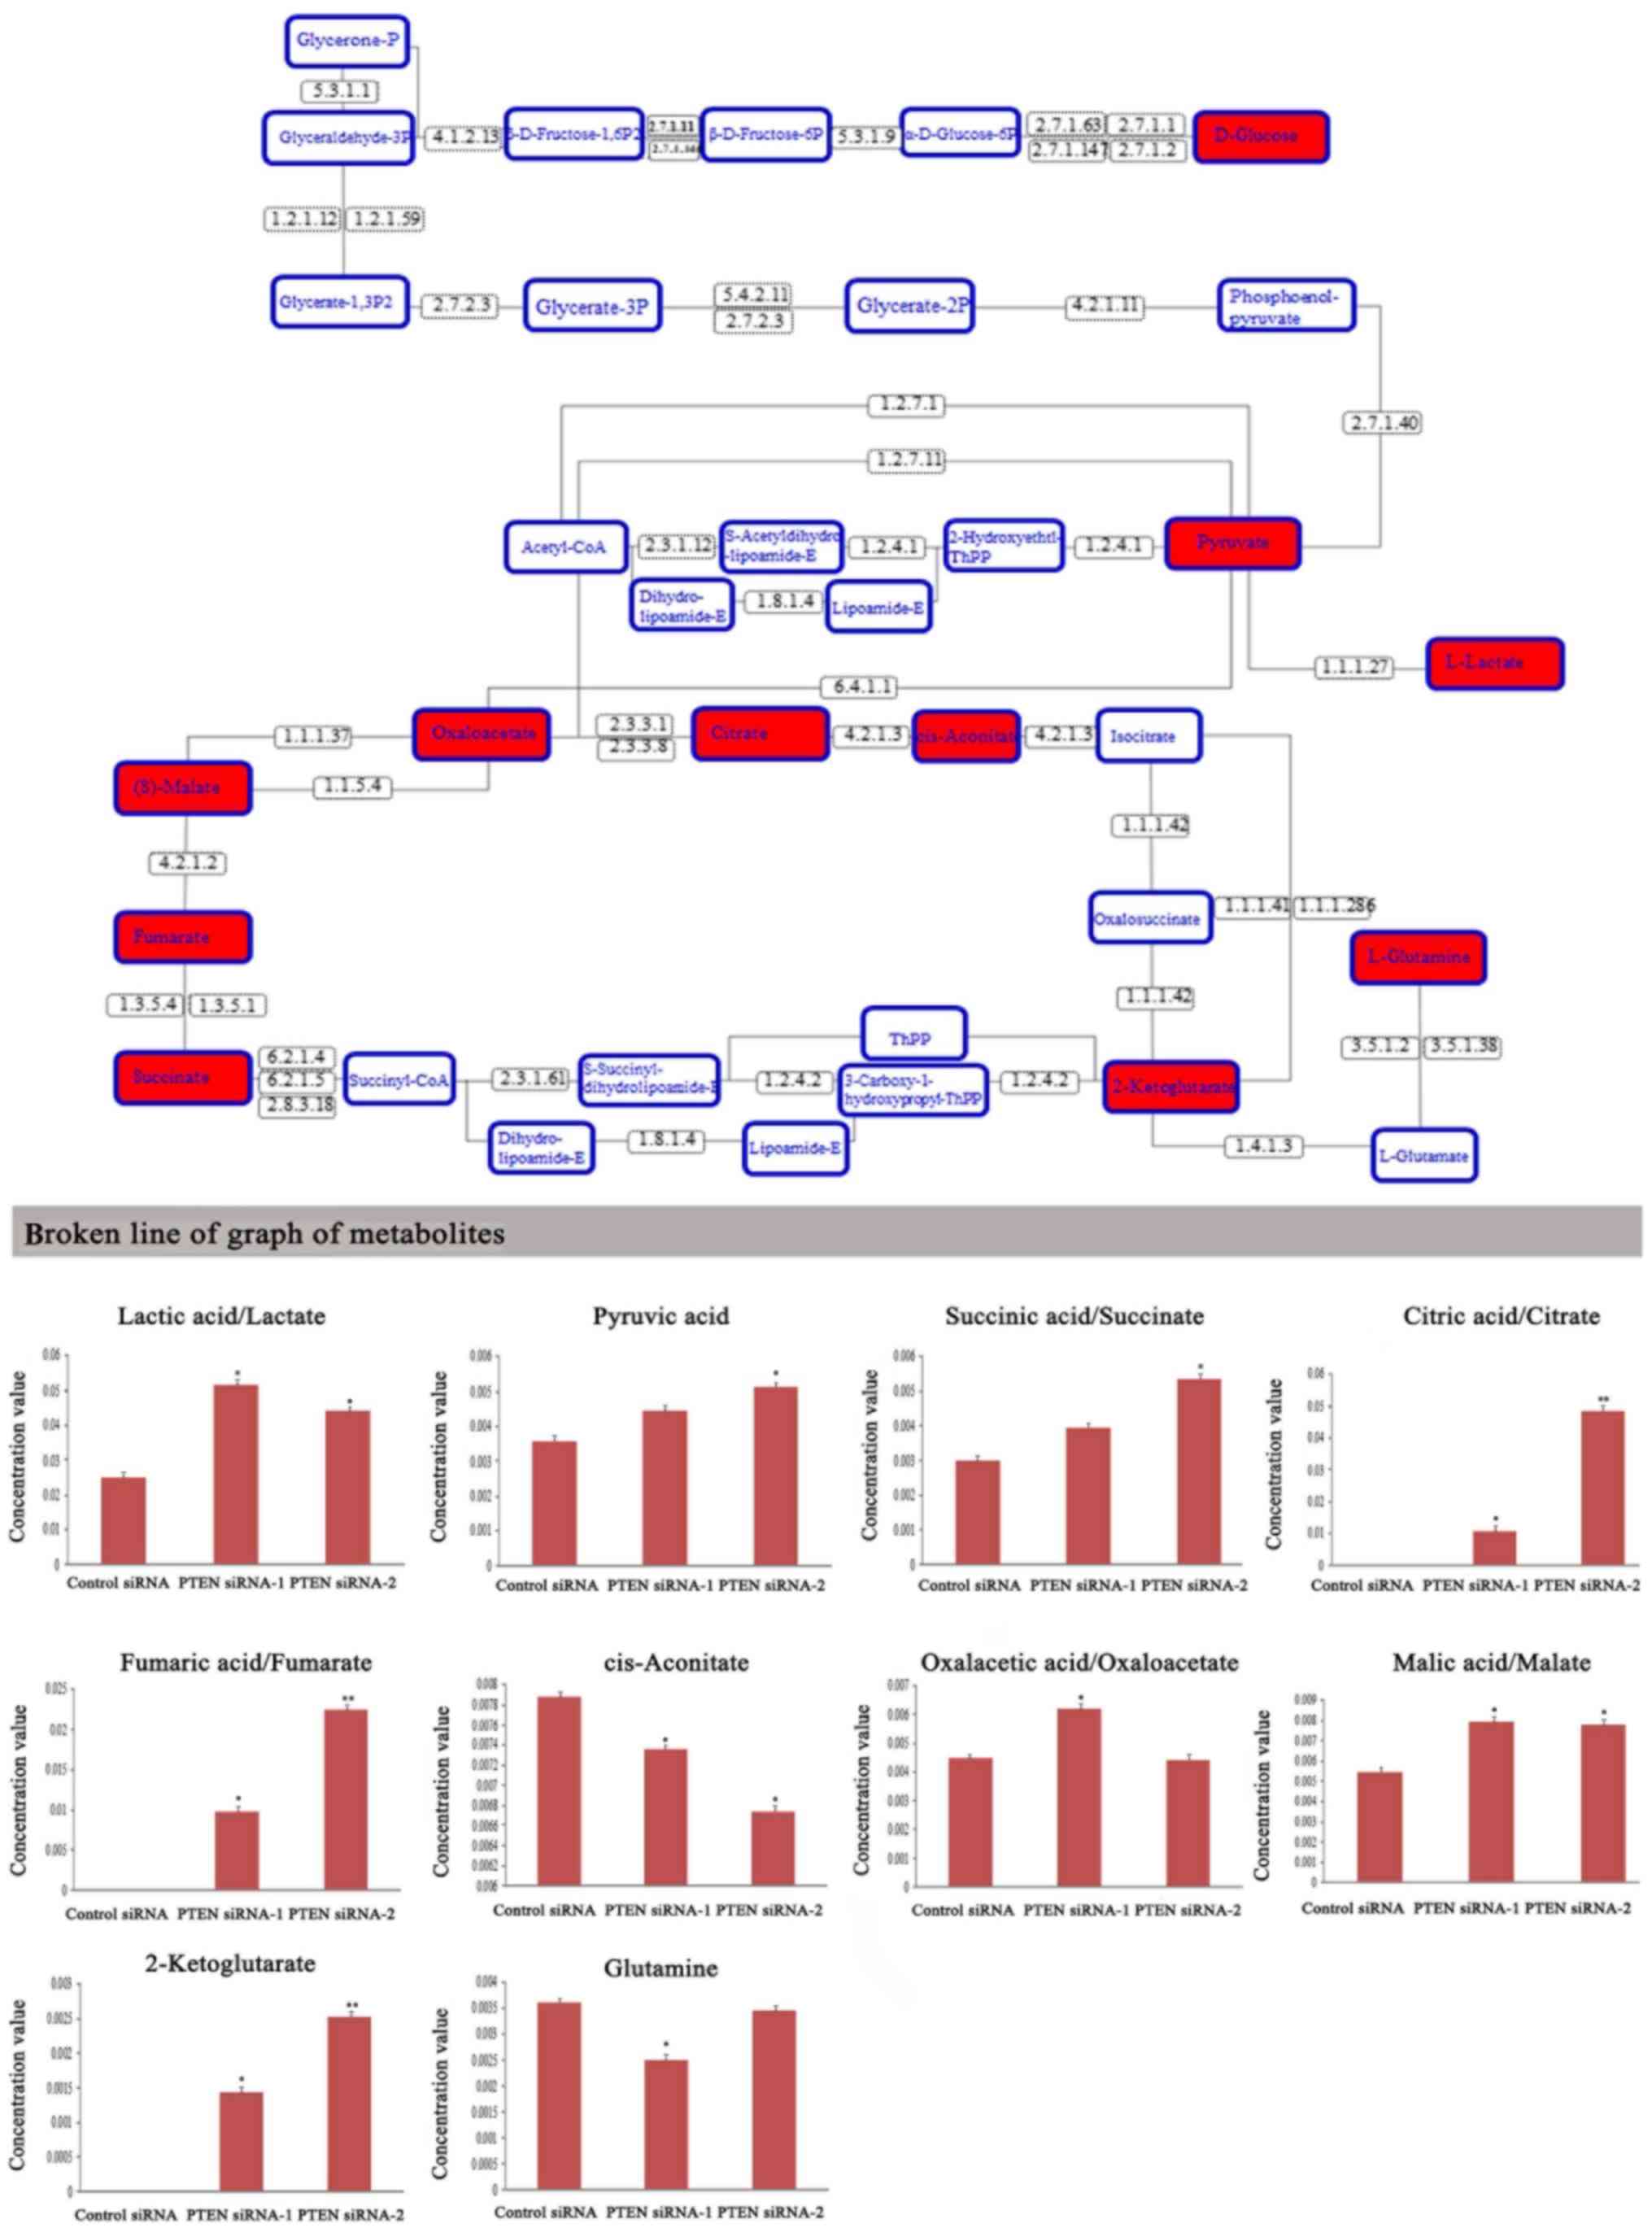 | Figure 2.Metabolic profiling of intracellular
organic acid involved in the glycolysis and glutaminolysis
pathways. GC-MS data revealed the changes of organic acid levels in
DU-145 cells which were transfected with PTEN siRNAs for 48 h. The
red-labeled metabolites in upper graph were significantly altered
in the glycolysis and glutaminolysis pathways. 1.1.1.27, L-lactate
dehydrogenase (LDH, ldh); 1.1.1.37, malate dehydrogenase (MDH1);
1.1.1.42, isocitrate dehydrogenase (IDH1, IDH2); 1.1.5.4, malate
dehydrogenase (mqo); 1.2.1.12, glyceraldehyde 3-phosphate
dehydrogenase (GAPDH, gapA); 1.2.1.59, glyceraldehyde 3-phosphate
dehydrogenase (NAD(P), gap2); 1.2.4.1, pyruvate dehydrogenase E1
component; 1.2.4.2, 2-oxoglutarate dehydrogenase E1 component;
1.2.7.1, pyruvate ferredoxin oxidoreductase alpha subunit (porA);
1.2.7.11, 2-oxoglutarate/2-oxoacid ferredoxin oxidoreductase
subunit alpha (korA, oforA); 1.3.5.1, succinate dehydrogenase
(ubiquinone) flavoprotein subunit; 1.3.5.4, fumarate reductase
flavoprotein subunit; 1.4.1.3, glutamate dehydrogenase (NAD(P)+)
(GLUD12, gdhA); 1.8.1.4, dihydrolipoamide dehydrogenase (DLD, lpd,
pdhD); 2.3.1.12, pyruvate dehydrogenase E2 component (DLAT, aceF,
pdhC); 2.3.1.61, 2-oxoglutarate dehydrogenase E2 component;
2.3.3.1, citrate synthase; 2.3.3.8, ATP citrate (pro-S)-lyase;
2.7.1.1, hexokinase (HK); 2.7.1.11, 6-phosphofructokinase 1(pfkA,
PFK); 2.7.1.146, ADP-dependent phosphofructokinase/glucokinase
(pfkC); 2.7.1.147, ADP-dependent glucokinase (ADPGK); 2.7.1.2,
glucokinase (GCK); 2.7.1.40, pyruvate kinase (PK, pyk); 2.7.1.63
polyphosphate glucokinase (ppgK); 2.7.2.3, phosphoglycerate kinase
(PGK, pgk); 2.8.3.18, succinyl-CoA:acetate CoA-transferase; 3.5.1.2
glutaminase (glsA, GLS), 3.5.1.38, glutamin-(asparagin-)ase (aspQ,
ansB, ansA); 4.1.2.13, fructose-bisohosphate aldolase, class I
(ALDO); 4.2.1.11, enolase (ENO, eno); 4.2.1.2, fumarate hydratase,
class I; 4.2.1.3, aconitate hydratase; 5.3.1.1, triosephosphate
isomerase (TIM) (TPI, tpiA); 5.3.1.9, glucose-6-phosphate isomerase
(GPI, pgi); 5.4.2.11, 2,3-bisphosphoglycerate-dependent
phosphoglycerate mutase (PGAM, pgmA); 5.4.2.11,
2,3-bisphosphoglycerate-independent phosphoglycerate mutase (pgmI);
6.2.1.4, succinyl-CoA synthetase alpha subunit (LSC1); 6.2.1.5,
succinyl-CoA synthetase alpha subunit (sucD); 6.4.1.1, pyruvate
carboxylase (PC, pyc). *P<0.05, **P<0.01 vs. the cells
transfected with control siRNA. |
Fatty acid de novo synthesis and β
oxidation
Unlike other epithelial tumors, primary prostate
cancer relies on lipid metabolsim more than on aerobic glycolysis
(8,9).
PTEN loss can lead to the overexpression of fatty acid synthase
(FAS) and therefore facilitate cholesterol and fatty acid
biosynthesis in prostate cancer (10). To investigate the function of PTEN in
lipid metabolism, the metabolite changes in fatty acid de
novo synthesis of PTEN knockdown DU-145 cells was analyzed. The
results revealed that when PTEN expression was significantly
decreased in prostate cancer cells, many fatty acylcarnitines
involved in fatty acid de novo synthesis were enhanced, such
as decanoyl-carnitine, dodecanoyl-carnitine,
tetradecanoyl-carnitine, hexadecanoyl-carnitine,
hexadecenoyl-carnitine, octadecanoyl-carnitine (Fig. 3). In parallel with enhanced fatty acid
de novo synthesis, fatty acid β-oxidation was also increased
in PTEN knockdown prostate cancer DU-145 cells. Compared with the
control siRNA-transfected cells, many fatty acylcarnitines involved
in fatty acid β-oxidation were significantly increased in DU-145
cells which were transfected with PTEN siRNAs, such as
butanoyl-carnitine, hexanoyl-carnitine, hexenoyl-carnitine,
hydroxyhexanoyl-carnitine, octenoyl-carnitine, decanoyl-carnitine,
dodecanoyl-carnitine, tetradecanoyl-carnitine,
hydroxytetradecanoyl-carnitine, hexadecanoyl-carnitine,
hexadecenoyl-carnitine, and hydroxyhexadecanoyl-carnitine (Fig. 4). These results confirmed that PTEN
loss can lead to the reprogramming of lipid metabolism in prostate
cancer cells, including enhancement of fatty acid de novo
synthesis and fatty acid β-oxidation, which provides bioenergy and
biomolecules to fuel the malignant proliferation of cancer
cells.
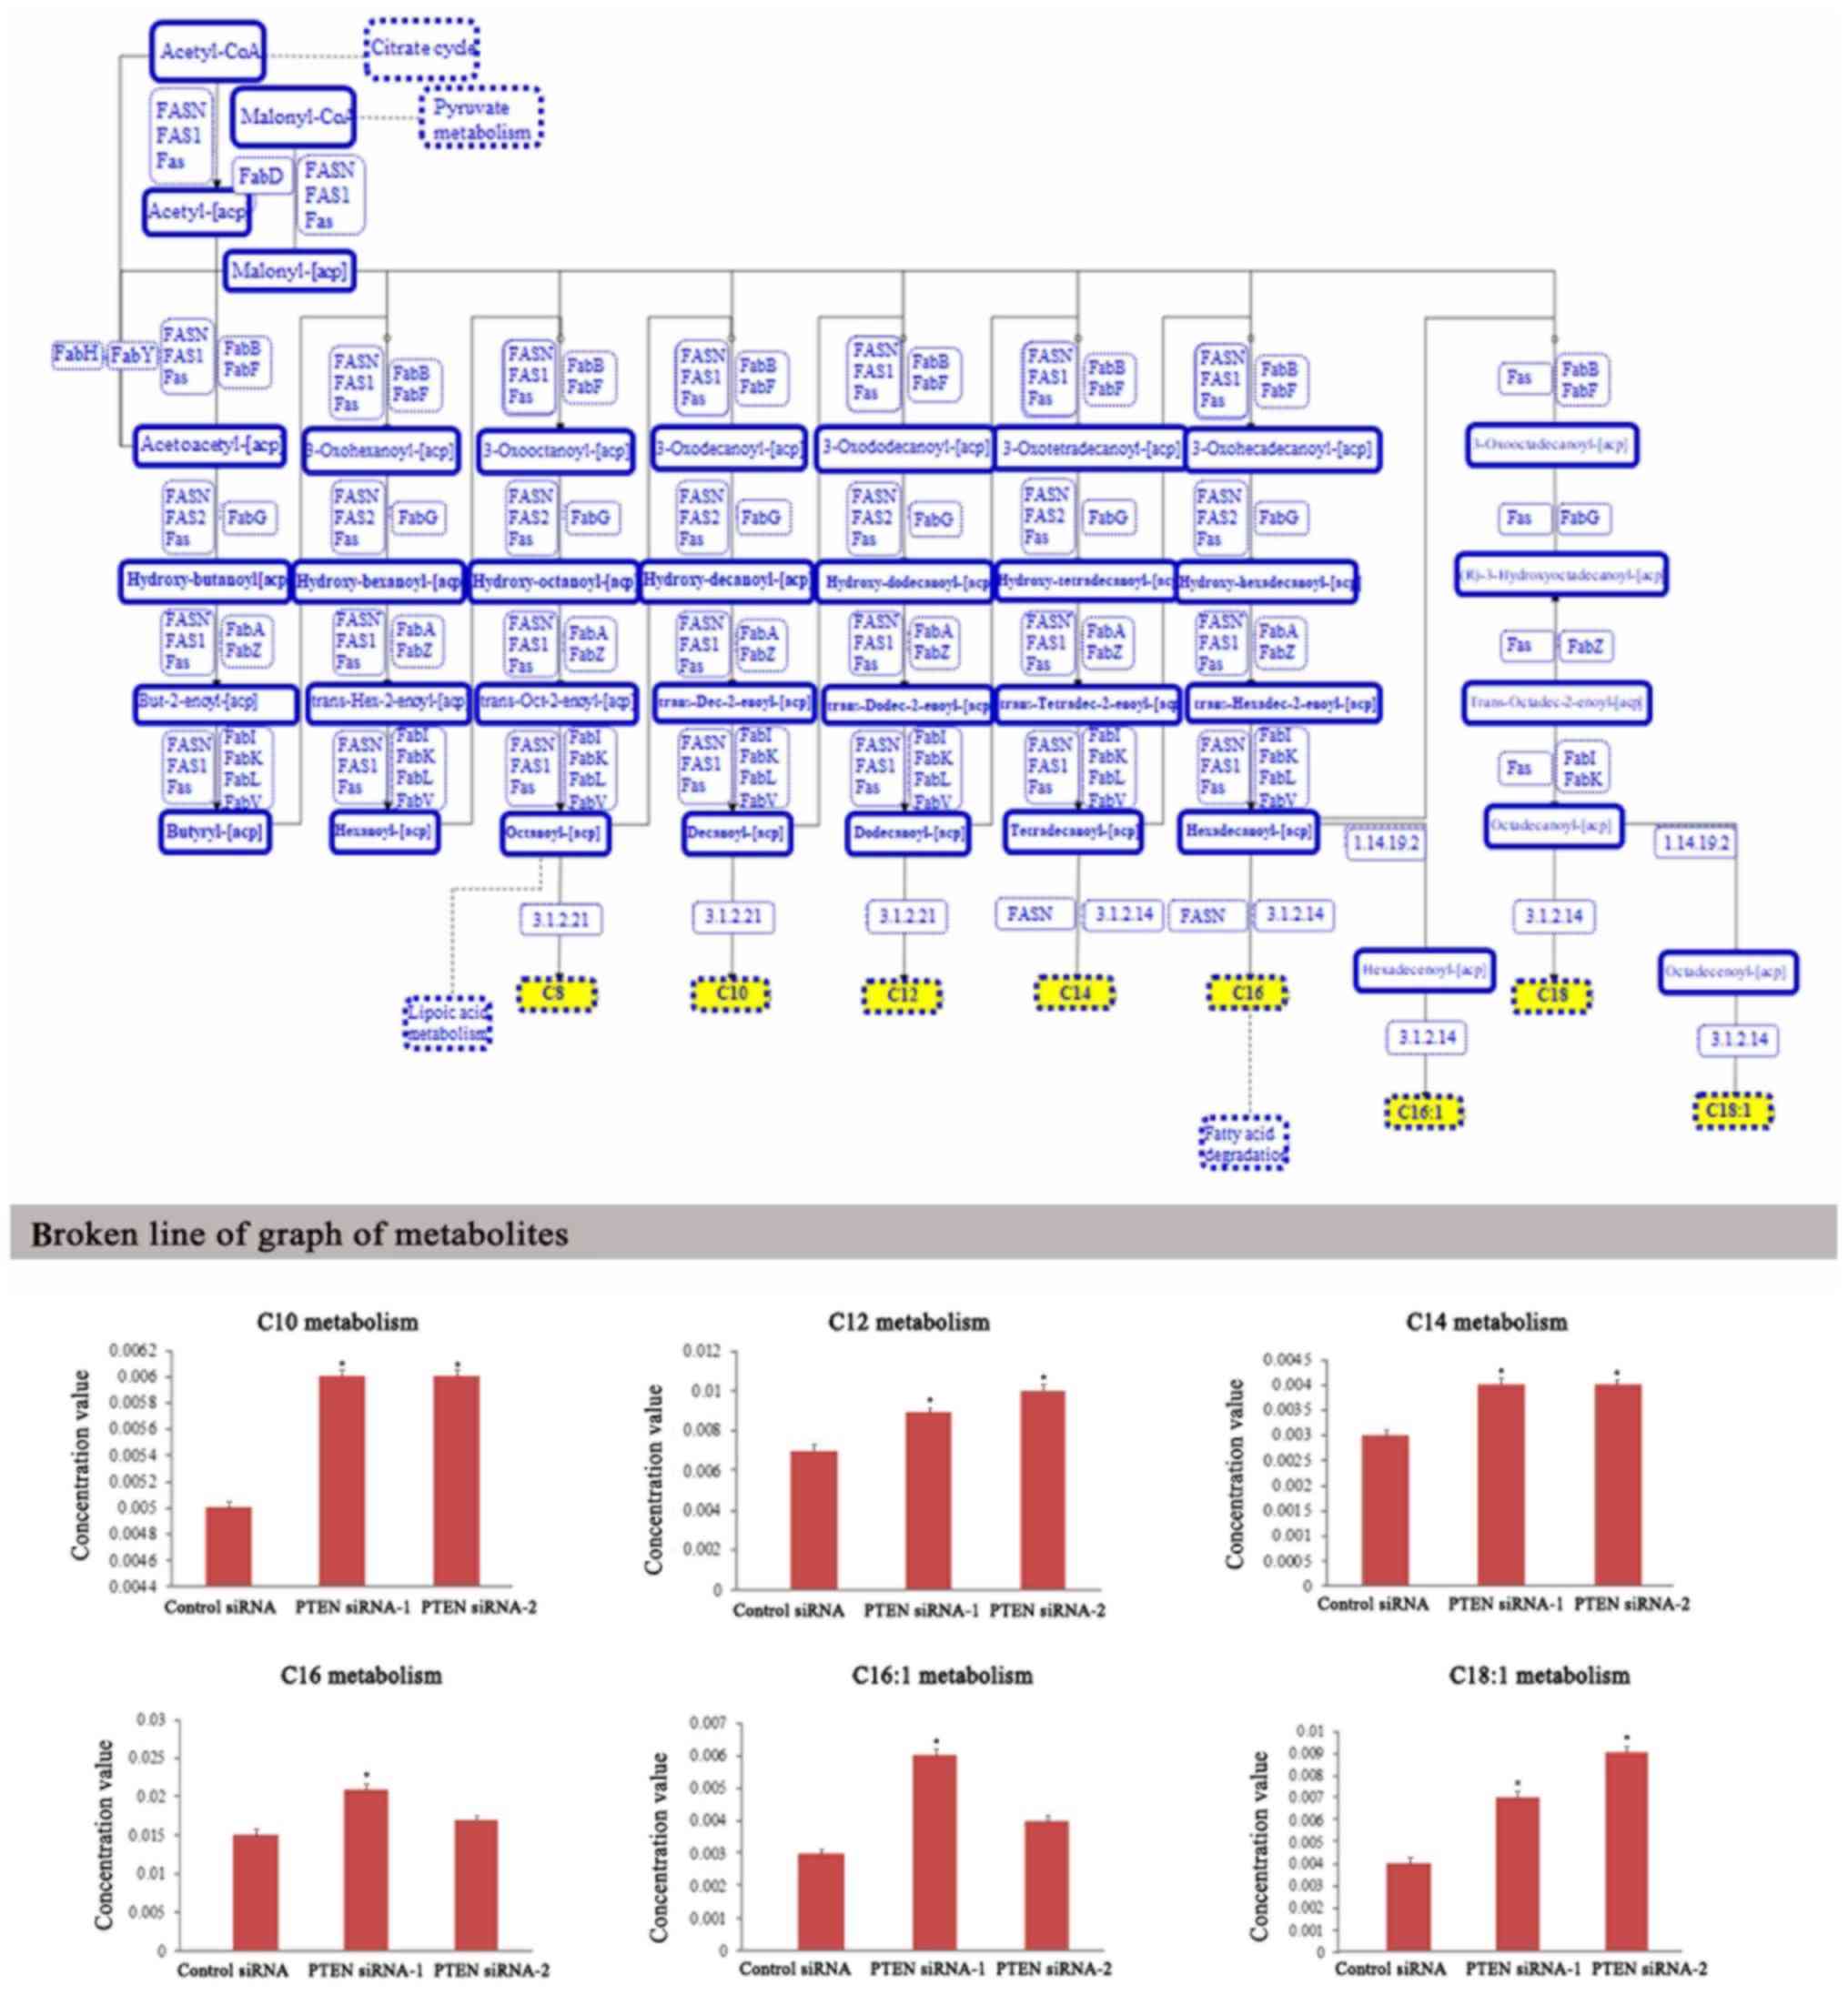 | Figure 3.Metabolic profiling of intracellular
metabolites involved in fatty acid de novo synthesis. LC-MS data
revealed the changes of metabolite levels in DU-145 cells which
were transfected with PTEN siRNAs for 48 h. The yellow-labeled
metabolites in upper graph were significantly altered in the fatty
acid de novo synthesis pathway. 1.14.19.2,
acyl-[acyl-carrier-protein] desaturase; 3.1.2.14, fatty acyl-ACP
thioesterase B; 3.1.2.21, medium-chain acyl-[acyl-carrier-protein]
hydrolase; FabA, 3-hydroxyacyl-[acyl-carrier-protein] dehydratase;
FabB, 3-oxoacyl-[acyl-carrier-protein] synthase I; FabD,
[acyl-carrier-protein] S-malonyltransferase; FabF,
3-oxoacyl-[acyl-carrier-protein] synthase II; FabG,
3-oxoacyl-[acyl-carrier-protein] reductase; FabH,
3-oxoacyl-[acyl-carrier-protein] synthase III; FabI,
enoyl-[acyl-carrier-protein] reductase I; FabK,
enoyl-[acyl-carrier-protein] reductase II; FabL,
enoyl-[acyl-carrier-protein] reductase III; FabV,
enoyl-[acyl-carrier-protein] reductase/trans-2-enoyl-CoA reductase
(NAD+); FabY, acetoacetyl-[acyl-carrier-protein]
synthase; FabZ, 3-hydroxyacyl-[acyl-carrier-protein] dehydratase;
Fas, fatty acid synthase, bacteria type; FAS1, fatty acid synthase
subunit beta, fungi type; FAS2, fatty acid synthase subunit alpha,
fungi type; FASN, fatty acid synthase, animal type; C10,
decanoyl-carnitine; C12, dodecanoyl-carnitine; C14,
tetradecanoyl-carnitine; C16, hexadecanoyl-carnitine; C16:1,
hexadecenoyl-carnitine; C18:1, octadecanoyl-carnitine. *P<0.05
vs. cells transfected with control siRNA. |
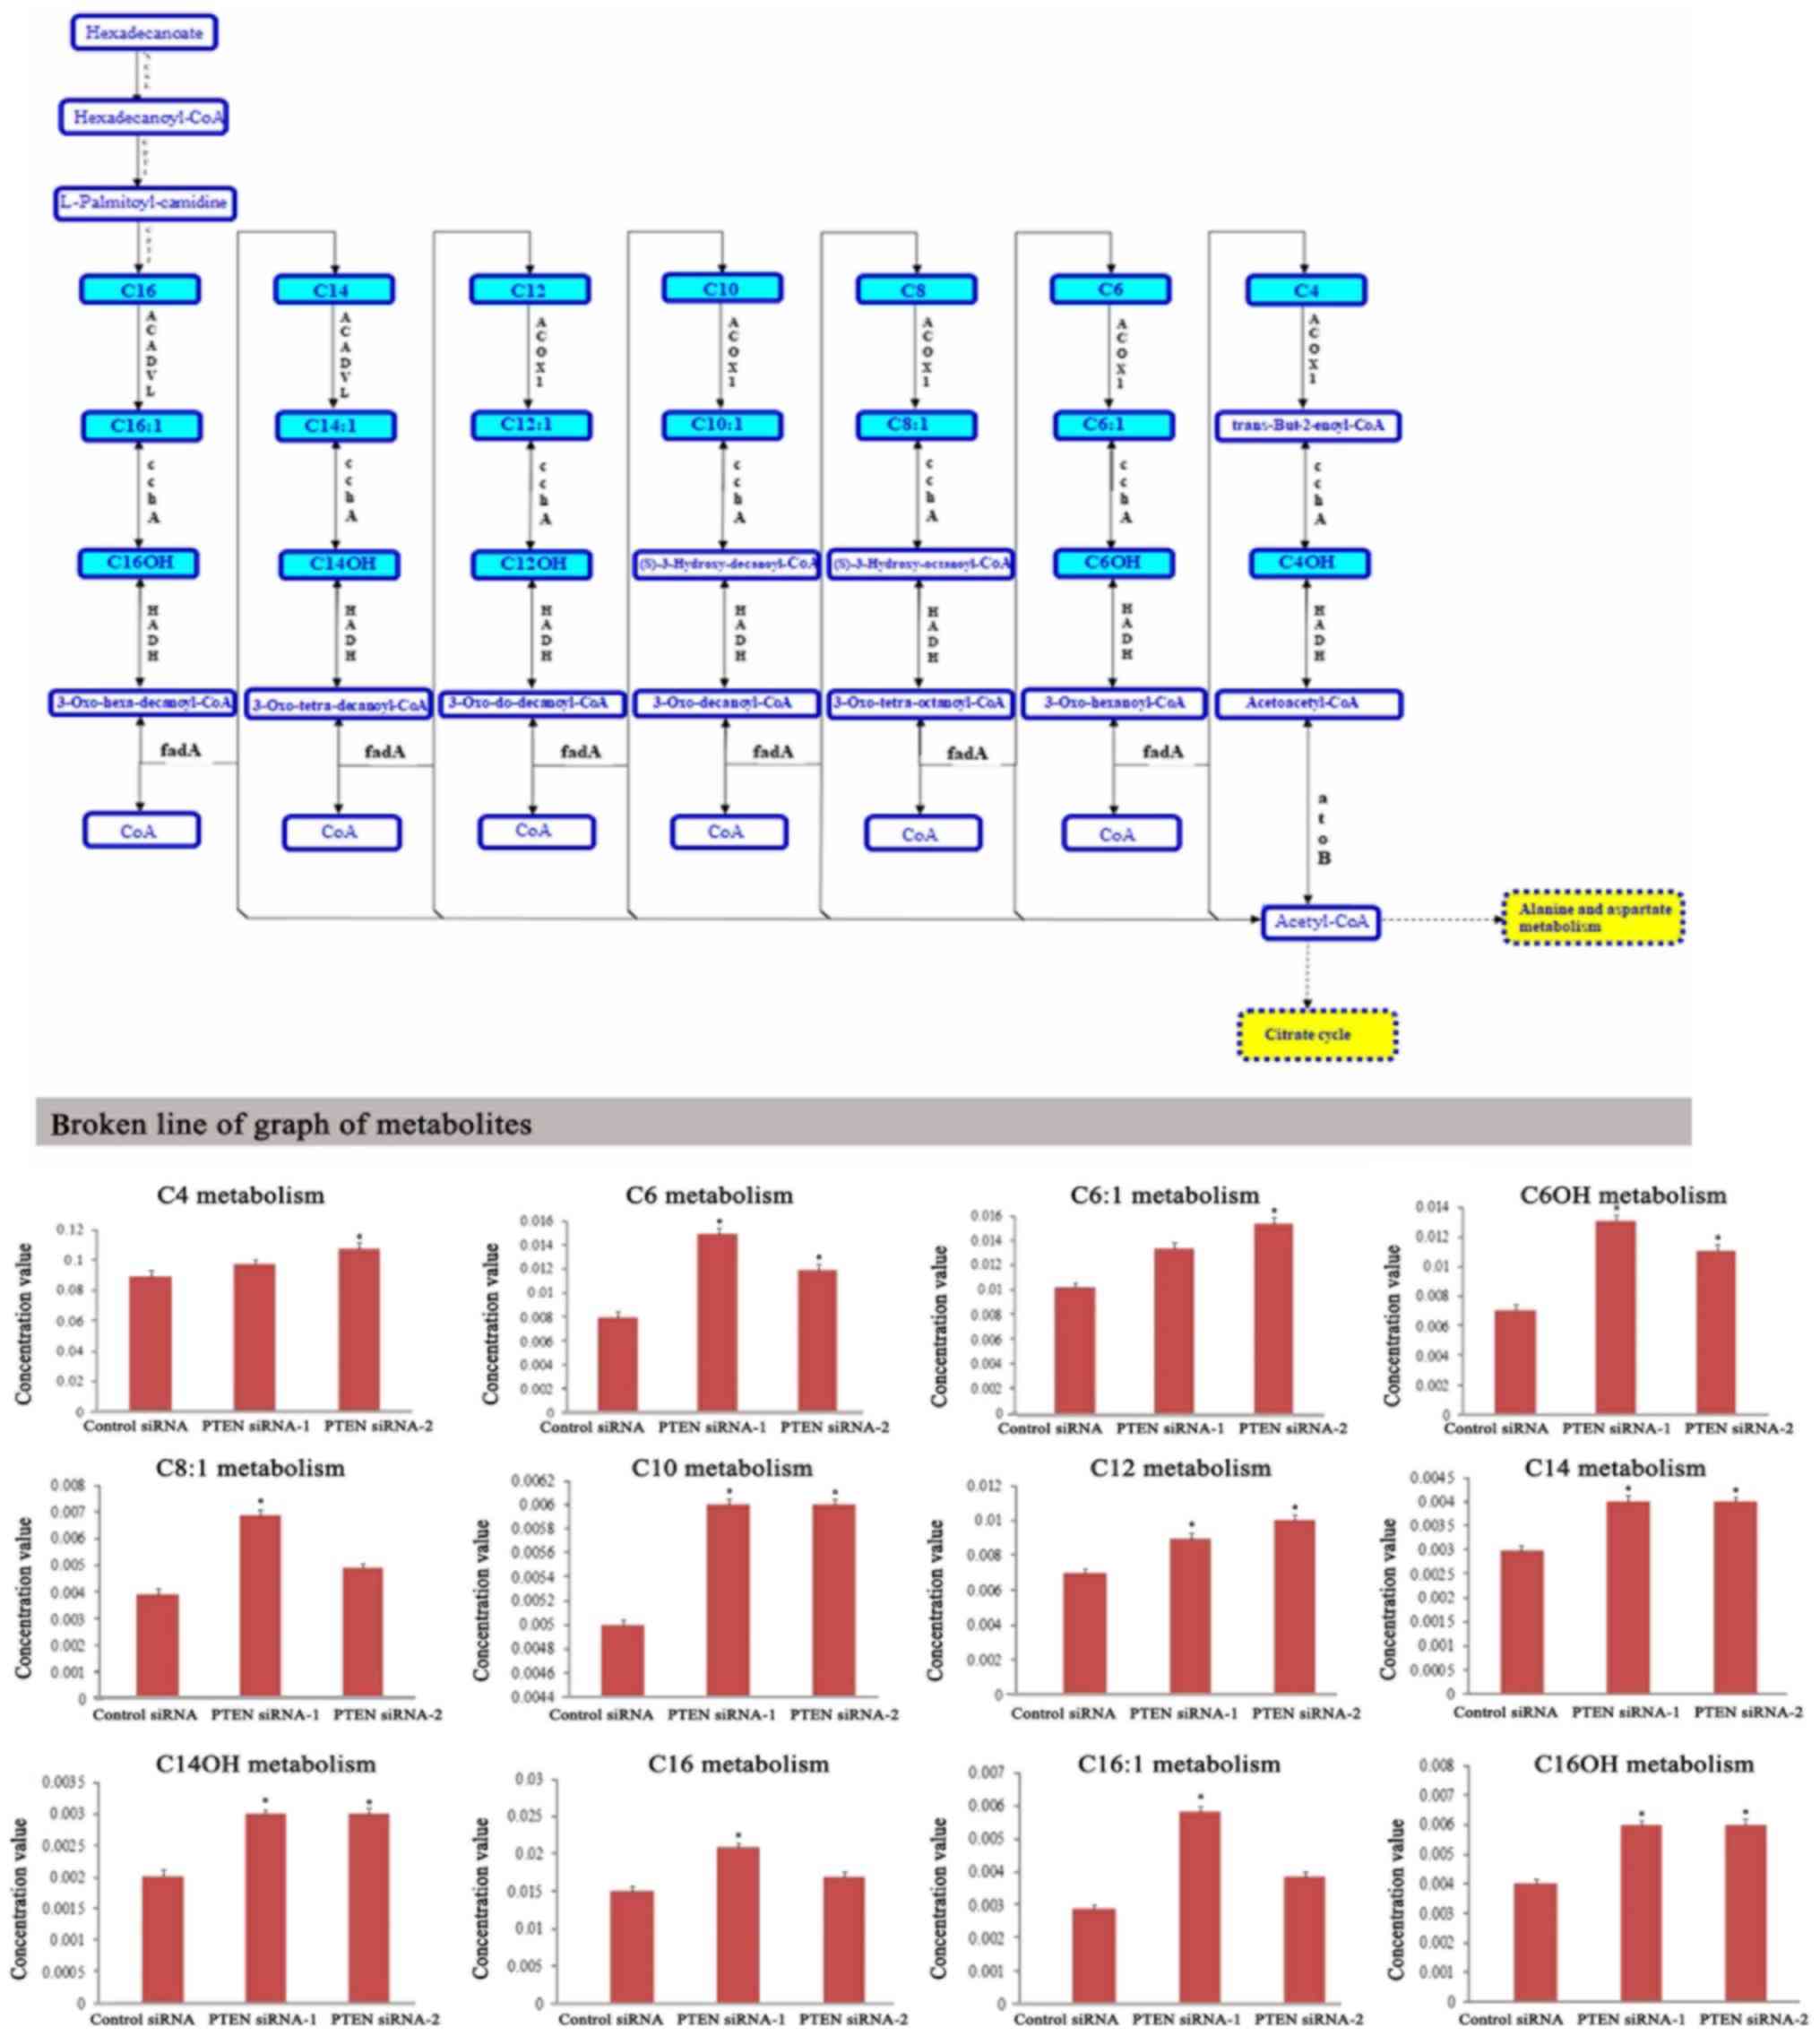 | Figure 4.Metabolic profiling of intracellular
metabolites involved in fatty acid β-oxidation. LC-MS data revealed
the changes of metabolite levels in DU-145 cells which were
transfected with PTEN siRNAs for 48 h. The blue-labeled metabolites
in upper graph were significantly altered in fatty acid the
β-oxidation pathway. ACADVL, very long chain acyl-CoA
dehydrogenase; ACOX1, acyl-CoA oxidase; ACSL, long-chain acyl-CoA
synthetase; atoB, acetyl-CoA C-acetyltransferase; CPT1, carnitine
O-palmitoyltransferase 1; CPT2, carnitine O-palmitoyltransferase 2;
echA, enoyl-CoA hydratase; fadA, acetyl-CoA acyltransferase; HADH,
3-hydroxyacyl-CoA dehydrogenase; HIBCH, 3-hydroxyisobutyryl-CoA
hydrolase; IVD, isovaleryl-CoA dehydrogenase; mmsA,
malonate-semialdehyde dehydrogenase (acetylating); mmsB,
3-hydroxyisobutyrate dehydrogenase vdh valine dehydrogenase; vorA,
2-oxoisovalerate ferredoxin oxidoreductase, alpha subunit; C4,
Butanoyl-carnitine; C6, hexanoyl-carnitine; C6:1,
hexenoyl-carnitine; C6OH, hydroxyhexanoyl-carnitine; C8:1,
octenoyl-carnitine; C10, decanoyl-carnitine; C12,
dodecanoyl-carnitine; C14, tetradecanoyl-carnitine; C14OH,
hydroxytetradecanoyl-carnitine; C16, hexadecanoyl-carnitine; C16:1,
hexadecenoyl-carnitine; C16OH, hydroxyhexadecanoyl-carnitine.
*P<0.05 vs. cells transfected with control siRNA. |
Branched-chain amino acids
catabolism
The key enzyme that initiates the catabolism of
branched-chain amino acids is branched-chain amino acid
transaminase 1 (BCAT1), which is overexpressed in many types of
cancers (20). Compared with healthy
tissues, it has been reported that low levels of BCAT activity are
present in all models of prostate cancer but the enzymatic levels
are significantly altered in prostate cancer (21). Our results revealed that the products
of branched-chain amino acid catabolism such as the levels of
hydroxyisovaleryl-carnitine, methylbutanoyl-carnitine, and
propanoyl-carnitine were increased in DU-145 cells which were
transfected with PTEN siRNAs. Therefore, the catabolism of
branched-chain amino acids was enhanced in PTEN-loss prostate
cancer cell line DU-145 (Fig. 5).
Whether the enhancement of BCAA catabolism is related to BCAT1 and
the molecular mechanisms driving this still requires further
investigation.
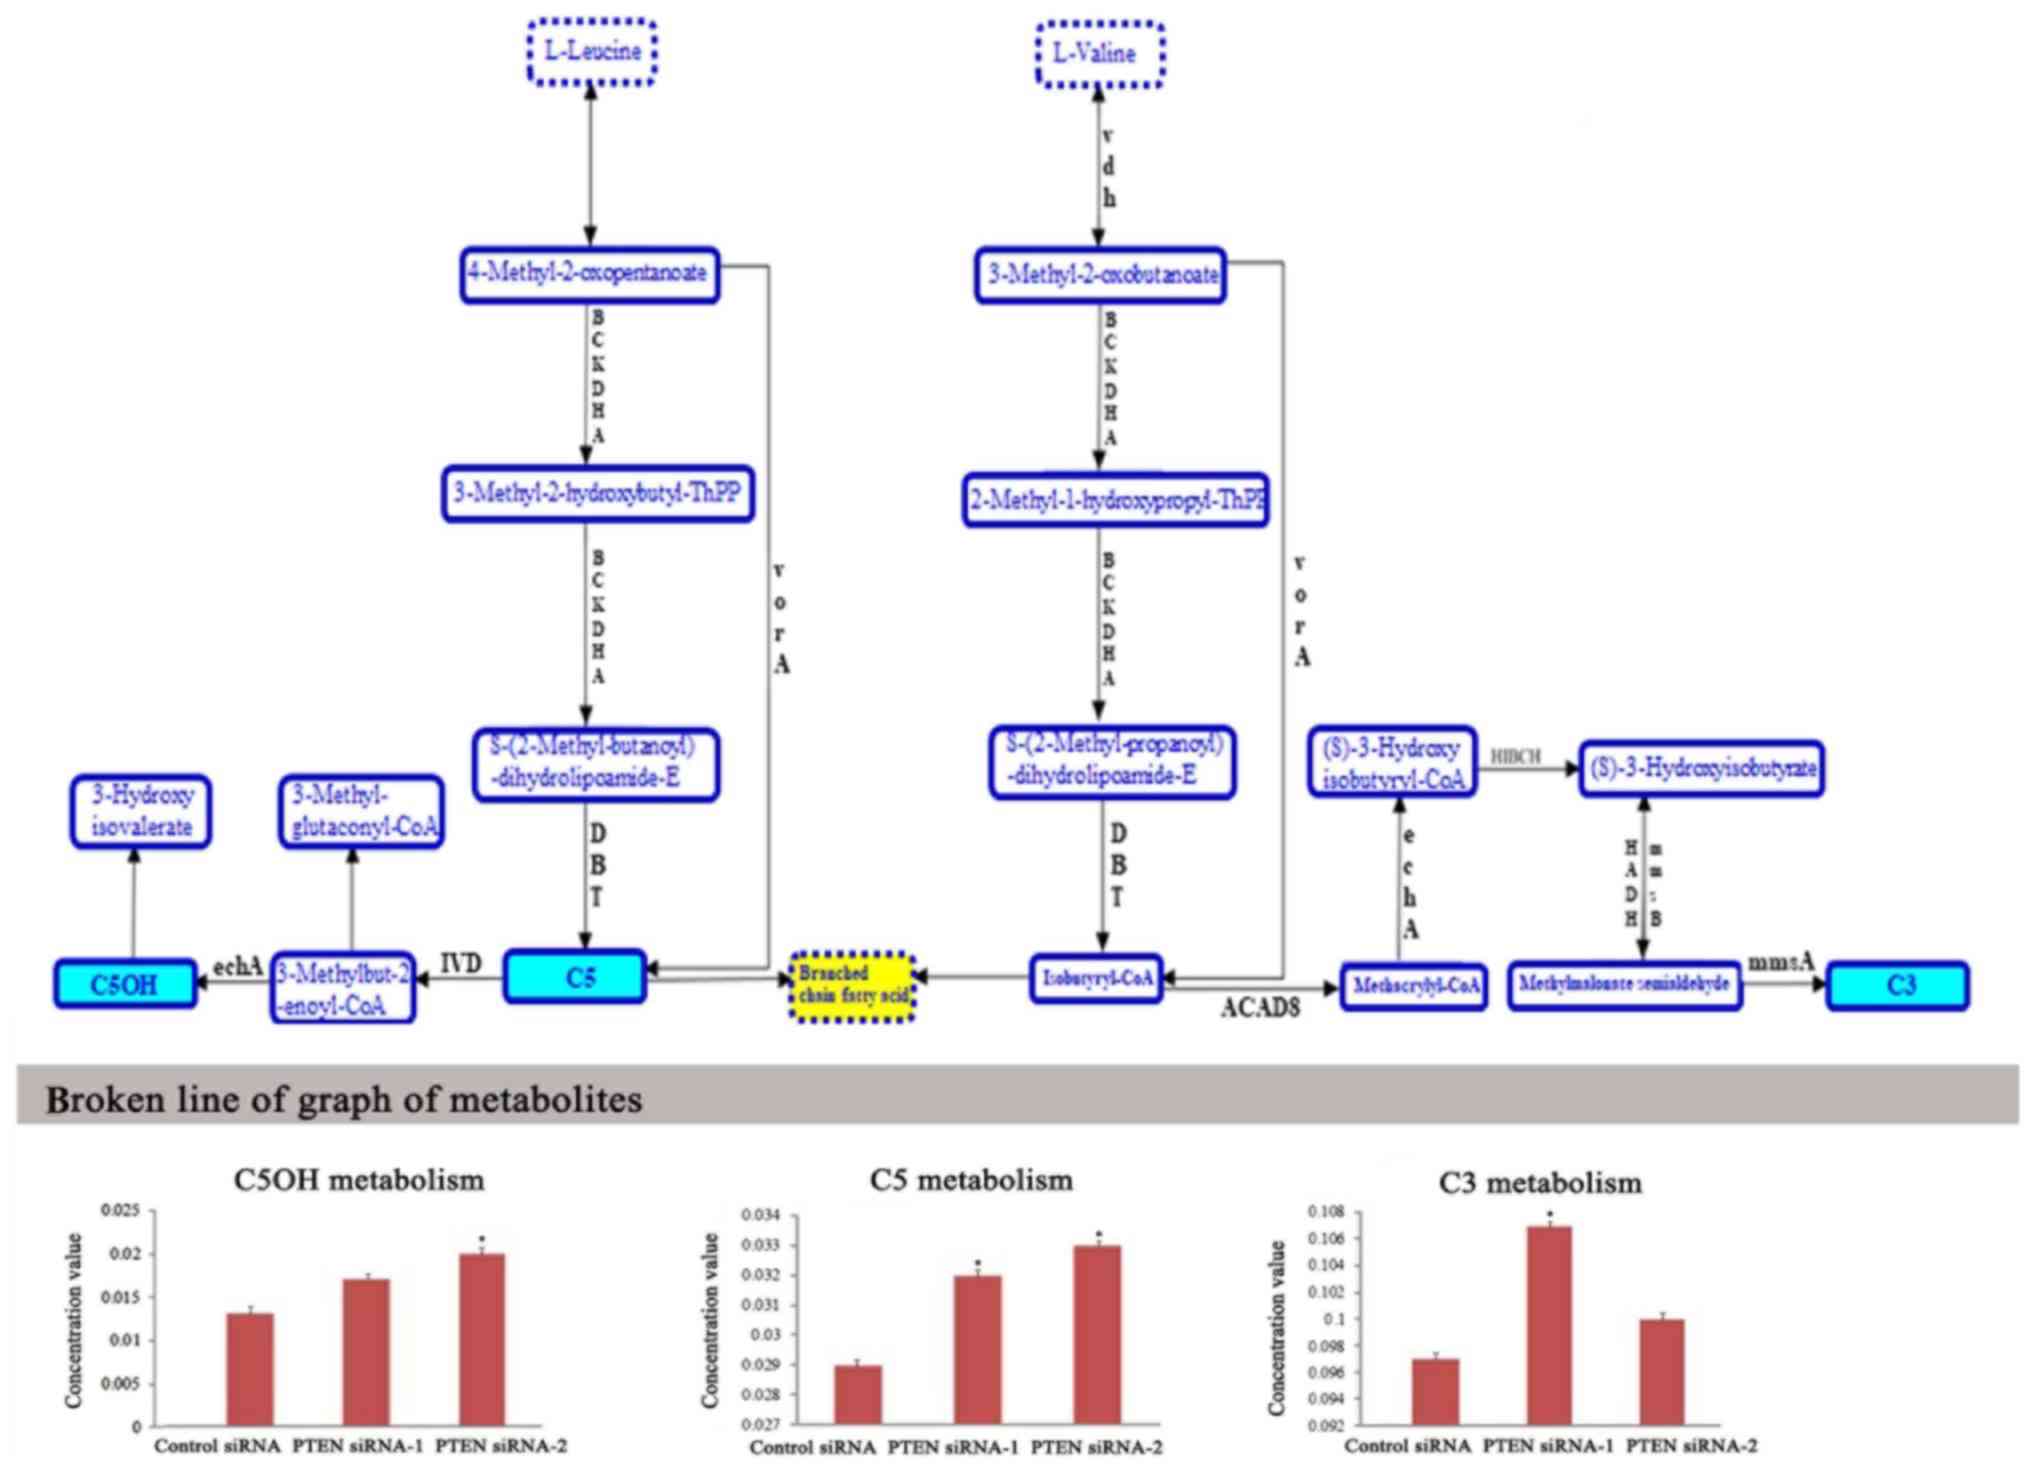 | Figure 5.Metabolic profiling of intracellular
metabolites involved in branched-chain amino acid catabolism. LC-MS
data revealed the changes of metabolite levels in DU-145 cells
which were transfected with PTEN siRNAs for 48 h. The blue-labeled
metabolites in upper graph were significantly altered in the
branched-chain amino acid catabolism pathway. ACAD8, isobutyryl-CoA
dehydrogenase; BCKDHA, 2-oxoisovalerate dehydrogenase E1 component
alpha subunit; DBT, 2-oxoisovalerate dehydrogenase E2 component
(dihydrolipoyl transacylase); echA, enoyl-CoA hydratase; HADH,
3-hydroxyacyl-CoA dehydrogenase; HIBCH, 3-hydroxyisobutyryl-CoA
hydrolase; IVD, isovaleryl-CoA dehydrogenase; mmsA,
malonate-semialdehyde dehydrogenase (acetylating); mmsB,
3-hydroxyisobutyrate dehydrogenase; vdh, valine dehydrogenase
(NAD+); vorA, 2-oxoisovalerate ferredoxin
oxidoreductase, alpha subunit; C5OH, hydroxyisovaleryl-carnitine;
C5, methylbutanoyl-carnitine; C3, propanoyl-carnitine. *P<0.05
vs. cells transfected with control siRNA. |
Discussion
Tumor suppressor gene PTEN deletion or mutation in
combination with other genetic alterations can recapitulate the
entire spectrum of human prostate cancer, from tumor initiation to
metastasis. Metabolic reprogramming induced by PTEN loss is one of
the key factors promoting prostate cancer tumorigenesis. The
altered metabolism of cancer cells can provide abundant biomaterial
and bioenergy for malignant proliferation and can confer a
selective advantage for the survival and proliferation of cancer in
the unique tumor microenvironment (22). Studies have demonstrated that
oncogenes and tumor suppressor genes can drive metabolic
reprogramming by regulating the expression or activity of metabolic
enzymes (13). It has been reported
that loss of PTEN promoted aerobic glycolysis in prostate
epithelial cells (17). In addition,
cells derived from PTEN transgenic mice revealed reduced glucose
and glutamine uptake and increased mitochondrial oxidative
phosphorylation (11). Compared with
previous studies, we demonstrated that loss of PTEN in prostate
cancer cells resulted in enhanced fatty acid de novo
synthesis and β-oxidation, and enhanced branched chain amino acid
catabolism in addition to enhanced glycolysis and glutaminolysis.
Thus, these metabolic characteristics may be new targets for
prostate cancer therapy.
The Warburg effect is one of the metabolic
characteristics of cancer cells, which exhibits high rates of
glycolysis with increased glucose consumption and lactate
production (7). Many metabolic
molecules are involved in the Warburg effect of
PTEN-deficiency-driven prostate tumorigenesis. Firstly, hexokinase
HK2, which catalyzes the essentially irreversible first step of the
glycolytic pathway, mediated the Warburg effect and malignant
growth of PTEN and p53 deficiency-driven prostate cancers. PTEN
loss increased HK2 mRNA translation through AKT/mTORC1/4EBP1
signaling (17). Secondly, fructose
2,6-bisphosphate (F2,6BP), the most potent allosteric activator of
the glycolytic enzyme phosphofructokinase-1 (PFK-1), promoted the
Warburg effect in PTEN-deficient cells. PTEN loss negatively
affected the activity of the E3 ligase APC/C-Cdh1, resulting in the
stabilization of the enzyme PFKFB3 and increased the synthesis of
its product F2,6BP2 (23).
Thirdly, PTEN loss resulted in the activation of the PI3K/Akt
pathway, which contributed to the phosphorylation of the enzyme
PFKFB2 and activation of the glycolytic enzyme
phosphofructokinase-2 (PFK-2) in prostate cancer LNCaP cells
(24). Finally, Akt activation
induced by PTEN deficiency promoted the expression of GluT1 on the
plasmamembrane and glycolysis in cancer cells (25). Therefore, PTEN loss enhanced glucose
uptake and glycolytic enzymatic activity, which promoted the
glycolysis pathway in cancer cells.
Cancer cells utilize glucose and glutamine as
primary carbon sources to feed mitochondrial intermediates for
biosynthetic precursors. The enhancement of the carbon flux through
glycolysis and glutaminolysis fulfills the energetic and
biosynthetic demands of cancer cells. In addition to glycolysis,
glutamonolysis is also enhanced in PTEN knockdown prostate cancer
cells. PTEN can reduce the protein level of glutaminase (GLS) which
is the first rate-limiting enzyme in the glutaminolysis pathway.
PTEN can promote the activity of the E3 ubiquitin ligase
anaphase-promoting complex/cyclosome-Cdh1 (APC/C-Cdh1), which
targets GLS for degradation (11).
Loss of PTEN stabilized glutaminase and promoted glutaminolysis in
prostate cancer cells.
Lipid metabolism reprogramming is a major
contributor to sustaining prostate cancer development (9). This lipid metabolism dysregulation is a
prominent feature that encompasses elevated de novo
lipogenesis including steroid-hormone biosynthesis as well as
β-oxidation of fatty acids (26).
Deficiency of PTEN and activation of PI3K/Akt can activate the
transcriptional factor SREBP1C, which in turn transcribes genes
involved in fatty acid and cholesterol biosynthesis (27). PTEN inhibits the synthesis of
long-chain saturated fatty acids by inhibiting the expression of
fatty acid synthase (FAS) in a lipid phosphatase-dependent manner
(10). PTEN deficiency was revealed
to play an important role in the overexpression of the FAS protein
and the enhancement of fatty acid de novo synthesis in
prostate cancer cells (10). It has
been reported that lipid production in prostate-specific
conditional PTEN−/− mice was enhanced compared with
wild-type mice. Furthermore, ATP-citrate lyase (ACLY), the first
rate-limiting enzyme involved in de novo lipogenesis, was
also revealed to be enhanced in prostate-specific conditional
PTEN−/− mice compared with wild-type mice (28). In addition, inactivation of pyruvate
dehydrogenase (PDHA1) can inhibit prostate cancer development and
block enhancement of lipid biosynthesis induced by PTEN loss
(28). Accordingly, our research also
discovered that fatty acid de novo synthesis was increased
in PTEN knockdown prostate cancer cells. Therefore, loss of PTEN in
prostate cancer cells resulted in enhancement of fatty acid de
novo synthesis and fatty acid β-oxidation.
The branched-chain amino acids (BCAAs) leucine,
isoleucine, and valine can be used for protein synthesis or
oxidized as a tumor energy supply. Branched-chain aminotransferase
1 (BCAT1), the enzyme involved in the first step of BCAA
catabolism, contributes to the metabolic reprogramming and
malignant proliferation of cancer cells (20). It has been reported that BCAT1 is a
target gene of c-Myc and induces the cell proliferation of
nasopharyngeal carcinoma (29). In
addition, microRNA-218 negatively regulated BCAT1 and inhibited the
growth of prostate cancer (30). Our
research revealed that the catabolism of branched-chain amino acids
was upregulated in PTEN-knockdown prostate cancer cells. Whether
the enhancement of BCAA catabolism is related to BCAT1 or related
to other molecular mechanisms still requires further
investigation.
In conclusion, in the present study, using
metabolomics analysis it was revealed that PTEN deficiency promoted
metabolic reprogramming by enhancing glycolysis, glutaminolysis,
fatty acid synthesis and β-oxidation, and branched-chain amino acid
catabolism in prostate cancer cells. The metabolic reprogramming
induced by PTEN loss provided biomaterials and bioenergy for the
proliferation of prostate cancer cells. This study implicates a
potential therapeutic target for prostate cancer cells with PTEN
mutation or deletion.
Acknowledgements
Not applicable.
Funding
This study was supported by Cancer Biology State Key
Laboratory (grant no. CBSKL2014Z09). This study was supported by
the National Natural Science Foundation of China (grant nos.
81672542, 81572504 and 81772745); the Natural Science Foundation of
Shaanxi Province (grant no. 2017SF-187).
Availability of data and materials
All data generated or analyzed during the present
study are included in this published article.
Authors' contributions
XZ and XY contributed to the research conception and
design. XX, JW and XS contributed to the data analysis and
interpretation. XAL, YG and XL contributed to the statistical
analysis. LS designed the study and wrote the manuscript. LY and HW
reviewed and edited the manuscript and were also involved in the
conception of the study. All authors approved the final
manuscript.
Ethics approval and consent to
participate
Not applicable.
Patient consent for publication
Not applicable.
Competing interests
The authors declare that they have no competing
interests.
References
|
1
|
Li J, Yen C, Liaw D, Podsypanina K, Bose
S, Wang SI, Puc J, Miliaresis C, Rodgers L, McCombie R, et al:
PTEN, a putative protein tyrosine phosphatase gene mutated in human
brain, breast, and prostate cancer. Science. 275:1943–1947. 1997.
View Article : Google Scholar : PubMed/NCBI
|
|
2
|
Wang S, Gao J, Lei Q, Rozengurt N,
Pritchard C, Jiao J, Thomas GV, Li G, Roy-Burman P, Nelson PS, et
al: Prostate-specific deletion of the murine Pten tumor suppressor
gene leads to metastatic prostate cancer. Cancer Cell. 4:209–221.
2003. View Article : Google Scholar : PubMed/NCBI
|
|
3
|
Majumder PK, Yeh JJ, George DJ, Febbo PG,
Kum J, Xue Q, Bikoff R, Ma H, Kantoff PW, Golub TR, et al: Prostate
intraepithelial neoplasia induced by prostate restricted Akt
activation: the MPAKT model. Proc Natl Acad Sci USA. 100:7841–7846.
2003. View Article : Google Scholar : PubMed/NCBI
|
|
4
|
Chang CJ, Mulholland DJ, Valamehr B,
Mosessian S, Sellers WR and Wu H: PTEN nuclear localization is
regulated by oxidative stress and mediates p53-dependent tumor
suppression. Mol Cell Biol. 28:3281–3289. 2008. View Article : Google Scholar : PubMed/NCBI
|
|
5
|
Freeman DJ, Li AG, Wei G, Li HH, Kertesz
N, Lesche R, Whale AD, Martinez-Diaz H, Rozengurt N, Cardiff RD, et
al: PTEN tumor suppressor regulates p53 protein levels and activity
through phosphatase-dependent and -independent mechanisms. Cancer
Cell. 3:117–130. 2003. View Article : Google Scholar : PubMed/NCBI
|
|
6
|
Vivanco I, Palaskas N, Tran C, Finn SP,
Getz G, Kennedy NJ, Jiao J, Rose J, Xie W, Loda M, et al:
Identification of the JNK signaling pathway as a functional target
of the tumor suppressor PTEN. Cancer Cell. 11:555–569. 2007.
View Article : Google Scholar : PubMed/NCBI
|
|
7
|
Warburg O: On respiratory impairment in
cancer cells. Science. 124:269–270. 1956.PubMed/NCBI
|
|
8
|
Schlaepfer IR, Rider L, Rodrigues LU,
Gijón MA, Pac CT, Romero L, Cimic A, Sirintrapun SJ, Glodé LM,
Eckel RH and Cramer SD: Lipid catabolism via CPT1 as a therapeutic
target for prostate cancer. Mol Cancer Ther. 13:2361–2371. 2014.
View Article : Google Scholar : PubMed/NCBI
|
|
9
|
Wu X, Daniels G, Lee P and Monaco ME:
Lipid metabolism in prostate cancer. Am J Clin Exp Urol. 2:111–120.
2014.PubMed/NCBI
|
|
10
|
Van de Sande T, De Schrijver E, Heyns W,
Verhoeven G and Swinnen JV: Role of the phosphatidylinositol
3′-kinase/PTEN/Akt kinase pathway in the overexpression of fatty
acid synthase in LNCaP prostate cancer cells. Cancer Res.
62:642–646. 2002.PubMed/NCBI
|
|
11
|
Garcia-Cao I, Song MS, Hobbs RM, Laurent
G, Giorgi C, de Boer VC, Anastasiou D, Ito K, Sasaki AT, Rameh L,
et al: Systemic elevation of PTEN induces a tumor-suppressive
metabolic state. Cell. 149:49–62. 2012. View Article : Google Scholar : PubMed/NCBI
|
|
12
|
Livak KJ and Schmittgen TD: Analysis of
relative gene expression data using real-time quantitative PCR and
the 2(-Delta Delta C(T)) method. Methods. 25:402–408. 2001.
View Article : Google Scholar : PubMed/NCBI
|
|
13
|
Hsu PP and Sabatini DM: Cancer cell
metabolism: Warburg and beyond. Cell. 134:703–707. 2008. View Article : Google Scholar : PubMed/NCBI
|
|
14
|
Kroemer G and Pouyssegur J: Tumor cell
metabolism: Cancer's Achilles' heel. Cancer Cell. 13:472–482. 2008.
View Article : Google Scholar : PubMed/NCBI
|
|
15
|
Shen L, Sun X, Fu Z, Yang G, Li J and Yao
L: The fundamental role of the p53 pathway in tumor metabolism and
its implication in tumor therapy. Clin Cancer Res. 18:1561–1567.
2012. View Article : Google Scholar : PubMed/NCBI
|
|
16
|
Toren P, Kim S, Johnson F and Zoubeidi A:
Combined AKT and MEK pathway blockade in pre-clinical models of
enzalutamide-resistant prostate cancer. PLoS One. 11:e01528612016.
View Article : Google Scholar : PubMed/NCBI
|
|
17
|
Wang L, Xiong H, Wu F, Zhang Y, Wang J,
Zhao L, Guo X, Chang LJ, Zhang Y, You MJ, et al: Hexokinase
2-mediated Warburg effect is required for PTEN- and
p53-deficiency-driven prostate cancer growth. Cell Rep.
8:1461–1474. 2014. View Article : Google Scholar : PubMed/NCBI
|
|
18
|
Kwabi-Addo B, Giri D, Schmidt K,
Podsypanina K, Parsons R, Greenberg N and Ittmann M:
Haploinsufficiency of the Pten tumor suppressor gene promotes
prostate cancer progression. Proc Natl Acad Sci USA.
98:11563–11568. 2001. View Article : Google Scholar : PubMed/NCBI
|
|
19
|
Fraser M, Zhao H, Luoto KR, Lundin C,
Coackley C, Chan N, Joshua AM, Bismar TA, Evans A, Helleday T and
Bristow RG: PTEN deletion in prostate cancer cells does not
associate with loss of RAD51 function: Implications for
radiotherapy and chemotherapy. Clin Cancer Res. 18:1015–1027. 2012.
View Article : Google Scholar : PubMed/NCBI
|
|
20
|
Tönjes M, Barbus S, Park YJ, Wang W,
Schlotter M, Lindroth AM, Pleier SV, Bai AHC, Karra D, Piro RM, et
al: BCAT1 promotes cell proliferation through amino acid catabolism
in gliomas carrying wild-type IDH1. Nat Med. 19:901–908. 2013.
View Article : Google Scholar : PubMed/NCBI
|
|
21
|
Billingsley KL, Park JM, Josan S, Hurd R,
Mayer D, Spielman-Sun E, Nishimura DG, Brooks JD and Spielman D:
The feasibility of assessing branched-chain amino acid metabolism
in cellular models of prostate cancer with hyperpolarized
[1-(13)C]-ketoisocaproate. Magn Reson Imaging. 32:791–795. 2014.
View Article : Google Scholar : PubMed/NCBI
|
|
22
|
Yue S, Li J, Lee SY, Lee HJ, Shao T, Song
B, Cheng L, Masterson TA, Liu X, Ratliff TL and Cheng JX:
Cholesteryl ester accumulation induced by PTEN loss and PI3K/AKT
activation underlies human prostate cancer aggressiveness. Cell
Metab. 19:393–406. 2014. View Article : Google Scholar : PubMed/NCBI
|
|
23
|
Cordero-Espinoza L and Hagen T: Increased
concentrations of fructose 2,6-bisphosphate contribute to the
Warburg effect in phosphatase and tensin homolog (PTEN)-deficient
cells. J Biol Chem. 288:36020–36028. 2013. View Article : Google Scholar : PubMed/NCBI
|
|
24
|
Moon JS, Jin WJ, Kwak JH, Kim HJ, Yun MJ,
Kim JW, Park SW and Kim KS: Androgen stimulates glycolysis for de
novo lipid synthesis by increasing the activities of hexokinase 2
and 6-phosphofructo-2-kinase/fructose-2,6-bisphosphatase 2 in
prostate cancer cells. Biochem J. 433:225–233. 2011. View Article : Google Scholar : PubMed/NCBI
|
|
25
|
Phadngam S, Castiglioni A, Ferraresi A,
Morani F, Follo C and Isidoro C: PTEN dephosphorylates AKT to
prevent the expression of GLUT1 on plasmamembrane and to limit
glucose consumption in cancer cells. Oncotarget. 7:84999–85020.
2016. View Article : Google Scholar : PubMed/NCBI
|
|
26
|
Butler LM, Centenera MM and Swinnen JV:
Androgen control of lipid metabolism in prostate cancer: Novel
insights and future applications. Endocr Relat Cancer.
23:R219–R227. 2016. View Article : Google Scholar : PubMed/NCBI
|
|
27
|
Horie Y, Suzuki A, Kataoka E, Sasaki T,
Hamada K, Sasaki J, Mizuno K, Hasegawa G, Kishimoto H, Iizuka M, et
al: Hepatocyte-specific Pten deficiency results in steatohepatitis
and hepatocellular carcinomas. J Clin Invest. 113:1774–1783. 2004.
View Article : Google Scholar : PubMed/NCBI
|
|
28
|
Chen J, Guccini I, Di Mitri D, Brina D,
Revandkar A, Sarti M, Pasquini E, Alajati A, Pinton S, Losa M, et
al: Compartmentalized activities of the pyruvate dehydrogenase
complex sustain lipogenesis in prostate cancer. Nat Genet.
50:219–228. 2018. View Article : Google Scholar : PubMed/NCBI
|
|
29
|
Zhou W, Feng X, Ren C, Jiang X, Liu W,
Huang W, Liu Z, Li Z, Zeng L, Wang L, et al: Over-expression of
BCAT1, a c-Myc target gene, induces cell proliferation, migration
and invasion in nasopharyngeal carcinoma. Mol Cancer. 12:532013.
View Article : Google Scholar : PubMed/NCBI
|
|
30
|
Zhu W, Shao Y and Peng Y: MicroRNA-218
inhibits tumor growth and increases chemosensitivity to CDDP
treatment by targeting BCAT1 in prostate cancer. Mol Carcinog.
56:1570–1577. 2017. View
Article : Google Scholar : PubMed/NCBI
|


